building the case for large scale behavioral education ... · alence like procedures. learners...
TRANSCRIPT

THE BEHAVIOR ANALYST TODAY VOL. 13, NO. 1, 2012 ISSN: 1555-7855
41
Working with school districts requires the ability to quick-ly adapt to the needs of each district and to provide as much useful information as possible to enable them to
make decisions. Districts feel most comfortable when they can review evidence of program effectiveness obtained from their own schools. Accordingly, it is necessary to be able to quick-ly respond to requests and to provide data that may not meet “gold standard” requirements, but that do help provide a basis for sound decision making. This article provides a case study of such an effort, and may help to elucidate how in-district data may be quickly generated and combined with other evidence to strengthen the case for program adoption.
The program being considered for a district-wide summer school adoption was Headsprout® Reading Comprehension (HRC). HRC is an online program designed to directly teach children how to comprehend text. It provides instruction in lit-eral, inferential, main idea, and derived word meaning compre-hension, as well a vocabulary instruction using stimulus–equiv-alence like procedures. Learners interact with the 50 episode (lesson) program for about 30 minutes a day. As with all Head-sprout programs, HRC underwent extensive user testing during the course of its development, more than 120 learners, one at a time, interacted with the various program segments, providing data on their effectiveness and occasions for revisions. HRC, first its components and then the entire program, was revised and retested until nearly all learners met criterion. As of this writ-ing, more than 35,000 online learners provided, and continue to provide, data for further evaluation and revision. An overview of HRC and its development can be found in Leon et al (2011). A detailed description is provided of the contingency analytic foundations of HRC by Layng, Sota, & Leon (2011), of the analy-sis that determined its content by Sota, Leon, and Layng (2011), and of the programming and testing of the repertoires and re-
lations involved by Leon, Layng, & Sota (2011). The methods Headsprout employs in the design, development, and testing of all its programs has been described by Layng, Twyman, & Stike-leather (2003), Twyman et al (2004), and Layng, Stikeleather, and Twyman (2006).
Program evaluation can be of two kinds, formative and sum-mative. In formative evaluation, criteria are established for learner performance. The program, or component thereof, is tested to determine if learners reach the specified criteria. If learner behavior does not meet those criteria, the program is re-vised and retested until nearly all criteria are met (Layng et al, 2006; Markle, 1967; Twyman et al, 2004). In summative evalua-tion, evidence is gathered after the program has been developed in an attempt to determine program effectiveness. Summative evaluation often employs pretest versus posttest comparisons or group comparisons of various types.
As noted by Layng et al (2006):
Whereas group designs, typically the basis for summative evaluation, are readily accepted as providing scientific evi-dence for program effectiveness, single subject designs typi-cally form the basis for formative evaluation. While both group and single subject designs are descended from highly successful scientific traditions, and both may provide equal-ly rigorous and informative results, single subject design is relatively less understood. Both do, however, differ in the questions asked; one asks about the behavior of groups, the other asks about the behavior of individuals.
Layng et al (2006) go on to describe a 3 X 3 matrix that il-lustrates the relation between evidence types found in both for-mative and summative evaluation, and the results of their inter-section. See Table. The columns comprise types of summative evaluation, and the rows types of formative evaluation. For sum-mative evaluation, the columns are: A. Experiential Assessment, B. Evidence-Based Assessment, and C. Scientific Control Group Research & Assessment. For formative evaluation the rows are:
Building the Case for Large Scale Behavioral Education AdoptionsZachary R. Layng & T. V. Joe LayngMimio–Headsprout
AbstractBehaviorally-designed educational programs are often based on a research tradition that is not widely understood by potential users of the programs. Though the data may be sound and the prediction of outcomes for individual learners quite good, those advocating adoption of behaviorally-designed educational programs may need to do more in order to convince school districts to adopt large-scale implementations of their programs. This article provides an example of a successful approach that suggests quickly gathering local evidence using more familiar evidence-based and experiential methods may increase the likelihood of program adoption. The actual report to the large urban district is included.
Keywordssummative, formative, evidence, pilot programs
The authors would like to thank Melinda Sota for her critical comments and editorial contribution.

42 LAYNG & LAYNG
duration efforts, often a pilot program that falls into columns one and two of the 3 X 3 matrix, can be used to suggest the potential effectiveness of an educational product in a particular setting. When such data are obtained with a program that has gone through a scientific formative development process, even more confidence may be warranted than would otherwise be provided by either formative or summative data alone. When experiential and evidence based information confirms the sci-entific program development data (e.g., Twyman, Layng, & Layng, 2011), potential purchasers feel even more comfortable making large purchase decisions. When those data come from their own schools, the comfort is even greater. This report de-scribes an effort to rapidly provide a major school district with data from Columns A & B (experiential and evidence based data), which could be used to augment that obtained from Row 3 (scientific program development). Though edited for reasons of confidentiality, the report below is essentially what was pro-vided to district decision makers.
1. Experiential– Program Development, 2. Evidence Based– Program Development, and 3. Scientific– Program Develop-ment. The intersection of each cell describes the implications for programmatic decision–making.
Since HRC was developed within a rigorous scientific devel-opment process (see Twyman et al, 2004) we are able to predict group performance based on individual performance (see Ta-ble, Row 3). For example, Layng, Twyman & Stikeleather (2004) were able to show that data obtained from single subject re-search in the Headsprout laboratory were nearly identical to the data obtained for about 32,000 learners accessing the program over the Internet in uncontrolled settings. Accordingly, any ad-ditional summative data augments the laboratory research and development outcomes and can contribute to district decision making by supplying locally derived data even though the data fall short of the summative evaluation gold standard of using randomized control group comparisons. Whereas, highly con-trolled scientific summative evaluation can be time consum-ing, difficult to implement with fidelity, and expensive, shorter
Table. 3X3 Matrix. The level of rigor for each type of evaluation is indicated by the letters A – C for summative evaluation, with column C representing the most rigorous; the numbers 1– 3 indicate the level of rigor for each type of formative evaluation, with row 3 representing the most rigorous. Cell 3–C represents the most rigorous intersection of formative & summative evaluation.
Approaches to Summative Evaluation: Basis for Outcomes Assessment
Approaches to Formative Evaluation: Basis for Program Revision
A. Experiential – Assessment B. Evidence Based – Assessment C. Scientific – Controlled Group Research & Assessment
1. Experiential – Program Development
Cannot predict group or individual performance.
Works or not with groups or individuals purely subjective; a matter of opinion; argued on point of view –a matter of social agreement
Provides some indication that the program may be effective with a group; but
Cannot confidently predict group or individual performance.
Can confidently predict group performance, but
Cannot predict individual’s performance (Sidman, 1960).
If works or not, not clear what program elements, alone or together are responsible.
2. Evidence Based – Program Development
If limited tryouts, may indicate that the program might work with those tested; but
Cannot confidently predict group or individual performance.
Still primarily a matter of social agreement, but has some validity by relation to past research and perhaps limited tryouts.
Provides some indication that the program may be effective with a group; but
Cannot confidently predict group or individual performance.
If works, not really clear why, if it does not work, can lead to re-evaluation of principles or the way they were applied. Not clear where the problem is.
Can confidently predict group performance; but
Cannot confidently predict individual’s performance.
If works or not, not clear what program elements, alone or together are responsible, but can lead to reconsideration of principles or the way they were applied.
3. Scientific – Program Development
Able to predict group performance based on individual performance; and
Can confidently predict individual’s performance.
Since program able to predict individual’s performance, some prediction of group performance implied; may have some validity by relation to past research.
Able to predict group performance based on individual performance; and
Can confidently predict individual’s performance.
If doesn’t work, issues are in transfer, --able to identify and isolate variables to change and revise for retest. Individual data not lost and can be analyzed in relation to outcome
Can confidently predict group performance; and
Can confidently predict individual’s performance.
If doesn’t work, issues are in differences in formative criteria & summative measurement instruments – able to identify and isolate variables to change and revise criteria & program for retest, or to revise summative measurement instruments. Individual data not lost and can be analyzed in relation to outcome.
43BUILDING THE CASE FOR LARGE SCALE BEHAVIORAL EDUCATION ADOPTIONS
termined by a measure of their oral reading fluency on a passage leveled at DRA Level 28.
To estimate the effectiveness of Headsprout Reading Com-prehension, students completed pre and posttests. The pretest included comprehension questions following a short passage, questions on “resources” including maps and tables of contents, and vocabulary items. The grade level of the pretest passage and questions was 2.8 (See Appendix A). After the six-week peri-od, students were given a posttest. This posttest included two long-passage sections from third-grade and fourth-grade state sample Booklets, an alternate form of the resources section of the pretest, and vocabulary items. The state sample tests were chosen to estimate grade levels 3.6 (the third-grade test) and 4.6 (the fourth-grade test). The pretest was administered over approximately 30 minutes. The posttest was administered over approximately one hour.
� RESULTSOver the six-week period, students engaged with the program on 24 days. The class completed an average of 29.7 episodes. The median episode was 29 for the 50-episode program. For all statistical analyses, only data from the 22 students for whom there are both posttest and pretest data, and who qualified on the first day of the pilot for Reading Comprehension are used. Those 22 students completed an average of 33.4 episodes. The median episode was 32. (See Figure 2).
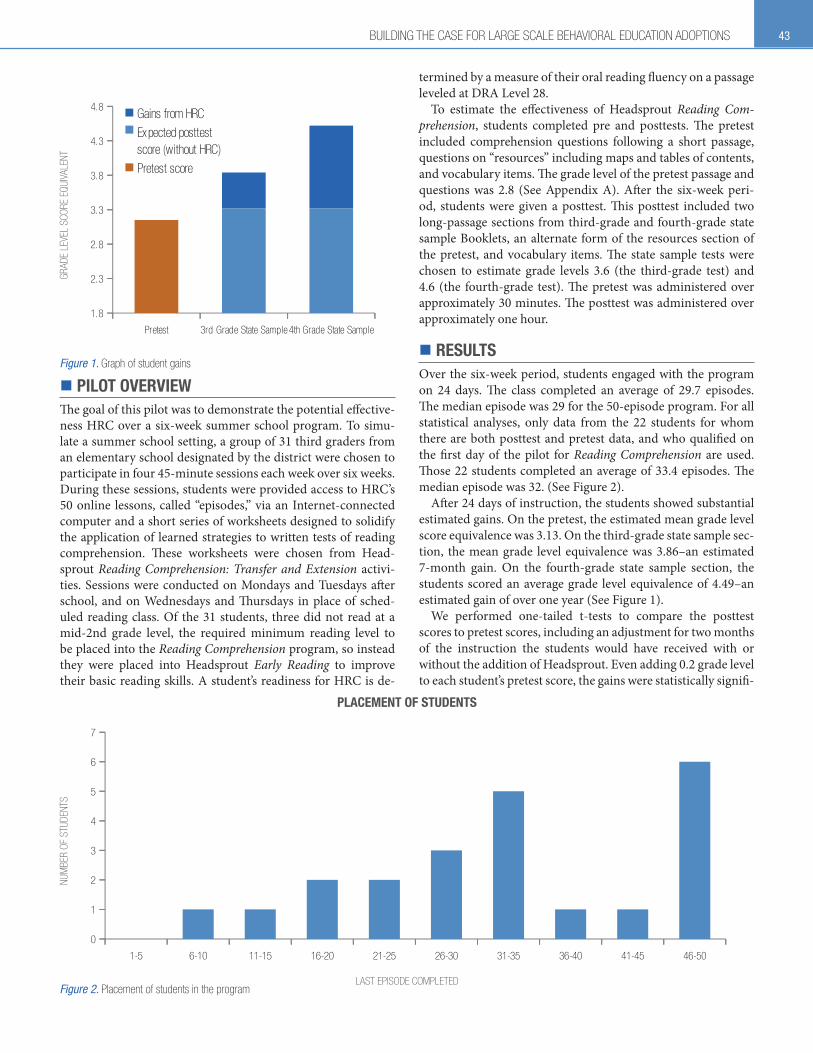
After 24 days of instruction, the students showed substantial estimated gains. On the pretest, the estimated mean grade level score equivalence was 3.13. On the third-grade state sample sec-tion, the mean grade level equivalence was 3.86–an estimated 7-month gain. On the fourth-grade state sample section, the students scored an average grade level equivalence of 4.49–an estimated gain of over one year (See Figure 1).
We performed one-tailed t-tests to compare the posttest scores to pretest scores, including an adjustment for two months of the instruction the students would have received with or without the addition of Headsprout. Even adding 0.2 grade level to each student’s pretest score, the gains were statistically signifi-
� PILOT OVERVIEWThe goal of this pilot was to demonstrate the potential effective-ness HRC over a six-week summer school program. To simu-late a summer school setting, a group of 31 third graders from an elementary school designated by the district were chosen to participate in four 45-minute sessions each week over six weeks. During these sessions, students were provided access to HRC’s 50 online lessons, called “episodes,” via an Internet-connected computer and a short series of worksheets designed to solidify the application of learned strategies to written tests of reading comprehension. These worksheets were chosen from Head-sprout Reading Comprehension: Transfer and Extension activi-ties. Sessions were conducted on Mondays and Tuesdays after school, and on Wednesdays and Thursdays in place of sched-uled reading class. Of the 31 students, three did not read at a mid-2nd grade level, the required minimum reading level to be placed into the Reading Comprehension program, so instead they were placed into Headsprout Early Reading to improve their basic reading skills. A student’s readiness for HRC is de-
Pretest 3rd Grade State Sample4th Grade State Sample
1.8
2.3
2.8
3.3
3.8
4.3
4.8Gains from HRC
Expected posttest score (without HRC)
Pretest score
Figure 1. Graph of student gains
GRAD
E LE
VEL
SCOR
E EQ
UIVA
LENT
1-5 6-10 11-15 16-20 21-25 26-30 31-35 36-40 41-45 46-50
0
1
2
3
4
5
6
7
Figure 2. Placement of students in the program
NUM
BER
OF S
TUDE
NTS
LAST EPISODE COMPLETED
PLACEMENT OF STUDENTS

44 LAYNG & LAYNG
The students averaged a 30% increase in score on the vo-cabulary section. A directional Mann-Whitney test determined that the 30% increase in vocabulary scores was also significant (p<.05). The vocabulary tested was the same from pretest to posttest.
While scores improved on the “using resources” section, the gains were not shown to be significant (onetailed, p>.05). We believe this is due to discrepancies between testing conditions; the resources section was conducted during the last 10 minutes of an hour-long posttest session, when classroom interruption and distractions were at the highest frequency.
� TEACHER AND STUDENT FEEDBACKThere were significant challenges posed by a frequent rotation of homeroom instructors; however, the class’s reading teacher, who was the learners’ homeroom teacher the previous school year, was a consistent presence and instructed the students dur-ing the two daytime sessions.
The primary benefit of HRC, according to the teacher was a dramatic increase in academic confidence in her students. She provided the insight that students not only feel that they are answering questions correctly, but know why and how they are successful. “When [students are successful], they know that they earned it,” she said.
Having taught the same students for over a year, she knows the students very well. She noted that one of her “quiet voices” in the class would always rub his ear when nervous and facing a challenging problem. In one instance, she asked him to tell her the answer to a comprehension story question, which he suc-cessfully did. She then challenged him, asking, “Why is that the answer?” To her surprise, this student calmly, confidently pro-vided her with the precise strategy for answering the question and explained how he applied it. When volunteering this story, Ms. Brown said, “I was proud to see that in [him].”
� REFLECTIONSIt has been an absolute pleasure working with the instructors and staff at the school, and an even greater pleasure working with the students as they progressed through the program. When a handful of students began approaching the last few epi-sodes, they began asking what they would do next. They were told that they could read just about anything, including news-papers, articles, or poetry. Two days later, one student seemed in a particular hurry to finish the last two episodes and was asked why she was rushing through. She stated, evidently remember-ing the previous conversation, “I want to finish so I can under-stand poetry. Will you bring some for me?”
Her ambition is not isolated. On the Monday following the end of the pilot, the students who finished all 50 episodes unan-imously and without prompting asked if they could “use the online dictionary to look up new words.” They seemed just as excited to instead work in groups of two and three on short-passage story questions from Headsprout Reading Comprehen-sion: Transfer and Extension.
cant for both third-grade state sample-section results (p<.01) and fourth-grade state sample-section results (p<.01).
One question that immediately arises is: how can the same stu-dents perform at a grade level of 3.86 and minutes later achieve a grade level of 4.49? We believe that our observations from the posttest can account for this difference. During the third-grade section of the exam many students were observed attempting to answer the questions quickly, sometimes neglecting the care-ful application of the strategies learned in Headsprout Reading Comprehension. When students attempted the fourth-grade section, however, students were observed frequently referring back to the passage (a primary strategy), using their fingers to guide careful reading of all answer choices, and even writing next to each question which of the four comprehension strate-gies applied to each question (See Figure 3).
We believe that the challenge of the mid-fourth grade mate-rial prompted the students to apply the strategies more consis-tently. This is evidenced in the data showing that students who scored the lowest on the pretest had equivalent posttest scores to those students who scored the highest on the pretest, outper-forming the students in the middle quartiles. We believe that the students who scored the lowest on the pretest applied the Headsprout Reading Comprehension strategies to both sections equally, the highest achieving students tended to perform well as a rule, while the students in the middle quartiles only felt it necessary to apply the strategies only to the more challenging sections.
Figure 3. Example of student work on the fourth-grade level posttest section
� KEYFF FIND FACT
CW CLUE WORD

45BUILDING THE CASE FOR LARGE SCALE BEHAVIORAL EDUCATION ADOPTIONS
Layng, T. V. J., Twyman, J. S., & Stikeleather, G. (2003). Headsprout Early Reading: Reliably teaching children to read. Behavioral Technology Today, 3, 7-20.
Layng, T. V. J., Twyman, J. S., & Stikeleather, G. (2004). Engineering discovery learn-ing: The contingency adduction of some precursors of textual responding. The Analysis of Verbal Behavior, 20, 99–109.
Layng, T. V. J., Sota, M., & Leon, M. (2011). Thinking through text comprehension I: Foundation and guiding relations. The Behavior Analyst Today, 12, 1-10.
Leon, M, Ford, V., Shimizu,H., Stretz, A., Thompson, J., Sota, M., Twyman, J. S. and Layng, T. V. J. (2011). Comprehension by design: Teaching young learners to comprehend what they read. Performance Improvement Journal, 50, 40–47.
Leon, M., Layng, T. V. J., & Sota, M. (2011). Thinking through text comprehension III: The programing of verbal and investigative repertoires. The Behavior Analyst Today, 12, 11-20.
Markle, S. M. (1967). Empirical testing of programs. In P. C. Lange (Ed.), Programmed instruction: Sixty–sixth yearbook of the National Society for the Study of Education: 2 (pp. 104-138). Chicago: University of Chicago Press.
Sidman, M. (1960). Tactics of scientific research. Oxford England: Basic Books.
Sota, M., Leon, M., & Layng, T. V. J. (2011). Thinking through text comprehension II: Analysis of verbal and investigative repertoires. The Behavior Analyst Today, 12, 21-33.
Twyman, J. S., Layng, T. V. J., Stikeleather, G. & Hobbins, K. (2004). A Non-linear approach to curriculum design: The role of behavior analysis in building an effec-tive reading program. In: W. L. Heward et al. (Eds.), Focus on behavior analysis in education, Vol. 3. Upper Saddle River, NJ: Merrill/Prentice Hall.
Twyman, J. S., Layng, T. V. J., & Layng, Z. R. (2011). The likelihood of instruction-ally beneficial, trivial, or negative results for kindergarten and first grade learners who partially complete Headsprout® Early Reading. Behavior Technology Today, 6, 1–19.
� AUTHOR CONTACT INFORMATION
ZACHARY LAYNG
840 W. Wrightwood Ave.Chicago, IL. 60614(206) [email protected]
T.V. JOE LAYNG
4705 S Dakota St.Seattle, WA 98118(206) [email protected]
� CHALLENGES TO IMPLEMENTATIONOn the first day of the pilot, the homeroom teacher trained to use Headsprout Reading Comprehension with her class was in-jured and unable to return to work for the entirety of the pilot. During her absence, a series of temporary substitute teachers and two long-term substitute teachers rotated through the class-room. Each was trained in Headsprout Reading Comprehension within 1-2 days of Mimio–Headsprout being notified, but the gaps in the instructional support were significant, with over half of the pilot being unsupervised by a trained teaching profes-sional. In many cases, the volunteer computer-lab manager was the only support for Headsprout after school.
For two weeks in January, students were unable to access the computer lab due to school-wide computerized testing, and had only two after-school sessions each week. Additionally, the pi-lot was interrupted by the two-week holiday break. A number of students were provided with resets to previous episodes, the typical intervention for below-average episode performance.
� CONCLUSIONThe report has been well received, and as of this writing HRC is in the final round of consideration for district–wide imple-mentation. Though not meeting a “gold standard” for summa-tive research, estimates of likely outcomes, combined with see-ing and talking with learners, teachers, and the principals can be extraordinarily important to districts making decisions as to whether or not to make large investments in behaviorally-based programs. This process has been replicated elsewhere and the program is seeing adoption by districts throughout the country. Behaviorally-based educational programs that have been pains-takingly developed through careful control–analysis prepara-tions may find that purchasing decisions may be more affected by locally derived experiential and evidence-based outcomes than by the more rigorous single-subject research. While we do not advocate making decisions only on the basis of column A. Experiential – Assessment or column B. Evidence-Based As-sessment, they can be useful when combined with row C de-velopment.
� REFERENCESLayng, T. V. J., Stikeleather, G. & Twyman, J. S. (2006). Scientific formative evaluation:
The role of individual learners in generating and predicting successful educational outcomes In: Subotnik, R. & Walberg, H. (Eds.) The scientific basis of educational productivity, Charlotte, NC: Information Age Publishing.

46 LAYNG & LAYNG
APPENDIX AEXAMPLE OF STUDENT WORK ON THE FIRST PAGE OF THE PRETEST

47BUILDING THE CASE FOR LARGE SCALE BEHAVIORAL EDUCATION ADOPTIONS
APPENDIX BFINAL PERFORMANCE REPORT FOR HEADSPROUT READING COMPREHENSION STORY QUESTIONS
KEY--: Indicates that performance data is not available for this episode.
NA: Indicates that instructional activities in the episode did not include story questions (episodes 3,4 and 8).
Red Date: Indicates an episode has not been completed in 14 or more days.
“N” (needs practice): Indicates that the student answered fewer than 50% of the story questions correctly the first time they were attempted.
“S” (satisfactory): Indicates that the student answered between 50% and 74% of the story questions correctly the first time they were attempted.
“E” (excellent): Indicates that the student answered 75% or more of the story questions correctly the first time they were attempted.
Italics: Indicates a repeated episode. If an episode is repeated, the most recent data are shown. Scores are not replaced or updated until the student completes the episode again.