supplement of photochemical age of air pollutants, ozone ... · (rh), and precipitation during the...
TRANSCRIPT

Supplement of Atmos. Chem. Phys., 16, 4555–4568, 2016http://www.atmos-chem-phys.net/16/4555/2016/doi:10.5194/acp-16-4555-2016-supplement© Author(s) 2016. CC Attribution 3.0 License.
Supplement of
Photochemical age of air pollutants, ozone, and secondary organic aerosolin transboundary air observed on Fukue Island, Nagasaki, Japan
Satoshi Irei et al.
Correspondence to:Satoshi Irei ([email protected])
The copyright of individual parts of the supplement might differ from the CC-BY 3.0 licence.

S2
Figure S-1. Time-series plots of hourly average ambient temperature, relative humidity
(RH), and precipitation during the field study.
Figure S-2. Polar plot of the dependence of hourly average wind speed (radial axis in m
s-1) on wind direction (degrees) observed at the Fukue monitoring station (north = 0
degrees, east = 90 degrees).

S3
Figure S-3. Temporal variation of concentration of organic species and fraction due to m/z
44, f44, in the mass spectra of organic species measured by quadrupole aerosol mass
spectrometry.
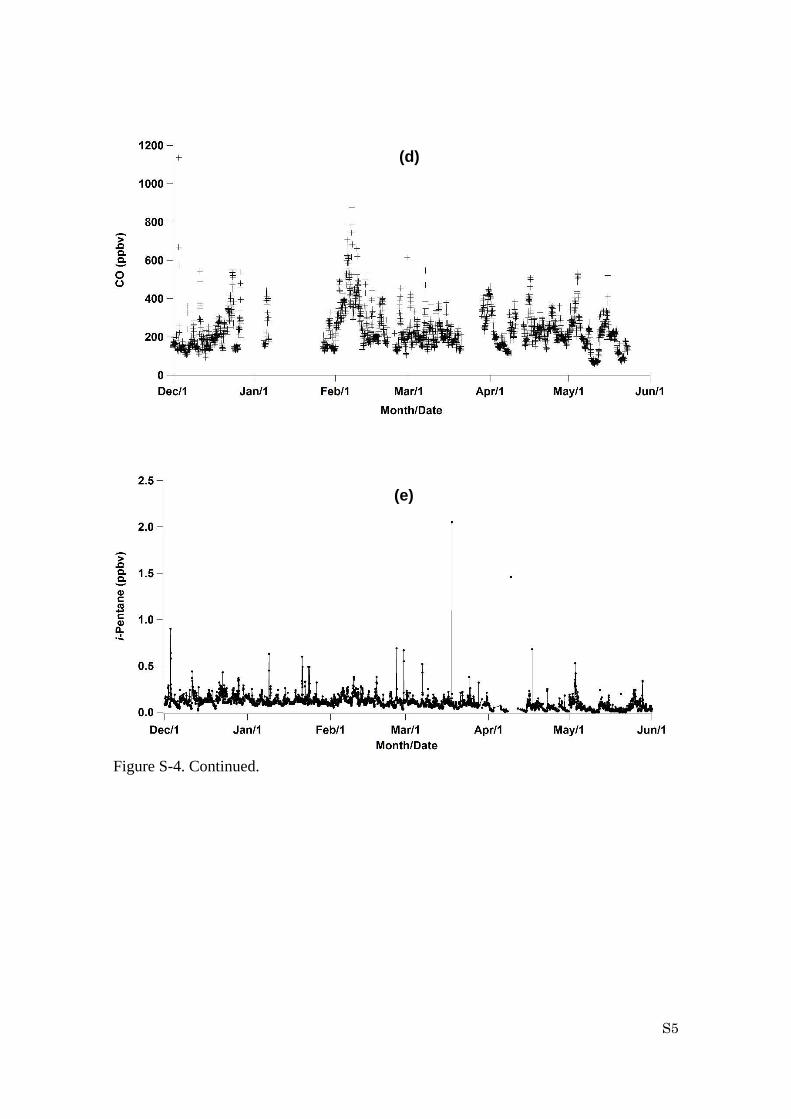
Figure S-4. Temporal variation of hourly average mixing ratios for (a) O3, (b) NOx, (c)
NOy, (d) CO, (e) i-pentane, (f) toluene, and (g) ethyne.
(a)

S4
Figure S-4. Continued.
(b)
(c)
S5
Figure S-4. Continued.
(d)
(e)

S6
Figure S-4. Continued.
(f)
(g)

S7
Figure S-5. Back trajectories of air masses arriving at Fukue during the low mixing ratio
episode of ozone (May 9 to 11).

S8
Figure S-6. Wind-sector dependence (north = 0 degrees, east = 90 degrees) of CO mixing
ratio (the radial axis in ppbv).
Table S-1. Observations of chemical species concentration rise during the seven
primary emission episodes indicated by CO mixing ratioa
episode 1 episode 2 episode 3 episode 4 episode 5 episode 6 episode 7
beginningb 12/21 18:00 2/1 1:00 3/28 20:00 4/15 5:00 4/24 6:00 5/1 4:00 5/12 9:00
endb 12/24 7:00 2/11 10:00 4/2 13:00 4/17 1:00 4/25 16:00 5/6 4:00 5/19 17:00
particulate SO4 n/ac ✓ ✓ ✓ ✓
particulate Org n/ac ✓ ✓ ✓
particulate NO3 ✓ n/ac ✓ ✓
particulate NH4 ✓ n/ac ✓ ✓ ✓
NOx ✓ ✓ ✓
NOy ✓ ✓ ✓ ✓ ✓ ✓
O3 ✓ ✓ ✓ ✓d ✓
ethylene ✓ ✓ ✓ ✓ ✓ ✓
benzene ✓ ✓ ✓ ✓ ✓ ✓ ✓
toluene ✓ ✓ ✓ ✓ ✓ ✓ aA check mark indicates confirmation of concentration rises. bTime is in local time. cn/a
indicates no data available during the episode. dDiurnal variation was observed.

S9
Figure S-7. 48h back trajectories of air masses during the episode 1. See Table S-1 for the
detail of episode period.

S10
Figure S-8. 48h back trajectories of air masses during the episode 2. See Table S-1 for the
detail of episode period.

S11
Figure S-9. 48h back trajectories of air masses during the episode 3. See Table S-1 for the
detail of episode period.

S12
Figure S-10. 48h back trajectories of air masses during the episode 4. See Table S-1 for
the detail of episode period.

S13
Figure S-11. 48h back trajectories of air masses during the episode 5. See Table S-1 for
the detail of episode period.

S14
Figure S-12. 48h back trajectories of air masses during the episode 6. See Table S-1 for
the detail of episode period.

S15
Figure S-13. 48h back trajectories of air masses during the episode 7. See Table S-1 for
the detail of episode period.

S16
Figure S-14. Scatter plot of hourly averaged m/z 44 concentrations of organics as function
of hourly averaged m/z 43 concentrations of organics.
Figure S-15. Extracted mass spectra from two-factorial PMF analysis on organic aerosol
mass spectra obtained from January 8 to February 2, 2011: top (orange), mass spectra
identified as semi-volatile oxygenated organic aerosol (SV-OOA); bottom (green), mass
spectra identified as low-volatile oxygenated organic aerosol (LV-OOA).

S17
Figure S-16. Scatter plot of t[OH] estimated by NOx/NOy clock and toluene/ethyne clock.