building resilient infrastructure - australian business...
TRANSCRIPT

Building resilient infrastructure
Australian Business Roundtable for Disaster Resilience & Safer Communities
About the Australian Business Roundtable for Disaster Resilience & Safer Communities
The Australian Business Roundtable for Disaster Resilience & Safer Communities was formed in December 2012 by the chief executive officers (CEOs) of Australian Red Cross, Insurance Australia Group (IAG), Investa Property Group, Munich Re, Optus and Westpac Group.
Following the unprecedented number of floods, storms and bushfires that have devastated life and property across Australia in recent years, the respective CEOs of the above organisations – Mr Robert Tickner, Mr Mike Wilkins, Mr Scott MacDonald, Mr Heinrich Eder, Mr Kevin Russell and Mrs Gail Kelly – created the Roundtable, believing it was of national importance to build resilient communities able to adapt to extreme weather events.*
In 2013, Deloitte Access Economics was commissioned to prepare the report Building our Nation’s Resilience to Natural Disasters in response to the call in the Australian Government’s 2011 National Strategy for Disaster Resilience for greater collaboration between governments, businesses and communities to reduce the nation’s vulnerability to natural disasters.
In 2014, the Roundtable released a second report, Building an Open Platform for Natural Disaster Resilience Decisions, which emphasised the need for communities, businesses and governments to have access to the latest research and accurate data to ensure safety from and resilience to natural disasters.
This new report, along with a second report, The Economic Cost of the Social Impact of Natural Disasters, builds on the reports from 2013 and 2014 by assessing the economic cost of the social impacts of Australia’s natural disasters and the planning and approval process for new infrastructure.
* Current CEOs: Mr Noel Clement, (Director of Australian Services), Australian Red Cross; Mr Peter Harmer, IAG; Mr Jonathan Callaghan, Investa Property Group; Mr Heinrich Eder, Munich Re; Mr Paul O’Sullivan (Chairman), Optus; Mr Brian Hartzer, Westpac Group.
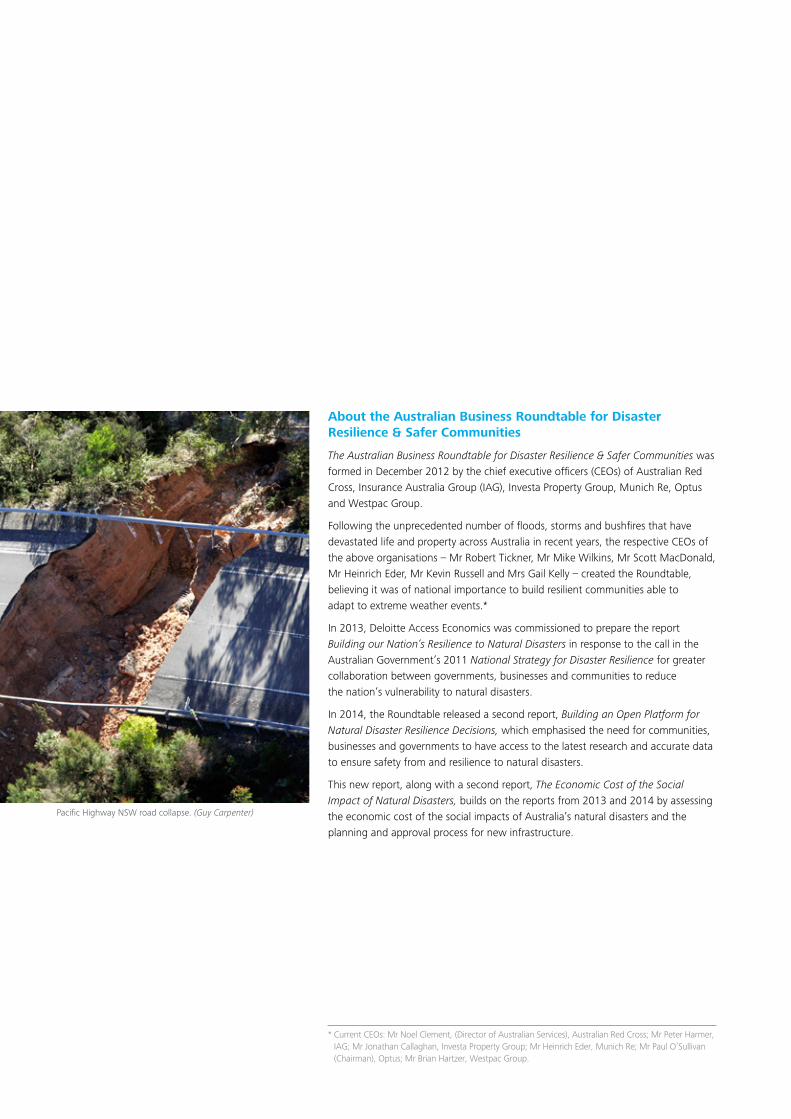
Pacific Highway NSW road collapse. (Guy Carpenter)

Building resilient infrastructure March 2016 1
Cover image: Pacific Highway NSW road collapse. East Coast Lows often bring strong winds and intense rainfall to the coasts of southern Queensland, New South Wales and eastern Victoria. They are a persistent risk when climatic conditions are favorable for their formation. The June 2007 event brought winds of up to 125 kmph (80 mph) to New South Wales, while the accompanying heavy rain caused widespread flooding in the Hunter Region and flashflooding in the city of Newcastle. As a result of the storms, thousands of people were forced to evacuate their properties and more than 200,000 homes lost power. More than 90,000 insurance claims were filed at an estimated cost of A$1.35bn, making the event the eighth most expensive in Australia’s history. (Guy Carpenter)

2
This report looks at the costs of repairing and replacing critical infrastructure and what should be done to ensure infrastructure is more resilient to bushfires, floods, storms, cyclones and other natural disasters.
This is the third report prepared for the Australian Business Roundtable for Disaster Resilience & Safer Communities by Deloitte Access Economics.
The Roundtable’s first report, released in 2013, looked at the financial costs of extreme weather events in Australia and the dramatic growth in anticipated costs to 2050. We found that carefully targeted investment in resilience measures now will reduce Australian Government expenditure on natural disaster relief and recovery by more than 50% by 2050. We also found that in 2015 the total economic cost of natural disaster events in Australia exceeded $9 billion, or about 0.6% of gross domestic product. These costs are expected to rise to an average of $33 billion per year by 2050*.
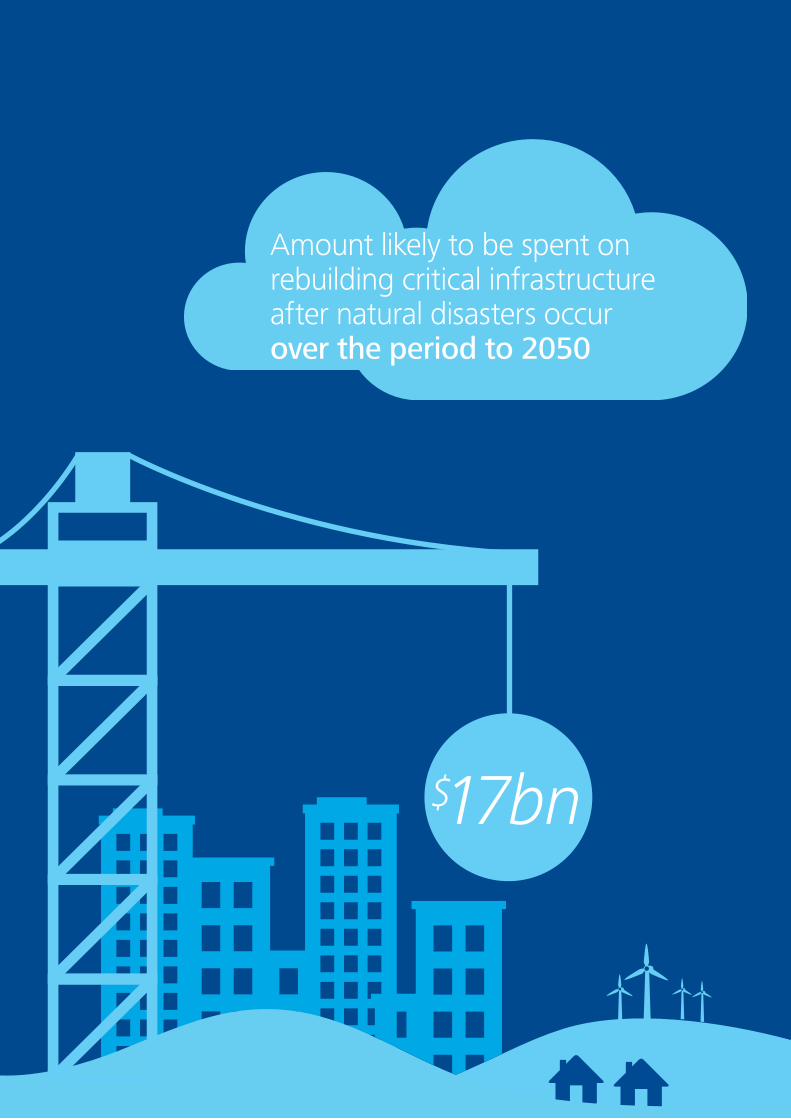
Between 2002-03 and 2010-11, more than $450 million was spent each year by Australian governments to restore critical infrastructure after extreme weather events. This equates to about 1.6% of total public infrastructure spending. In addition, it is estimated that $17 billion (in net present value terms) will be needed to directly replace critical infrastructure between 2015 and 2050 due to the impact of natural disasters.
A total of $1.1 trillion will be spent on critical infrastructure between now and 2050. Resilient infrastructure will play a crucial role in helping communities to withstand, respond to and recover from the potentially devastating impact of natural disasters in Australia.
Despite this, the report finds only limited reference to resilience in the cost-benefit analysis guidelines applicable to infrastructure project appraisals. It is concerning that there is currently no requirement for government or the private sector to consider resilience when making investment decisions, nor are there best practice principles to encourage its consideration.
CEO statement
Critical infrastructure is highly vulnerable to, and a major casualty of, natural disasters. Repairing or replacing infrastructure assets after a disaster is often difficult and costly, which can exacerbate the suffering of affected communities.
Building resilient infrastructure March 2016 3
Embedding resilience into the planning process for critical infrastructure could prevent unnecessary disruption and generate significant reductions in disaster costs.
This report makes a strong case for greater consideration of, and investment in, resilience. It is not just governments that need to consider resilience in infrastructure planning but the private sector too. Both can reduce disaster-related costs by following guidance and principles for infrastructure resilience planning and by incorporating these into their long-term operations.
This report joins calls from the Productivity Commission and Infrastructure Australia to improve the resilience of infrastructure assets. Mitigating disaster risk should be a priority for both existing and future assets. This report offers guidance and principles for infrastructure planners and decision makers to embed resilience in their projects.
We urge the Australian Government to take the lead and ensure disaster resilience is considered in the cost benefit criteria for all public infrastructure funding decisions.
Further, we urge all levels of government and industry to embed disaster resilience into the planning, design, funding and delivery of infrastructure projects.
Improving the resilience of our infrastructure assets will reduce the costs and impact of natural disasters and lead to a safer and more resilient Australia. As such, it should be a priority for governments, communities and the private sector.
*The Economic Cost of the Social Impact of Natural Disasters (2016)
Noel Clement Director of Australian Services Australian Red Cross
Peter Harmer Managing Director and CEO IAG
Jonathan Callaghan CEO Investa Property Group
Heinrich Eder Managing Director Munich Holdings of Australasia Pty Ltd
Paul O’Sullivan Chairman Optus
Brian Hartzer Managing Director and CEO Westpac Group
Building resilient infrastructure March 2016 3
Embedding resilience into the planning process for critical infrastructure could prevent unnecessary disruption and generate significant reductions in disaster costs.
This report makes a strong case for greater consideration of, and investment in, resilience. It is not just governments that need to consider resilience in infrastructure planning but the private sector too. Both can reduce disaster-related costs by following guidance and principles for infrastructure resilience planning and by incorporating these into their long-term operations.
This report joins calls from the Productivity Commission and Infrastructure Australia to improve the resilience of infrastructure assets. Mitigating disaster risk should be a priority for both existing and future assets. This report offers guidance and principles for infrastructure planners and decision makers to embed resilience in their projects.
We urge the Australian Government to take the lead and ensure disaster resilience is considered in the cost benefit criteria for all public infrastructure funding decisions.
Further, we urge all levels of government and industry to embed disaster resilience into the planning, design, funding and delivery of infrastructure projects.
Improving the resilience of our infrastructure assets will reduce the costs and impact of natural disasters and lead to a safer and more resilient Australia. As such, it should be a priority for governments, communities and the private sector.
*(ABR: The Economic Cost of the Social Impact of Natural Disasters, 2016)
Noel Clement Director of Australian Services Australian Red Cross
Peter Harmer Managing Director and CEO IAG
Jonathan Callaghan CEO Investa Property Group
Heinrich Eder Managing Director Munich Holdings of Australasia Pty Ltd
Paul O’Sullivan Chairman Optus
Brian Hartzer Managing Director and CEO Westpac Group


Contents
Glossary 6Acronyms 7Companion reports commissioned by the Australian Business Roundtable for Disaster Resilience & Safer Communities 8Executive summary 101. Introduction 17 1.1 Background 19 1.2 Structure of the report 222. Infrastructure investment – planning for resilience 25 2.1 Infrastructure investment in Australia 25 2.2 The decision-making process 27 2.3 Resilience in government policy and investment decisions 303. The economic case for change – infrastructure projects 43 3.1 Electricity lines in Victoria 44 3.2 Emile Serisier Bridge in New South Wales 53 3.3 Communications infrastructure in Queensland 57 3.4 Summary 614. The economic case for change –
national infrastructure investment 63 4.1 Approach 63 4.2 Infrastructure investment 63 4.3 Infrastructure rebuilding costs following natural disasters 64 4.4 Summary 665. Practical guidance for decision-makers 69 5.1 Guidance for practitioners 71 5.2 Principles for infrastructure planning 746. Recommendations 79
References 82Appendix A: Companion reports 87Appendix B: Productivity Commission Inquiry into
National Disaster Funding 98Appendix C: Electricity transmission lines case study –
background data and information 99Appendix D: Economic surplus from telecommunications 101Appendix E: Top-down approach to forecasting national costs
of non-resilient infrastructure 102Appendix F: Assessing disaster hazards 103Appendix G: Estimating resilience benefits 104Limitation of our work 107

6
Glossary
6
Disaster risk reduction
The practice of reducing disaster risks through systematic efforts to analyse and manage the causal factors of disasters. This would include initiatives to reduce exposure to hazards and the vulnerability of people and property, judiciously manage land and the environment, and improve preparedness for adverse events (United Nations, 2009).
Foundational data
Base layers of locational information used for assessing natural disaster risks, as well as a range of other broader purposes. This encompasses exposure data (assets at risk, population and community demographics), as well as fundamental geographic data (geological, topographic and weather information).
Hazard data
Hazard-specific information on the risks of different disaster types, providing contextual data about the history of events and the risk profile for Australian locations.
Impact data
Data on the potential and actual impacts associated with natural disasters, including information on historical costs and damage, and the current and predicted future value at risk.
Mitigation
Measures taken before a disaster aimed at decreasing or eliminating its impact on society and the environment (COAG, 2011). [In climate change terminology, mitigation refers to actions to address the causes of climate change. This generally involves actions to reduce anthropogenic emissions of greenhouse gases that may contribute to the warming of the atmosphere. This is not the definition of mitigation used in this report.]
Natural disasters
A natural disaster is a naturally occurring rapid onset event that causes a serious disruption to a community or region (Productivity Commission, 2014). For the purpose of this report, we define natural disasters as bushfires, cyclones, earthquakes, floods, severe thunderstorms or storm surges.
Resilience
The ability of a system, community or society exposed to hazards to resist, absorb, adjust to and recover from the effects of a hazard in a timely and efficient manner. This would include initiatives to preserve and restore essential structures and functions (United Nations, 2009). This paper is focused on the component of resilience that deals with ‘resisting’, or actions taken in advance of a disaster to reduce the impact.

Building resilient infrastructure March 2016 7
Acronyms
ABCB Australian Building Codes Board
ABS Australian Bureau of Statistics
AC Alternating current
ACMA Australian Communications and Media Authority
AEMO Australian Energy Market Operator
AER Australian Energy Regulator
AHD Australian Height Datum
AUD Australian dollar
CBA Cost-benefit analysis
CBD Central business district
COAG Council of Australian Governments
CPI Consumer price index
CSIRO Commonwealth Scientific and Industrial Research Organisation
DAE Deloitte Access Economics
DC Direct current
DRR Disaster risk reduction
GDP Gross domestic product
IAG Insurance Australia Group
IS Infrastructure Sustainability
ISCA Infrastructure Sustainability Council of Australia
IT Information technology
NDMP National Disaster Mitigation Program
NDRRA Natural Disaster Relief and Recovery Arrangements
NEMMCO National Electricity Market Management Company
NPV Net present value
NSW New South Wales
OECD Organisation for Economic Co-operation and Development
PV Present value
RMIT Royal Melbourne Institute of Technology
SMS Short Message Service
UN United Nations
UNISDR United Nations Office for Disaster Risk Reduction
UK United Kingdom
US United States (of America)
VCR Value of customer reliability
VTTS Value of travel time savings
WA Western Australia

8
Companion reports
8
Companion reports commissioned by the Australian Business Roundtable for Disaster Resilience & Safer Communities
This report builds on three companion reports commissioned by the Australian Business Roundtable for Disaster Resilience & Safer Communities. A summary of key findings and recommendations from these reports is included in Appendix A. In brief:
• Building our Nation’s Resilience to Natural Disasters (2013) reviewed the economics of mitigating disaster risks facing Australian communities. It identified opportunities for greater coordination between governments, businesses and communities in managing pre-disaster resilience, including carefully targeted mitigation investments. The report offered three key recommendations: – Improve coordination of pre-disaster resilience by appointing a National Resilience Advisor and establishing a Business and Community Advisory Group
– Commit to long-term annual consolidated funding for pre-disaster resilience
– Identify and prioritise pre-disaster investment activities that deliver a positive net impact on future budget outlays
• Building an Open Platform for Natural Disaster Resilience Decisions (2014) provided an overview of natural disaster data and research in Australia, and reinforced the need for better coordination and transparency of disaster risk and resilience information. The report recommended three outcomes: – Efficient and open – deliver a national platform for foundational data
– Transparent and available – remove barriers to accessing data and research
– Enable effective decision-making – establish a prioritisation framework
• The Economic Cost of the Social Impact of Natural Disasters (2016), developed in parallel with this report, expands on Building our Nation’s Resilience to Natural Disasters by valuing some of the broader social impacts of natural disasters to better understand the total cost of natural disasters in Australia.
This body of work supports a growing national awareness of the need for disaster mitigation and resilience due to the increasing prevalence and cost of natural disasters. For example, following the release of Building our Nation’s Resilience to Natural Disasters, the Australian Government asked the Productivity Commission to undertake a public inquiry into the efficacy of Australia’s natural disaster funding arrangements. A summary of the inquiry’s key findings and recommendations are included in Appendix B.
The Commission’s inquiry made a number of key recommendations supporting those advocated by the Roundtable in the recommendations of Building our Nation’s Resilience to Natural Disasters and Building an Open Platform for Natural Disaster Resilience Decisions.
In particular, the Commission recommended an increase in government funding and accountability for natural disaster risk management, and that natural hazard data and information be made publically available. To this end, the Australian Government Public Data Policy Statement [2015b], released in December, commits the Government to specific actions to optimise the use and reuse of public data; to release non-sensitive data as open by default; and to collaborate with the private and research sectors to extend the value of public data for the benefit of the public.
The reports also support ongoing progress by the Australian Government to improve infrastructure planning and prioritisation, including in response to the 2014 Productivity Commission inquiry into public infrastructure. For example, Infrastructure Australia was given a role to develop and implement a national best practice framework for project evaluation, including ‘determining a robust and consistent methodology for cost benefit analyses for all economic and social infrastructure’.
In 2015, the Australian Infrastructure Audit (Infrastructure Australia, 2015a) found that maintenance and resilience were major themes and ‘enhancing the resilience of assets will become more important for infrastructure providers as extreme weather events become increasingly likely to threaten certain assets’. The audit called for increased expenditure to enhance resilience, to ensure infrastructure can continue operating during minor disruptions and quickly recover from major disruptions.
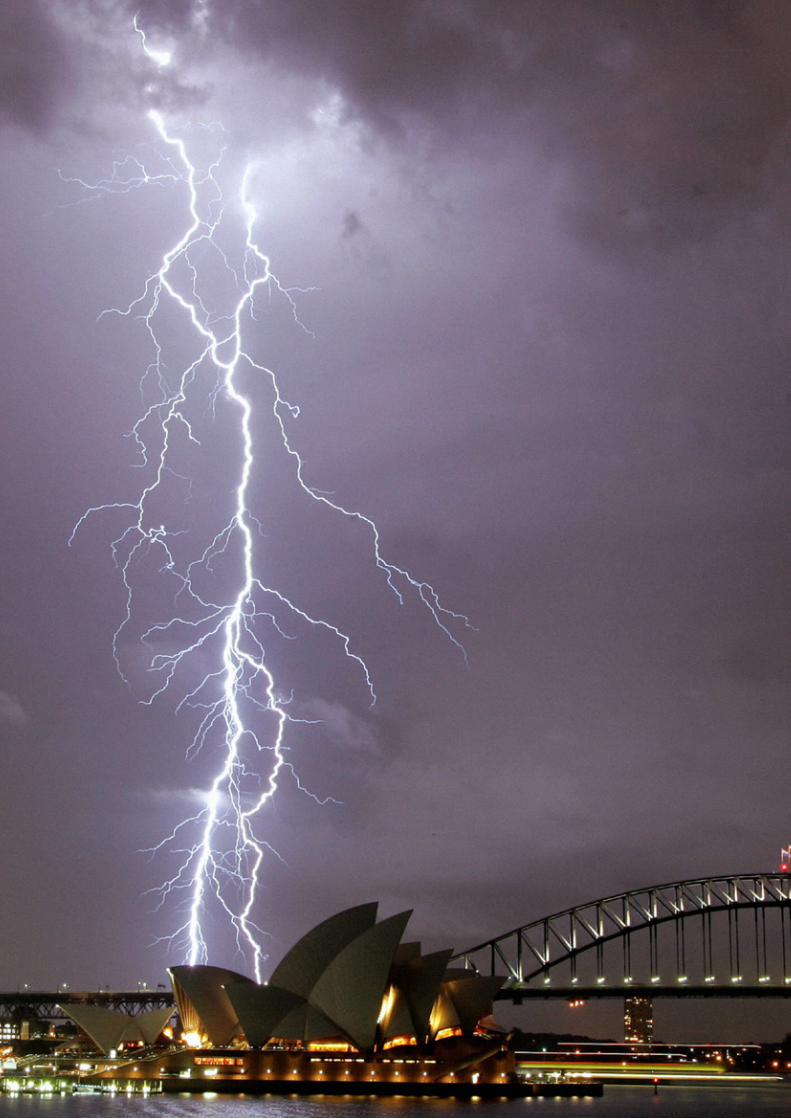
Right: May 28, 2008: Lightning strikes over the Harbour Bridge, Sydney, New South Wales (Cameron Richardson / Newspix)
Building resilient infrastructure March 2016 9
10
Executive summary
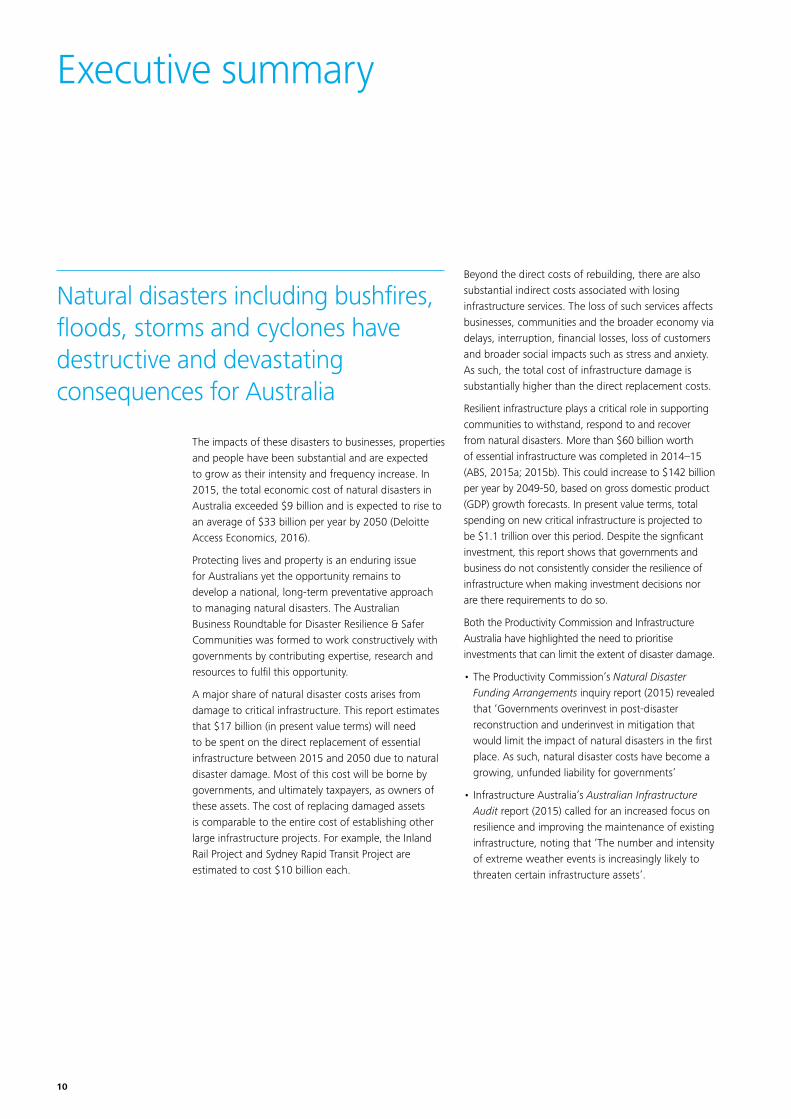
The impacts of these disasters to businesses, properties and people have been substantial and are expected to grow as their intensity and frequency increase. In 2015, the total economic cost of natural disasters in Australia exceeded $9 billion and is expected to rise to an average of $33 billion per year by 2050 (Deloitte Access Economics, 2016).
Protecting lives and property is an enduring issue for Australians yet the opportunity remains to develop a national, long-term preventative approach to managing natural disasters. The Australian Business Roundtable for Disaster Resilience & Safer Communities was formed to work constructively with governments by contributing expertise, research and resources to fulfil this opportunity.
A major share of natural disaster costs arises from damage to critical infrastructure. This report estimates that $17 billion (in present value terms) will need to be spent on the direct replacement of essential infrastructure between 2015 and 2050 due to natural disaster damage. Most of this cost will be borne by governments, and ultimately taxpayers, as owners of these assets. The cost of replacing damaged assets is comparable to the entire cost of establishing other large infrastructure projects. For example, the Inland Rail Project and Sydney Rapid Transit Project are estimated to cost $10 billion each.
Beyond the direct costs of rebuilding, there are also substantial indirect costs associated with losing infrastructure services. The loss of such services affects businesses, communities and the broader economy via delays, interruption, financial losses, loss of customers and broader social impacts such as stress and anxiety. As such, the total cost of infrastructure damage is substantially higher than the direct replacement costs.
Resilient infrastructure plays a critical role in supporting communities to withstand, respond to and recover from natural disasters. More than $60 billion worth of essential infrastructure was completed in 2014–15 (ABS, 2015a; 2015b). This could increase to $142 billion per year by 2049-50, based on gross domestic product (GDP) growth forecasts. In present value terms, total spending on new critical infrastructure is projected to be $1.1 trillion over this period. Despite the signficant investment, this report shows that governments and business do not consistently consider the resilience of infrastructure when making investment decisions nor are there requirements to do so.
Both the Productivity Commission and Infrastructure Australia have highlighted the need to prioritise investments that can limit the extent of disaster damage.
• The Productivity Commission’s Natural Disaster Funding Arrangements inquiry report (2015) revealed that ‘Governments overinvest in post-disaster reconstruction and underinvest in mitigation that would limit the impact of natural disasters in the first place. As such, natural disaster costs have become a growing, unfunded liability for governments’
• Infrastructure Australia’s Australian Infrastructure Audit report (2015) called for an increased focus on resilience and improving the maintenance of existing infrastructure, noting that ‘The number and intensity of extreme weather events is increasingly likely to threaten certain infrastructure assets’.
Natural disasters including bushfires, floods, storms and cyclones have destructive and devastating consequences for Australia

Building resilient infrastructure March 2016 11
In response to the Productivity Commission’s Public Infrastructure inquiry report (2014), the Commonwealth (2014) has committed to improving project selection processes, including favouring projects that deliver long-term priorities. To achieve this, Infrastructure Australia has been given a role to develop and implement a best practice framework to evaluate projects. This includes ‘determining a robust and consistent methodology for cost benefit analyses for all economic and social infrastructure’.
Planning for resilience has the potential to significantly reduce disaster costs. Most importantly, when considering a new project, there is a need to ensure risks associated with natural disasters are appropriately analysed and all options for resilience are considered during the decision-making process. The current reform agenda provides an invaluable opportunity to embed resilience in the planning process for significant infrastructure.
This report reviews the decision-making process for investing in new ‘hard’ infrastructure, including the various Commonwealth and state guidelines for comparing project options through cost-benefit analysis. It discusses the need to embed resilience into this process and offers practical steps to do so.
The focus is on hard infrastructure that provides essential services, including: roads, bridges, railways, ports, airports, school and hospitals as well as telecommunications, energy, water and sewage infrastructure.
Earth moving equipment was brought in to clear debris from the railway bridge after floodwaters receded in Grantham, west of Brisbane in Queensland. (Jon Hargest/Newspix)

12
Investment decision-making and resilience
Infrastructure planning requirements typically make little reference to resilience. Where references exist, there is a lack of supporting guidelines on how this should be achieved. There is an implicit assumption that land use planning, building codes and standards provide adequate requirements. Yet, for at least some assets, it is likely to be cost-effective to build to a higher level of resilience than these prerequisites mandate.
The decision-making process for building new infrastructure is often complex, requiring trade-offs between objectives within budget constraints. Cost-benefit analysis (CBA) is a key factor in the decision-making process and is used to prioritise options with the greatest net benefits.
Yet a review of the CBA guidelines applicable to infrastructure project appraisal reveals that, with the exception of Queensland’s guideline to measure the benefits of flood-proofing transport infrastructure, there are no explicit guidelines for measuring the benefits of resilient infrastructure.
The economic case for change
Determining which (if any) resilience measures are appropriate before a natural disaster event and indeed before infrastructure is built is challenging. It requires a detailed ex-ante assessment of the likelihood of a hazard affecting a proposed asset and an analysis of the resilience options that could be implemented to mitigate disaster impacts.
Three ex-post case studies provided in this report demonstrate that infrastructure investment decisions would change if resilience was evaluated before initial investment approvals.
• Loss of electricity services caused by the 2007 Victoria bushfires cost the national economy $234 million. While it is expensive to build underground transmission lines ($11 million per kilometre), evidence indicates that there would be net benefits from this additional resilience measure in some high-risk areas, specifically where the likelihood of a similar event is greater than 5% per year (a one-in-20-year event).
• Flooding of a state highway bridge in regional New South Wales (NSW) has caused six major traffic disruptions since its construction in 1987. The cost of future events is estimated at $75 million, totalling about $92 million (in present value terms) over the projected life of the asset. This compares to an estimated replacement cost of $7.4 million. The example highlights that the cost of minor disruptions to a local area can add up significantly over time.
• Loss of telecommunications services as a result of the Brisbane floods in 2011 cost users about $1 million per day and Optus around $1 million overall. The future cost of similar events is expected to be around $9 million. In contrast, Optus has invested between $3 and $5 million to improve infrastructure resilience since 2011. The benefits exceed the costs of the measures implemented if the risk of a similar event occurring exceeds 4% (a one-in-25-year event).
In all three cases, greater investment in resilience would have more than paid off in terms of avoiding disaster costs.
Executive summary
A single loss-of-supply incident cost around $234 million
Lost mobile services cost $1 million a day during the Brisbane floods
Total bridge closure costs are estimated at $91.8 million

Building resilient infrastructure March 2016 13
Executive summary
Planning for resilient infrastructure
A number of limitations affect the capacity (and incentives) for government and industry decision-makers to invest in resilience for new and replacement infrastructure. These include complex cross-jurisdictional approval processes, intensive data requirements, limited technical capacity, a lack of specific guidelines for CBAs to include resilience benefits and inadequate references to resilience in appraisal processes.
To support the shift towards a system in which options for resilience are considered at the planning and decision-making stages in major infrastructure projects, this report offers:
• Practical guidance for practitioners to integrate resilience into the CBA process for proposed infrastructure
• Five principles for decision-makers (at all levels of government and business) to facilitate comprehensive integration of disaster resilience into infrastructure planning, appraisal and approval processes.
Decision-makers at all levels can embed resilience into infrastructure investment by integrating this practical guidance into their CBA frameworks and adopting these five principles in their planning and appraisal frameworks. The principles are summarised as below.
Figure i: Five principles for resilience in infrastructure planning
1
2
3
4
5
Identify disaster risksDecision-makers should integrate a risk assessment requirement in project proposals to ensure disaster exposure, asset vulnerabilities and opportunities for hazard prevention or mitigation are identified from the outset.
Apply robust methodologies for CBAsDecision-makers should update CBA guidelines to include resilience benefits, following a robust and consistent approach.
Coordinate, centralise and make available critical data and informationGovernments and business should partner to pool data and information sources, through a national open data platform. This would increase the transparency and accessibility of the data required to measure resilience, and reduce the cost of assessing options.
Strengthen approval processesDecision-makers should strengthen requirements for resilience to be addressed in their appraisal processes. For example, a set of checkpoints in project approvals could ensure practitioners assess and disclose disaster risks and, where relevant, include them in CBAs.
Embed ongoing monitoring of resilienceDecision-makers should embed provisions to regularly monitor infrastructure resilience in response to expected climate variability and population demographics. The responsibility for monitoring resilience should be designated during the planning process.

14
1
2
3Recommendations
This report offers three key recommendations:
Improve infrastructure planning processes: Integrate resilience in government and industry decision-making by adopting the principles for
resilience in infrastructure planning.
A consistent approach by all stakeholders will ensure resilience becomes a mainstream component of strategic planning and investment in infrastructure, improving the effectiveness of these investments in providing essential services to Australian businesses and communities.
Improve incentives: Prioritise policy changes and funding arrangements that ensure disaster
resilience has been considered and incorporated where appropriate into infrastructure planning.
All levels of government should update project appraisal frameworks to include criteria to demonstrate that resilience has been considered. These criteria will improve the robustness of infrastructure selection and generate greater long-term benefits for the Australian community. Industry will be motivated to consider resilience too, despite the higher costs often associated with doing so. Where appropriate, governments should also consider funding mechanisms that recognise resilience benefits to the broader community.
Improve capacity: Government and industry should work to strengthen the technical capacity
of practitioners to identify, analyse and evaluate the costs and benefits of resilience options.
Technical capacity must be significantly improved to embed resilience in the infrastructure decision-making process. Sophisticated and data-intensive analysis is required to model natural disaster risks in local areas, and quantify the benefits of resilient infrastructure using CBA. This suggests a need for long-term investment in resilience education at the tertiary level and revisions to existing tools and guidelines for practitioners.
Importantly, the capacity to evaluate disaster risk and resilience relies heavily on the availability of and access to relevant data and research. The Roundtable supports recent policy initiatives to improve data access.
Conclusion
These recommendations will help to embed resilience in the decision-making process for new infrastructure. In turn, this will improve the cost-effectiveness of infrastructure spending and, more importantly, mitigate the devastating and costly impacts of disasters on businesses and communities.
Executive summary
Building resilient infrastructure March 2016 15
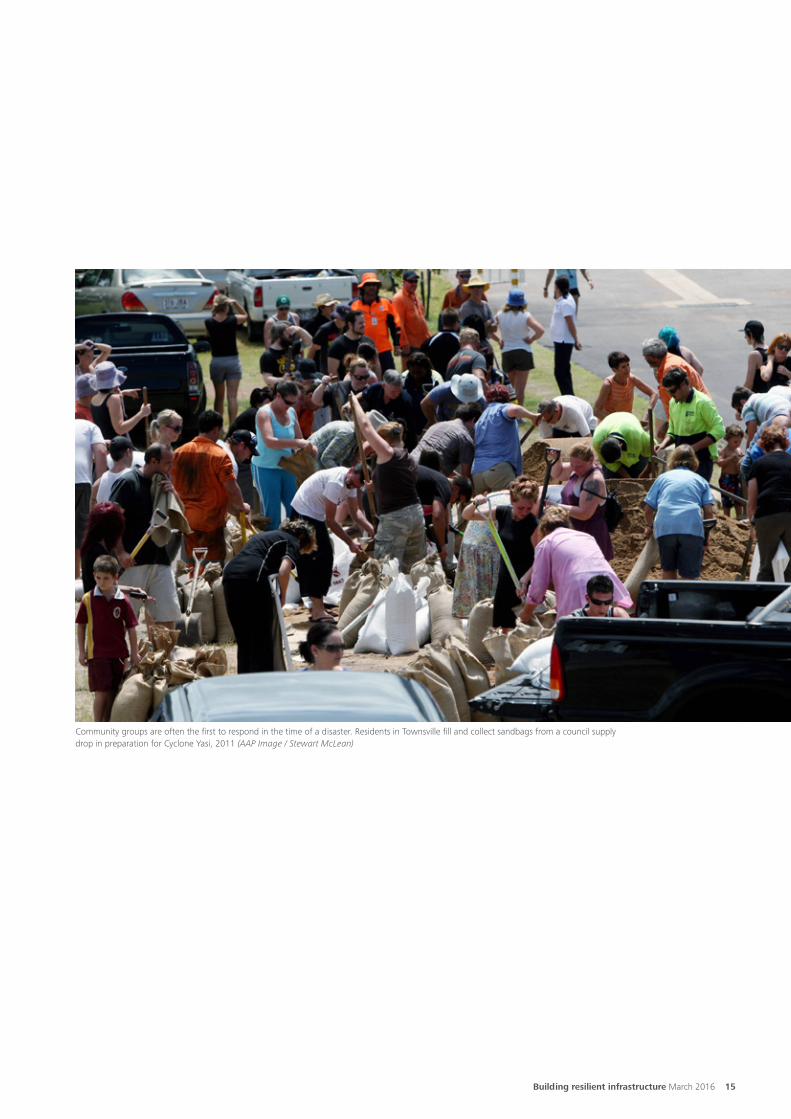
Community groups are often the first to respond in the time of a disaster. Residents in Townsville fill and collect sandbags from a council supply drop in preparation for Cyclone Yasi, 2011 (AAP Image / Stewart McLean)
16
Amount likely to be spent on rebuilding critical infrastructure after natural disasters occur over the period to 2050
$17bn

Building resilient infrastructure March 2016 17
The investments in hard infrastructure each year are significant, with more than $60 billion worth of essential infrastructure completed in 2014–15 (ABS, 2015a; 2015b). Between 2015 and 2050, total spending on new critical infrastructure is projected to be $1.1 trillion (see Section 4.2).
This investment will generate economic and social benefits because infrastructure facilitates and supports productivity and economic growth over the long term. Infrastructure Australia estimates that the economy-wide value-add of infrastructure services will increase from $187 billion per year in 2011 to $377 billion in 2031, which illustrates the growing importance of infrastructure to the economy (Business Council of Australia, 2015b).
Australia is exposed to a range of natural disasters, including from bushfires, floods, storms and cyclones. The total economic cost of natural disasters has been estimated at $6.3 billion per year and is expected to rise to $23 billion a year by 2050. This is due to population growth, increased infrastructure density and migration to more vulnerable regions. This does not include the increased frequency of natural disasters due to climate change. When including social impacts, such as mental health impacts and post-traumatic stress disorder, costs are expected to rise to an average of $33 billion per year by 2050. These disasters have widespread impacts on lives, homes, the natural environment and key infrastructure.1
1. Introduction
Critical infrastructure is often susceptible to natural disaster risks. Beyond direct impacts to infrastructure, causing it to be repaired or rebuilt, there are often costly flow-on impacts attributable to the loss of infrastructure services. This can disrupt businesses and communities and may also have indirect impacts such as a long-term loss of business confidence and psychological distress.
Improving the resilience of Australia’s infrastructure to natural disasters is a growing priority particularly given the expected rise in climate variability and increases in the frequency and severity of natural disasters (see Box 1). As well as introducing measures to mitigate the risks natural disasters pose to existing infrastructure, there is a need to ensure natural disaster risks are appropriately assessed during the decision-making process when building new and replacement infrastructure. Planning more resilient infrastructure has the potential to create significant benefits in terms of avoiding direct and flow-on costs associated with natural disasters.
Key points
• This report adds to Building our Nation’s Resilience to Natural Disasters and Building an Open Platform for Natural Disaster Resilience Decisions by reviewing resilience in decision-making for new and replacement infrastructure investments.
• Given the growing cost of natural disasters to Australian infrastructure and the flow-on impacts for businesses, communities and the Australian economy, this report offers guidance to better integrate resilience considerations in infrastructure planning decisions.
1. See the companion report, The Economic Cost of the Social Impact of Natural Disasters for a detailed analysis of the economic cost of social impacts of natural disasters in Australia.

18
Box 1: The impact of climate change on natural disasters in Australia
There is virtually unanimous agreement among climate scientists that human activity is substantially contributing to climate change, with the human impact on climate since the start of the industrial era greatly exceeds the impact due to known changes in natural processes (Intergovernmental Panel on Climate Change, 2007). The Intergovernmental Panel on Climate Change released its fifth Assessment Report into climate change in 2014. The second Working Group paper of the report, Climate Change 2014: Impacts, Adaptation, and Vulnerability, states that climate change will generally (though not uniformly) increase the severity and rate of natural disasters in Australia. It states with ‘high confidence’ that there will be an ‘increased frequency and intensity of flood damage to settlements and infrastructure in Australia’, an increase in ‘the number of days with… extreme fire weather’ and ‘greater frequency and intensity of droughts’.
The most recent report into climate change from the Commonwealth Scientific and Industrial Research Organisation (CSIRO), Climate Change in Australia: Projections for Australia's Natural Resource Management Regions (2015), likewise concludes that climate change will almost certainly increase the frequency and severity of natural disasters. As temperatures rise, the atmosphere is able to hold more water, increasing the possibility of extreme rainfall and flash flooding. It is also projected that higher temperatures will increase the number of days with harsh fire weather.
Geographical shifts in the distribution of natural disasters are likely too, potentially affecting communities unfamiliar with preparing, responding to and recovering from natural disasters. The climatological distribution of rainfall will change, which translates to a change in catchment hydrology. Climate change will thus change the frequency and severity of river flood risks around Australia, but not in a uniform manner. Some rivers will flood more severely and frequently while others will not.
At the 21st Conference of Parties to the United Nations Framework Convention on Climate Change (COP21), member countries agreed by consensus in the Paris Agreement to ‘reduce their carbon output as soon as possible and to do their best to keep global warming to well below two degrees Celsius’. The agreement, which comes into force in 2020, represents a turning point for multilateral action to limit climate change below dangerous levels. Despite the commitment to limit global warming to two degrees, sea levels are still expected to rise by around six metres, posing a great risk to coastal regions around the world and small island nations (Dutton et al, 2015).
The COP21 Agreement also provided a landmark commitment to focus on adaptation, resilience and response to climate impacts. All countries will be required to submit adaptation priorities, support needs and action plans. Developing countries will receive increased support for adaptation actions and the adequacy of this support will be assessed through a transparent framework.
1. Introduction

Building resilient infrastructure March 2016 19
The analysis in this paper assumes that natural disasters, such as floods and bushfires, will occur as frequently in the future as in the past, that is, the rate of natural disasters will remain constant. Given the evidence for climate change, this is unlikely – natural disasters will almost definitely happen more in the future than in the past. This paper does not factor in this probability so the estimations of future costs are likely to be conservative.
This report investigates the decision-making process for building new and replacement hard infrastructure in light of these disaster risks and offers principles and guidance to ensure resilience is considered in this process. For these guidelines to be effectively implemented, data availability must be improved and methodologies must be robust and consistent.
Hard infrastructure encompasses all man-made physical assets that accommodate the needs of society, including roads, bridges, railways, ports, airports, pipelines, telecommunications infrastructure, dams, schools and hospitals. This report focuses on decision-making for building critical infrastructure that provides essential public services.
1.1 BackgroundThe CEOs of Australian Red Cross, IAG, Investa Property Group, Munich Re, Optus and Westpac Group formed the Australian Business Roundtable for Disaster Resilience & Safer Communities (the Roundtable) in December 2012. The Roundtable aims to actively improve the capacity of people, communities and businesses to withstand future natural disasters.
The Roundtable has published three other papers on natural disasters:
• Building our Nation’s Resilience to Natural Disasters (2013) reviewed the economics of mitigating disaster risks facing Australian communities
• Building an Open Platform for Natural Disaster Resilience Decisions (2014) provided an overview of natural disaster data and research in Australia, and reinforced the need for increased coordination and transparency of information about disaster risk and resilience
• The Economic Cost of the Social Impact of Natural Disasters (2016), developed in parallel with this paper, expands on Building our Nation’s Resilience to Natural Disasters by including the cost of social impacts to better understand the true total cost of natural disasters.
Appendix A provides a more detailed summation of the key findings and recommendations of these papers.
1. Introduction

20
Adding to this body of work, the Roundtable commissioned Deloitte Access Economics to review the economic and social benefits of embedding resilience in the planning process for building new and replacement infrastructure.
There is growing national awareness of these issues. For example, the Australian Government asked the Productivity Commission to undertake a public inquiry into the efficacy of natural disaster funding arrangements following the release of Building our Nation’s Resilience to Natural Disasters in June 2013. The final report, released in May 2015, stated that ‘Governments overinvest in post-disaster reconstruction and underinvest in mitigation that would limit the impact of natural disasters in the first place. As such, natural disaster costs have become a growing, unfunded liability for governments’. A summary of the key findings and recommendations from the inquiry are included in Appendix B.
Figure 1.1: Summary of the Roundtable’s work on natural disaster resilience
Total costs of natural disasters
in Australia
Open data platformBuilding an Open
Platform for Natural Disaster Resilience
Decisions
Infrastructure decision-making
processBuilding Resilient
Infrastructure
Raise awareness of the critical need to prepare Australian communities to make them safer and more resilient to natural disasters
Economic costs and benefits Building our
Nation’s Resilience to Natural Disasters
Social costs and benefits
The Economic Cost of the Social Impact of
Natural Disasters
The Australian Infrastructure Audit report released by Infrastructure Australia in May 2015 noted that ‘The number and intensity of extreme weather events is increasingly likely to threaten certain infrastructure assets’. The audit called for an increased focus on resilience and improving the maintenance of existing infrastructure. It noted that it is critical to ensure infrastructure can keep operating through minor disruptions – and recover quickly from major disruptions – and called for ‘a national debate about reform’ to change our infrastructure decision-making system.
1. Introduction
Source:Deloitte Access Economics (2016)
Building resilient infrastructure March 2016 21
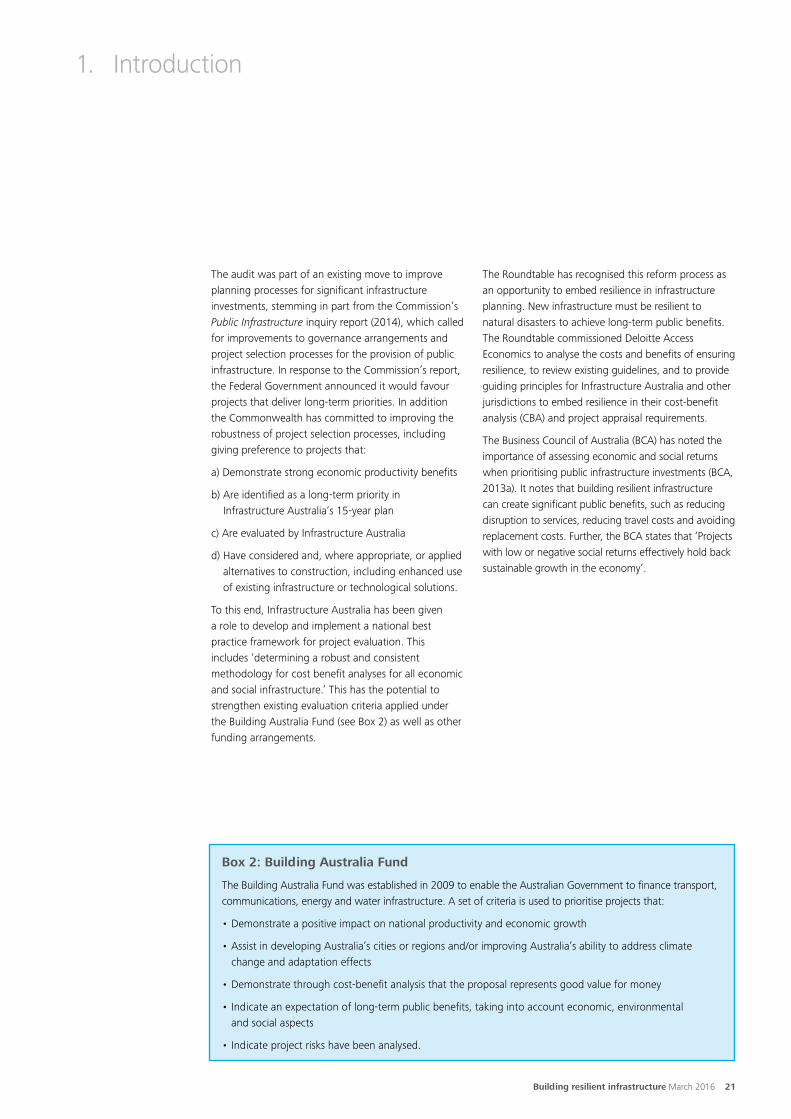
The audit was part of an existing move to improve planning processes for significant infrastructure investments, stemming in part from the Commission’s Public Infrastructure inquiry report (2014), which called for improvements to governance arrangements and project selection processes for the provision of public infrastructure. In response to the Commission’s report, the Federal Government announced it would favour projects that deliver long-term priorities. In addition the Commonwealth has committed to improving the robustness of project selection processes, including giving preference to projects that:
a) Demonstrate strong economic productivity benefits
b) Are identified as a long-term priority in Infrastructure Australia’s 15-year plan
c) Are evaluated by Infrastructure Australia
d) Have considered and, where appropriate, or applied alternatives to construction, including enhanced use of existing infrastructure or technological solutions.
To this end, Infrastructure Australia has been given a role to develop and implement a national best practice framework for project evaluation. This includes ‘determining a robust and consistent methodology for cost benefit analyses for all economic and social infrastructure.’ This has the potential to strengthen existing evaluation criteria applied under the Building Australia Fund (see Box 2) as well as other funding arrangements.
The Roundtable has recognised this reform process as an opportunity to embed resilience in infrastructure planning. New infrastructure must be resilient to natural disasters to achieve long-term public benefits. The Roundtable commissioned Deloitte Access Economics to analyse the costs and benefits of ensuring resilience, to review existing guidelines, and to provide guiding principles for Infrastructure Australia and other jurisdictions to embed resilience in their cost-benefit analysis (CBA) and project appraisal requirements.
The Business Council of Australia (BCA) has noted the importance of assessing economic and social returns when prioritising public infrastructure investments (BCA, 2013a). It notes that building resilient infrastructure can create significant public benefits, such as reducing disruption to services, reducing travel costs and avoiding replacement costs. Further, the BCA states that ‘Projects with low or negative social returns effectively hold back sustainable growth in the economy’.
Box 2: Building Australia Fund
The Building Australia Fund was established in 2009 to enable the Australian Government to finance transport, communications, energy and water infrastructure. A set of criteria is used to prioritise projects that:
• Demonstrate a positive impact on national productivity and economic growth
• Assist in developing Australia’s cities or regions and/or improving Australia’s ability to address climate change and adaptation effects
• Demonstrate through cost-benefit analysis that the proposal represents good value for money
• Indicate an expectation of long-term public benefits, taking into account economic, environmental and social aspects
• Indicate project risks have been analysed.
1. Introduction

22
1.2 Structure of this reportThe report is set out as follows:
• Chapter 2 reviews the current integration of resilience in the planning processes for building new infrastructure in various Australian states. Specifically, it focuses on government appraisal processes for approving new projects, including policies and guidelines for completing CBA. It then compares applications of CBA with international guidelines
• Chapter 3 highlights the economic case for change at a project level. It quantifies three examples of natural disasters in Australia to determine the cost-effectiveness of integrating resilience into infrastructure planning
• Chapter 4 highlights the economic case for change at a national level. It presents a high-level analysis of the national net benefits that could arise through embedding resilience in infrastructure planning
• Chapter 5 presents a set of principles for governments, businesses and communities to integrate resilience into infrastructure planning and approval mechanisms
• Chapter 6 draws together recommendations from the Roundtable to improve the long-term management of disaster resilience.
Supporting information is provided in seven appendices:
• Appendix A summarises the companion reports produced by the Roundtable
• Appendix B provides an overview of the recent Productivity Commission inquiry into natural disaster funding arrangements
• Appendix C provides further information to support the case study on electricity transmission lines in Victoria, presented in Section 3.1
• Appendix D describes the methodology for consumer surplus calculations developed for the case study on communications infrastructure in Queensland, presented in Section 3.3
• Appendix E outlines the top-down approach applied to forecast the future costs of rebuilding infrastructure, presented in Chapter 4
• Appendix F describes the process for assessing disaster hazards
• Appendix G presents a methodology for practitioners looking to measure the benefits of ensuring resilience.

Building resilient infrastructure March 2016 23
Brisbane, Australia - November 19, 2014: A severe thunderstorm strikes Brisbane deluging the city centre with heavy rain, and causing water to cascade over the Sunlander train just as it arrives in Roma Street Station at the end of its 1681km journey from Cairns. The city received more than half its monthly average rainfall as 55mm of rain fell in less than an hour, causing flash flooding, traffic chaos and shutting down the entire rail network, stranding people during rush hour. It was the first of two severe thunderstorms to cause serious disruption to Brisbane in a week. (John Kirk / iStock)
Mining equipment is submerged by flood waters on January 6, 2011 in Rockhampton, Australia.(Jonathan Wood / Getty Images)

24
Three out of twelve Australian CBA guidelines
recognise resilience to natural disasters

Building resilient infrastructure March 2016 25
Key points
• Annual investments in essential infrastructure are large, and are expected to grow substantially to meet the needs of our growing population and economy
• All levels of government and the private sector share responsibility for making infrastructure investment decisions. While decision-making processes vary according to the type of infrastructure being considered, the geographic location and the stakeholders involved, cost-benefit analysis (CBA) is a standard evaluation tool used to compare project options and prioritise investments
• While land use planning, building codes and engineering standards provide minimum requirements for resilience, assessing resilience during the initial project appraisal and approval processes, within a CBA, may demonstrate that it is cost-effective to build a higher level of resilience than is mandated
• The importance of resilience is recognised in Australia and internationally. However, there is limited guidance on how to incorporate resilience into CBAs for infrastructure projects. Only three of the 12 Australian CBA guidelines reviewed have reference to resilience
• Both the Productivity Commission (2014) and Infrastructure Australia (2015b) recognise the need for greater consideration of natural disaster risks and resilience when selecting projects and managing assets.
Between now and 2050, an estimated $1.1 trillion will be spent on building new critical infrastructure (see section 4.2). Given the scope of this investment, it is essential that governments, businesses and communities work together to ensure resilience is considered when deciding on investments. This chapter reviews the decision-making process for investing in infrastructure and highlights areas in which resilience should be integrated, drawing on domestic and international best practice.
2.1 Infrastructure investment in Australia
More than $60 billion worth of essential hard infrastructure investment was completed in 2014–15 (ABS, 2015a; 2015b). This investment is likely to grow substantially in the next 20 years to meet the needs of a growing population and economy. This infrastructure facilitates productivity and growth through providing essential public services. The economy-wide value-add attributed to infrastructure services will increase from $187 billion per year in 2011 to $377 billion in 2031 (Infrastructure Australia, 2015b).
2. Infrastructure investment – planning for resilience
Infrastructure Australia acknowledges the importance of infrastructure investment to the economy:
‘ Major reforms are needed to improve the way we plan, finance, construct, maintain and operate infrastructure to ensure it can underpin gains in Australia's productivity in the decades ahead, and contribute to economic growth.’ (2015a)
It is not a focus of this report but maintenance costs for infrastructure assets is significantly greater than the costs of building new infrastructure. In this context, there are two considerations: first, if addressing resilience up-front may reduce the ongoing maintenance requirements for infrastructure. Second, if there are cost-effective options for improving infrastructure resilience as part of maintenance work. These issues are considered in Box 3.

26
Box 3: Maintaining existing infrastructure
Infrastructure costs are greater than just the initial cost of construction. Maintenance is a significant proportion of the cost of infrastructure over its lifetime. It is estimated that half of the $16 billion spent on roads each year by local, state and federal governments is spent on maintenance and repairs (Infrastructure Partnerships Australia, 2011).
While this report focuses on new and replacement infrastructure, there are opportunities to improve resilience when planning and investing in infrastructure maintenance. Further, new infrastructure projects should include resources to help maintain and enhance resilience as part of proposed maintenance programs.
The Productivity Commission’s Natural Disaster Funding Arrangements inquiry report (2014) notes it is important to regularly maintain infrastructure. In its submission to the Productivity Commission, the Department of Infrastructure and Regional Development argued that ‘An avoidance of adequate ongoing maintenance has the potential to increase the impact of natural disasters [since] poorly maintained assets are more likely to be susceptible to damage’. It claimed there was a tendency to delay funding for maintenance until it was absolutely necessary.
Infrastructure owned and managed by local government is often the most susceptible to damage due to poor maintenance, particularly where local councils are financially constrained (Jeff Roorda and Associates, 2010). Local councils across New South Wales (NSW) spent only 74% of their estimated investment in required infrastructure maintenance in 2011–12 (NSW Department of Premier and Cabinet, 2013). While the Productivity Commission observed a renewed focus by local governments on developing infrastructure maintenance plans, it concluded there ‘would be merit in more explicit integration of natural disaster risk into asset management plans’ (2014).
2. Infrastructure investment – planning for resilience
Floodwaters cover Albion Park raceway in the inner Brisbane suburb of Albion on January 13, 2011. (Jonathan Wood / Getty Images)

Building resilient infrastructure March 2016 27
Figure 2.1: Example of the layers involved in infrastructure investment decision-making
2.2 The decision-making processThe decision-making process for investing in proposed infrastructure varies according to the type of infrastructure being considered, the geographic location and the decision-maker. A stylised view of this process includes:
• Stage 1: Funds are allocated to various types of infrastructure. If they are public assets, governments may decide on the share of investment allocated to transport versus hospital construction, for example. For private assets, businesses may decide on the share of investment in technology, buildings or service delivery
• Stage 2: Assessment of specific infrastructure projects to finance. For example, governments decide whether to invest in delivering road services to location X or location Y. This involves submitting proposals to a centralised decision-maker. Local governments may submit proposals to state governments, or business units may submit proposals to the executive. These decisions are often designed to meet particular demands for infrastructure services
• Stage 3: Appropriate delivery and specifications are determined. For example, whether a road to location X should require two or four lanes, whether it should be sealed or unsealed, and where it will be located.
Given the importance of infrastructure to the economy, and the differences between types of infrastructure, this decision-making process is often complex, requiring trade-offs between objectives within budget constraints.
Determining appropriate service levels for new and replacement infrastructure involves multiple considerations, which vary by infrastructure type, location and the current and future needs of end-users.
Decision-makers rely on a number of inputs to evaluate and approve options. A typical input is CBA, which is used to compare options and provide economic justification for an infrastructure project.
While building codes and standards provide a minimum requirement for resilience (including specific guidelines for mitigating disaster risks – see Section 2.3.3), this report considers if incorporating resilience in the initial project appraisal and approval processes may shift investment decisions. For example, examining resilience during CBA may reveal it is cost-effective to build to a higher level of resilience than is mandated under building requirements. Alternatively, it may be found to be more efficient to build in a different area or to change the infrastructure design.
Integrating resilience into CBA will mean existing project appraisal processes can continue to be used, with the added assurance that natural disasters resilience has been thoroughly assessed.
Total infrastructure spending
Rail Road Airports Hospitals Ports Utilities
A B C D
Infrastructure investment Pool
Project Selection
Assessment of individual infrastructure assets 1 2 3
2. Infrastructure investment – planning for resilience

28
2.2.1 Who makes infrastructure investment decisions?The decision-making process for investing in major public infrastructure projects is complex and approval often involves multiple levels of government.
For example, local councils are responsible for local roads but to build a major new local road, they may need to work with (or seek funding from) state or federal governments. In some instances, councils may work with private property developers who may fund and deliver the road. The Federal government typically approves other significant assets, such as airports and national highways.
Level of government Economic infrastructure Social infrastructure
Federal Aviation services (air navigation etc) Tertiary education
Public housing (shared)
Telecommunications Health facilities (shared)
Postal services
National roads (shared)
Local roads (shared)
Railways (shared)
State Roads (urban, rural, local) (shared) Educational institutions (primary, secondary, technical) (shared)
Railways (shared) Childcare facilities
Ports and sea navigation Community health services (shared)
Aviation (some regional airports) Public housing
Electricity supply Sports, recreation and cultural facilities
Dams, water and sewerage systems Libraries
Public transport (train, bus) Public order and safety (courts, police stations, traffic signals)
Local Roads (local) (shared) Childcare centres
Sewerage treatment, water and drainage supply
Libraries
Aviation (local airports) Community centres and nursing homes
Electricity supply Recreation facilities, parks and open spaces
Public transport (bus)
Table 2.1: Division of responsibility for infrastructure approval among the tiers of government
Source: Australian Parliamentary Library (2004)
Thus, investment and ownership may involve several levels of government and the private sector. Similarly, while state governments are generally responsible for investing in infrastructure such as hospitals and transport, Federal government funding is often required. For privately owned infrastructure, such as telecommunications assets, the private sector is typically responsible for making decisions, yet these also need to satisfy government approval processes.
Figure 2.2 provides a stylised example of a large infrastructure project initiated by local government, showing the roles of other stakeholders in delivering it. This representation does not include the environmental assessments generally required across all levels of government. Projects funded at state or federal levels,
2. Infrastructure investment – planning for resilience

Building resilient infrastructure March 2016 29
or jointly funded, typically require a CBA as part of the appraisal process.
These responsibilities can also change over time. For example, the Federal government’s investment in public transport infrastructure varies significantly depending on its policy positions.
Each party varies in its capacity and incentives to consider embedding resilience in infrastructure projects. For example, local councils may have fewer resources available for project appraisal and, more importantly, may lack the resources to fund resilient project options even when they lead to higher net benefits for society.
Further, given the complex interactions between the stakeholders that make decisions on infrastructure, it is not always clear which should be responsible for assessing natural disaster risks and resilience.
A National Resilience Advisor, as advocated in Building our Nation’s Resilience to Natural Disasters, could support various decision-makers to overcome these constraints by leading the integration of resilience into the project appraisal processes.
Figure 2.2: Stylised example of the infrastructure investment process
Source: Deloitte Access Economics (2016)
Local government State government Federal government
Private
Identify
Propose
Approve
Fund
Construct
Maintain
2. Infrastructure investment – planning for resilience

30
2.3 Resilience in government policy and investment decisions
2.3.1 Resilience in Australian policy guidelinesA number of government departments have policies and strategies that aim to build resilience, which is broadly defined as the ability to mitigate the impact of natural disasters and recover quickly after emergencies. These documents are mostly high-level papers that do not consider how resilience could be achieved.
The Federal government’s strategy to ensuring infrastructure resilience is outlined in the Critical Infrastructure Resilience Strategy (2010) (Figure 2.3). The resilience strategy is managed by several groups. For example, the Trusted Information Sharing Network for Critical Infrastructure Resilience shares information between industry and government; while the Critical Infrastructure Program for Modelling and Analysis collects data and models the potential effects of hazards on critical infrastructure. The National Critical Infrastructure Resilience Committee, meanwhile, coordinates critical infrastructure resilience activities between various states and territories.
The National Climate Resilience and Adaptation Strategy, released by the Federal government in 2015, outlines the risks to cities and the built environment, what is currently being done to improve resilience, and what needs to be done. The strategy acknowledges that ‘Population trends, urbanisation and residential shifts to high risk areas will intersect with climate change to increase Australia’s exposure to natural hazards as a whole’. It notes the importance of sharing information and disclosing risks to help businesses, communities and governments manage their exposure to climate change and natural disasters.
The Federal government’s policy on infrastructure resilience is supplemented by the Council of Australian Governments’ (COAG) National Strategy for Disaster Resilience (2011). The strategy focuses on improving links between government and the business sector, because a substantial portion of infrastructure is privately owned or managed. It argues that both public and private risks should be accounted for in development decisions. Furthermore, it calls for a regular review of building standards.
Figure 2.3: High-level resilience policy documents
Source: Deloitte Access Economics (2016)
Critical Infrastructure Resilience Strategy Australian Government (2010)
Overarching approach to infrastructure resilience
National Climate Resilience and Adaptation Strategy
Australian Government (2015)
Principles for climate adaptation and increasing resilience
National Strategy for Disaster Resilience
COAG (2011)
Priority areas to build disaster-resilient communities
2. Infrastructure investment – planning for resilience

Building resilient infrastructure March 2016 31
In contrast to these broad guidelines, the Australian Building Codes Board (ABCB) has developed a set of specific standards for ensuring structural resilience in commercial and residential buildings, included in the National Construction Code (2015). For commercial buildings, the standards of structural resilience depend on the importance of the building. For example, buildings that are essential to post-disaster recovery must be able to withstand an earthquake with an annual exceedance probability (AEP) of 0.067% and cyclonic winds with an AEP of 0.05%.2 For residential buildings, metal roof assemblies must be able to stay in position under a number of different cyclone frequencies and pressures. Residential properties should be able to withstand an earthquake with an AEP of 0.20% and cyclonic winds with an AEP of 0.20%. Individual states may have additional standards.
At the state level, Victoria has an extensive policy on infrastructure resilience, as outlined in its Critical Infrastructure Resilience Strategy (2015). ‘Vital’, ‘major’ and ‘significant’ infrastructure is placed on a register of critical infrastructure. Owners and/or operators of vital infrastructure must participate in a four-state ‘resilience improvement cycle’. The cycle includes submission of an annual Statement of Assurance to government that summarises the foreseeable risks and outlines strategies to deal with them. Owners must develop a program to test emergency plans, which must be audited. Accountable officers within companies are assigned to each vital development to certify the Statement of Assurance and ensure all actions of the cycle are performed.
NSW’s approach to ensuring resilient infrastructure is expressed in Infrastructure NSW’s State Infrastructure Strategy 2012–2032 (2012). Resilience is one of three key strategic assessment criteria, along with connectivity and improving quality of life. It specifies that public and private infrastructure should be able to withstand disruption during crises.
Queensland has likewise developed the Queensland Strategy for Disaster Resilience (2013). The report outlines key resilience outcomes, along with which agencies oversee the outcomes, performance metrics and how these metrics are measured. This helps to assess if effective resilience strategies are being implemented. However, the metrics tend to be broad, using terms such as ‘improve’ rather than specifying exact standards.
Although not solely focused on resilience, in recent years sustainability considerations have been increasingly recognised when investing in infrastructure. For example, the Infrastructure Sustainability Council of Australia (ISCA) is a member-based, not-for-profit industry council focused on promoting infrastructure sustainability across design, construction and operation. Formerly known as the Australian Green Infrastructure Council, ISCA was established in 2008. It now has more than 60 public and private sector members.
ISCA administers an Infrastructure Sustainability (IS) rating scheme, described further in Box 4, to help embed sustainability considerations in infrastructure developments and operations. The scheme includes consideration of flood risks and adaption to climate change among other aspects of sustainability with themes including resource use, emissions, pollution and waste, people and place, ecology, innovation, and management and governance.
2. For example, an individual born in Australia today can expect to live to 82. Cyclonic winds with an AEP of 0.05% (a one-in-2000-year event) have a 0.05% of occurring every year. This means there is a 96% chance that the cyclonic winds will not occur over the course of 82 years, or – put another way – there is a 4% chance of one-in 2000-year cyclonic winds occurring.
2. Infrastructure investment – planning for resilience

32
Box 4: Infrastructure Sustainability Council of Australia – IS rating scheme
In 2012, ISCA launched a rating scheme to evaluate transport, water, energy and communications infrastructure projects and assets against sustainability criteria including environmental, social and governance aspects. Depending on the stage of an infrastructure project, it can be assessed for a ‘design’, ‘as built’ or ‘operation’ rating.
To date, ISCA has provided 14 certified ratings, and a further 44 projects are currently registered for a rating, with a capital value of almost $60 billion (ISCA, 2015). Typically ratings are required by government agencies for specific infrastructure projects or voluntarily sought by private sector firms to demonstrate a commitment to sustainability when submitting government tenders. In particular, Transport for NSW requires an IS rating for projects involving capital expenditure of more than $50 million, and Main Roads Western Australia requires it for projects valued at more than $100 million.
The current IS rating scheme includes some consideration of aspects related to natural disaster resilience, granting credits for climate change risk assessment, climate change adaptation options and flooding design. The scheme’s technical manual gives detailed guidance on the evidence applicants must provide to meet the benchmarks. ISCA is currently updating the rating scheme and anticipates putting a greater focus on resilience to natural disasters and adapting to climate change.
2.3.2 Resilience in Australian infrastructure guidelinesRegulatory approval for major infrastructure projects usually requires a CBA as a key input to decision-making. State and federal government departments have issued a number of guidelines for completing CBAs.
Three out of the 12 Australian CBA guidelines reviewed in this report referenced resilience to natural disasters as a possible benefit (Table 2.2):
• The Department of Finance and Administration’s Handbook of Cost-Benefit Analysis (2006) recommends valuing flood and fire protection using hedonic prices*
• NSW Treasury’s NSW Government Guidelines for Economic Appraisal (2007) provides flood protection as an example of a potential benefit. It notes, however, that ‘One difficulty in this and similar cases is that major floods, which are critical to such assessments [of risk reduction], occur infrequently and the probability estimates are accordingly unreliable’
• The Queensland Department of Transport and Main Roads provides a detailed and extensive guide to valuing flood resilience in CBAs as part of its Cost-Benefit Analysis Manual (2011). It notes that all-weather road access may not be economically efficient. The benefits of flood proofing are measured by avoided delays or diversion costs.
The manual also presents a number of case studies to give users an understanding of the principles involved in evaluating projects. One case study relates to improving flood immunity, showing how to calculate the benefits of a more resilient bridge.
With the exception of Queensland’s guideline to measure the benefits of flood proofing transport infrastructure, there are no explicit guidelines on valuing the benefits of improved infrastructure resilience.
While it is arguably, implicit that any comprehensive CBA should include resilience to natural disasters as a benefit for proposed infrastructure projects, without explicit mention it is possible that many would overlook these benefits, contributing to underinvestment. As the Organisation for Economic Co-operation and Development (OECD) remarks in Improving the Practice of Cost Benefit Analysis in Transport (2014), resilience is a ‘relatively new’ concern so it is not always included in CBAs. Also, resilience can be difficult to measure in economic terms. As noted by NSW Treasury (2007), accurate estimates of the probability of extreme events, which are necessary to calculate risk, are difficult to obtain.
2. Infrastructure investment – planning for resilience
* Hedonic prices are modelled prices estimated in terms of the characteristics of a good (or service). The approach is most commonly applied to the housing market.

Building resilient infrastructure March 2016 33
Additionally, CBA that hasn’t incorporated natural disaster risks will assume that the benefits associated with the asset will flow over the life of the asset. If the asset is disabled or requires significant maintenance as a result of a disaster, then the period where the benefits flow will be reduced.
Integrating an appraisal of resilience as a specific step in CBA guidelines would support practitioners in evaluating resilience as a routine part of appraising projects. This step – alongside stronger references to resilience in government appraisals, such as a requirement to demonstrate if natural disaster risks are present and, if so, how resilience options have been considered – could improve the cost-effectiveness of investment decisions. Unless appraisal processes are changed and further guidance is given, there is little incentive for the private sector to consider resilience beyond the minimum requirements.
Indeed, the Productivity Commission’s 2015 Natural Disaster Funding Arrangements inquiry report recommended that:
‘ All governments should put in place best-practice institutional and governance arrangements for the provision of public infrastructure, including road infrastructure. These should include:
– stronger processes for project selection that incorporate requirements for cost-benefit analyses that are independently scrutinised and publically released
– consideration of natural disaster risk in project selection and asset management planning
– a clearer link between road-user preferences and maintenance and investment decisions.’
The Commission argues that increasing the transparency and rigorousness of CBAs for infrastructure investments can provide a framework for debating the financial trade-offs between project options, and for prioritising approaches for betterment and mitigation (2014:224).
These findings are supported by Infrastructure Australia, which indicated that project proposals primarily address capacity and economic issues, with less reflection on what resilience meant for the scoping, design and prioritisation of projects.
There are a number of areas for improvement, particularly in sophisticated analysis scenarios that consider resilience and allow trade-offs to be evaluated in a transparent way. An increased focus on resilience at the project assessment stage will help ensure infrastructure solutions are strategically and economically robust.
Greater guidance and support is required to develop stakeholders’ capacity to rigorously test resilience options.
2. Infrastructure investment – planning for resilience

34
Table 2.2: Government guidelines for cost-benefit analysis
CBA Department Reference to resilience as a benefit:
Cyclones Floods Fires Earthquakes Other
Cost-Benefit Analysis Guidance Notes (2014)
Office of Best Practice Regulation, Department of Prime Minister and Cabinet, Australian Government
Handbook of Cost-Benefit Analysis (2006)
Department of Finance and Administration, Australian Government
Reform and Investment Framework – Templates for Use by Proponents, Stage 7 (2013)
Infrastructure Australia, Australian Government
Better Infrastructure Decision-making (2013)
Infrastructure Australia, Australian Government
Drought
National Guidelines for Transport System Management in Australia (2006)
Australian Transport Council 3
NSW Government Guidelines for Economic Appraisal (2007)
NSW Treasury, NSW Government
Project Assessment Framework: Cost-benefit analysis (2015)
Queensland Treasury, Queensland Government
Earthquakes are given as a risk example
Cost-Benefit Analysis Manual (2011)
Department of Transport and Main Roads, Queensland Government
Guidelines for the evaluation of public sector initiatives (2014)
Department of Treasury and Finance, South Australian Government
Program Evaluation (2015) Department of Treasury and Finance, Western Australian Government
Economic Evaluation for Business Cases: Technical guidelines (2013)
Department of Treasury and Finance, Victorian Government
Policy Essentials: Cost-Benefit Analysis (2012)
Business Council of Australia
3. Now the Transport and Infrastructure Council
2. Infrastructure investment – planning for resilience

Building resilient infrastructure March 2016 35
2.3.3 Resilience in other aspects of infrastructure planningResilience may be also considered during other stages of the infrastructure investment process, such as land use planning, engineering and construction. Land use planning may be regulated by state governments or local government. Engineering standards set a minimum level of risk that a particular asset can be exposed to. Building codes set out specific structural minimums for resilience in commercial and residential buildings.
Land use planning may require certain assets to be located in areas safe from risk of flood or fire, contributing to resilience. The National Strategy for Disaster Resilience highlights the importance of land use planning and building standards in reducing risks in the built environment:
‘ Planning approaches that anticipate likely risk factors and the vulnerability of the population can reduce the future possible impact of disasters. Responsible land use planning can prevent or reduce the likelihood of hazards impacting communities. Building standards can mitigate the likelihood of loss of life, as well as damage to and/or destruction of property and infrastructure.’ (2011:11)
In 2013, the Land Use Planning and Building Codes Taskforce – established by the National Emergency Management Committee (now the Australia and New Zealand Emergency Management Committee) – undertook a national review of land use planning and building codes. There was four stages, involving:
• Developing a vision statement describing the resilience of the built environment to future natural disasters
• Undertaking a national stocktake of relevant strategic land use planning and building code policies, instruments and regulations
• Identifying opportunities for new land use planning and building resilience initiatives
• Developing a roadmap outlining activities to implement disaster resilience (PlanDev Business Solutions, 2012).
The roadmap framework is presented in Figure 2.4, highlighting the different priorities for action: integrated legislation, process enhancements, comprehensive data and mapping, vendor disclosure, governance partnerships, education and training, and inter-jurisdictional collaboration. The Productivity Commission (2014) has recommended that state and territory governments prioritise and accelerate implementation of the roadmap, including reviewing the regulatory components of vendor disclosure statements.
Figure 2.4: Enhancing Disaster Resilience in the Built Environment Project: land use planning and building codes roadmap framework
Integrated legislation
Process enhancements
Collaborative vendor disclosure
Comprehensive data and mapping
Implementation
SCPEM
NEMC
Jurisdictions
Governance partnerships
Jurisdictions
Jurisdictions
Lifelong education and training
SCPEM
JurisdictionsSCPEM
Inter-jurisdictional collaboration
Jurisdictions
Immediate
Medium Term
Ann
ual
Rep
orti
ng
Source: PlanDev Business Solutions (2012)Note: NEMC – National Emergency Management Committee (now the Australia and New Zealand Emergency Management Committee) and SCPEM – Standing Council on Police and Emergency Management (since replaced by the Law, Crime and Community Safety Council)
2. Infrastructure investment – planning for resilience

36
Engineering standards are another example of where resilience is considered outside formal investment decision-making process. All Australian engineering construction projects must be delivered to an appropriate standard. The standards cover safety, reliability, productivity and efficiency specifications, and are defined for specific assets across various regulation, codes and guidelines. These standards normally include specific requirements about resilience. For example, the standards may dictate that a bridge or road must meet a particular threshold, such as being resistant to a one-in-100-year flood (with an AEP of 1%). These standards are one input considered when scoping, designing and building new and replacement infrastructure.
Because standards typically improve over time, restored assets are usually rebuilt to higher standards. However, applying betterment principles, as recommended by the Queensland Reconstruction Authority (QRA), when infrastructure is rebuilt following a natural disaster can restore assets to an even higher standard of resilience than prescribed by engineering standards.
The Framework for Betterment (QRA, 2015) highlights the benefits of reducing future expenditure on restoring assets when rebuilding infrastructure affected by natural disasters. In 2013, the Australian and Queensland governments undertook an $80 million program to rebuild infrastructure damaged during Cyclone Oswald to a standard that was more resilient to natural disasters. Many of these assets had been repeatedly damaged and restored during previous disasters in 2011 and 2012. Subsequent disasters have affected 71 assets restored under the program. Only two projects sustained severe damage, while 82% of the assets received no damage and 10% merely superficial damage. While $16 million was spent to enhance resilience, more than $22 million has already been saved in restoration costs.
Alongside enhancing resilience in land use planning, building codes and engineering standards, it is also important to use CBA to holistically assess resilience options when scoping and approving projects. The wider public benefits of having resilient infrastructure – and avoided costs – may mean that different infrastructure investment decisions are made and infrastructure is built with more resilience than that prescribed by building codes or engineering standards.
In particular, while planning codes and standards are important for setting baseline levels of resilience, CBA frameworks need to test on a case-by-case basis if it is possible to cost-effectively achieve higher levels of resilience to better suit local risks and community needs. For example, the new parallel runway at Brisbane Airport. In recognition of future climate change risks in the area, such as storm surges and rising sea levels, the runway is being constructed 1.8 metres above the minimum regulatory requirements for flood and storm tides (Investor Group on Climate Change, 2015).
Box 5: Graceful failure
Graceful failure is a relatively new concept in engineering, where structures have a strategic or engineered weaker point. When faced with a massive natural disaster, they will fail in a manner that minimises other damage and loss of life.
For example, making a flood levee deliberately weaker in a particular section. If a rare flood occurs, that could breach the levee and flood a town, the levee would break in the weaker section and flood into farmland instead – reducing the downstream flood peak heights.
Graceful failure can also involve designing a major piece of infrastructure so that if it fails, it is non-catastrophic. Thus, it could be quickly returned to full serviceability after the disaster.
In the context of built infrastructure, staged failure can allow partial building collapse and safe evacuation – a standard design requirement in earthquake zones (Tye et al., 2015)
2. Infrastructure investment – planning for resilience

Building resilient infrastructure March 2016 37
The Sendai Framework is a 15-year, voluntary, non-binding agreement that recognises that governments are primarily responsible for reducing the risk of natural disasters, with other stakeholders sharing this responsibility as enablers, supporting government. It aims for:
‘ The substantial reduction of disaster risk and losses in lives, livelihoods and health and in the economic, physical, social, cultural and environmental assets of persons, businesses, communities and countries.’ (UN, 2015)
To achieve this, the Sendai Framework is looking to improve the resilience of infrastructure and implement strategies to reduce the risks posed by natural disasters by 2020. More broadly, the Sendai Framework lists seven global targets as part of its framework:
• Reduce disaster damage to critical infrastructure and disruption of basic services
• Increase the number of countries with national and local strategies to reduce the risks posed by natural disasters
• Substantially increase the availability of, and access to, multi-hazard early warning systems, information about natural disasters and risk assessments
• Reduce global mortality rates from natural disasters
• Reduce the number of people affected by natural disasters globally
• Reduce direct economic loss from natural disasters in relation to global gross domestic product (GDP)
• Enhance international cooperation for implementing this framework.
These goals are associated with four key priorities, one of which emphasises the need to invest in disaster risk reduction for resilience. The four priorities are:
• Understand disaster risk
• Strengthen governance to manage disaster risk
• Invest in resilience strategies to reduce disaster risk
• Enhance disaster preparedness to ensure effective responses and to ‘build back better’ during recovery, rehabilitation and reconstruction.
2.3.4 Resilience in architecture and design educationCurrent design and architecture courses in Australia allocate little time to covering natural disaster risks or the resilience of buildings in future urban centres. While there are broad references to resilience, architecture schools in Australia offer very few, if any, courses that include training on how to consider resilience.
It is important to incorporate resilience into tertiary studies to ensure future designers and engineers have the knowledge to design and build infrastructure that reflects the risk of natural disasters damage. Teaching these skills early also places resilience at the top of their minds when thinking about infrastructure design.
Resilience is, however, increasingly acknowledged through cross-disciplinary integrated programs. RMIT now offers a Master of Disaster, Design and Development, developed in partnership with the International Federation of Red Cross and Red Crescent Societies and UN-Habitat. The course emphasises the need to build the resilience of buildings in disaster-prone and socially marginalised communities.
International universities – such as Oxford Brookes University, the International University of Catalonia (UIC), University College London, Harvard University and the University of Auckland – are also offering courses in risk and resilience.
Given the extent of natural disasters in Australia and their impacts on infrastructure, it is evident Australia is underinvesting in resilience education.
2.3.5 Resilience in international policyThe benefits of building resilient infrastructure are not limited to Australia. The need for policies and strategies to improve resilience applies globally.
Internationally, the United Nations (UN) has led the call to ensure resilience in infrastructure – under the Hyogo Framework (2005), for example. The Hyogo Framework promotes a systematic approach to reducing risks posed by natural disasters (since been replaced by the Sendai Framework, 2015).
2. Infrastructure investment – planning for resilience

38
Japan pledged US$4 billion in 2015 to support implementation of the Sendai Cooperation Initiative for Disaster Risk Reduction over the next four years. The package focuses on developing disaster-proof infrastructure, promoting global and regional cooperation, and training 40,000 government officials and local leaders to lead national efforts to reduce disaster risk.
The Sendai Framework highlights the importance of increasing resilience on a global scale. Yet, in practice, there is little or no consideration of resilience in many infrastructure projects in developing countries. This has been noted by the World Bank’s Building Resilient Communities toolkit, which aims to identify where World Bank funding is used to improve resilience. In developing countries, resilience investments are often low-hanging fruit as the costs of basic hazard-proofing can be minimal, relative to the benefits. Therefore, investments in community-based preparedness and early warning systems, particularly in places more at risk of natural disasters, can save lives, protect property and reduce economic losses.
The UN is also responsible for the Making Cities Resilient campaign, which provides guidance documents and measurement tools to assist cities, particularly through local government, to improve their resilience and reduce the risks associated with natural disasters.
The following section provides an overview of relevant major policies in New Zealand, Canada, the UK and the US.
New Zealand
New Zealand has taken steps to integrate resilience into legal standards. In response to the Canterbury earthquakes in 2011, the Building (Earthquake-prone Buildings) Amendment Bill 2013 introduced a number of new earthquake resilience policies. New Zealand established a national earthquake resilience system to replace the previous local council systems. The bill stipulated that all earthquake-prone buildings must be strengthened or demolished within 20 years. The extensive scope of the measures faced criticism for their costliness and the possible destruction or abandonment of heritage buildings (Jones, 2015). The government introduced a more focused approach that targeted high-risk areas in 2015, which reduced the number of buildings affected from 500,000 to 30,000.
Canada
The Canadian government announced a National Platform for Disaster Risk Reduction (DRR) in 2009 to build coordinated, multi-stakeholder leadership to reduce the risks posed by disasters. This affirmed Canada’s commitment to the Hyogo Framework. Canada’s platform seeks to build a sense of national, cross-sectoral ownership in the DRR process through a coordinated participatory process.
In 2014, the Canadian Government earmarked C$200 million over five years to establish the National Disaster Mitigation Program (NDMP). The NDMP plans to address rising flood risks and costs, and build the foundation for informed investments to mitigate the effects of future floods. The NDMP is designed to reduce the impacts of natural disasters by focusing investments on areas where flooding and costs are significant and recurring, and by advancing work to facilitate private residential insurance for overland flooding.
The NDMP will also help to build the foundation for implementing informed and proactive prevention and mitigation strategies by investing C$17 million in three key areas:
• Risk, resilience and return on investment tools to provide provinces, territories and communities with the information and capacity they need to plan and evaluate flood mitigation projects
• A risk and resilience repository to collect, store, manage and share NDMP information to inform the future direction of policies and programs for all levels of government
• Public awareness and engagement activities.
2. Infrastructure investment – planning for resilience

Building resilient infrastructure March 2016 39
United Kingdom
The UK Government published its national infrastructure resilience strategy, Keeping the Country Running: Natural Hazards and Infrastructure, in 2011. The report notes that the UK lacks explicit national standards for infrastructure resilience – a shortcoming also noted by the Pitt Review (2008). The report argues that investments in ensuring the resilience of infrastructure should be proportional to the risk, and delivered at the lowest practicable level. Government departments responsible for each national infrastructure sector are required to develop an annual resilience plan for their relevant minister, in conjunction with infrastructure owners and regulators. There are nine national infrastructure sectors: communications, emergency services, energy, finance, food, government, health, transport and water. As these plans are classified, however, it is difficult to assess their effectiveness.
United States
In the US, the launch of the National Disaster Resilience Competition in 2014 gave disaster resilience significant attention. The competition provides grants to communities that have experienced natural disasters to help rebuild and increase their resilience. Communities affected by natural disasters between 2011 and 2013 are eligible to compete for approximately US$1 billion.
Phase 2 of the competition was announced in 2015, in which 40 states and communities were invited to compete for up to US$500 million for projects to address unmet needs from past natural disasters and vulnerabilities that could put Americans in harm’s way during future disasters.
The competition includes funding to restore infrastructure and housing, and applicants must demonstrate how they are reducing future risks. For example, a community that lost housing during a mudslide may construct homes in a safer area for the survivors (US Department of Housing and Urban Development, 2015b).
Box 6: 100 Resilient Cities – The Rockefeller Foundation
The Rockefeller Foundation has run the 100 Resilient Cities (100RC) program since December 2013, seeking to ‘help cities around the world become more resilient to the physical, social and economic challenges that are a growing part of the 21st century’ (2016).
The program provides the 67 cities currently in the 100RC network, including Sydney and Melbourne, with resources to help develop a roadmap to resilience, including:
• Financial and logistical guidance to have a chief resilience officer employed in the city or local government, with the responsibility to lead the city’s resilience efforts
• Expert support to develop a robust resilience strategy
• Access to solutions, service providers and partners from the private, public and non-government sectors that can help develop and implement resilience strategies
• Membership in a global network of cities that can learn from and help each other.
The 100RC program defines resilience more broadly than this paper as: ‘the capacity of individuals, communities, institutions, businesses, and systems within a city to survive, adapt, and grow, no matter what kinds of chronic stresses and acute shocks they experience’. It includes other stresses such as high unemployment and inefficient public transportation. Nevertheless, the focus on resilience can still be applied to infrastructure projects, as considered in this report.
2. Infrastructure investment – planning for resilience

40
2.3.5.1 Resilience in international infrastructure guidelinesTo assess the extent to which resilience is incorporated in infrastructure decision-making in other countries, this report reviewed four international guidelines and five cases where CBA was applied to infrastructure resilience that made reference to resilience as a benefit (see Table 2.3 and Table 2.4).
International guidelines for CBA were more likely to explicitly reference natural disaster resilience than Australian guidelines. This may be because many of the reviewed guidelines are designed for developing countries, which are often highly vulnerable to natural disasters. However, there is still relatively little guidance for practitioners looking to quantify resilience benefits both within Australia and internationally.
A notable exception is the World Bank’s Building Urban Resilience: Principles, Tools and Practice methodology (2012). The report advocates the use of CBA to compare options for reducing risks and also includes a specific methodology for identifying hazards.4
Other international papers reviewed – not specifically CBA guidelines – are also examples of the need for a greater focus on resilience, typically using ex-post CBA to demonstrate significant benefits. For example, papers written by the International Federation of Red Cross and Red Crescent Societies (2012), Copenhagen Consensus (2012) and Asian Development Bank (2013).
Table 2.3: International guidelines for cost-benefit analysis
CBA Organisation Reference to resilience as a benefit:
Cyclones Floods Fires Earthquakes
Cost-Benefit Analysis in World Bank Projects (2010)
World bank
Building Urban Resilience: Principles, Tools and Practice (2012)
World bank
Making Communities More Flood Resilient (2014)
Zurich Flood Resilience Alliance
The Economics of Early Response and Resilience: Approach and Methodology (2013)
UK Government
4. The methodology includes consideration of the frequency, duration, area extent, speed of onset, spatial dispersion, temporal spacing and the possibility of secondary hazards (2012:50). A combination of probabilistic hazard models and mapping can be used to make these assessments. A similar methodology for hazard assessment has been developed by Geoscience Australia for the purpose of managing and responding to natural disaster events.
2. Infrastructure investment – planning for resilience

Building resilient infrastructure March 2016 41
Table 2.4: International papers estimating resilience benefits
Organisation Reference to resilience as a benefit:
Cyclones Floods Fires Earthquakes
The long road to resilience: Impact and cost-benefit analysis of community-based disaster risk reduction in Bangladesh (2012)
International Federation of Red Cross and Red Crescent Societies
Policy Options for Reducing Losses from Natural Disasters: Allocating $75 billion (2012)
Copenhagen Consensus
*
* *
Disaster Resilience: A National Imperative (2012)
The National Academies
2015 Global Assessment Report on Disaster Risk Reduction (2015)
United Nations* * * *
Investing in Resilience: Ensuring a Disaster-Resistant Future (2013)
Asian Development Bank
* Refers to ‘disaster risk reduction’
2. Infrastructure investment – planning for resilience
May 19, 2011: Christchurch, NZL. The City Centre or Red Zone, remains closed in Christchurch, New Zealand, as the city continues to recover three months after a 6.3 magnitude earthquake hit in February, 2011, which resulted in multiple deaths and widespread property damage. (Newspix)

42
A single loss of electricity supply incident caused by bushfires in 2007
in Victoria cost about
Lifetime costs of repeated closures to the Emile Seriser bridge in Dubbo,
NSW, due to floods are about
Each day of lost mobile services during the 2011 Brisbane floods
cost about
$234m
$92m
$1m
Costs flowing from disruptions to infrastructure during natural disaster events

Building resilient infrastructure March 2016 43
Key points
• When natural disasters affect critical infrastructure, they impose significant costs on communities and impede their ability to react and recover. Early consideration of resilience in infrastructure decision-making would likely change the scope, design and construction of essential assets
• This chapter uses three case studies to consider the economic case for resilient infrastructure. It calculates an ex-post net benefit framework for assets affected by past disasters. The case studies are: – Electricity transmission lines in Victoria – The Emile Serisier Bridge in New South Wales (NSW) – Communications infrastructure in Queensland
• These case studies do not provide a full cost-benefit analysis (CBA) of resilience measures, but they do highlight the potential benefits of incorporating resilience measures early in the investment planning process.
3. The economic case for change – infrastructure projects
Very often the role of infrastructure in supporting community resilience only becomes clear after a natural disaster. The three case studies presented here demonstrate this by comparing the potential benefits of resilience measures undertaken after an event relative to the costs of these measures. They show that, implementing resilience measures would have net benefits given the natural disaster that eventuated.
However, it is complex to determine which resilience measures are appropriate before a natural disaster and indeed before infrastructure is built. It requires a detailed ex-ante assessment of the likelihood of a hazard affecting a proposed asset and analysis of the possible resilience options that could be implemented to mitigate impacts. Nevertheless, these case studies are useful illustrations of the merit of including resilience in infrastructure decision-making.
The case studies demonstrate variations in:
• The type of infrastructure affected
• The type of natural disasters
• The impact on communities when infrastructure is damaged or destroyed
• The geographic areas and communities affected
• The actions taken to boost resilience after these disasters.
To assess the potential net benefits of implementing resilience measures, the case studies compare the direct costs (for example, the cost of building a new bridge or underground electricity lines) with relative benefits (for example, the avoided disaster costs attributable to resilience measures). They examine:
• The impact of bushfires on electricity transmission lines in Victoria
• The effect of flooding on the Emile Serisier Bridge in NSW
• The effect of flooding on communications infrastructure in Queensland.

44
3.1 Electricity lines in VictoriaAustralia has one of the world’s largest interconnected electrical grids (Australian Energy Market Operator, 2015). The National Electricity Market (NEM) connects NSW, Queensland, South Australia, Tasmania and Victoria into a single grid that covers about 19 million residents.
Victoria and NSW are primarily linked by two 330-kilovolt overhead transmissions lines that pass through north-east Victoria. The lines share a 340-kilometre easement from South Morang in Victoria to the Murray Power Station in NSW, via the Dederang terminal (Figure 3.1).
Bushfires can cause electricity service outages. While overland transmission lines have caused some of the bushfires in Victoria, this case study focuses on how electricity infrastructure can be made more resilient to reduce the impact of bushfires on essential electricity services.5
This case study examines the Tatong bushfire in January 2007, which resulted in the loss of both transmission lines connecting Victoria to NSW. The case study assesses the potential net benefits of implementing proposed measures to boost resilience if a similar disaster occurs. The case study suggests that changing the design and construction of these lines to improve resilience in at-risk areas may be economically feasible.
Figure 3.1: Electricity transmission lines connecting Victoria to NSW
Source: Google Earth (2015); Orr & Allan (2015)
Melbourne
South Morang
DederangMurray Power Station (NSW)
5. In November 2015, the Victorian Government announced new regulations that require electricity distribution companies to introduce technology that reduces the chance of powerline faults causing bushfires. The proposed Electricity Safety (Bushfire Mitigation) Regulation 2015 will also require companies to progressively replace powerlines in high-risk areas by insulating the cables or burying them underground (Victorian Government, 2015). While these proposed changes focus on reducing the risk of bushfires caused by powerlines, this case study examines the case for making powerlines more resilient from the effects of bushfires established through other causes.
3. The economic case for change – infrastructure projects

Building resilient infrastructure March 2016 45
3.1.1 The Tatong bushfire – 16 January 2007The Tatong bushfire developed from a lightning strike on 11 January 2007. By 16 January 2007, spot fires had merged, covering a significant part of rural Victoria.
Authorities notified the operators of the transmission lines and the NEM, SP AusNet and the National Electricity Market Management Company (NEMMCO)6, that the fire could cross the easement north of Toombullup, placing the lines at risk.
While the operators knew that both lines were at risk, SP AusNet considered this ‘worst-case scenario’ unlikely (Nous Group, 2007). Rather, it expected that if the fire did affect one of the lines, it would automatically reclose (that is, close the circuit to restore power) and almost immediately return to service.
The fires entered the easement at about 3.50 pm. SP AusNet notified NEMMCO, stating that it expected to lose the lines one at a time. At 4.00 pm the fire caused one line to flashover (electrically discharge). The line automatically reclosed, which allowed supply through these lines to resume, but, soon after a second flashover occurred, causing this line to be locked out of service by the control system.
Figure 3.2: Points of electrical separation during the Tatong bushfire – Victorian region
Source: NEMMCO (2007)
NSW interconnector
NSW interconnector
NSW interconnector
TAS interconnector
DartmouthMt Beauty
McKay CreekElidon
South Morang
Geelong
Bendigo
SheppartonDederang
Horsham
Red Cliffs
SA In
terc
onne
ctor
(Mur
rayl
ink)
The second line then experienced a flashover, cutting off NSW and Queensland from South Australia, Victoria and Tasmania. This resulted in increased electricity flow from South Australia into Victoria, as South Australia tried to meet the supply shortfall from the loss of electricity from NSW. This large quantity of electricity exported from South Australia to Victoria tripped the South Australia to Victoria line. Thus, as shown in Figure 3.2, the national grid was separated into three ‘islands’: Queensland, NSW and parts of northern Victoria; most of Victoria and Tasmania; and South Australia.
At 4.03 pm, an automated load-shedding process (initiated to stabilise the system) cut power to about 481,345 Victorian electricity customers. It took 4.5 hours to restore full supply, during which time energy was exported from Victoria to South Australia. Later, a further 205,887 customers lost supply due to manual load shedding. It took another four hours after supply was restored for the electricity network configuration to return to normal. Overall, about 7,100,000 kilowatt hours of electricity was lost to 620,342 households and 66,890 businesses, as well as disruptions to major public infrastructure and public hospitals (Nous Group, 2007).
6. SP AusNet is now known as AusNet Services, and NEMMCO has been succeeded by the Australian Energy Market Operator.
3. The economic case for change – infrastructure projects
500 kV Transmission 330 kV Transmission 275 kV Transmission 220 kV Transmission HVDC Transmission

46
3.1.2 Emergency response focus of post-event reviewsGiven its significant impacts, the disruption to Victoria’s transmission network has been reviewed by:
• The Australian Energy Regulator (AER)
• NEMMCO
• Nous Group, on behalf of the Department of Primary Services.
These reviews focused primarily on emergency response issues, particularly in relation to NEMMCO’s decision not to re-classify the concurrent loss of both lines from a non-credible to a credible contingency. NEMMCO had the power to do so under abnormal conditions, including bushfires, but no obligation. Reclassification is fairly common, especially during lightning storms. In fact, the loss of both lines had been declared credible twice in the previous year. If reclassified, the power system would be adjusted to better withstand the new contingency. This would have led to a reduction in reliance on imports, mitigating – and possibly eliminating – the need for load shedding.
The guidelines for action under abnormal conditions have significantly expanded since the event. The Australian Energy Market Operator (AEMO) must now notify market participants if it believes a non-credible contingency is likely as a result of abnormal conditions, even if it has not reclassified the contingency as credible.
Vegetation clearance regulations have also been changed in Victoria. In 2010, a clause that exempted small tree branches from minimum clearance spaces for aerial bundled and insulated cables was removed. More recently, the Electricity Safety (Electric Line Clearance) Regulations 2015 has reintroduced some flexibility, providing:
• Electricity operators the ability to propose alternative methods to ensure safety and resilience other than the stated minimum clearances. For example, operators could suggest compliance using cable technology not specifically stated in the regulation
• A more flexible definition of ‘insulated cable’, reducing the minimum clearance for some lines.
Better technology may also help the inspection of clearances. For example, operators could use unmanned aerial vehicles (commonly called drones) to monitor the easement and ensure compliance.
Technological improvements have also lessened the risk of high-voltage lines igniting bushfires. A key technology is the Rapid Earth Fault Current Limiter, developed in Victoria in response to the 2009 Victorian Bushfires Royal Commission. These are installed at substations to stop the electrical current within milliseconds of a power line coming into contact with the ground or vegetation. The system may be triggered when a tree falls on a power line or a cable hits the ground. The limiter then reduces the voltage to a low current flow insufficient to spark a fire. Forty-five limiters will be installed across Victoria over the next seven years.
While these changes are commendable, the reviews have made little assessment of whether it is cost-effective to make Victoria’s transmission line infrastructure more resilient to lessen reliance on operational responses to manage electricity supply. This is despite authorities knowing that the transmission lines are still exposed to bushfire risk, with experts confirming that vegetation clearance standards are insufficient to protect overhead electricity lines from loss of service during a bushfire. For example, Nous Group notes that:
‘ Line design experts advised Nous that the task of designing a tower line that will consistently remain in service with a bushfire in the easement is ‘impossible’. Nous concluded that improved vegetation clearances would not have prevented the loss of the lines to the fire on 16 January 2007.’ (2007:86)
3. The economic case for change – infrastructure projects

Building resilient infrastructure March 2016 47
3.1.3 Applying a CBA framework for infrastructure resilienceMany factors need to be considered in determining if it is economically feasible for infrastructure to be made more resilient. This case study will examine the cost of each resilience option and how this compares to its benefits (for example, avoiding the cost of an outage). The risk factor is used to balance the cost and benefits, indicating the level of risk to ensure this investment will break even if a similar event occurs.
This analysis is based on ex-post event data and is used to demonstrate the hypothetical level of risk that would ensure the benefits equal the costs for a specific resilience measure.
The results suggest the benefits of replacing sections of the South Morang to Murray Power Station transmission line with underground cables in at-risk areas would exceed the costs, if the risk of a bushfire similar to the Tatong bushfire were greater than 5% a year.
This section outlines the CBA framework in the following stages:
• Identifying resilience options
• Identifying and valuing benefits and costs
• Calculating the risk threshold.
3.1.3.1 Identifying resilience optionsThere will always be some risk that overhead power lines are lost to service when a bushfire enters an easement. Nous Group (2007) identified a number of options to improve the resilience of power lines. These include:
• Changing vegetation clearance standards around overhead power lines
• Separating the two 330-kilovolt transmission lines into their own easements
• Replacing overhead lines with underground transmission cables.
A summary of the advantages and disadvantages of these options is presented in Appendix C. While these were reviewed by Nous Group (2007), their report focused on the relative costs of different options and did not specifically consider potential resilience benefits.
One resilience measure identified was replacing overhead lines with underground transmission cables. This option is commonly rejected because the cost of laying underground cables is significantly more than overhead power lines. For instance, Nous Group concluded that:
‘ Underground cable is prohibitively expensive for long-haul, high-capacity links.’ (2007:87)
In many studies, it is not evident whether a CBA was undertaken to assess if the reduction in disaster risk would outweigh these additional costs.
Given that replacing overhead lines with underground cables is likely to reduce risk the most, this option has been selected for the case study. A CBA framework has been used to analyse the feasibility of this option (that is, if embedding resilience in this way will deliver net benefits for society). The analysis compares the probability of a similar bushfire occurring to the risk factor required to equate the expected benefits with the cost of the resilience measure.
Identifying and valuing costs and benefits
Authorities are aware that the electricity transmission lines connecting Victoria to NSW are exposed bushfire risk. However, estimating the risk of both lines being lost in a bushfire requires sophisticated risk modelling and scenario analysis. The likely variation in the severity of disruptions associated with bushfires would need to be assessed, recognising that future disruptions could be less or more severe than those caused by the Tatong bushfire of 2007.
Recognising this uncertainty, this case study estimates a risk threshold, above which the benefits of installing underground transmission cables are likely to exceed the costs. This demonstrates how a CBA framework for resilience can be applied.
Key considerations of both the benefits and the costs of underground transmission cables are outlined in Figure 3.3. Given the level of risk is uncertain, these figures are approximate and have been rounded for presentation purposes. The figures are designed to provide guidance on the magnitude of costs and are not exact.
3. The economic case for change – infrastructure projects

48
Valuing the costs
A valuation of resilience costs should encompass whole-of-life costs relative to the business-as-usual alternative. Thus, it is important to consider the up-front costs of installing underground transmission cables and if the operating and maintenance costs of cables are higher or lower than the costs of the current overhead lines.
Installing underground cables is expensive because trenches or tunnels must be dug. Other cost factors are route length, route terrain, cable voltage, whether direct or alternating current (DC or AC) technology is used, and transmission capacity. Installing underground cables is estimated to cost between five and 10 times more than installing overhead power lines (Power and Water Corporation, 2009; Hill Michael, 2009; Western Power, 2011).
Estimates from Australian and international sources suggest installing underground transmission cables could cost between $2 million and $24 million per kilometre (see Appendix C). For this analysis, the average cost estimate of $11 million per kilometre has been used.
A sensitivity analysis will also be performed for the following figures:
• $7.0 million – the cost to place a 330-kilovolt transmission line underground (similar to the transmission lines in this case study) according to Diona Civil Engineers
• $11.2 million – the cost to place a 200-kilometre, 400-kilovolt transmission line underground according to PB Power in New Zealand
• $23.9 million – the cost to place a 75-kilometre, 400-kilovolt transmission line with 6,930 megavolt-amperes (MVA) underground according to Parsons Brinckerhoff in the UK, is also the upper limit of the costs in our literature review.
The net increase in operating and maintenance costs for underground cables relative to overhead power lines is more difficult to quantify. While underground cables are likely to experience fewer outages than overhead lines, identifying and repairing faults in underground cables is more costly and takes longer (ICF Consulting, 2003).
A study undertaken between 1998 and 2002 in North Carolina in the US found that underground outages took 58% longer to repair but occurred half as often (Matanuska Electric Association, 2015). On this basis, it is assumed there would be a minimal net increase in operating and maintenance costs if overhead cables were replaced with underground cables.
Figure 3.3: CBA framework for underground electricity transmission cables
Source: Deloitte Access Economics (2016)
Costs Benefits
Quantitative Qualitative
• Installation costs • Net increases in operational
and maintenance costs relative
to overhead lines, taking into
account that:
– Underground cables can be
more reliable than overhead
lines as they are protected from
winds and storms
– Repairs to underground cables
can take weeks or months,
compared to days or hours
for overhead lines.
Quantitative Qualitative
• Increased power line reliability
during bushfires, including:
– Sustained supply of electricity to
households and businesses
– Sustained supply to other public
infrastructure (e.g. transport and
health services)
• No more need to prune
vegetation where underground
cables are installed.
• May be limited due to the low
population in these areas. Benefits
may include:
– Improved visual amenity
– Reduced personal safety hazards
from falling power lines and car
accidents involving power poles.
3. The economic case for change – infrastructure projects

Building resilient infrastructure March 2016 49
Box 7: Value of consumer reliability (VCR)
The VCR estimates consumers’ willingness to pay for reliable electricity supply in dollars per kilowatt hour. This includes residential, commercial, agricultural and industrial users, and customers directly connected to the transmission network.
To calculate the values, the AEMO conducted surveys asking consumers how much they would pay to avoid various outage situations. Based on a standard weighting of electricity user types in Victoria, the VCR is estimated at $32.98 per kilowatt hour, in 2015–16 price terms.
The impacts valued in this VCR estimate include:
• Loss of work from paid staff
• Lost production
• Extra time taken to complete tasks
• Loss of revenue from fewer sales
• Spoilage of perishable products
• Loss of livestock
• Business downtime
• Loss of heating or air-conditioning.
Valuing the benefits
While the costs associated with underground cables are high, they must be evaluated in the context of the potential benefits. The main benefits are:
• a more reliable electricity supply (as captured by the avoided costs of disruption)
• the avoided costs of an emergency response.
The value that electricity customers place on a reliable electricity supply can be quantified using value of customer reliability (VCR), measured by the AEMO (2014). Updating the average value reported for Victoria to 2015–16 prices using the consumer price index (CPI) produces a value of $32.98 per kilowatt hour. The impacts included in this cost are explained in Box 7.
As noted, Nous Group (2007) estimated the Tatong bushfire caused 7,100,000 kilowatt hours of lost supply for Victorian households and businesses. This indicates that preventing similar electricity disruptions to households and businesses is worth about $234 million per event.
It is also important to value the reliability of electricity supply for public infrastructure, since it is not captured in the VCR estimates. Nous Group (2007) estimates these costs are about 25% of the household and business costs previously outlined, representing an additional cost of $59 million per major disruption event. This is an added avoided cost or benefit of placing transmission lines underground.
Source: AEMO (2014)
3. The economic case for change – infrastructure projects
In the case of the Tatong bushfire, impacts to public infrastructure included:
• Lost traffic lights at 1,100 intersections throughout Victoria, leading to major traffic delays and police traffic controllers at high-priority locations
• Delays to and overcrowded tram services due to traffic disruptions
• Disruptions to trains, including 160 cancelled services and 616 delayed services. The total delay was estimated at about 2.5 million person-minutes
• The shutdown of 141 mobile telecommunications network base stations
• Four hospitals experiencing difficulties shifting to backup generators. Three hospitals were able to continue services without significant problems, however some patients at Geelong Hospital were transferred to other locations
• The cost of hiring a replacement generator to preserve consumables at the Red Cross Blood Service
• The cost of preparing to move tissue supplies at the Donor Tissue Bank to alternative storage
• Lift failures, loss of water supply and loss of air-conditioning in some high rise buildings
• The cost of arranging emergency services staff members to respond to a high number of 000 calls – 33% above average.

50
The total disruption costs of about $293 million (avoided costs and benefits of the resilience measure) are translated to an average expected annual cost using the risk threshold calculated in the following section. In addition, placing transmission cables underground would reduce the costs of managing vegetation, which is only required for overhead lines. For the purpose of this analysis, a saving of about $769 per kilometre of underground cables installed is assumed.
Improvements to visual amenity and personal safety have been considered qualitatively. Noting that the transmission lines are in lightly populated areas, it is likely these benefits are negligible in this analysis.
Calculating the risk threshold
A comparison of the quantified costs and benefits described in this report can be used to derive the threshold level of risk. This threshold describes the level of risk that needs to be exceeded for the benefits of installing underground cables to exceed the costs.
Specifically, assume that a decision was made to replace the existing transmission line route between South Morang and the Murray Power Station with underground cables. The benefits would exceed the costs if the likelihood of a bushfire occurring, similar to the Tatong bushfire, exceeded 47% per year. These calculations are presented in Table 3.1.
Given the risk of major disruption events like the Tatong bushfire is likely to be less than 47% per year, it is clear that installing underground cables for the length of the easement would not pass a CBA.
However, a more targeted approach of installing underground cables in the parts of the easement at greatest bushfire risk may be economically feasible. Analysis by Insurance Australia Group (IAG) indicates that about 11% of the easement from South Morang to the Murray Power Station passes through forested areas with higher bushfire risk.
Assuming that focusing on these higher-risk areas would build enough resilience against events like the Tatong bushfire, it is estimated the benefits would exceed the costs if the likelihood of a similar event exceeded 5% per year. These calculations are presented in Table 3.3 (page 52).
A sensitivity analysis of this scenario is presented in Table 3.4 (page 52). The analysis shows that, using this approach, this measure is more likely to pass a CBA since a lower threshold is required to ensure that the investment breaks even.
3. The economic case for change – infrastructure projects
Box 8: Quantifiable costs and potential benefits of the Tatong bushfire
The potential benefits of laying the electricity cables underground are:
• Avoided costs/benefits of about $293 million per event. About $234 million is the cost of lost supply to customers and businesses, and $59 million is the cost of lost supply to public infrastructure
• Avoided vegetation management costs of around $769 per kilometre.
The cost of laying underground transmission cables is about $11 million per kilometre.
Using these numbers, a threshold level of risk can be calculated.

Building resilient infrastructure March 2016 51
3.1.4 Lessons learntThis case study suggests it can be economically feasible to build resilience into electricity transmission infrastructure where CBAs take risks into account. However, site-specific costing and scenario analysis is needed to confirm these results.
The study highlights some of the challenges of identifying options for resilience before a disaster event. It also emphasises the need for detailed risk assessment. While placing transmission lines underground for the entire easement is not economically feasible, there could be net benefits from targeting high-risk sections.
Further, the study shows that the broader community receives most of the benefits from more resilient infrastructure. As such, without appropriate incentives, infrastructure owners and operators are unlikely to invest in resilience beyond the minimum regulatory requirements. Adoption of the practical guidance in chapter five of this report will help to improve these incentives and ensure resilience options are evaluated as part of the economic appraisal process.
Table 3.1: Comparison of costs and benefits in complete replacement scenario – ~47% risk threshold
CBA component Costs (NPV, $m) Benefits (NPV, $m)
Installation of 340 km of underground cables (Up-front cost of $3.7 billion, calculated as $10.8 million per km x 340 km)
3,562 –
Increased reliability of supply to households and businesses (Average annual benefit of $110 million, calculated as $234m per event x 47.2% annual risk of event)
– 2,844
Increased reliability of supply for public infrastructure (Average annual benefit of $28 million, calculated as $59m per event x 47.2% annual risk of event)
– 711
Reduced vegetation management costs (Annual benefit of $0.26 million, calculated as $796 per km x 340 km)
– 7
Total 3,562 3,562
Source: Deloitte Access Economics (2016)
3. The economic case for change – infrastructure projects

52
Table 3.3: Comparison of costs and benefits in at-risk replacement scenario – ~5.1% risk threshold
Table 3.2: Sensitivity analysis for a 340-kilometre installation
Table 3.4: Sensitivity analysis for a 37-kilometre installation
CBA component Costs (NPV, $m) Benefits (NPV, $m)
Installation of 37 km of underground cables (Up-front cost of $399 million, calculated as $10.8 million per km x 37 km)
387 –
Increased reliability of supply to households and businesses (Average annual benefit of $12m, calculated as $234 million per event x 5.13% annual risk of event)
– 309
Increased reliability of supply for public infrastructure (Average annual benefit of $3 million, calculated as $59 million per event x 5.13% annual risk of event)
– 77
Reduced vegetation management costs (Annual benefit of $0.03 million, calculated as $796 per km x 37 km)
– 1
Total 387 387
Cost ($m) Risk threshold
$7.0 30.5%
$10.7 47.2%
$11.2 49.0%
$23.9 104.8%
Cost ($m) Risk threshold
$7.0 3.3%
$10.7 5.1%
$11.2 5.3%
$23.9 11.4%
Source: Deloitte Access Economics (2016)
Source: Deloitte Access Economics (2016)
Source: Deloitte Access Economics (2016)
3. The economic case for change – infrastructure projects

Building resilient infrastructure March 2016 53
3.2 Emile Serisier Bridge in New South WalesThe city of Dubbo sits at the intersection of two important motor freight corridors: the Newell Highway, which runs north–south, linking Queensland to Victoria; and the Mitchell Highway, which runs east–west, linking inland Australia to the NSW coast. Thus, Dubbo is a major motor freight hub. To pass through Dubbo, visitors must cross the Macquarie River. There are two primary motor vehicle bridges over the river: LH Ford Bridge,7 a high-level two-lane bridge; and Emile Serisier Bridge, a low-level four-lane bridge. About 20,000 vehicles use LH Ford Bridge each day, and about 15,000 use Emile Serisier Bridge (JL Kilby, 2013).
This case study highlights the importance of detailed risk assessments and evaluating options.
3.2.2 The impacts of repeated floodingThe Macquarie River is prone to flooding that usually lasts two to three days but can persist for up to two weeks. Because of its low level, the Emile Serisier Bridge has been flooded six times since it was built in 1987: three times in 1990 and once in 1998, 2000 and 2010. Once the river reaches flows of between 58,000 and 61,000 megalitres per day, the bridge is inundated and unusable (Pitt and Sherry, 2013).
The bridge deck stands at 257.6 metres on the Australian Height Datum (AHD), which roughly gives the average sea level in Australia, while the one-in-10-year flood level is 259.97 metres AHD. Thus, during a one-in-10-year flood, the bridge is more than two metres underwater. The interruption lasts until water falls below the deck level and debris can be removed.
Emre Serisier Bridge
Dubbo
LH Ford Bridge
Figure 3.4: Location of Emile Serisier Bridge in Dubbo and alternative route
Source: Google Maps (2015)
7. The low-level Troy Bridge also crosses the Macquarie River. However, it is an extremely small bridge not suited to through traffic and would be unusable in any situation in which the Emile Serisier Bridge is inundated.
3. The economic case for change – infrastructure projects

54
When the Emile Serisier Bridge is inundated, traffic must be diverted to the LH Ford Bridge, which can withstand a one-in-50-year flood. This creates a significant bottleneck since the LH Ford Bridge only has two lanes and already operates at more than 90% of its capacity during normal peak hours (Pitt and Sherry, 2013). During the flood in 2010, it took more than two hours to cross the river – a trip that typically takes 10 minutes. Such congestion imposes significant costs to Dubbo residents, visitors and through traffic.
A 2013 report by Pitt and Sherry, prepared for Dubbo City Council, documents the economic costs (including the cost of social impacts) that the 2010 floods and subsequent Emile Serisier Bridge closure imposed.
For example, services at the Dubbo Base Hospital, which caters for the greater regional area, were disrupted, especially for outpatients. Numerous school and university classes were disrupted, with many students staying home for the duration of the flood. Dubbo Buslines estimates that roughly 50% of its usual students stayed at home. Visitor numbers at the main shopping centre increased, as the central business district was inaccessible, but revenue at other shops declined. Residents stuck in traffic lost leisure and working time, and fire, police and ambulance services’ response times worsened.
Table 3.5: Flood impacts on infrastructure Table 3.6: Inundation levels of Dubbo bridges
Year Floods and bridge closure duration
Total days lost
1990 5 days in April, 3 days in July, 14 days in August
22
1998 2 days in August 2
2000 4 days in November 4
2010 13 days in December 13
41
Emile Serisier Bridge
LH Ford Bridge
Deck level (m AHD) 257.63 262.09
1-in-10-year flood (m AHD) 259.97 260.06
1-in-20-year flood (m AHD) 260.43 260.49
1-in-50-year flood (m AHD) 261.54 261.74
1-in-100-year flood (m AHD) 262.84 263.08
1-in-200-year flood (m AHD) 263.72 263.94Source: Pitt and Sherry (2013)
Source: Cardno Wiling (2010)Bold = bridge flooded
Tourism services were also affected. Dubbo’s leading tourist attraction, the Taronga Western Plains Zoo, lost about $170,000 of revenue due to floods. Local visitors were also affected, in part due to the difficulty of crossing the river – ‘An evening function during the flood was attended by 25 rather than the expected 150 people’ (Pitt and Sherry 2013).
Traffic increased the wage and fuel costs of the many freight businesses that pass through Dubbo. Time was lost and deliveries were delayed. Greenhouse gas emissions and other negative environmental externalities such as pollution would have worsened due to the heavy congestion.
3. The economic case for change – infrastructure projects

Building resilient infrastructure March 2016 55
Table 3.6: Inundation levels of Dubbo bridges
3.2.3 Other analysisA Pitt and Sherry report (2013) recommended duplicating the LH Ford Bridge at an estimated cost of $30 million. The duplication was compared to building a low-level bridge near Tamworth Street at a considerably cheaper cost of $10 million, conceivably funded by the council. This option was rejected because it failed to provide resilience to floods. The report estimated that duplicating the LH Ford Bridge had a benefit-cost ratio (BCR) of 6.6. The main potential benefit would be increased resilience to flooding, with reduction in day-to-day congestion a secondary benefit.
The benefits are likely to accrue to through traffic more than local residents. As such, it would be appropriate for the NSW or Australian government to contribute towards project funding. Since the report was published, the NSW Government has announced its intention to duplicate the LH Ford Bridge at a cost of $50 million (Baird, 2015).
Box 9: The importance of a holistic perspective
The Emile Serisier Bridge is a single section of the Newell Highway. Any study of the resilience of the bridge must consider the roads that feed it. Little would be gained by flood proofing the Emile Serisier Bridge if it simply moved the congestion from the area surrounding the crossing to another non-resilient section of the highway. It is therefore worth noting that sections of the Newell Highway north of the bridge are also susceptible to flooding (Cardno Wiling, 2010). Any plans to improve the resilience of the bridge would need to include Newell Highway upgrades.
3.2.4 Modelling the cost of resilience Deloitte Access Economics has estimated the cost of Emile Serisier Bridge closures due to flooding over the past 28 years and the estimated future costs if no changes or duplications were made to the bridges. The historical cost of the Emile Serisier Bridge’s closure due to flooding is estimated at around $17 million. The expected future cost, if no changes are made, is approximately $75 million.
This means that if the bridge had originally been built with appropriate resilience measures, the avoided costs would be approximately $92 million. In other words, the government could spend up to $92 million (in present value terms) to build a more resilient bridge and accompanying highway section and still yield a net benefit.
To provide some context, the estimated replacement cost is $7.4 million and the current written down value is $5.4 million. This suggests that the cost of the disruptions to date more than doubles the replacement value of the bridge. The cost of future disruptions is about 10 times more than the cost of replacement. Taking this into account, it is unlikely that flood proofing the bridge would cost $92 million in present value terms if the estimated replacement cost is $7.4 million.
In the analysis, the following assumptions were made:
• A discount rate of 3% was used for costs8, while traffic was assumed to grow at 3.5% per annum (the recent historical average [JL Kilby, 2013])
• The value of travel time savings (VTTS) was calculated by employing the standard used by Roads and Maritime Services
• Historical data was used for past flood events, and future flood events were assumed to continue at the historical rate.9
If the present and expected future benefits are considered, the expected cost of duplicating the LH Ford Bridge is $48 million in net present value terms. Against an avoided cost of $75 million, this suggests an ex-post BCR of at least 1.6. Using the cost estimate provided by the Pitt and Sherry report (2013) of around $30 million, this would suggest a BCR of 2.5.
8. Throughout the case studies, a 3% discount rate is used, as it was in the first Roundtable report. It represents the social discount rate of the expected benefits for infrastructure and other public projects. In Arrow et al. (2012), a discount rate schedule has been provided for different time horizons. For periods within the near future (that is, within years six to 25), a 3% marginal discount rate is appropriate.
9. This represents a conservative future rate: the past 28 years coincided with significant periods of drought, which likely reduced the frequency of flooding. The CSIRO expects that climate change, while decreasing average rainfall, will increase the future rate of floods due to increased climate volatility.
3. The economic case for change – infrastructure projects

56
3.2.4.1 LimitationsThis case study measured resilience benefits in terms of less traffic congestion during floods. Yet, duplicating the LH Ford Bridge has benefits outside of flood times too, including smoother traffic. There are also social benefits associated with resilience (discussed in Section 3.2.2) that are potentially significant, but not quantified due to the lack of data. Essentially though, they include social impacts that could have been avoided if the bridge did not flood, including:
• Disruption to fire, police and ambulance services’ response times
• Disruption to schools and universities
• Lost business due to lack of access
• Disruptions to leisure and working time.
Guidance on evaluating these social impacts can be found in the Roundtable report, The Economic Cost of the Social Impact of Natural Disasters (2016). If these benefits were included, the total net benefits from investing in resilience would be even greater than those presented here.
Further, this case study assumes that current risks will continue to apply in the future. Consequently, the BCR is likely to vary with a change to the risk of flooding and/or the predicted traffic flow. Detailed hazard assessment modelling is required to evaluate options for resilience.
Figure 3.5: Estimated flood costs
1988 1990 2000 2010
Historical flood costs = $16.9m
Estimated future flood costs:
2015 2044
$1.4m $1.8m $2.0m
$11.7m $74.9m
Source: Deloitte Access Economics (2016)
3.2.5 Lessons learntThe failure to properly consider flood resilience when planning the Emile Serisier Bridge has lead to significant avoidable costs. Even minor or short-term disaster impacts in a local area can be significant when considered over the life of the asset. This case study highlights the need to consider options for greater resilience in making investment decisions.
It is possible that flood risks were considered to some extent while the bridge was being planned, but appropriate evaluation was limited by a lack of flood data. Dubbo City Council had records of daily river flow levels from 2 May 1956 (Pitt and Sherry, 2013). Further, in 1978 (prior to the bridge’s construction in 1987), the Water Resources Commission (Cardno Willing, 2010) wrote a report on flood frequencies. Interestingly, the 1978 report contained significantly lower estimates of flood heights than later reports (Water Resources Commission 1979, cf. Cardno Willing, 2010). This may have led the council to underestimate the number of times the Emile Serisier Bridge would be inundated if built at a low level. In hindsight, it is evident that a greater investment in resilience would have been warranted.
This case study accentuates the importance of data and technical modelling capabilities to assess disaster risks and inform investment decision-making.
3. The economic case for change – infrastructure projects

Building resilient infrastructure March 2016 57
3.3 Communications infrastructure in QueenslandIn January 2011, major flooding occurred in the Brisbane River catchment, most severely in the Lockyer Creek and the Bremer River catchments. The flooding caused the loss of 23 lives in the Lockyer Valley, and thousands of properties were inundated in metropolitan Brisbane and its surrounds. Insurers received some 56,200 claims, with payouts totalling $2.55 billion (2011 prices).
The flooding had a major impact on telecommunications infrastructure owned and operated by Optus. Mobile services began to experience disruptions from 11 January in the Brisbane metropolitan area and were largely restored by 14 January. Some disruptions continued until 24 January, when services were fully restored.
This case study highlights the response from Optus and the potential benefits of resilience measures it has since adopted. It retrospectively analyses the cost of the event and examines the benefits in terms of costs that could be avoided through implementing resilience measures (that is, it assumes the economic costs of the flood could have been avoided). Like previous case studies, it illustrates the potential benefits of implementing additional resilience measures.
3.3.1 Optus’ response to the Brisbane FloodsThere were several of business challenges faced by Optus during the 2011 floods. The company responded to the crisis in two main phases.
Rescue and secure phase
Optus’ telecommunications services played a key role in assisting with the immediate aftermath of the flooding. Optus joined the command centre set up by the Queensland Government to support the initial response efforts and help the government make more informed decisions. Optus supported rescues by identifying, through people’s technology, who was missing and who was just out of touch. Following the crisis, Optus continued to be involved in the command centre.
Given the magnitude of the crisis, Optus needed to quickly shift and coordinate resources. It mobilised a crisis committee to directly manage the response and implement the structured escalation system. Further, it used the National Operations Centre to coordinate on-the-ground actions.
The need for coordination was emphasised by three major events:
• Flooding and loss of life in the Lockyer Valley – Optus was involved in finding and helping survivors when communications were down. An important part of the initial response was establishing satellite mobile base stations at refuge centres to enable families to communicate. Optus also deployed crews into the valley to raise a hub site
• Severing of underground cables – Due to the violent movement of water and debris, a major underground line carrying all bandwidth and telephony in and out of Queensland was severed. To manage this, Optus redirected some of its usual traffic to other parts of the Optus network. In attending to the severed cable, staff members had to enter into a coronial area – that is, an area where a number of deceased people were located. This had a significant emotional impact on those employees
• Brisbane central business district flooding – Eventually the flood moved downstream to Brisbane city, which had a significant impact on Optus’ infrastructure. At its peak on 11 January, 175 mobile nodes experienced outages and 150 remained down by 13 January.
Optus coordinated resources from across Queensland and other states to manage the crisis. For example, all installation engineers from NSW and Queensland were deployed to affected areas to restore telephony and fibre infrastructure. This had a flow-on effect for other parts of the Optus business, including customer service delays.
3. The economic case for change – infrastructure projects

58
Restoration phase
The second phase of the crisis response involved re-establishing services. Optus deployed engineers and network experts to restore mobile nodes and optic fibres in affected areas. The restoration phase also involved restoring damage to backup systems, ensuring emotionally affected employees received
3. The economic case for change – infrastructure projects
A community outpost staged at the local pub. The community of Murphy’s Creek was isolated from all communications during the disaster so Optus deployed a SatCat mobile base station to provide communications and support for a number of weeks. (Optus)
Optus engaged the resources of a Helicopter Charter company to transport a 5km drum of cable to repair and reconnect the Optus Network as soon as the water receded. (Optus)
support and implementing the resilience measures described in this report.
The communications outage placed lives and livelihoods at risk. While it did not lead to loss of life, it did create a critical and highly emotional situation. It had a major impact on families and communities unable to contact loved ones.

Building resilient infrastructure March 2016 59
3.3.2 Implementation and cost of resilience measuresOptus implemented several resilience measures in response to the flood, including:
• Raising equipment rooms at low-lying flood-prone sites (six sites have been lifted above the one-in-100-year flood line)
• Moving alternating current (AC) power feeds to higher levels in buildings
• Improving the battery capacity of electricity main supply (from four hours to eight hours)
• Replanning critical radio links to build redundancy paths.
These resilience measures are designed to prevent outages on the mobile network in the event of a major flood similar to the one in 2011. Table 3.7 summarises the costs of each of these measures.
The total cost of the resilience measures is estimated at between $3.4 million and $5.4 million.
3.3.3 Potential benefits of the resilience measuresThe potential benefits of implementing additional resilience measures are estimated in terms of the avoided replacement costs and the avoided lost economic surplus. It assumes that similar risks for this event apply in the future – that is, it is roughly a one-in-30-year event.
Avoided replacement costs
More resilient infrastructure is less likely to need replacement if a major flood occurs. This creates a benefit from avoiding the cost of replacement. According to Optus, the cost of replacing communications infrastructure after the 2011 floods was $1.1 million in the Brisbane metropolitan area.
Weighting these costs by the frequency of flooding (that is, 11 major floods in 171 years for Brisbane), and assuming a 3% discount rate, it is estimated the expected avoidable replacement costs for Brisbane could be about $70,000 per year or an expected cost of about $2.3 million in perpetuity.
Avoided lost economic surplus
The outage from the floods also resulted in lost economic surplus. This loss consists of: loss of customer capacity to communicate via Optus networks, and a loss of profits for Optus.
To calculate consumer surplus, two annual comm-unication reports from the Australian Communications and Media Authority were used. These included an approach to estimate consumer surplus from telecommunications services and allowed us to make similar estimates for Optus customers in Brisbane.
To calculate producer surplus, it was assumed that this is represented by profits. According to IBISWorld (2015), 13% of telecommunications revenue is retained by businesses as profits. Weighting this profit by population share, it is estimated that Optus made about $200,000 of profit per day in Brisbane in 2010–11.
For each day the communications network was out of service, there was an estimated loss of about $800,000 in consumer surplus for Optus customers in Brisbane and $200,000 in profits for Optus per day. Assuming a three-day outage, this suggests a total loss of $3.1 million in economic surplus in 2011.
Table 3.7: Cost of Optus resilience measures
Measure Cost per site Number of sites affected
Total cost ($m)
Improving battery capacity
$5,000–$10,000 175 $0.88–$1.75
Raising equipment rooms
$50,000–$100,000 6 $0.30–$0.60
Moving AC power feeds to higher levels in buildings
$5,000–$10,000 175 $0.88–$1.75
Replanning critical radio links to build redundancy paths
$7,500 175 $1.31
Total $3.4 – $5.4
Source: Optus
3. The economic case for change – infrastructure projects

60
3.3.4 SummaryOverall, the benefits of resilient infrastructure implemented by Optus are estimated to be at least $4.2 million, compared to the costs of these measures which is between $3.4 million and $5.4 million. This suggests that, for the benefits to exceed the cost, the annual probability of a similar event must be greater than 2.4%, and above 3.9% if the costs are at the higher estimate. Table 3.8 presents a summary of the results.
Table 3.8: Costs and benefits of resilient communications infrastructure in Brisbane ($m)
Benefits Costs
Avoided replacement costs $1.1
Avoided lost economic surplus $3.1
Total avoided costs $4.2
Cost of resilience measures $3.4 – $5.4
Risk threshold to break even 2.4% –3.9%
Source: Deloitte Access Economics (2016)Box 10: Costs of managing an outage
By implementing more resilient infrastructure, Optus would also avoid the costs associated with managing a network outage.
According to a survey by Heavy Reading (2013), mobile operators spend about 1.5% of annual revenue on managing outages. In its sample, each operator reported five outages in a year, lasting between one and two hours. This suggests that, on average, each outage costs 0.3% of annual revenue.
The study looked at costs including:
• Suspension of the ability to capture revenue from a billable service
• Operational expenses to fix the problem (including staff overtime and impacts on other projects)
• Refunds to customers
• Subsequent increases in the rate of subscriber churn
• Forgoing future revenue due to damage to brand reputation
• Legal costs relating to meeting service-level agreements
• Contingency-related expenses.
However, it is unclear which of these costs are included in the Heavy Reading (2013) estimates.
A typical outage costs about 0.3% of annual revenue. The duration of the outage in 2011 was 72 hours and the Queensland floods were roughly a one-in-30-year event, thus the cost of managing the outage is $1.7 million in perpetuity.10 This figure is likely to be larger however, as the outage lasted 72 hours, not between one and two hours as per the Heavy Reading study. Comparing this cost to the benefits listed above, the risk threshold is around 2.8% and as low as 1.7%. This equates to a one-in-50-year event.
This suggests that Optus’ costs of managing this outage may be significantly larger than simply the lost producer surplus.
This estimate is conservative, as it does not consider the avoided costs of managing an outage, the reduction in damages associated with early warning systems, or the avoided insured losses and social impacts. It also highlights that, though the costs are concentrated, the benefits are more widely spread – in this case most of the benefits flowed to users of the Optus mobile network.
Source: Deloitte Access Economics (2016)
10. This figure apportions Optus’ revenue by Brisbane’s population, and is then weighted according to the frequency of the event. It assumes that each outage lasts between one and two hours.
3. The economic case for change – infrastructure projects

Building resilient infrastructure March 2016 61
3.3.5 Lessons learntOptus has spent approximately $1.2 billion annually on infrastructure since 2001. This makes it one of the largest ongoing investors in infrastructure nationally. Thus, Optus has a strong interest in ensuring infrastructure is resilient. Following the crisis, Optus noted a number of key lessons for infrastructure providers:
• Ongoing coordination between assets is critical – In managing the crisis, Optus experienced the interdependency of different types of infrastructure. For example, broadband services depend on a constant power source to function. Communications fibres are commonly attached to a bridge to cross a river, making communication services reliant on the bridge resilience. Thus, it is important to consider resilience from a holistic perspective
• Proactively plan for resilience – As climate risks escalate, the frequency of natural disasters will increase. Natural disasters significantly drain company resources, with flow-on effects for service delivery. Therefore, it is increasingly important to proactively plan for them. Optus is now working with the Commonwealth Scientific and Industrial Research Organisation (CSIRO), and using its climate models to revise engineering specifications to better reflect the increased risk of natural disasters
• Raise the awareness of other utility providers and governments – Given the increased interdependency of infrastructure providers, it is important that all stakeholders understand the benefits of resilience and the risks of not adopting resilience measures.
3.4 SummaryThe case studies highlight the potential benefits of adopting resilience measures, if they are implemented correctly. However, careful analysis of the risks associated with the region and the potential resilience options is required.
Overall, the case studies suggest that:
• There is a need to thoroughly analyse the natural disaster risks associated with new infrastructure projects. This should occur before the infrastructure is constructed since poor decision-making can result in costly repairs and/or retrofits. This is highlighted by the Emile Serisier Bridge case study
• Careful analysis is needed to ensure optimal decisions. The Tatong bushfire case study shows that, while putting electricity lines underground across the whole region is costly, implementing resilience measures in specific locations where risk is concentrated may ensure that the benefits exceed the costs
• It is important to analyse the available options to improve resilience following a natural disaster. Assuming the current measures are effective, the communications case study indicates the resilience measures Optus adopted will yield significant benefits
• Investors must carefully consider uncertainty surrounding costs, benefits and the probability of natural disasters. These play important roles in determining the feasibility of a resilience measure.
The case studies suggest there are significant economic benefits associated with resilience measures. The difficulty lies in appropriately assessing hazard risks and in evaluating cost-effective options to enhance resilience in terms of avoided disaster costs.
While there is a clear case for resilience, there is also a need to improve the availability of information and best practice approaches and to expand technical capabilities for considering resilience in infrastructure decision-making. Further, policies must be changed to develop and implement appropriate incentives for investors to evaluate resilience options, even when they may have a greater initial cost. This could be inclusion of criteria to demonstrate the consideration of resilience within project appraisal frameworks, or funding mechanisms that recognise the distribution of resilience benefits to the broader community.
3. The economic case for change – infrastructure projects

62
Cost of restoring essential public assets to governments of all levels between
2002-2003 and 2010-2011
$
bn

Building resilient infrastructure March 2016 63
Chapter 3 explored the case for change at a project level and demonstrated the potential for better economic outcomes where resilience is considered up-front in planning and approval processes for new infrastructure. This chapter considers the benefits of considering resilience up-front at a national level, specifically by reducing the costs of replacing infrastructure following natural disasters.
It is projected that about $1.1 trillion will be invested between 2015 and 2050 in new critical infrastructure across Australia in present value terms (see Section 4.2). We estimate that about 1.6%, or about $17 billion in present value terms, of this will be needed to rebuild critical infrastructure following natural disasters.
Better resilience planning could reduce rebuilding costs as well as reduce the cost of infrastructure service losses, thereby strengthening vulnerable communities when natural disasters occur.
4.1 ApproachIndividual infrastructure projects face unique challenges and specific costs, based on their location, the proximity of communities, their risk exposure and the technical feasibility of different resilience options. Recognising that the net benefits of making infrastructure resilient to natural disasters will vary in each case, this report takes a top-down approach to estimate the magnitude of total rebuilding costs between now and 2050 if resilience is not embedded into infrastructure decision-making.
4. The economic case for change – national infrastructure investment
Key points
• If resilience is not improved, an estimated $17 billion will be spent rebuilding critical infrastructure after natural disasters between 2015 and 2050
• While this is only a small proportion of total annual infrastructure investment, these costs can be reduced by embedding resilience into infrastructure decision-making processes
• The cost of replacing damaged assets is comparable to the entire cost of establishing other large infrastructure projects. For example, the Inland Rail Project and the Sydney Rapid Transit Project are estimated to cost $10 billion each
• Rebuilding costs are only part of the costs incurred when infrastructure is damaged by natural disasters. Infrastructure service losses can be costly too and add further to the case for building resilient infrastructure based on sound cost-benefit analysis
• Resilient infrastructure is critical in supporting communities to withstand, respond to and recover from the potentially devastating impacts of natural disasters.
This process has involved:
• Identifying total infrastructure investment in Australia
• Estimating how much of this expenditure to is spent rebuilding damaged infrastructure after natural disasters
• Projecting the profile of investment and rebuilding expenditure out to 2050.
This section outlines this approach, with further detail on the methodology in Appendix E.
4.2 Infrastructure investmentAnnual investment in building critical infrastructure in Australia is substantial. In the past decade, spending on critical infrastructure accounted for between 3% and 5% of gross domestic product (GDP), which was valued at $62 billion in 2014–15 (Chart 4.1).
This includes public and private sector expenditure on infrastructure types including:
• Transport infrastructure: roads and highways, bridges, railways and harbours
• Critical services infrastructure: water storage and supply, sewerage and drainage, electricity transmission and distribution, pipelines and telecommunications
• Buildings associated with education, aged care, health and transport.

64
The breakdown of expenditure across these infrastructure types in 2014–15 is presented in Chart 4.2. Depending on community needs, the share of investment allocated across these areas varies year to year.
Assuming that total infrastructure spending will increase in line with real GDP growth over time, it is projected that about $142 billion a year will be spent on infrastructure by 2049–50. In present value terms, the value of total investment in infrastructure over this period is estimated to be about $1.1 trillion.
4.3 Infrastructure rebuilding costs following natural disasters Analysing data from National Disaster Relief and Recovery Arrangements indicates that restoring essential public assets costs governments at all levels about $4 billion between 2002–03 and 2010–11 (Chart 4.3), or an average of more than $450 million a year.
This indicates that government spending on rebuilding infrastructure damaged by natural disasters accounts for about 1.6% of total public infrastructure spending, based on a historical average.
If this ratio remains constant and applies similarly to private sector investment, it can be estimated that of the $1.1 trillion projected future investment in essential infrastructure, about $17 billion will be spent on rebuilding critical infrastructure after natural disasters between now and 2050, in present value terms.
These projections are illustrated in Chart 4.4. As noted, the growth assumptions used in the scenario suggest this estimate may be conservative.
Share of GDP■ Private Investment
■ Public Investment
%
2001-02
1
0
2
3
4
5
6
2002-03 2003-04 2004-05 2005-06 2006-07 2007-08 2008-09 2009-10 2010-11 2011-12 2012-13 2013-14 2014-15Source: Deloitte Access Economics, derived from the Australian Bureau of Statistics (2015a; 2015b)
Chart 4.1: Annual investment in essential infrastructure as a share of GDP, 2001–02 to 2014–15
4. The economic case for change – national infrastructure investment
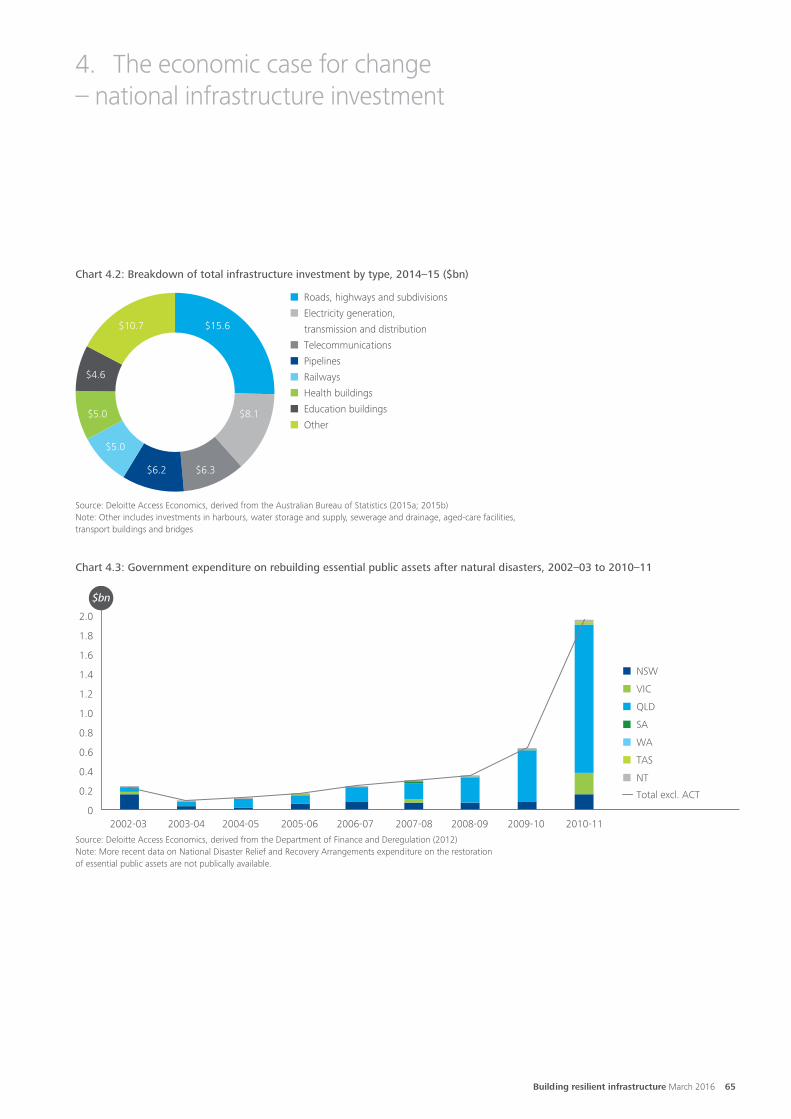
Building resilient infrastructure March 2016 65
Source: Deloitte Access Economics, derived from the Australian Bureau of Statistics (2015a; 2015b)Note: Other includes investments in harbours, water storage and supply, sewerage and drainage, aged-care facilities, transport buildings and bridges
Source: Deloitte Access Economics, derived from the Department of Finance and Deregulation (2012)Note: More recent data on National Disaster Relief and Recovery Arrangements expenditure on the restoration of essential public assets are not publically available.
■ Roads, highways and subdivisions
■ Electricity generation,
transmission and distribution
■ Telecommunications
■ Pipelines
■ Railways
■ Health buildings
■ Education buildings
■ Other
$15.6
$8.1
$6.3$6.2
$5.0
$5.0
$4.6
$10.7
0
0.2
0.4
0.6
0.8
1.0
1.2
1.4
1.6
1.8
2.0
2002-03 2003-04 2004-05 2005-06 2006-07 2007-08 2008-09 2009-10 2010-11
■ NT
Total excl. ACT
■ TAS
■ VIC
■ SA
■ WA
■ QLD
■ NSW
$bn
Chart 4.2: Breakdown of total infrastructure investment by type, 2014–15 ($bn)
Chart 4.3: Government expenditure on rebuilding essential public assets after natural disasters, 2002–03 to 2010–11
4. The economic case for change – national infrastructure investment

66
4.4 SummaryWhile $17 billion in rebuilding costs is only a small proportion of total annual infrastructure investment, there are opportunities to reduce these costs by embedding resilience into infrastructure decision-making processes. If building infrastructure with a greater level of resilience can lessen the cost of rebuilding infrastructure after natural disasters, this could free up funds to invest in other large infrastructure projects. For example, the estimated costs of the Inland Rail Project and Sydney Rapid Transit Project are about $10 billion each.
Furthermore, as demonstrated in the case studies in chapter three, investments in resilient infrastructure can deliver additional benefits not captured in the value of rebuilding costs saved.
Source: Deloitte Access Economics, derived from the Australian Bureau of Statistics (2015a; 2015b) and the Department of Finance and Deregulation (2012)
0
20
40
60
80
100
120
140
160
2015 2020 2025 2030 2035 2040 2045 2050
■ Other infrastructure investment■ Rebuilding investment$bn
Chart 4.4: Government expenditure on rebuilding essential public assets after natural disasters, 2002–03 to 2010–11
It is well recognised that community reliance on critical infrastructure services intensifies during and after natural disasters. Infrastructure service outages – the loss of electricity, transport routes or communications services – create costs to households, businesses and local economies. This has both immediate and long-term consequences – increasing risk to life and property and hindering the recovery phase.
Recognising and quantifying the value of uninterrupted essential infrastructure service provision help to ensure sufficient levels of resilience are built into this infrastructure, as part of the decision-making process. The following chapter identifies principles to help decision-makers consider resilience upfront in project planning and appraisal for new and replacement infrastructure.
4. The economic case for change – national infrastructure investment

Building resilient infrastructure March 2016 67
The Kholo Road and bridge over the Brisbane River, was seriously damaged by floodwaters, December 2010, Queensland. (Tim Marsden / Newspix)
Fires at Four Mile Creek, east coast Tasmania, December, 2006. (Raoul Kochanowski / Newspix)

68
Identify disaster risks
Apply robust methodologies for CBA
Strengthen approval processes
Embed ongoing monitoring resilience
Coordinate, centralise and make available critical
data and information
5 principles for infrastructure
planning

Building resilient infrastructure March 2016 69
Key points
• Moving towards a system in which resilience is integrated in the decision-making process for new infrastructure will be a long-term process and will require commitment from both industry and government
• A key opportunity to improve resilience is at the strategic planning phase of new infrastructure projects, including the CBA process used to assess the cost-effectiveness of options
To support this shift, this report recommends adopting:
• Practical guidance for practitioners to integrate resilience into the CBA process for proposed infrastructure
• A set of five principles to help decision-makers systematically include disaster resilience in infrastructure planning approval processes. These are :
1. Identify disaster risks
2. Apply robust methodologies for CBA
3. Coordinate, centralise and make available critical data and information
4. Strengthen approval processes
5. Embed ongoing monitoring of resilience.
Australian governments and businesses underinvest in resilience for new and replacement infrastructure. The case studies in chapter three showed that inconsistent approaches to considering resilience (including consideration at the discretion of private businesses or only in line with minimum building codes or land planning requirements) can have major economic and social implications when natural disasters occur. Along with the high-level analysis in chapter four, the case studies suggest that investment decisions would often change if disaster resilience were considered during the planning process.
A key opportunity to improve resilience is at the beginning of new infrastructure projects, specifically the CBA process used to assess options. While resilience should be part of infrastructure CBA (alongside other community costs and benefits), the inclusion of natural disaster risks and options for resilience appears to be lacking or incomplete in most cases. There are various reasons why.
5. Practical guidance for decision-makers
This report has revealed systematic limitations that impede decision-makers from assessing options for greater resilience, in terms of their capacity and incentives. The limitations include:
• Limited references, if any, to disaster resilience in existing guidelines for CBA of planned infrastructure. Also, there is no guidance on ‘how’ natural disaster risks can be appropriately considered in a CBA framework
• Significant data requirements for assessing disaster risks, and options for resilience, with the expertise required for such analysis often dispersed across multiple agencies
• Limited references to resilience in tertiary education beyond its inclusion in building codes and regulations. This potentially limits technical capacity to identify disaster risks and propose innovative options for resilience
• Complex cross-jurisdictional mechanisms for approving projects, funding and owning of infrastructure
• Government appraisal mechanisms providing no requirements for project proposals to assess disaster risks or take action to mitigate these through evaluating resilience options.

70
Moving towards a system in which resilience is considered up-front in the project proposal and decision-making processes for major infrastructure investments will be a long-term process and will require commitment from both industry and government. As illustrated in Figure 5.1, it will require effective coordination of data, research and decision-making processes between a broad range of end-users with a wide range of roles, responsibilities and objectives.
Box 11: An appetite for change?
This report reinforces growing recognition of Australia’s critical need to safeguard infrastructure.
In May 2015, Infrastructure Australia released the first Australian Infrastructure Audit report. It found that maintenance and resilience were major themes, and that ‘Enhancing the resilience of assets will become more important for infrastructure providers as extreme weather events become increasingly likely to threaten certain assets’. The report found that:
• The number and intensity of extreme weather events are increasingly likely to threaten critical infrastructure. Repairing these assets, and enhancing their resilience, will require an increase in maintenance expenditure
• Infrastructure operations can be disrupted by a range of hazards, including natural disasters. It is critical to ensure infrastructure can continue operating through minor disruptions, and recover quickly from major disruptions.
Further, it argued that all parts of the infrastructure sector require some level of reform.
To support this shift, this report recommends the adoption of:
• Practical guidance for practitioners to demonstrate how resilience can be integrated into the CBA process for proposed infrastructure
• A set of five principles to help decision-makers (at all levels of government and in industry) to comprehensively integrate disaster resilience in the infrastructure planning, appraisal and approval processes.
Panoramic view of damage caused by the Black Saturday bushfires in Buxton, near the Acheron River Bridge, six months after the fires, Victoria. (Mike Keating / Newspix)
5. Practical guidance for decision-makers

Building resilient infrastructure March 2016 71
5.1 Guidance for practitionersThis section outlines the steps required to integrate resilience into a CBA assessment process. These steps are designed to be integrated with existing guidelines and CBA methodologies issued by the various jurisdictions governing infrastructure investment decisions, such as Infrastructure Australia’s Reform and Investment Framework – Templates for Use by Proponents and similar frameworks or manuals released by state governments (see Table 2.2). The steps reveal how disaster risks and options to improve resilience can be assessed for proposed infrastructure.
Australian Government
•Policy
•Investment incentives
•Building codes.
Decision making by end-users Making well informed decisions for the safety, resilience and productivity of communities
Foundational dataMulti-purpose base exposure and geographic data
Hazard dataHazard specific information on disaster risks
Impact dataImpacts of past disasters and value at risk
Research Leveraging data for interdisciplinary evidence-based research
State Government
As for Australian Government and:
• Emergency services
• Infrastructure planning
• Master planning.
LocalGovernment
• Land use planning
• Community awareness
• Mitigations investments.
Business
• Continuity of services and operations
• Sustainability of employment
• Protection of assets.
Community Groups
• Drive awareness
• Education initiatives,including preparedness training.
Individuals
• Protect safety of self, family and property
• Property purchase decisions.
Figure 5.1: Inputs for decision-making on infrastructure investments
Source: Australian Business Roundtable for Disaster Resilience & Safer Communities (2014)
5.1.1 Integrating resilience into CBAs for proposed infrastructureProposed infrastructure is usually well scoped before a detailed CBA is undertaken. The objectives and requirements for the infrastructure – in terms of type, location, function, timing and main benefits – are described and construction costs are roughly estimated. The CBA process is then used to conduct a detailed appraisal of project options that can best meet these requirements.
Acknowledging disaster resilience does not significantly change the CBA process that is applied to an infrastructure project. The overall approach to CBA remains the same, comparing one or more project options to a base case option, which is often defined as ‘business-as-usual’.
5. Practical guidance for decision-makers

72
Disaster resilience can be included in CBA as an additional benefit. This benefit is estimated for each project option in the CBA and then aggregated with other benefits and compared with costs. To add resilience benefits, natural disaster hazards need to be identified, and the potential savings (in terms of direct and indirect avoided disaster costs) need to be identified for each option.
A simple CBA process is defined in Table 5.1. Three additional steps for practitioners to integrate disaster resilience into CBAs have been highlighted.
5.1.1.1 Assess disaster hazardsHazard assessment requires information about the nature and likelihood of major hazards with the potential to affect proposed infrastructure. Some key examples in Australia include:
• Tropical cyclones
• Floods
• Severe storms
• Bushfires
• Earthquakes
• Tsunamis
• Sea level rise.
Hazard assessment should identify all characteristics that may influence the physical infrastructure and the service it provides, including the timing, frequency, duration and intensity of hazard events. For CBA, this information should be used to determine a probability weighting for a hazard event based on the likelihood of the event exceeding a certain intensity in a given year. Characterising hazards in this way is typically data-intensive.
For example, bushfire hazards can be influenced by weather conditions (such as wind, temperature and humidity), prevalence of drought and fuel load (such as vegetation density and type) and landscape topography, among other factors. Bushfire hazard assessment therefore relies on complex geospatial modelling to establish the probability of an event occurring at a certain intensity.
Appendix F provides further details on best practices for hazard assessment.
Table 5.1: Adapting infrastructure CBA processes
Steps Description
1. Profile infrastructure requirements
Predetermined objectives and scope of the proposed infrastructure project (e.g. function, location, estimated budget and timing)
2. Specify a base case Usually a business-as-usual option
3. Assess disaster hazards Determine the potential disaster hazards and their probability of occurrence
4. Identify project options Develop a series of options for infrastructure
4a. Identify resilient project options
Include options for infrastructure with greater resilience to natural disasters
5. Estimate the costs and benefits of each option
Estimate the costs and benefits of each project in present value terms
5a. Estimate resilience benefits
Include ‘avoided disaster costs’ as a measure of resilience benefits
6. Identify preferred option Compare costs and benefits to identify a preferred option
5. Practical guidance for decision-makers

Building resilient infrastructure March 2016 73
5.1.1.2 Identify resilient project optionsWhere disaster hazards are identified, practitioners should scope potential options to strengthen resilience. These may include options to reduce the costs associated with disasters by:
• Reducing the infrastructure’s exposure to disaster hazards: For example, relocating infrastructure away from areas susceptible to hazards, such as roads in areas less prone to flooding
• Reducing the infrastructure’s vulnerability to disaster hazards: For example, changing infrastructure design or materials to reduce the severity of impacts, such as shifting transmission lines underground in areas prone to bushfires
• Reduce the impact of disaster hazards on infrastructure: For example, introducing early warning, evacuation and/or contingency systems for emergency responses during service losses, such as informing customers of expected network outages.
During this step, a range of resilience options may be qualitatively scoped with viable options then specified for detailed CBA.
5.1.1.3 Estimate resilience benefitsFor each project option, a potentially large set of costs and benefits should be quantified. In addition to these, the resilience benefits of each option should be estimated. The total resilience benefits of each project option can be estimated in terms of the total avoided disaster costs. That is:
As disaster costs only arise when a natural disaster occurs, resilience benefits depend on the probability of a disaster occurring. As such, estimated disaster costs are multiplied by the probability weighting of each hazard to estimate an annual average cost. These costs are then discounted (as per other costs and benefits) to estimate resilience benefits in present value terms.
For disasters expected to occur very infrequently, such as a one-in-100-year flood, the estimated resilience benefits will be smaller when averaged on a per-year basis. Reliable hazard assessment is therefore essential to ensure resilience benefits are not overstated.
For infrastructure project appraisal, disaster costs that are common between project options need not be estimated as they have no bearing on which is the most beneficial. That is, the broad costs associated with natural disasters (such as loss of property, loss of livestock and death) need not be estimated unless they are a direct consequence of infrastructure damage.11
A detailed approach to monetising resilience benefits is in Appendix G, including an example of how this could be incorporated into Infrastructure Australia’s Template for Stage 7 (Transport Infrastructure).
Table 5.2: Disaster cost components
Avoided disaster costs
Direct impacts • Avoided infrastructure damage
Indirect impacts • Avoided household costs• Avoided commercial costs• Avoided emergency
response costs• Avoided social costs (such as
inconvenience and stress)
Source: Deloitte Access Economics (2016)
11. For cases where overall natural disaster impacts are relevant, such as in comparing policy options for disaster resilience, a detailed methodology for CBA is included in Building our Nation’s Resilience to Natural Disasters.
5. Practical guidance for decision-makers
Resilience benefit = Avoided disaster cost = Base case disaster cost – Project option disaster cost
Disaster costs include both the direct impacts of infrastructure damage (replacement costs) and the indirect impacts of infrastructure damage (including the economic cost of social impacts associated with service outage). These are likely to vary in the base case and for each infrastructure option. A summary of potential benefits is included in Table 5.2, with further detail for each component described in Appendix G.

74
5.2 Principles for infrastructure planningIn addition to practical steps for measuring resilience, broader institutional change is needed to embed resilience into infrastructure planning and investment decisions. The following five principles have been developed to facilitate this change. In light of the high cost of natural disasters to the economy, proactively integrating resilience by adopting these principles can reduce costs as well as the broader socioeconomic impacts of natural disasters.
Infrastructure Australia has observed that while the main focus is still on economic considerations, there is an emerging trend where project proposals are placing focus on resilience issues too. This needs to be encouraged and supported by adopting the principles outlined here.
The principles can be applied across the breadth of jurisdictions involved in planning and appraising new infrastructure, as well as the private sector. The capacity to embed resilience can vary substantially between agencies however, potentially limiting their ability to maximise public net benefits. Each agency must review how the principles can be applied to their existing systems, as well as the roles they can play in contributing to greater cross-jurisdictional consistency.
The principles aim to change the way new infrastructure is planned and approved by businesses and governments by establishing appropriate frameworks, incentives and capabilities to include resilience in decision-making.
Figure 5.2: Principles for resilience in infrastructure planning
5. Practical guidance for decision-makers
1
2
3
4
5
Identify disaster risksDecision-makers should integrate a risk assessment requirement in project proposals to ensure disaster exposure, asset vulnerabilities and opportunities for hazard prevention or mitigation are identified from the outset.
Apply robust methodologies for CBAsDecision-makers should update CBA guidelines to include resilience benefits, following a robust and consistent approach.
Coordinate, centralise and make available critical data and informationGovernments and business should partner to pool data and information sources, through a national open data platform. This would increase the transparency and accessibility of the data required to measure resilience, and reduce the cost of assessing options.
Strengthen approval processesDecision-makers should strengthen requirements for resilience to be addressed in their appraisal processes. For example, a set of checkpoints in project approvals could ensure practitioners assess and disclose disaster risks and, where relevant, include them in CBAs.
Embed ongoing monitoring of resilienceDecision-makers should embed provisions to regularly monitor infrastructure resilience in response to expected climate variability and population demographics. The responsibility for monitoring resilience should be designated during the planning process.

Building resilient infrastructure March 2016 75
Principle 1: Identify disaster risks
A risk assessment process can help to determine at the outset if proposed infrastructure has any exposure to natural disaster risks, including bushfires, floods, storm surges, cyclones and earthquakes.
Government and business decision-makers should integrate a risk assessment requirement into infrastructure project proposals to ensure disaster exposure, asset vulnerabilities and, in turn, opportunities for hazard prevention or mitigation are identified.
More broadly, they should prioritise risk assessment in long-term strategic planning for infrastructure, particularly given the interdependency between assets and the need for a holistic perspective.
Assessing disaster risks involves identifying the likelihood of all hazards with the potential to affect infrastructure, the economy, people and/or the environment. The risk assessment should identify vulnerabilities that would make the proposed infrastructure more susceptible to damage from a disaster. Further, risk assessments should consider both direct impacts on infrastructure and indirect impacts such as delays, business interruption, financial losses, loss of customers and social impacts such as stress.
Principle 2: Apply robust methodologies for CBAs
Decision-makers need a robust and consistent methodology to analyse disaster risks and ensure infrastructure projects with the greatest community benefits are delivered.
Most jurisdictions use CBA to identify net benefits to the broader community, alongside other planning tools. However, resilience is treated inconsistently and, in most cases, inadequately within these CBAs.
CBA frameworks and guidelines should be updated to include resilience, following a common methodology. This will facilitate best practice approaches across all types of major infrastructure investments, regardless of their ownership.
Deloitte Access Economics has reviewed the information, data and analysis and developed a practical approach for practitioners to measure resilience (see section 5.1).
Principle 3: Coordinate, centralise and make available critical data and information
Assessing disaster risks and options for resilient infrastructure is a data-intensive process. Practitioners evaluating resilience require accessible and relevant data to undertake analysis and make optimal investment decisions. This includes:
• Foundational data on demographics, topography and weather
• Hazard data on disaster types and their likelihood to occur
• Impact data on potential and historical impacts.
As revealed in Building an Open Platform for Natural Disaster Resilience Decisions, the data currently available is dispersed between local, state and federal agencies and the private sector.
A number of proposals have recently emerged that look to improve the availability of data to simplify decision-making. The National Open Platform for Natural Disaster Information proposed by the Roundtable and supported by the Productivity Commission (2014) can support data sharing between agencies and practitioners, as well as ensure relevant information is available to end-users. Also, in December 2015, the Australian Government released a Public Data Policy Statement, committing to make non-sensitive data collected by government ‘open by default’. The Public Sector Data Management Project acknowledges that ‘By making the most of its data, the Commonwealth could grow the digital economy and improve people’s lives by transforming how policies and services are delivered’.
It is likely that a number of stakeholders will remain responsible for governing data collection and managing accessibility. For example, while commercial interests should be protected to encourage continued broadening of data collection, agencies should consider options for greater collaboration, transparency and accessibility.
5. Practical guidance for decision-makers

76
Principle 4: Strengthen approval processes
Without incorporating a mandatory checkpoint to assess disaster risk and evaluate resilience options incentives to prioritise resilience are likely to remain inadequate. In particular, practitioners may not fully scope resilience options or undertake the extra steps to assess resilience costs and benefits in economic terms. Policy change or introduction of funding mechanisms could ensure the positive externalities associated with resilience are considered and, where appropriate, pursued, even though the benefits might accrue to other stakeholders.
Decision-makers should consider implementing mechanisms to ensure resilience is considered in economic assessment and project prioritisation processes. At a minimum, funding applications should disclose the identified disaster risks and how they influence proposed infrastructure. Where high-risk hazards are identified, jurisdictions should include further checkpoints in their appraisal processes. These can serve to ensure mitigation options are identified and the benefits of resilience (in terms of avoided disaster costs) are quantified in the economic assessment processes (including CBA).
Principle 5: Embed ongoing monitoring of resilience
The vulnerability of infrastructure to natural disasters is expected to change as it ages and through climate variability and population demographics. Further, changes in knowledge, information or data availability may influence our understanding of the nature of hazards or the susceptibility of infrastructure.
For these reasons, decision-makers should make provisions to regularly monitor infrastructure resilience, alongside planned maintenance. Responsibility for monitoring resilience should be clearly delegated when a project is approved.
5. Practical guidance for decision-makers

Building resilient infrastructure March 2016 77
A chinook helicopter with supplies flies over houses affected by flood waters on January 6, 2011 in Rockhampton, Australia. Floodwaters peaked at 9.2 metres in the central Queensland city, preventing residents from returning to their homes. The Queensland flood crisis resulted in ten deaths and affected more than 200,000 people across an area as large as France and Germany combined.(Jonathan Wood / Getty Images)
People trapped on the Carpendale side of Lockyer Creek survey damage to the bridge after floodwaters from Toowoomba in Queensland caused flash flooding between Helidon and Grantham, after heavy rains caused widespread flooding across the region. (Aaron Francis / Newspix)

78
Recommendations to build resilience into essential infrastructure across Australia
Improve decision-making processes
Improve incentives
Improve capacity

Building resilient infrastructure March 2016 79
Key points
This report makes three recommendations to build resilience into critical infrastructure across Australia:
1. Improve infrastructure planning processes: integrate resilience in government and industry decision-making by adopting the principles for resilience in infrastructure planning.
2. Improve incentives: prioritise policy changes and funding arrangements that ensure disaster resilience is considered and incorporated, where appropriate, into infrastructure planning.
3. Improve capacity: government and industry should work to strengthen the technical capacity of practitioners to identify, analyse and evaluate the costs and benefits of resilience options.
Decision-making processes for planning new infrastructure are complex, involving stakeholders with differing objectives, and the need to make trade-offs between objectives within budget constraints. Resilience is not consistently assessed during this process. The limitations currently lie in assessing disaster risks, profiling options for building greater resilience and measuring resilience benefits as part of the broader net benefits associated with infrastructure projects and revealed through detailed CBA. At least in part, this is because technical capabilities and incentives are not well established.
There is a clear economic imperative to consider resilience in the initial planning and approval processes for infrastructure investment. Government and industry incur significant costs in rebuilding infrastructure damaged by natural disasters – estimated at $17 billion in present value terms between 2015 and 2050. There are also major flow-on impacts to businesses and communities that rely on infrastructure services disrupted due to natural disasters.
This report makes three recommendations that target specific gaps in the current decision-making framework.
These three recommendations are complementary. Action in all three areas – planning processes, incentives and capacity – is required to achieve the change that will benefit communities across Australia. This will require a joint effort from government and industry.
6. Recommendations
Improve infrastructure planning processes: integrate resilience in government and industry
decision-making by adopting the principles for resilience in infrastructure planning
This report identifies that, while the importance of resilience is recognised in policies and strategies in Australia and internationally, there are limited tools and a lack of requirement to incorporate resilience into decisions about infrastructure, including as part of cost-benefit analysis (CBA). Only three of the 12 Australian CBA guidelines reviewed refer to resilience. With the exception of Queensland’s guideline to measure the benefits of flood proofing transport infrastructure, there are no explicit guidelines for valuing the benefits of improved infrastructure resilience.
This report’s case studies illustrate there is probably several cases in which considering resilience during the CBA for proposed infrastructure would result in changes to the specifications (including scope, location, design and/or materials). Evaluating options for resilience is an opportunity for investments to become more cost-effective and contribute to greater long-term community benefits. This finding is consistent for both major networks of infrastructure assets (such as telecommunications or electricity) and localised assets (such as a bridge).
1
80
This suggests that Australia needs stronger requirements and tools to embed resilience in infrastructure decision-making and the relevant CBA processes. Notably, this presents opportunities to reduce the costs associated with natural disasters (expected to become more frequent and intense in future decades) by reducing the impacts on the infrastructure that underpins the economy.
The resilience principles presented in chapter five are designed to support decision-makers to consistently and adequately include resilience in planning and approval processes. The principles are:
1. Identify disaster risks
2. Apply robust methodologies for CBA
3. Coordinate, centralise and make available critical data and information
4. Strengthen approval processes
5. Embed ongoing monitoring of resilience.
This report recommends that all levels of government and industry adopt these principles to facilitate this shift. A consistent approach across all stakeholders will ensure resilience becomes a mainstream component of infrastructure investment decisions, improving the ability of these investments to provide essential services in Australia.
Improve incentives: prioritise policy changes and funding arrangements that ensure disaster
resilience is considered and incorporated, where appropriate, into infrastructure planning
Building infrastructure with greater resilience is typically associated with higher up-front costs. In many cases, costs are borne by private investors while the benefits accrue to the community more broadly. This includes both the additional cost of building in resilience and the cost of undertaking an economic impact analysis to justify the benefits of doing so. Government should thus provide appropriate incentives for business to consider resilience in the investment planning process.
Even government-funded infrastructure projects have competing requirements and priorities, including budgetary constraints. Strong leadership, coordination and incentives are therefore required to ensure project appraisal processes adequately consider disaster risks and identify cost-effective opportunities for resilience.
This report recommends that all levels of government update project appraisal frameworks to include criteria to demonstrate appropriate consideration of resilience. By adding these criteria, governments will be able to better demonstrate value for money and ensure infrastructure meets the needs of the Australian community. Industry will be motivated to consider resilience, despite the higher costs of doing so. Where appropriate, governments should also consider funding mechanisms that recognise the distribution of resilience benefits to the community.
As advocated in Building our Nation’s Resilience to Natural Disasters (2013), a National Resilience Advisor in the Department of Prime Minister and Cabinet could take a leadership and advocacy role in removing barriers to resilience requirements. The advisor could drive coordination between jurisdictions and accelerate progress towards building disaster resilience.
6. Recommendations
2

Building resilient infrastructure March 2016 81
Improve capacity: government and industry should work to strengthen the technical
capacity of practitioners to identify, analyse and evaluate the costs and benefits of resilience options
Significant improvements in technical capacity are required to embed resilience in infrastructure decision-making. Sophisticated and data-intensive analysis is required to model natural disaster risks in local areas, and quantify the benefits of resilient infrastructure using CBA.
This report has found limited tertiary training that covers resilience in infrastructure planning, design and appraisal. It appears Australia is underinvesting in the education necessary to ensure it is well placed to respond to and plan for natural disasters.
A long-term shift in awareness and capacity is required, through educating and upskilling government, business and community decision-makers. To this end, this report recommends investing in resilience education at the tertiary level and revising existing tools and guidelines to ensure practitioners consider resilience in infrastructure planning and CBA.
Applying the resilience principles requires access to the necessary data, information, tools and systems. However, as established in Building an Open Platform for Natural Disaster Resilience Decisions (2014), a number of barriers prevent practitioners from evaluating disaster risks and their implications. That paper called for a national open data platform to be established to facilitate greater access to information needed to assess disaster risks. Where data cannot be provided on an open platform, efforts should be made to improve the transparency and availability of relevant data and research.
Concluding remarks
This report extends the research program of the Australian Business Roundtable for Disaster Resilience & Safer Communities, demonstrating why and how resilience should be included in decision-making processes for new investments in infrastructure.
This report’s recommendations address the gaps in the current decision-making environment – adopting principles for embedding resilience in infrastructure decision-making, improving incentives to apply these principles, and investing in capacity building to ensure these principles can be applied.
This reaffirms the recommendations made in Building our Nation’s Resilience to Natural Disasters (2013) and Building an Open Platform for Natural Disaster Resilience Decisions (2014), particularly in terms of the need for national coordination of pre-disaster resilience, an efficient and open platform for foundational data, the removal of barriers to accessing data and research, and the prioritisation of investments in resilience. Implementing this report’s recommendations will also reduce the significant social impacts that natural disasters impose on communities, as quantified in The Economic Cost of the Social Impact of Natural Disasters (2016).
Natural disasters are expected to continue to affect Australia and our way of life over the next century and beyond. There remains potential to ensure our significant investment in new and replacement infrastructure takes these disaster risks into account and exploits opportunities for greater resilience. Embedding resilience in infrastructure decision-making will improve the cost-effectiveness of infrastructure spending and, more importantly, mitigate the devastating and costly impacts of disasters for businesses and communities that depend on critical infrastructure services.
6. Recommendations
3

82
100 Resilient Cities 2016, About Us, www.100resilientcities.org/about-us#/-_/
Asian Development Bank 2013, Investing in Resilience: Ensuring a Disaster-Resistant Future, www.adb.org/sites/default/files/publication/30119/investing-resilience.pdf
AusNet Services 2015, Electricity Distribution Price Review 2016–20
Australian Broadcasting Corporation 2011, Flood costs tipped to top $30b, www.abc.net.au/news/2011-01-18/flood-costs-tipped-to-top-30b/1909700
Australian Building Codes Board (ABCB) 2015, National Construction Code, services.abcb.gov.au/NCCOnline/Publications/2015
Australian Bureau of Statistics (ABS) 2015a, Building Activity, Australia, Jun 2015, Catalogue No. 8752.0, www.abs.gov.au/ausstats/[email protected]/mf/8752.0
– 2015b, Engineering Construction Activity, Australia, Jun 2015, Catalogue No. 8762.0, www.abs.gov.au/ausstats/[email protected]/mf/8762.0
Australian Communications and Media Authority 2008, Communications Report 2007–08, acma.gov.au/webwr/_assets/main/lib310777/chptr_6_07-08_comms_report.pdf
– 2009, Communications Report 2008–09, www.acma.gov.au/webwr/_assets/main/lib311252/chptr_7_comms_report_08-09.pdf
– 2011, Communications Report 2010–11, www.acma.gov.au/webwr/_assets/main/lib410148/communications_report_2010-11.pdf
Australian Energy Market Operator (AEMO) 2014, Value of Customer Reliability Application Guide, www.aemo.com.au/Electricity/Planning/Value-of-Customer-Reliability-review
– 2015, Electricity, www.aemo.com.au/Electricity
Australian Energy Regulator (AER) 2007, The events of 16 January 2007: Investigation Report
– 2013, SA Power Networks cost pass through application for vegetation management costs arising from an unexpected increase in vegetation growth rates
References
Australian Government 2010, Critical Infrastructure Resilience Strategy, www.emergency.qld.gov.au/publications/pdf/Critical_Infrastructure_Resilience_Strategy.pdf
– 2015a, National Climate Resilience and Adaptation Strategy, www.environment.gov.au/system/files/resources/3b44e21e-2a78-4809-87c7-a1386e350c29/files/national-climate-resilience-and-adaptation-strategy.pdf
– 2015b, Australian Government Public Data Policy Statement, www.dpmc.gov.au/sites/default/files/publications/aust_govt_public_data_policy_statement_1.pdf
Australian Parliamentary Library 2004, The Commonwealth Government’s Role in Infrastructure Provision, Research Paper No. 8 2003–04, www.aph.gov.au/About_Parliament/Parliamentary_Departments/Parliamentary_Library/pubs/rp/rp0304/04rp08
Australian Transport Council 2006, National Guidelines for Transport System Management in Australia
Building (Earthquake-prone Buildings) Amendment Bill 2013, 182–2, www.legislation.govt.nz/bill/government/2013/0182/latest/DLM5616102.html
Baird, M. 2015, Newell Highway Gets $500 Million Boost, media release, NSW Government
Business Council of Australia 2012, Policy Essentials: Cost-Benefit Analysis, www.bca.com.au/docs/FFAC5778-2D15-4933-9C29-65FD83338ECC/policy_essentials_cost_benefit_analysis_final_7-9-2012.pdf
– 2013a, Providing infrastructure, Action Plan for Enduring Prosperity #03
– 2013b, Managing the Economic Transition, Securing Investment in Australia’s Future
Cardno Willing 2010, Macquarie River, Dubbo Compilation of Flood Studies
Commonwealth of Australia 2014, Australian Government Response – Productivity Commission Inquiry Report into Public Infrastructure, www.infrastructure.gov.au/infrastructure/publications/files/productivity_commission_inquiry_report_into_public_infrastructure.pdf

Building resilient infrastructure March 2016 83
Commonwealth Scientific and Industrial Research Organisation (CSIRO) 2015, Climate Change in Australia: Projections for Australia's Natural Resource Management Regions, Technical Report, www.climatechangeinaustralia.gov.au/media/ccia/2.1.5/cms_page_media/168/CCIA_2015_NRM_TechnicalReport_WEB.pdf
Copenhagen Consensus 2012, Policy Options for Reducing Losses from Natural Disasters: Allocating $75 billion, www.copenhagenconsensus.com/sites/default/files/naturaldisasters.pdf
Council of Australian Governments (COAG) 2010, National Strategy for Disaster Resilience, www.coag.gov.au/sites/default/files/national_strategy_disaster_resilience.pdf
Deloitte Access Economics 2013, Building our Nation’s Resilience to Natural Disasters, report commissioned by the Australian Business Roundtable for Disaster Resilience and Safer Communities.
– 2014, Building an open platform of natural disaster resilience decisions, report commissioned by the Australian Business Roundtable for Disaster Resilience and Safer Communities.
– 2016, The Economic Cost of the Social Impact of Natural Disasters, report commissioned by the Australian Business Roundtable for Disaster Resilience and Safer Communities.
Department of Finance and Administration 2006, Handbook of cost–benefit analysis, www.finance.gov.au/sites/default/files/Handbook_of_CB_analysis.pdf
Department of Finance and Deregulation 2012, Review of the Insurance Arrangements of State and Territory Governments under the Natural Disaster Relief and Recovery Arrangements Determination 2011, Appendix F: Natural Disaster Relief and Recovery Arrangements (NDRRA) Review of Local Governments’ Submissions – 29 August 2012, Canberra.
Department of Treasury and Finance, South Australia 2014, Guidelines for the evaluation of public sector initiatives, www.treasury.sa.gov.au/__data/assets/pdf_file/0004/1768/ti17-guidelines-part-a.pdf
Department of Treasury and Finance, Victorian Government 2013, Economic Evaluation for Business Cases Technical guidelines, http://www.dtf.vic.gov.au/files/bad1e4dd-01e5-4cbe-99f0-a1e000de5f26/Economic-Evaluation-Technical-Guide.pdf
Department of Treasury and Finance, WA Government 2015, Program Evaluation, www.treasury.wa.gov.au/uploadedFiles/Treasury/Program_Evaluation/evaluation_guide.pdf
Diona Civil Engineering Contractors 2014, Project Summary: Holroyd to Rookwood Rd/Sydney Park to Haymarket 330 kV cable circuits, www.diona.com.au/files/ele_11_0221_transgrid_330kv_holroyd_to_rookwood.pdf
Ecofys Germany GmbH, University of Duisburg-Essen & Golder Associates Ireland 2008, Study on the comparative merits of overhead electricity transmission lines versus underground cables, prepared for the Department of Communications, Energy and Natural Resources, Ireland, www.soni.ltd.uk/media/documents/Projects/Publications/6-ECOFYS-Study-Final-report_June2008.pdf
Electricity Safety (Electric Line Clearance) Regulations 2005, Statutory Rule 74/2005
– 2010, Statutory Rule 47/2010 – 2015, Statutory Rule 67/2015
Emergency Management Victoria 2015, Critical Infrastructure Resilience Strategy, d1o5fm19p8kknj.cloudfront.net/wp-content/uploads/EMV-CIRS_Web1.pdf
Energy Safe Victoria 2010, Proposed Electricity Safety (Electric Line Clearance) Regulations 2010: Regulatory Impact Statement
Hill, M. 2009, Additional options for undergrounding and relocation of 132kV Subtransmission Lines, Lawson, ACT
IBISWorld 2015, IBISWorld Industry Report J5802 Wireless Telecommunications Carriers in Australia, July 2015
ICF Consulting 2003, Overview of the potential for undergrounding the electricity networks in Europe, prepared for the DG TREN/European Commission, ec.europa.eu/energy/sites/ener/files/documents/2003_02_underground_cables_icf.pdf

84
Infrastructure Australia (IA) 2013a, Better Infrastructure Decision-Making, infrastructureaustralia.gov.au/policy-publications/publications/files/PC_Submission_Attachment_D.pdf
– 2013b, Reform and Investment Framework – Templates for Use by Proponents, Stage 7
– 2015a, Australian Infrastructure Audit, infrastructureaustralia.gov.au/policy-publications/publications/Australian-Infrastructure-Audit.aspx
– 2015b, Australian Infrastructure Audit: Our Infrastructure Challenges: Report – Volume 1, infrastructureaustralia.gov.au/policy-publications/publications/files/Australian-Infrastructure-Audit-Volume-1.pdf
Infrastructure NSW 2012, NSW Government, State Infrastructure Strategy 2012–2032, www.infrastructure.nsw.gov.au/pdfs/SIS_Report_Complete_Print.pdf
Infrastructure Partnerships Australia 2011, Road Maintenance: Options for Reform, www.infrastructure.org.au/Content/RoadMaintenanceOptionsforReform.aspx
Infrastructure Sustainability Council of Australia (ISCA) 2014, IS Ratings Directory, www.isca.org.au/is-rating-scheme/ratings/rating-directory#
Intergovernmental Panel on Climate Change 2014, Fifth Assessment Report: Climate Change 2014: Impacts, Adaptation, and Vulnerability, www.ipcc.ch/pdf/assessment-report/ar5/wg2/WGIIAR5-Chap25_FINAL.pdf
International Federation of Red Cross and Red Crescent Societies 2012, The long road to resilience: Impact and cost-benefit analysis of community based disaster risk reduction in Bangladesh, www.ifrc.org/Global/Publications/disasters/reducing_risks/Long-road-to-resilience.pdf
Investor Group on Climate Change, National Climate Change Adaptation Research Facility, 2015, Investing through an adaptation lens: a practical guide for investors
Jeff Roorda and Associates 2010, The Local Roads Funding Gap, alga.asn.au/site/misc/alga/downloads/transport/LocalRoadsFunding.pdf
J L Kilby 2013, Western NSW Road Plan – Phase 2
Matanuska Electric Association (MEA) 2015, Underground vs overhead transmission lines, www.mea.coop/wp-content/uploads/2015/04/MEA-BRIEFING-Underground-vs-Overhead-Lines.pdf
Middelmann, M.H. 2007, Natural Hazards in Australia: Identifying Risk Analysis Requirements, Geoscience Australia, Canberra
Munich RE 2015, Bushfires in Australia – Australia on fire, www.munichre.com/australia/australia-natural-hazards/bushfires/bushfires/index.html
National Electricity Market Management Company (NEMMCO) 2007, Power System Incident Report: System Separation and Load Shedding 16 January 2007
Nous Group 2007, 16 January 2007 electricity supply interruptions in Victoria: What happened and why, Opportunities and recommendations, prepared for the Department of Primary Industries
– 2010, National workshop on rural electricity network options to reduce bushfire risk
National Academies 2012, Disaster Resilience: A National Imperative, www.nap.edu/catalog/13457/disaster-resilience-a-national-imperative
New South Wales Department of Premier and Cabinet 2013, Local Government Infrastructure Audit, www.olg.nsw.gov.au/sites/default/files/LIRSAudit-Report-June-2013.pdf
New South Wales Department of Treasury 2007, NSW Government Guidelines for Economic Appraisal, http://www.treasury.nsw.gov.au/__data/assets/pdf_file/0016/7414/tpp07-5.pdf
Office of Best Practice Regulation, Department of Prime Minister and Cabinet 2014, Cost–Benefit Analysis guidance notes, www.dpmc.gov.au/sites/default/files/publications/006_Cost-benefit_analysis.pdf
Orr, K. and Allan, B. 2015, National Electricity Transmission Lines Database, Geoscience Australia, Canberra, dx.doi.org/10.4225/25/553DC89AD105C
Organisation for Economic Co-operation and Development (OECD) 2014, Improving the Practice of Cost Benefit Analysis in Transport, www.internationaltransportforum.org/jtrc/DiscussionPapers/DP201101.pdf
ReferencesReferences
Building resilient infrastructure March 2016 85
Parsons Brinckerhoff 2012, Electricity Transmission Costing Study: An Independent Report Endorsed by the Institution of Engineering & Technology, renewables-grid.eu/uploads/media/Electricity_Transmission_Costing_Study_Parsons_Brinckerhoff.pdf
Pitt and Sherry 2013, Project Evaluation – An Additional Macquarie River Bridge at Dubbo, Final Report
Power and Water Corporation 2009, Proposed Transmission Line – Marlow Lagoon
Productivity Commission (PC) 2014, Natural Disaster Funding Arrangements, Inquiry Report No. 74, Canberra
– 2014, Public Infrastructure, Inquiry Report No. 71, Canberra
Public Safety Canada 2015, Canada’s Platform for Disaster Risk Reduction, www.publicsafety.gc.ca/cnt/mrgnc-mngmnt/dsstr-prvntn-mtgtn/pltfrm-dsstr-rsk-rdctn/index-eng.aspx
Public Service Commission of Wisconsin 2011, Underground Electric Transmission Lines, psc.wi.gov/thelibrary/publications/electric/electric11.pdf
Queensland Department of Transport and Main Roads, Queensland Government 2011, Cost-benefit Analysis Manual, www.tmr.qld.gov.au/~/media/busind/techstdpubs/Project%20delivery%20and%20maintenance/Cost%20benefit%20analysis%20manual/Costbenefitanalysismanualroadprojects.pdf
Queensland Government 2013, Queensland Strategy for Disaster Resilience, www.dilgp.qld.gov.au/resources/plan/local-government/queensland-strategy-or-disaster-resilience.pdf
Queensland Reconstruction Authority 2015, Betterment delivers $22 million in avoided costs in two years
Queensland Treasury, Queensland Government 2015, Project Assessment Framework: Cost-benefit analysis, www.treasury.qld.gov.au/publications-resources/project-assessment-framework/paf-cost-benefit-analysis.pdf
Transport and Infrastructure Council 2015, 2015 National Guidelines for Transport System Management in Australia, Cost Benefit Analysis [T2], Commonwealth of Australia, Canberra
Transport for NSW 2013, Transport Projects Division Sustainability Framework: Key performance indicators and targets, www.transport.nsw.gov.au/sites/default/files/b2b/projects/Sustainability_Framework_May_2013.pdf
Transpower 2005, Transpower Response to EC Request for Information, EC letter dated 12 October 2005
Tye, M., Holland, G. and Done, J., Rethinking failure: time for closer engineer scientist collaborations in design, Institute of Civil Engineers, Paper 1400004
United Kingdom Government 2011, Keeping the Country Running: Natural Hazards and Infrastructure, www.gov.uk/government/uploads/system/uploads/attachment_data/file/61342/natural-hazards-infrastructure.pdf
United Kingdom Government 2013, The Economics of Early Response and Resilience: Approach and Methodology, www.gov.uk/government/uploads/system/uploads/attachment_data/file/226155/TEERR_Approach_and_Methodology.pdf
United Nations 2015, Global Assessment Report on Disaster Risk Reduction, www.unisdr.org/we/inform/gar
United Nations Office for Disaster Risk Reduction (UNISDR) 2005, Hyogo Framework, www.unisdr.org/we/coordinate/hfa
– 2009, UNISDR Terminology on Disaster Risk Reduction, Geneva, www.unisdr.org/we/inform/terminology
– 2015, Sendai Framework, www.unisdr.org/we/coordinate/sendai-framework
United States Department of Housing and Urban Development 2015, National Disaster Resilience Competition, www.hudexchange.info/programs/cdbg-dr/resilient-recovery/
– 2015b, Phase 2 Fact Sheet, portal.hud.gov/hudportal/documents/huddoc?id=NDRCFactSheetFINAL.pdf
Van der Honert, R.C. and McAneney, J. 2011, The 2011 Brisbane Floods: Causes, Impacts and Implications, www.riskfrontiers.com/pdf/water-03-01149.pdf
References
86
Water Resources Commission, New South Wales 1979, Flood inundation map: Macquarie River at Dubbo, trove.nla.gov.au/work/20193130
Western Power 2011, Underground Power, www.westernpower.com.au/network-projects-your-community-underground-power.html
– 2015, State Underground Power Program (SUPP), .www.westernpower.com.au/network-projects-your-community-state-underground-power-program-upp-.html#FAQs
Willingham, R 2015, World-first technology to stop power lines igniting bushfires, www.theage.com.au/victoria/worldfirst-technology-to-stop-power-lines-igniting-bushfires-20151122-gl4ynl.html#ixzz3ts9iEDKu
World Bank 2008, Building Resilient Communities, siteresources.worldbank.org/INTSF/Resources/Building_Resilient_Communities_Complete.pdf
– 2010, Cost-Benefit Analysis in World Bank Projects, ieg.worldbank.org/Data/reports/chapters/cba_full_report1.pdf
– 2012, Building Urban Resilience: Principles, Tools and Practice, www.gfdrr.org/sites/gfdrr/files/publication/Building_Urban_Resilience.pdf
Zurich Flood Resilience Alliance 2014, Making Communities More Flood Resilient, www.zurich.com/_/media/dbe/corporate/docs/whitepapers/risk-nexus-september-2014-flood-resilience-cost-benefit-analysis.pdf
The feedback and information provided during consultations has been an invaluable resource in putting together this report. We would like to sincerely thank the following organisations and the individuals representing them for sharing their insights and knowledge throughout the consultation process:
• Australian Sustainable Built Environment Council
• Infrastructure Australia
• Infrastructure NSW
• Infrastructure Sustainability Council of Australia
• Optus
• Planning Institute of Australia
• Queensland Department of Environment and Heritage Protection
• Roads and Maritimes Service NSW
• RMIT University
• TorqAid.
References

Building resilient infrastructure March 2016 87
This appendix summarises the key findings and recommendations of three companion reports commissioned by the Roundtable:
• Building our Nation’s Resilience to Natural Disasters (2013) reviewed the economics of mitigating disaster risks facing Australian communities
• Building an Open Platform for Natural Disaster Resilience Decisions (2014) provided an overview of natural disaster data and research in Australia, and reinforced the need for better coordination and transparency of disaster risk and resilience information
Appendix A: Companion reports
Figure A.1: Summary of the Roundtable’s work on natural disaster resilience
Total costs of natural disasters
in Australia
Open data platformBuilding an Open
Platform for Natural Disaster Resilience
Decisions
Infrastructure decision-making
processBuilding Resilient
Infrastructure
Raise awareness of the critical need to prepare Australian communities to make them safer and more resilient to natural disasters
Economic costs and benefits Building our
Nation’s Resilience to Natural Disasters
Social costs and benefits
The Economic Cost of the Social Impact of
Natural Disasters
Source:Deloitte Access Economics (2016)
• The Economic Cost of the Social Impact of Natural Disasters (2016), developed in parallel with this report, expands on our 2013 report by valuing some of the broader social impacts of natural disasters to better understand the total cost of natural disasters in Australia.
The figure below summarises how these three reports relate to each other. Each of the companion reports is outlined in brief on the next page.

88
Building our Nation’s Resilience to Natural Disasters (2013)The report highlighted the need for a new approach to investment in pre-disaster resilience across Australia, to reduce the economic costs, relieve long-term pressures on government budgets, and most importantly, minimise the longer-term social and psychological impacts of natural disasters.
Quantifying natural disaster costs
Over the period from 1967 to 2012, Australia experienced an average of at least four major natural disasters per year, where the insured loss exceeded $10 million (Insurance Council of Australia, 2013). In addition, there have been numerous smaller-scale disasters with equally devastating local consequences. Chart A.1 illustrates the extent of insured losses from natural disasters in Australia over the period from 1980 to 2012.
It is important to recognise that these losses only represented a proportion of the total economic costs of natural disasters. In addition to insured losses, total economic costs include the cost of damage to uninsured property and infrastructure; the cost of emergency responses; and intangible costs such as death, injury, relocation and stress. Historically, these total costs have been estimated to be two to five times greater than insured costs alone, for most types of disaster (BTE, 2001).
These costs are expected to rise as a result of continued population growth, concentrated infrastructure density and migration to particularly vulnerable regions. While the current annual total economic cost of natural disasters is around $6.3 billion, on average this annual cost is expected to double by 2030 and reach $23 billion in real terms by 2050, as illustrated in Chart A.2. These forecasts do not reflect any expected increase or shift in the currently observed level and severity of disasters that might be caused by climate change.
These rising costs have significant financial implications for all levels of government, which contribute to the cost of recovery, particularly through the Natural Disaster Relief and Recovery Arrangements. Using historical data, Deloitte Access Economics estimates that natural disasters cost the Australian and state governments an average annual real cost of $700 million per year, around 11% of total economic costs. It is estimated that 80% of government expenditure is outlaid by the Australian Government. Based on the forecasts of total economic costs above, it is expected that governments will eventually face an annual cost of around $2.3 billion in real terms, as illustrated in Chart A.3.
The expected future cost of natural disasters clearly highlights the need for governments to place a greater emphasis on improving Australia’s resilience. Prioritising pre-disaster investments towards cost-effective resilience initiatives can substantially reduce government expenditure on response initiatives. Doing so will rely on access to accurate, consistent data, and findings from targeted research programs, which provide an essential evidence base for determining the cost-effectiveness of resilience measures.
The case for resilience
Deloitte conducted three cost-benefit analyses of different resilience activities, to illustrate how investing in resilience could generate net benefits for Australian communities.
Overall, it was found that:
• A program focused on building more resilient new houses in areas of southeast Queensland with a high cyclone risk would reduce cyclone-related damage by around two-thirds, and generate a benefit-cost ratio (BCR) of up to 3.0. It is a particular challenge to retrofit resilience into existing houses, but the BCR of retrofits approaches 1.0 in high-risk areas
• Raising the Warragamba Dam wall by 23 metres would reduce annualised average flood costs by around three-quarters, and generate a BCR of between 2.2 and 8.5. This would reduce the present value of flood costs between 2013 and 2050 from $4.1 billion to $1.1 billion, a saving of some $3.0 billion
Appendix A: Companion reports

Building resilient infrastructure March 2016 89
Appendix A: Companion reports
Chart A.2: Insured costs of natural disasters ($bn), 1980 to 2012Source: Insurance Council of Australia (2013)
Chart A.3: Forecast total economic cost of natural disasters ($bn), 2011 to 2050Source: Deloitte Access Economics (2013)
Chart A.4: Forecast annual cost to governments of natural disasters ($bn), 2011 to 2050Source: Deloitte Access Economics (2013)
6
5
4
3
2
1
0
1980 1985 1990 1995 2000 2005 2010
(real 2011)$bn
■ NSW
■ VIC
■ QLD
■ WA
■ SA
■ NT
■ ACT
■ TAS
25
20
15
10
0
2011 2021 2031 20412016 2026 2036 2046
(2011 prices)$bn
■ Australian Government
■ States and Territories2.5
2.0
1.5
1.0
0.5
0
2014 2024 2034 20442019 2029 2039 2049
$bn

90
• Building more resilient housing in high-risk bushfire areas generates a BCR of about 1.4; better vegetation management results in a BCR of about 1.3; and moving electricity wires underground results in a BCR of about 3.1.
These examples demonstrate that practical resilience measures – which target high-risk locations using an appropriate combination of infrastructure, policy and procedure – have the potential to generate economic benefits. The case studies also highlight the importance of having access to comprehensive information on disaster risk and the effectiveness of adaptation strategies as part of the cost-benefit analysis process.
Recommendations
This report put forward three key recommendations:
• Improve coordination of pre-disaster resilience by appointing a National Resilience Advisor and establishing a Business and Community Advisory Group
Developing resilient communities should be elevated to the centre of government decision-making, to support effective coordination across all levels of government, business, communities and individuals. This should be directly supported by a Business and Community Advisory Group, to facilitate a more coordinated response and ensure businesses and not-for-profits are represented at the highest levels of policy development and decision-making.
• Commit to long-term annual consolidated funding for pre-disaster resilience
All levels of government – led by the National Resilience Advisor – should commit to consolidating current outlays on mitigation measures, and to funding a long-term program that significantly boosts investment in mitigation infrastructure and activities. Critical to this success will be the consolidation of existing information and commissioning additional data where needed. This will help governments, businesses and the community develop and implement effective local responses.
• Identify and prioritise pre-disaster investment activities that deliver a positive net impact on future budget outlays
A program of mitigation activity should be developed, based on a cost-benefit analysis that demonstrates a clear positive outcome from investing in pre-disaster resilience measures. The prioritisation of these activities should be informed by analysis of research, information and data sets, allowing key investment decisions at all levels, including government incentives and price signals from the private sector.
Building an Open Platform for Natural Disaster Resilience Decisions (2014)This report investigated the decision-making challenge, and identified the strengths and weaknesses of Australia’s approach to natural disaster data and research. It made recommendations on how to support Australia to design a more sustainable and comprehensive national approach to safer and more resilient communities.
Accurate data and research is fundamental to better understanding natural disasters and their impact on communities, business and government. It is essential to supporting better decision-making and to prioritising mitigation investments needed to build a safer Australia. Optimal decisions on resilience investments requires access to high-quality data and research.
Providing wider access to accurate, relevant natural disaster data and research could increase government savings by between $500 million and $2.4 billion in present-value terms, over the period to 2050. Data and research that facilitates targeted and prioritised investment could deliver higher overall BCRs of between 1.3 and 1.5. Based on this, total savings to government could rise to anywhere between $12.7 and $14.6 billion in present-value terms, over the period to 2050.
Appendix A: Companion reports

Building resilient infrastructure March 2016 91
The decision-making challenge
Natural disaster resilience is an interdisciplinary issue. Multiple agencies are involved in collecting data and conducting research. This produces numerous platforms for accessing and using the necessary information; leads to increased search costs; and often creates complexity and disparity in understanding.
The key set of inputs required by end-users consists of:
• Foundational data: data that provides the basic standard layers of locational information. This includes the characteristics of assets at risk, community demographics, topography and weather details, which are also used for other purposes
• Hazard data: hazard-specific information on the risks of different disaster types, providing contextual details about the history of events and the risk profile of Australian locations
• Impact data: data on the potential and actual impacts associated with natural disasters, including information on historical costs and damage, and the current and future value at risk
• Research activities: actions that draw on data and seek to answer specific questions across a range of areas. There is often also feedback from research to data, because research outputs build on the existing stock of data that is available.
A broad range of end-users across communities, business and government are affected by this challenge, and their needs vary significantly. To realise the full potential of decisions aimed at increasing the safety, resilience and productivity of Australian communities, this data and research must be accessible in consistent formats that are fit for this variety of purposes.
Gaps and barriers to optimal decision making
The Australian approach to natural disaster research and data involves no comprehensive mechanisms to ensure inputs are available in a consistent and appropriate format.
Data
There is evidence of gaps in the critical data inputs required to inform resilience investments. This significantly limits the ability of stakeholders to understand the exposure of communities and the extent of losses that might arise.
These issues are compounded by barriers that restrict end-users’ access to critical data. Barriers include:
• Reluctance to share data – the potential legal implications of data sharing are of particular concern for local government
• Restrictive licensing arrangements, which prevent wider distribution and use of data
• The high cost of data collection, which encourages a piecemeal approach to developing critical data inputs
• A lack of coordination and standardisation, which prevents end-users from pooling data from different sources
• The high cost of providing accessibility and transparency, which weakens incentives for data sharing if the broader range of benefits are unclear.
These barriers lead to duplicated efforts in data collection, higher transaction costs when using data, and restricted access for end-users. To the extent that the benefits for the full range of end-users exceed the costs of providing data, the current arrangement is inefficient, and fails to deliver the best outcome for Australian communities and taxpayers.
Appendix A: Companion reports

92
Research
The research found that less funding is directed towards understanding the effect of mitigation, value at risk and the process of coping with natural disasters, compared with other areas of research such as risk management, vulnerability, hazard detection, policy and decision support. This limits the ability of decision makers to understand the baseline costs associated with exposure to natural disasters, and the benefits that could be achieved through mitigation.
There are strong networks among Australian researchers but from an end-user perspective it is difficult to identify what relevant research activities are happening, and how to use research findings to better inform decisions about resilience. Although projects undertaken by the newly established Bushfire and Natural Hazards Cooperative Research Centre (launched in December 2013) explicitly involve end-users, this practice should be adopted more broadly. Increased transparency and better evaluation of the outcomes of research activities would support this change.
Recommendations
Consistent with the recommendation of Building our Nation’s Resilience to Natural Disasters, a National Resilience Advisor within the Department of Prime Minister and Cabinet would be well placed to address these issues. The business of developing resilient communities should be elevated to the centre of government decision-making efforts, enabling effective coordination of activities across all levels of government, business, communities and individuals.
This report makes three recommendations for an enhanced approach to natural disaster information, focusing on the potential benefits of making optimal end-user decisions around data and research.
• Efficient and open – deliver a national platform for foundational data
Given that foundational data is used for a broad range of purposes beyond the scope of natural disaster issues, the Australian Government should provide a single point of access for all Australians. Although the Bureau of Meteorology and the Australian Bureau of Statistics provide weather information and data on community demographics respectively, this would be improved by allocating responsibility for consistent topography and geocoded asset data at the national level. A national portal for this would support the prioritisation of resilience measures across local government and state borders, in the national interest.
• Transparent and available – remove barriers to accessibility of data and research
Access to data and research is restricted. Greater transparency across the system is required to include the full range of end-users and allow for the development of an access system that weighs up overall costs and benefits. There is a need to clearly delegate responsibility for hazard and impact data (such as hazard mapping) and develop a stronger approach to involving end-users in research. This should also address concerns with legal liability and unnecessarily restrictive licensing, and help ensure standardisation across jurisdictions.
• Enabling effective decision-making – establish a prioritisation framework
A national prioritisation framework for investment in resilience should be established, consistent with the approach adopted by Infrastructure Australia.12 This will support best-practice use of natural hazard data, allowing research to be collected and disseminated, and ensuring that investments in resilience produce optimal outcomes based on consistent, evidence-based cost-benefit analyses. This approach would build a common understanding of the nation’s areas of highest risk, and the most effective measures for reducing that risk and prioritising the research agenda.
12. Infrastructure Australia’s Priority List identifies projects of national significance and informs the Australian Government of the highest-priority projects. Infrastructure Australia provides guidelines for cost-benefit analyses, step-by step methodologies for different investment types and links to standardised data sources, to assist in the preparation of submissions. Further details on this approach are provided in Chapter 2.
Appendix A: Companion reports

Building resilient infrastructure March 2016 93
Chart A.6: 2015–50 forecast of the total economic cost of natural disasters, identifying costs for each state
Source: Deloitte Access Economics analysis
■ NSW
■ VIC
■ QLD
■ WA
■ SA
■ NT
■ ACT
■ TAS
(2015 prices)
0
5
10
15
20
25
30
35
40
2015 2020 2025 2030 2035 2040 2045 2050
$bn
Appendix A: Companion reports
The Economic Cost of the Social Impact of Natural Disasters (2016) Natural disasters affect all states and territories in Australia. They have an enormous impact on people, the environment and our communities. In Australia, natural disasters have incurred billions of dollars in tangible costs13 to individuals, businesses and governments.
Beyond the known economic costs, it is well recognised that natural disasters have wide-ranging social impacts that are not only high in immediate impact, but often persist for the rest of people’s lives. While there is considerable evidence of social impacts, our knowledge of their economic cost is not well understood.
Where data permits, this report identifies and quantifies the social impacts of natural disasters, including those on health and wellbeing, education, employment and community networks. When considered alongside the tangible costs highlighted in Building our Nation’s Resilience to Natural Disasters (2013), a much richer picture emerges of the total economic cost of natural disasters to Australia.
This report finds that in 2015, the total economic cost of natural disasters in an average year– including tangible and intangible costs – exceeded $9 billion, which is equivalent to about 0.6% of gross domestic product (GDP) in the same year. This is expected to almost double by 2030 and to average $33 billion per year by 2050 in real terms (Chart A.6), even without considering the potential impact of climate change.
Clearly comprehensive information on all costs of natural disasters is required to understand the full impact of natural disasters on our communities and economy and; to also understand the extent to which expenditure on mitigation and resilience measures is effective.
This report uses three case studies from different regions and periods – the 2010–2011 Queensland floods, the 2009 Victoria Black Saturday bushfires and the 1989 Newcastle earthquake – and assesses the tangible and intangible costs of the most recent two events. The report estimates the intangible costs to be as high as the tangible costs, and possibly higher. In fact, the long term economic cost of natural disasters may be underestimated by more than 50%.
Chart A.5: Breakdown of costs between reports
Tangible
Deaths and injuries
Other intangible
Building our Nation’s Resilience to Natural Disasters (2013)
This report
13. In line with the Productivity Commission report, costs in this report are defined as:
• Direct tangible costs: those incurred as a result of the hazard event and have a market value such as damage to private properties and infrastructure
• Indirect tangible costs: the flow-on effects that are not directly caused by the natural disaster itself, but arise from the consequences of the damage and destruction such as business and network disruptions
• Intangible costs: capture direct and indirect damages that cannot be easily priced such as death and injury, impacts on health and wellbeing, and community connectedness.

94
This report only quantifies those intangible social impacts where there is sufficient data to do so, thus it provides a conservative estimate. Regardless of if they can be quantified, all identified outcomes are important and should be considered in any disaster mitigation decision-making process. Between 2009–10 and 2012–13, $11.0 billion was spent on disaster recovery, while only $225 million was spent on mitigation (Productivity Commission, 2015). The majority of relief and recovery assistance was provided through the Natural Disaster Relief and Recovery Arrangements (NDRRA), and in particular Category B payments which relate to essential public assets, financial support to small business and primary producers, and counter disaster operations.
The report demonstrates that the social costs of natural disasters equal the more traditionally defined economic costs – and are sometimes even higher. It is clear that a greater effort should be invested in the preparedness of individuals, in particular long-term psycho-social recovery. This would include community development programs and support for areas such as health and wellbeing, employment and education.
Our research leads to four recommendations to help reduce the long-term social impacts and economic costs of natural disasters.
• Pre- and post-disaster funding should better reflect the long-term nature of social impacts
The analysis shows that the intangible costs of natural disasters are at least as high as the tangible costs. Significantly, they may persist over a person’s lifetime and profoundly affect communities.
While building resilience into infrastructure is important, it should be accompanied by measures to ensure social and psychological wellbeing. It is crucial that funding and policies acknowledge the long-term social impacts of natural disasters.
As well as funding emergency services during disasters, infrastructure and recovery after disasters, government, business and the not-for-profit sector must also invest in services to support people, small businesses and communities well after the debris is cleared. These services are most effective when coordinated across sectors and when communities connect to foster a culture of resilience.
This report supports a national, long-term preventative approach to managing natural disasters and protecting our communities. This will require long-term commitment and multi-year funding to achieve. Critical to ensuring long-term impacts are minimised is “strengthening local capacity and capability, with
Source: Deloitte Access Economics analysis.Note: Due to insufficient data, the total economic cost of the 1989 Newcastle earthquake was estimated using the tangible to intangible cost ratio of the 2010-11 Queensland floods and 2009 Black Saturday bushfires.
$0 $2 $4 $6 $8 $10 $12 $14 $16 $18 $20
Newcastle earthquake (1989)
Queensland floods(2010-2011)
Black Saturday bushfires (2009)
Total intangible costs Fatality Physical injury and disability Mental health (psychological distress) Alcohol and drug misuse Chronic disease Family violence Crime Environmental Tangible costs
Intangible $3.9b Tangible $3.1b
Intangible $7.4b Tangible $6.7b
Intangible $10.2b Tangible $8.5b
$bn
Chart A.7: Total economic cost of Queensland floods and Black Saturday bushfires
Appendix A: Companion reports

Building resilient infrastructure March 2016 95
greater emphasis on community engagement and a better understanding of the diversity, needs, strengths and vulnerabilities within communities” (COAG’s National Strategy for Disaster Resilience, 2011).
A significant body of evidence shows that resilient and prepared communities are more likely to withstand the negative impacts of natural disasters. Likewise, strong social capital correlates to a more effective recovery.
• A collaborative approach involving government, business, not-for-profits and community is needed to address the medium- and long-term economic costs of the social impacts of natural disasters.
Individuals, businesses, governments and communities all feel the social impacts of natural disasters. These impacts are complex and touch all levels of government and cross all portfolios, from infrastructure and planning to health and education.
This highlights the importance of a collaborative effort to build resilience, including coordinated approaches that consider all aspects of natural disasters: direct and indirect, tangible and intangible. This collaborative perspective should be considered within planning processes, to ensure disaster resilience is integrated across various portfolios in accordance with the National Strategy for Disaster Resilience (NSDR).
A coordinated approach with sustained resourcing makes community awareness education and engagement programs more effective. Such programs help communities to work together to better manage the risks they confront (NSDR). This promotes communities that are better able to withstand and recover from a crisis.
• Governments, businesses and communities need to further invest in community resilience programs that drive learning and sustained behaviour change.
It is clear that funding of disaster mitigation measures should not only focus on building physical infrastructure such as flood levees, but include funding for social and psychological measures too. This would include community awareness, education and engagement programs that enhance social capital by building social networks and connections. While these preventative measures require up-front funding, they yield a return on investment by lessening the overall impact of a natural disaster on individuals, businesses, governments and communities.
Key considerations for program design include:
• Implementing appropriate incentives
• Programs that focus on learning and behaviour modification, in addition to general awareness
• The need for psychological preparedness
• Local solutions
• The need for solid data and evaluation
• Community connection to foster a culture of resilience.
Given how widespread the social impacts are after a natural disaster, it is important that communities, not-for-profits, emergency management agencies, businesses and governments collaborate to design and deliver preparedness programs and campaigns. These programs must educate communities as well as encourage and foster a culture of connectedness and resilience.
It is critical they be evidence-based to ensure cost-effective investment and continual improvement. It is important, too, to evaluate their effectiveness and draw out their key learnings.
Appendix A: Companion reports

96
• Further research is needed into how to quantify the medium- and long-term costs of the social impacts of natural disasters.
While the complex social impacts of natural disasters are undisputed, there is currently a lack of consistent data to reliably quantify the cost. Direct and tangible impacts are usually considered as ‘one-offs’ but intangible social impacts tend to persist over time. Hence, data collection needs to better incorporate this temporal component to track and fully appreciate the long-term effects of natural disasters.
This report shows that the social impacts of natural disasters tend to be multiple and interrelated. Importantly, the experience of grief and trauma varies from person to person. It is therefore necessary to understand both the primary and secondary impacts of natural disasters on individuals and communities.
In Building an Open Platform for Natural Disaster Resilience Decisions we proposed a national platform to facilitate access to foundational data. In addition to this, there is a need to incorporate consistent longitudinal data to track social impacts. Areas that could benefit from better data collection include health and wellbeing, education, employment and communities. For example, datasets could incorporate information about people’s experience of natural disasters such as timing and type.
Concluding remarks
This report highlights the significant economic costs of the social impacts of disasters. It provides four key recommendations in the form of strategies to help to reduce the long term impacts and costs of future natural disasters.
These recommendations reaffirm those made in Building our Nation’s Resilience to Natural Disasters (2013) and Building an Open Platform for Natural Disaster Resilience Decisions (2014). Particularly, with regard to the need for national coordination and long-term, annual consolidated funding for pre disaster resilience, an open platform for foundational data, and for removing barriers to accessing data and research.
This report also supports the need to consider the social impacts of natural disasters when evaluating the benefits of resilient infrastructure in the investment decision-making process, as explored in Building Resilient Infrastructure (2016) and the need to build resilience before natural disasters happen.
Appendix A: Companion reports
“ We will not be measured by the kilometres of road and pipes that we replace, we will be measured by how our people come through this”Jim Palmer from Waimakiriri District Council after the Christchurch Earthquake, 2011
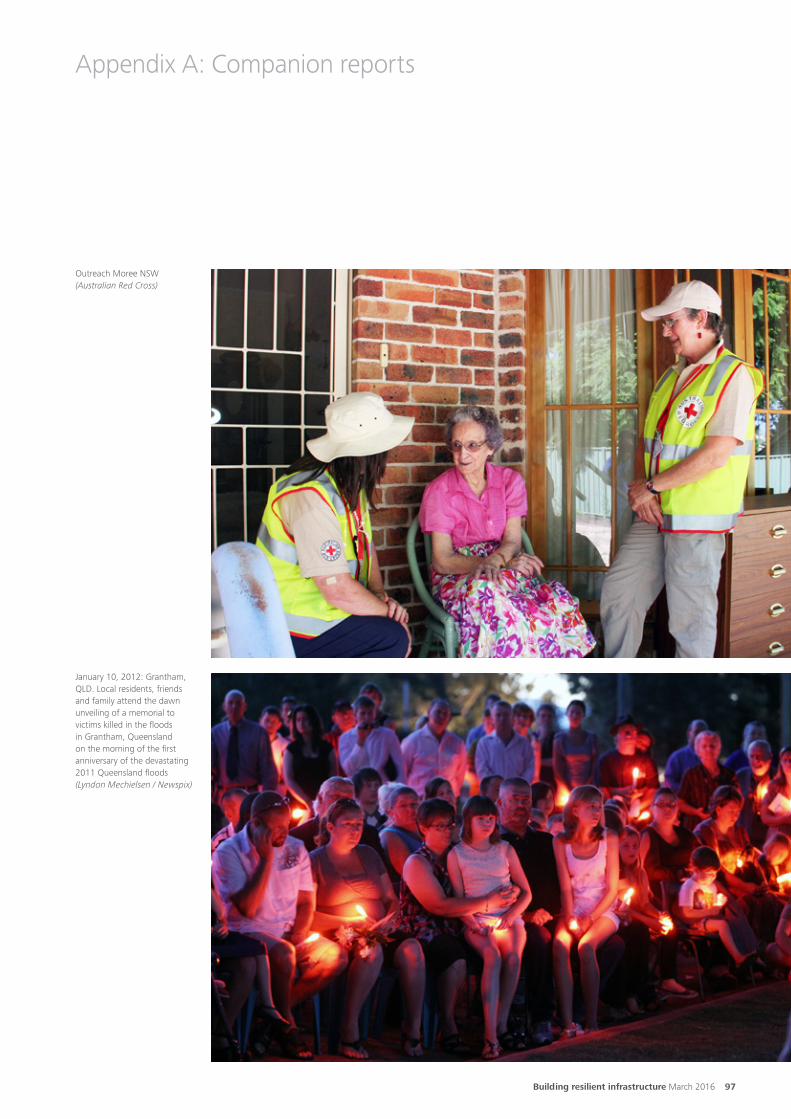
Building resilient infrastructure March 2016 97
Appendix A: Companion reports
Outreach Moree NSW (Australian Red Cross)
January 10, 2012: Grantham, QLD. Local residents, friends and family attend the dawn unveiling of a memorial to victims killed in the floods in Grantham, Queensland on the morning of the first anniversary of the devastating 2011 Queensland floods (Lyndon Mechielsen / Newspix)

98
Following the June 2013 release of the Roundtable’s white paper, Building our Nation’s Resilience to Natural Disasters, the Australian Government asked the Productivity Commission to inquire into the efficacy of national natural disaster funding arrangements and take into account the high priority of effective mitigation. The Commission received the terms of reference on 28 April 2014, and published the final report on 17 December 2014. This appendix provides a summary of the key findings and recommendations.
• The current funding arrangements for natural disasters are inefficient, inequitable and unsustainable, prone to cost-shifting, ad hoc responses and short-term political opportunism
• Expenditure on mitigation, across all levels of government, is likely to be below the optimal level, given the biased incentives towards recovery under current budget treatments and funding arrangements
• Governments make decisions about natural disaster risk management without full information on potential consequences, due to the budget treatment of natural disaster costs as an unquantified contingent liability
• While information on natural disaster hazards and exposure has improved significantly in recent years, there is scope for greater coordination and prioritisation of natural hazard research across government and research institutions.
The Productivity Commission made 22 recommendations to achieve a more sustainable balance of natural disaster mitigation, relief and recovery expenditure. This included calls for:
• Amendments to cost-sharing arrangements for natural disaster recovery, including the funding for the ‘betterment’ component of reconstruction costs after disasters
• Gradual increases in the amount of annual mitigation funding. Australian Government mitigation funding to states should increase to $200 million a year and be matched by the states – This recommendation supports a recommendation from the Roundtable’s report, Building our Nation’s Resilience to Natural Disasters, which called for a commitment by all levels of government to long-term annual consolidated funding for pre-disaster resilience
Appendix B: Productivity Commission Inquiry into National Disaster Funding
• Improved recognition of natural disaster liabilities in government budgets
• Governments at all levels to make natural hazard data publicly available in accordance with open public sector information principles
• Exploration of partnerships and collaboration on natural hazard risk information, between state and territory governments, local governments and insurers
• Development of guidelines for the collection and dissemination of natural hazard mapping, modelling and metadata – This recommendation supports a recommendation from the Roundtable’s report, Building an Open Platform for Natural Disaster Resilience Decisions, which called for the creation of a national data platform for foundational data, and the removal of barriers to accessing it
• Prioritising and accelerating the implementation of the Enhancing Disaster Resilience in the Built Environment Roadmap by state and territory governments
• Provision of statutory protection of local governments from liability for releasing natural hazard information and making changes to local planning schemes in good faith
• Best-practice institutional and governance arrangements for the provision of public infrastructure, including stronger processes for project selection that incorporate requirements for cost-benefit analyses that are independently scrutinised and publicly released, and consideration of natural disaster risk in project selection and asset management planning
• Development of a formula for allocating mitigation funding based on where such funding is likely to achieve the greatest net benefits.
The Australian Government has not yet formally responded to these recommendations.

Building resilient infrastructure March 2016 99
Appendix C: Electricity transmission lines case study – background data and information
The case study in Section 3.1 examines the Tatong bushfire of January 2007, which resulted in both transmission lines that connect Victoria to NSW being lost to service. It examines the cost and benefits of the implemented resilience measures following the event, and the potential benefits of such measures should they be correctly analysed and implemented. The case study suggests that it may be economically feasible to change the design and construction of these lines to improve resilience in at-risk areas.
This appendix provides background information to support this analysis.
Specifically:
• Table C.1 presents a summary of the advantages and disadvantages of three options identified by Nous Group (2007) that could make the power lines more resilient
• Table C.2 presents the summary of a cost estimate for installing underground transmission cables, derived from Australian and international sources.
Source: Adapted from Nous Group (2007)
Table C.1: High-level comparison of resilience options for electricity transmission lines
Resilience option Advantages Disadvantages
Change vegetation clearance standards around overhead powerlines
Relatively low additional costs compared with other options
• Vegetation clearance standards are designed to prevent lines from starting fires, and prevent lasting physical damage to lines
• Bushfires produce flame heights that exceed any realistically achievable clearance standards
• Changes to standards would not significantly reduce the risk of loss of lines.
Separate the two 330kV transmission lines into separate easements
Increasing the distance between lines could greatly reduce the risk of losing both at once
• The risks would not be completely removed, as bushfires often cover large areas, as demonstrated in NSW
• This measure is unlikely to be cost-effective, as a new line could cost about $2 billion, in addition to substantial clearing of national parks and native forests. This is relatively more expensive than upgrading the existing lines.
Replace overhead lines with underground transmission cables
This is the only transmission line option that exhibits a degree of immunity to bushfires
• Indicative cost comparisons suggest that replacing both 330kV lines would cost some billions of dollars
• The technical feasibility is unclear, as there are limited examples of long-distance underground transmission cables of a similar length and capacity.

100
A note on other costs
In addition, placing the transmission cables underground would reduce the costs of vegetation management, which is only required for overhead lines. In 2014–15, AusNet Services spent $3,803,006 on vegetation management across its transmission line network, at an average cost of $760.30 per kilometre. This estimate has been escalated to 2015–16 price terms using CPI data, producing an average vegetation management cost saving of $769 per kilometre if underground cables were installed.
Table C.2: Comparison of underground cable costs
Country Year Route length (km) Voltage (kV) Cost per km (A$, 2015)
Australia 2015 N/A N/A 2,000,000
Australia 2012 19.2 330 6,978,780
New Zealand 2005 200 400 11,207,048
USA 2011 N/A 138 1,384,409
Ireland 2008 N/A 400 6,697,774
United Kingdom 2012 75 400 12,098,909
United Kingdom 2012 75 400 22,035,917
United Kingdom 2012 75 400 23,930,439
Source: Western Power (2015); Diona Civil Engineering Contractors (2014); PB Power in Transpower (2005); Public Service Commission of Wisconsin (2011); Ecofys Germany GmbH, University of Duisburg-Essen & Golder Associates Ireland (2008); Parsons Brinckerhoff (2012)
Appendix C: Electricity transmission lines case study – background data and information

Building resilient infrastructure March 2016 101
To calculate consumer surplus from telecommunications, we used two annual ACMA communication reports. The reports calculated the gain in consumer surplus for Australia due to a reduction in price for a given year. For example:
• In 2007–08, for calls, there was a 21% decline in price (from 21.2¢ to 16.7¢), which resulted in an increase in quantity of 28% and an increase in consumer surplus of $2,277 million
• In 2007–08, for SMS, there was a 40% decline in price (from 14.6¢ to 8.7¢), which resulted in an increase in quantity of 49% and an increase in consumer surplus of $1,010 million
• In 2008–09, for calls, there was a 4.5% decline in price (from 28.7¢ to 27.4¢), which resulted in an increase in quantity of 6% and an increase in consumer surplus of $491 million
• In 2008–09, for SMS, there was a 5.5% decline in price (from 9.1¢ to 8.6¢), which resulted in an increase in quantity of 17% and an increase in consumer surplus of $92 million.
Assuming that the demand function is linear, we can derive the demand functions for each of the above cases – that is, the coefficients and constants for the linear equation.
Next, we grew the figures by the number of subscribers in 2010–11. According to ACMA, from 2008–09 to 2010–11, the number of mobile subscribers grew by 25% and from 2007–08 to 2010–11 the number of mobile subscribers grew by 34%. Using this information, we can calculate the corresponding price and quantity for each of the above equations. This enables us to calculate total consumer surplus in 2010–11.
Appendix D: Economic surplus from telecommunications
Next, we apportion the total consumer surplus figures to estimate the avoidable losses based on this event. First, we apportion by carrier (Optus only), then by geography and population – that is, Brisbane only14 – and finally by time (daily basis). This results in a daily avoidable loss of consumer surplus of $832,919 per day for Optus customers in Brisbane.
To calculate producer surplus, first we assume that this is represented by profits. According to IBISWorld (2015), telecommunications businesses retain 13% of revenue as profits. The same source states that in 2010–11, Optus earned $6.0 billion in revenue, which suggests profits of about $780 million. Weighting this profit by population share – that is, 2.1 million out of 22.5 million – we estimate Optus’s 2010–11 profit in Brisbane to be $71.6 million, or $196,046 per day in 2010–11.
To obtain the total avoided loss in economic surplus, we add consumer surplus and profits (producer surplus), which we estimate to be about $1 million per day.
To calculate the expected avoided losses, we weight these losses by the historical frequency of similar events and the duration of the outage. According to Van den Honert and McAneney (2011), Brisbane experienced six major floods between 1840 and 2011 that were larger than the Brisbane floods in 2011. This implies a probability of 3.5% of a similar event occurring in a given year. Furthermore, we assume that the outage lasts three days.15 We estimate the expected avoided costs to be $108,321. Assuming a 3% discount rate, this implies a $3.6 million avoided cost in perpetuity, of which $2.9 million is lost consumer surplus and $0.7 million is lost producer surplus.
14. Brisbane had a population of about 2.1 million and Australia had a population of 22.5 million in 2011.
15. According to Optus, 150 out of 175 nodes remained down from 11 January 2011 to 13 January 2015.

102
The national cost estimates presented in Section 4.1 were based on data from three key sources:
• Australian Bureau of Statistics (ABS) data on selected building and engineering construction activity in 2014–15
• Department of Finance and Deregulation data on historical National Disaster Relief and Recovery Arrangements (NDRRA) expenditure associated with restoring essential public assets following natural disasters
• Deloitte Access Economics long-term GDP forecasts to 2050.
This appendix provides further detail on these data sources and the assumptions underlying the projections.
Forecasts of total future critical infrastructure investment
The following data was obtained from 2001–02 to 2014–15:
• Historical selected engineering construction activity – ABS (2015b), based on the total value of work done in the following categories: – Roads, highways and subdivisions – Bridges – Railways – Harbours – Water storage and supply – Sewerage and drainage – Electricity generation, transmission and distribution – Pipelines – Telecommunications.
• Historical selected building activity – ABS (2015a), based on public and private sector value of work done in the following categories: – Education buildings – Aged care facilities – Health buildings – Transport buildings.
These categories represent the definition of hard infrastructure used in this report.
To estimate the value of engineering construction work done for the private sector, the difference between the total value of work done in each quarter was subtracted from the estimate of the value of work done for the public sector.
Appendix E: Top-down approach to forecasting national costs of non-resilient infrastructure
The estimates of the value of work done exclude the cost of land and the cost of repair and maintenance, as well as the value of any transfers of existing assets; the value of installed machinery and equipment not integral to the structure; and the expense of relocating utility services (ABS, 2015b). It is assumed this data is an estimate of annual investment in new or replacement infrastructure, but not the maintenance of existing assets.
A projection of future investment in critical infrastructure was then developed, by assuming that the combined total value of selected building and engineering construction activity (noted above) in 2014–15 would grow in line with real GDP over the period to 2049–50. These annual growth estimates were derived from Deloitte Access Economics’ long-term GDP forecasts over this period.
Based on these assumptions, we estimate that the public and private sector will invest about $1.1 trillion in critical infrastructure, in present-value terms, over the period to 2049–50.
Forecasts of future costs of rebuilding critical infrastructure
The Department of Finance and Deregulation (2012) provides estimates of total government expenditure (across the Commonwealth, state and local levels) for restoring essential public assets, as part of the reporting associated with Category B of the NDRRA.
Examining the period from 2002–03 to 2010–11, we estimated that these rebuilding costs were approximately 1.6% of the annual value of selected building and engineering construction work done for the public sector, on average.
Forecasts of the future costs of rebuilding critical infrastructure were then obtained by applying this proportion to the projections of total critical infrastructure investment between 2015–16 and 2049–50. This assumes that on average, private sector investment in rebuilding critical infrastructure is the same share of total annual infrastructure investment (1.6%) as for the public sector.
On this basis, we estimate that total spending to rebuild critical infrastructure following natural disasters could be worth about $17 billion over the period to 2050, in present-value terms.

Building resilient infrastructure March 2016 103
Appendix F: Assessing disaster hazards
Understanding what hazards are present is fundamental in taking resilience to natural disasters into account when making infrastructure investment decisions. This understanding is achieved by conducting hazard assessments.
A hazard assessment is a technical tool to assess the probability of a natural disaster event and the consequences for existing and proposed infrastructure. A hazard assessment should happen during the initial planning phase of any significant new infrastructure strategy or investment. The hazard assessment will identify the nature and extent of natural disaster risks present in a given location. For example, a hazard assessment may identify that the path for a new electricity transmission line is likely to be affected by bushfire once every five years or affected by major storms once a year.
A thorough hazard assessment should take into account all characteristics of the hazard including timing, intensity, duration and frequency. For example, a hazard assessment for a proposed road may identify that the area is at high risk of flood. The hazard assessment should then identify how often flooding has historically occurred, how often flooding is expected to occur, the expected flood depth and velocity, and how long the area may remain flooded. These items should consider averages and distribution. For example, an area may flood to a depth of 1.5 metres on average, but the flood will exceed two metres once every five years, and three metres once every 15 years – and so on.
This data is analysed and mapped to define a probability set for hazard events of each type, frequency and intensity. The data can then be applied to profile options for infrastructure in a way that minimises exposure and vulnerability, such as shifting the location or physical attributes of the asset to mitigate the potential for damage.
The results of the assessment should also be used to inform the design of infrastructure. For example, the assessment might identify that a development area is at risk of coastal inundation during an extreme storm event. The design of essential infrastructure in the area such as sewers and drains could be adjusted to take into account this hazard.
A hazard assessment is also required as input to measure resilience benefits within a CBA framework (see chapter five). A hazard assessment will allow the analyst undertaking the CBA to estimate average annual costs due to natural disasters, and the benefits associated with more resilient infrastructure design. This will inform the selection of infrastructure that takes into account natural disaster risks and the benefits of incorporating resilience.
Geoscience Australia has a comprehensive methodology for hazard assessment, for the purpose of managing and responding to natural disaster events.
The required data for analysing hazards is specific to each major hazard type:
• Tropical cyclone
• Flood
• Severe storm
The methodology emphasises that analysing the likelihood of a hazard typically requires a wide set of data and modelling capabilities. This means that assessments are best undertaken by organisations with specific capabilities, not by the project owner.
Relevant data and models are held by various government departments as well as the private sector. This data includes historical records of disaster events, understanding the physical processes leading to an event, and/or ongoing monitoring data of natural phenomenon. For example, Geoscience Australia is developing a national flood risk information portal, and the CSIRO has developed national models of flooding and bushfire events. The Intelligent Disaster Decision Support System also plans to use geospatial data to offer hazard perception and vulnerability maps. Using this data, it is possible to estimate the approximate frequency of hazard events and the probability of an event that exceeds certain intensity levels.
Practitioners undertaking a hazard assessment should acknowledge the limitations of the analysis due to the complexity of hazard risks, poor data availability and the potential interaction of hazard events or impacts, including between infrastructure assets. Uncertainty about the effects of climate change can also limit the extent to which modelling based on historical data will predict future events.
• Bushfire
• Landslide
• Tsunami.
104
Cost-benefit analyses (CBA) are a major input in the decision-making process for new infrastructure, as they analyse the expected benefits and costs for the entire community. Monetising resilience benefits in a CBA framework provides a thorough picture of community benefits from new infrastructure, and helps identify cost-effective ways to build resilience into infrastructure.
Given the prevalence of natural disasters in Australia and the significant costs they impose on existing infrastructure, including resilience benefits in CBA is needed to facilitate better consideration of natural disasters in infrastructure decision-making.
Existing Commonwealth, state and territory CBA frameworks (see the list in Table 2.2) provide detailed information on monetising costs and benefits (and on how to select a discount rate, appraisal period and base case) but do not currently provide substantive guidance on resilience benefits. For example, current guidelines for bridge projects clearly specify factors such as the appropriate time period for conducting the analysis; how to measure and forecast traffic volumes; how to value the time of different road users; expected vehicle accident rates; and how to discount future costs and benefits to current values. However, the guidelines do not mention how to account for the risk that the bridge could be unavailable – or even destroyed – due to a flood.
The following section provides an addendum to these existing frameworks, to help practitioners monetise resilience benefits in a rigorous CBA.
Resilience benefits of proposed infrastructure options
In the context of infrastructure, resilience benefits are estimated in terms of the avoided disaster costs. Avoided disaster costs are estimated by comparing disaster costs under a base case (business as usual) scenario, with disaster costs under a project option – that is, base case disaster costs minus project disaster costs. Project options with higher levels of built-in resilience such as options to reduce the exposure of an asset during a hazard event will have lower disaster costs.
Appendix G: Estimating resilience benefits
PV resilience benefits = PV avoided disaster costs = Base case disaster costs – Project disaster costs
For example, a new main water pipeline may be needed to service a new housing development. A hazard assessment might identify that the direct route from the existing mains network to the new development area is flood prone and landslide prone. This would require multimillion-dollar maintenance expenditure once every 10 years. If the proponent could identify an option that eliminates the need for this maintenance, the benefit of resilience is the reduction in maintenance expenditure.
Identifying avoided disaster costs
The cost of natural disasters includes a wide set of direct and indirect, tangible and intangible costs. Using an approach defined by the Bureau of Transport Economics (BTE) (2001) Economic Costs of Natural Disasters in Australia, the total cost of a natural disaster is measured by quantifying and aggregating these costs.
However, in evaluating the benefits of resilient infrastructure, only some of the categories of disaster costs that BTE identified are relevant. That is, in analysing the benefits of resilient infrastructure, analysts must focus on costs that follow from damage to infrastructure. This is because other costs of the natural disaster (such as injury, death and destruction of property) occur regardless of the infrastructure asset.
Relevant disaster costs include the direct impact of infrastructure damage, and indirect or flow-on impacts associated with infrastructure service outages. For example, natural disaster costs associated with an electricity transmission line would include direct costs (such as reconstruction) and additional maintenance of the line following fire or storm, as well as indirect costs associated with loss of supply to electricity users. However, the CBA would not have to consider the cost of property damage that occurred as a result of fire or storm, as this damage would have occurred regardless of what happened to the electricity line.
The following section gives more detail on approaches to measuring the different costs associated with natural disasters and infrastructure.
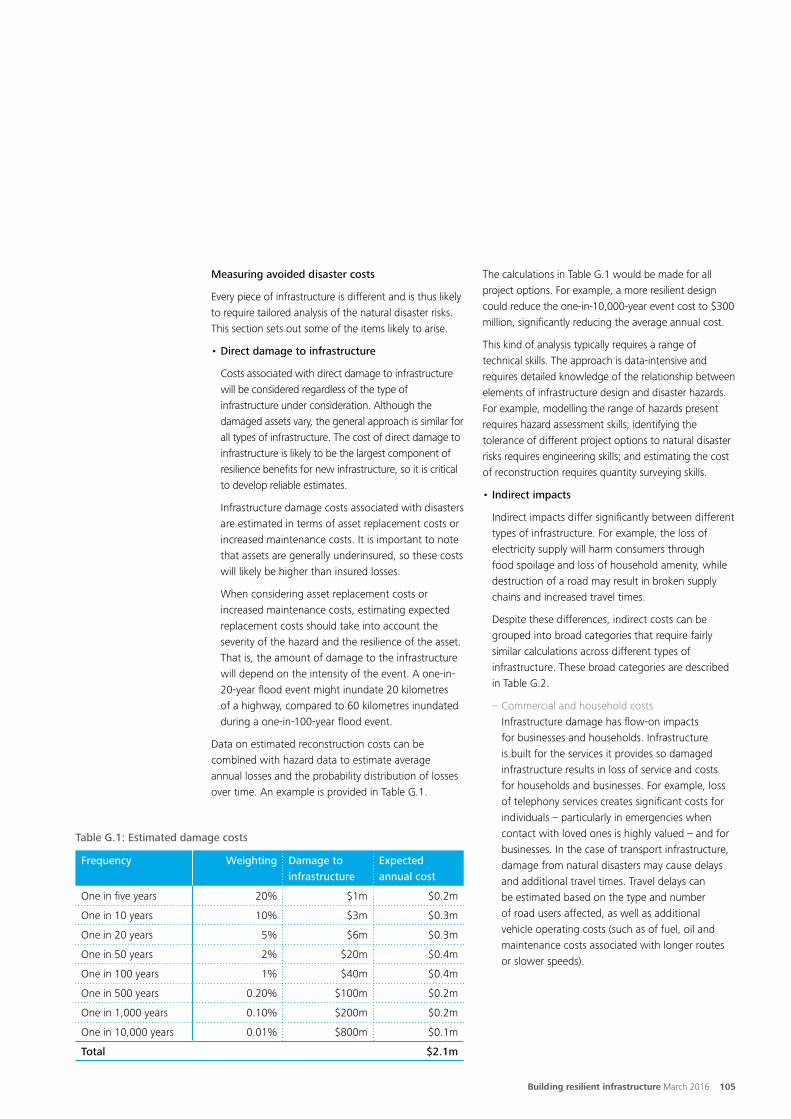
Building resilient infrastructure March 2016 105
Measuring avoided disaster costs
Every piece of infrastructure is different and is thus likely to require tailored analysis of the natural disaster risks. This section sets out some of the items likely to arise.
• Direct damage to infrastructure
Costs associated with direct damage to infrastructure will be considered regardless of the type of infrastructure under consideration. Although the damaged assets vary, the general approach is similar for all types of infrastructure. The cost of direct damage to infrastructure is likely to be the largest component of resilience benefits for new infrastructure, so it is critical to develop reliable estimates.
Infrastructure damage costs associated with disasters are estimated in terms of asset replacement costs or increased maintenance costs. It is important to note that assets are generally underinsured, so these costs will likely be higher than insured losses.
When considering asset replacement costs or increased maintenance costs, estimating expected replacement costs should take into account the severity of the hazard and the resilience of the asset. That is, the amount of damage to the infrastructure will depend on the intensity of the event. A one-in-20-year flood event might inundate 20 kilometres of a highway, compared to 60 kilometres inundated during a one-in-100-year flood event.
Data on estimated reconstruction costs can be combined with hazard data to estimate average annual losses and the probability distribution of losses over time. An example is provided in Table G.1.
The calculations in Table G.1 would be made for all project options. For example, a more resilient design could reduce the one-in-10,000-year event cost to $300 million, significantly reducing the average annual cost.
This kind of analysis typically requires a range of technical skills. The approach is data-intensive and requires detailed knowledge of the relationship between elements of infrastructure design and disaster hazards. For example, modelling the range of hazards present requires hazard assessment skills; identifying the tolerance of different project options to natural disaster risks requires engineering skills; and estimating the cost of reconstruction requires quantity surveying skills.
• Indirect impacts
Indirect impacts differ significantly between different types of infrastructure. For example, the loss of electricity supply will harm consumers through food spoilage and loss of household amenity, while destruction of a road may result in broken supply chains and increased travel times.
Despite these differences, indirect costs can be grouped into broad categories that require fairly similar calculations across different types of infrastructure. These broad categories are described in Table G.2.
– Commercial and household costsInfrastructure damage has flow-on impacts for businesses and households. Infrastructure is built for the services it provides so damaged infrastructure results in loss of service and costs for households and businesses. For example, loss of telephony services creates significant costs for individuals – particularly in emergencies when contact with loved ones is highly valued – and for businesses. In the case of transport infrastructure, damage from natural disasters may cause delays and additional travel times. Travel delays can be estimated based on the type and number of road users affected, as well as additional vehicle operating costs (such as of fuel, oil and maintenance costs associated with longer routes or slower speeds).
Table G.1: Estimated damage costs
Frequency Weighting Damage to infrastructure
Expected annual cost
One in five years 20% $1m $0.2m
One in 10 years 10% $3m $0.3m
One in 20 years 5% $6m $0.3m
One in 50 years 2% $20m $0.4m
One in 100 years 1% $40m $0.4m
One in 500 years 0.20% $100m $0.2m
One in 1,000 years 0.10% $200m $0.2m
One in 10,000 years 0.01% $800m $0.1m
Total $2.1m

106
For utilities and telecommunications infrastructure, the cost of service disruptions or outages can be estimated by using data on a) the number of businesses/households affected and b) the cost of the disruption to each. The number of businesses and households affected can typically be sourced from modelled data on proposed infrastructure usage. The cost of service outages can be estimated as the value of the provided service multiplied by the length of the outage. For example, if damage to transmission lines is expected to cause a two-hour outage, the value of electricity usage can be multiplied by the number of households and businesses affected. Where proxy data on the value of service is not available, ‘willingness-to-pay’ surveys for avoided disruptions may be useful (where customers indicate their willingness to pay to avoid a disruption).
– Emergency response costsDamage to infrastructure may affect emergency response costs for government and private organisations. For example, destruction of a bridge may require the use of helicopters to provide supplies to households. Emergency response costs can be estimated using data from past events. Under the NDRRA, state governments may apply to the Australian Government for reimbursement of expenditure on emergency response during a disaster. The submissions provided to Australian Government provide a proxy indicator of these costs.
Care must be taken to isolate those costs attributable to infrastructure damage relative to other costs.
Table G.2: Types of indirect costs
Infrastructure type Potential indirect costs
Airports • Travel time delay for passengers • Costs of delay for freight • Increased costs for airlines • Flow-on effects throughout the airport network.
Telecommunications • Consumer and business value of reliable telecommunications• Cost of delivering emergency backup systems• Disruption to other services, such as electricity, that may rely on telecommunications• Increase in household cost of natural disasters as a result of inability to access emergency support• Increased disaster response costs.
Roads • Travel time delay for passengers• Costs of delay for freight• Additional vehicle operating costs• Additional road accident costs• Increased disaster response costs.
Railways • Travel time delay for passengers• Value of delay for freight.
Ports • Value of delay for freight• Business disruption costs for supply chain.
Electricity • Consumer and business value of reliable electricity supply• Disruption to traffic following loss of traffic lights• Loss of essential services that rely on electricity (such as streetlights)• Loss of life due to failure of medical equipment• Increased disaster response costs.
Water • Consumer and business value of reliable water supply• Disruption from follow-on maintenance works• Illness or death resulting from consumption of contaminated water• Increased disaster response costs.
Appendix G: Estimating resilience benefits

Building resilient infrastructure March 2016 107
– Economic cost of social impacts, including inconvenience and stress
Social impacts associated with infrastructure damage can be difficult to quantify, particularly when infrastructure is yet to be built. This information typically comes from data collected during previous similar events. The Roundtable report The Economic Cost of the Social Impacts of Natural Disasters (2016) suggests intangible costs associated with natural disasters can be substantial. Where data is not available, the cost of social impacts should be included qualitatively in the CBA.
While not comprehensive, Table G.2 below sets out a range of indirect costs for consideration.
Aggregating natural disaster costs
Each cost component should be considered separately, then aggregated to estimate disaster costs for each proposed option. Resilience benefits only arise when a disaster event actually occurs. As such, estimated disaster costs are multiplied by a probability weighting for each hazard to determine an annual average resilience benefit. As such a detailed hazard assessment (see appendix F) is needed before resilience benefits can be estimated.
Continuing with the electricity transmission line example, it might be estimated that the transmission line will receive minor damage from fire once every five years at a maintenance cost of around $2 million. Further, it could be estimated it will be destroyed by fire once every 50 years with replacement costs of $10 million, and damaged by a storm once a year with maintenance cost of $0.5 million. The expected annual costs due to natural disasters are then $1.1 million (=1/5×2 + 1/50×10 + 1/1×0.5).
Total disaster costs are then discounted to present resilience benefits in present-value terms (as per other benefits, and as specified in the CBA framework). For example, if the analysis period for the transmission line is 30 years, the present value is around $13.7 million.
These costs can then be incorporated into standard CBAs.
Example application in Infrastructure Australia template
Part of Infrastruture Australia’s Better Infrastructure Decision-Making Guidelines (2013) is a Template for Stage 7 (Transport Infrastructure) on solution evaluation.
This template provides the required steps for appraising new infrastructure proposals to the Australian Government. Although the template is designed for transport infrastructure, Infrastructure Australia advises a similar level of detail should be provided by other infrastructure sectors.
To embed resilience within this template, amendments could:
• Add resilience benefits to the list of potential monetised benefits and costs
• Add resilience benefits to the ‘deliverability assessment’. For example, through questions like ‘Does the proposed infrastructure option effectively deal with disaster risks?’, ‘How has resilience to natural disasters been included in the proposed option?’ and ‘Have resilience benefits been monetised?’
In practice, Infrastructure Australia does not provide specific guidelines for how costs and benefits should be measured. Consequently, CBA handbooks provided by the Transport and Infrastructure Council and by other states and territories should be updated with a detailed approach for monetising resilience benefits, as provided in this report. There is an opportunity to include this guidance during the planned stage 2 of the National Guidelines for Transport System Management in Australia (NGTSM) revision project. This project plans to update the 2006 guidelines.
Limitation of our work
General use restriction
This report should not be relied on by any party other than our client. We accept no duty of care to any other person or entity for the use of this report.
16. Transport and Infrastructure Council (2015)
Appendix G: Estimating resilience benefits


Building resilient infrastructure March 2016 iii

Contact usDeloitte Access Economics ACN: 149 633 116
Level 7 225 George Street Sydney NSW 2000 PO Box N250 Grosvenor Place NSW 1220 Australia
Tel: +61 2 9322 7110 Fax: +61 2 9322 7001
www.deloitteaccesseconomics.com.au
Deloitte Access Economics is Australia’s pre-eminent economics advisory practice and a member of Deloitte’s global economics group. The Directors and staff of Access Economics joined Deloitte in early 2011.
Deloitte refers to one or more of Deloitte Touche Tohmatsu Limited, a UK private company limited by guarantee, and its network of member firms, each of which is a legally separate and independent entity. Please see www.deloitte.com/au/about for a detailed description of the legal structure of Deloitte Touche Tohmatsu Limited and its member firms.
About Deloitte
Deloitte provides audit, tax, consulting and financial advisory services to public and private clients spanning multiple industries. With a globally connected network of member firms in more than 150 countries, Deloitte brings world-class capabilities and deep local expertise to help clients succeed wherever they operate. Deloitte’s approximately 170,000 professionals are committed to becoming the standard of excellence.
About Deloitte Australia
In Australia, the member firm is the Australian partnership of Deloitte Touche Tohmatsu. As one of Australia’s leading professional services firms. Deloitte Touche Tohmatsu and its affiliates provide audit, tax, consulting and financial advisory services through approximately 5,400 people across the country. Focused on the creation of value and growth, and known as an employer of choice for innovative human resources programs, we are dedicated to helping our clients and our people excel. For more information, please visit our web site at www.deloitte.com.au.
Liability limited by a scheme approved under Professional Standards Legislation.
Member of Deloitte Touche Tohmatsu Limited
© 2016 Deloitte Access Economics Pty Ltd
MCBD_SYD_03/16_052486