building land use/land cover maps from openstreetmap
TRANSCRIPT

Cidália Fonte 1,2, Joaquim Patriarca 2, Marco Minghini 3,
Vyron Antoniou 4, Linda See 5, Maria Antonia Brovelli 3
(1) Dep. of Mathematics, University of Coimbra, Coimbra – Portugal
(2) INESC Coimbra, Coimbra – Portugal
(3) Politecnico di Milano, Department of Civil and Environment Engineering, Como – Italy
(4) Hellenic Military Geographical Service, Athens – Greece
(5) Ecosystems Services and Management Program, International Institute for Applied
Systems Analysis (IIASA), Laxenburg – Austria
Building Land Use/Land Cover mapsfrom OpenStreetMap
Mapping, Sensing, and Crowdsourcing Geographic Information
Royal Geographical Society, London (UK) – Friday, 14 October 2016

Introduction• Land Use/Land Cover (LULC) maps:
• fundamental for many areas & applications
• produced through the classification of satellite imagery
• limitations due to high costs and long updating cycles
• Volunteered Geographic Information (VGI):• OpenStreetMap (OSM)
• OSM database includes LULC information
• literature has addressed the problem of creating LULC maps from OSM data (Jokar Arsanjani et al., 2013; Estima & Painho, 2015; etc.)
• this process has difficulties and limitations
• Aim of this work:• Propose an automated methodology to convert OSM data into LULC
maps according to Urban Atlas (UA) & Corine Land Cover (CLC) nomenclatures

• OSM is the richest, most diverse, most complete and often most up-to-date free geospatial database of the world.
• OSM database is a collection of vector data (points, lines & polygons):
• each object must have at least one attribute, known as tag
• a tag is the combination of a key and a value
• OpenStreetMap data can be downloaded in several ways:
• from the OSM web map page after choosing a bbox
• using the Overpass API
• using tools available in some GIS software
• from the OSM Planet File
• from predefined extracts (Geofabrik, Mapzen, etc.)
OpenStreetMap (OSM)
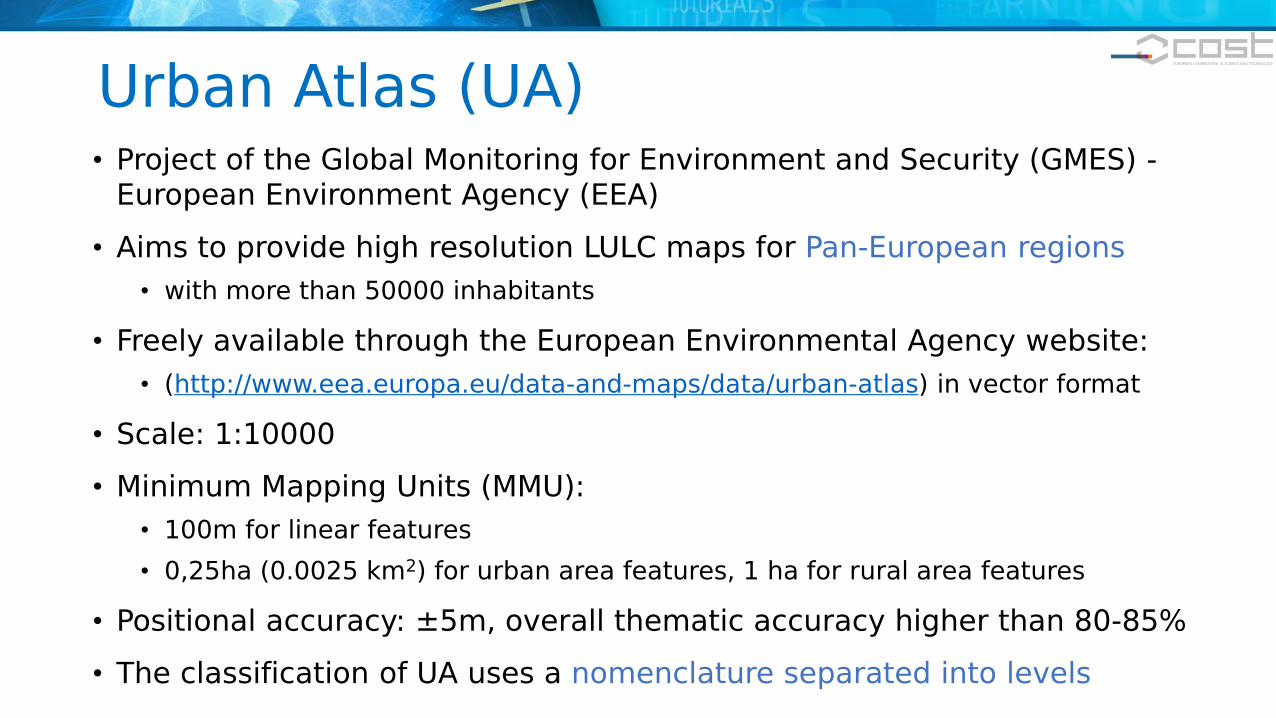
• Project of the Global Monitoring for Environment and Security (GMES) -European Environment Agency (EEA)
• Aims to provide high resolution LULC maps for Pan-European regions
• with more than 50000 inhabitants
• Freely available through the European Environmental Agency website:
• (http://www.eea.europa.eu/data-and-maps/data/urban-atlas) in vector format
• Scale: 1:10000
• Minimum Mapping Units (MMU):
• 100m for linear features
• 0,25ha (0.0025 km2) for urban area features, 1 ha for rural area features
• Positional accuracy: ±5m, overall thematic accuracy higher than 80-85%
• The classification of UA uses a nomenclature separated into levels
Urban Atlas (UA)
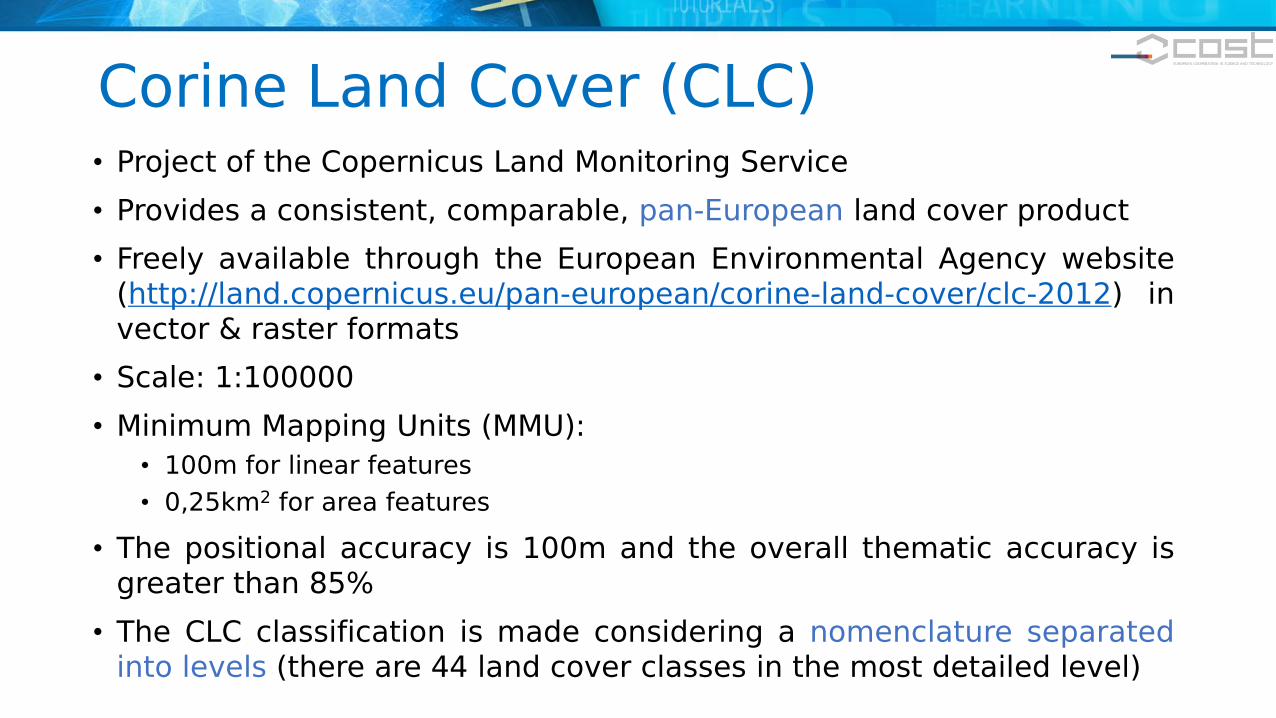
• Project of the Copernicus Land Monitoring Service
• Provides a consistent, comparable, pan-European land cover product
• Freely available through the European Environmental Agency website(http://land.copernicus.eu/pan-european/corine-land-cover/clc-2012) invector & raster formats
• Scale: 1:100000
• Minimum Mapping Units (MMU):
• 100m for linear features
• 0,25km2 for area features
• The positional accuracy is 100m and the overall thematic accuracy isgreater than 85%
• The CLC classification is made considering a nomenclature separatedinto levels (there are 44 land cover classes in the most detailed level)
Corine Land Cover (CLC)

• The nomenclatures of UA and CLC are compatible. The main differenceis that more detailed urban classes can be found in UA (even withoutconsidering the 4th level) and other land cover classes in CLC are moredetailed than in UA, which reflects differences in their overall purpose.
Urban Atlas nomenclature Corine Land Cover nomenclatureLevel 1 Level 2 Level 3 Level 1 Level 2 Level 3
1.Artificial Surfaces 1.1 Urban Fabric 1.1.1 Continuous urban fabric1.1.2 Discontinuous urban fabric1.1.3 Isolated Structures
1.Artificial Surfaces 1.1 Urban Fabric 1.1.1 Continuous urban fabric1.1.2 Discontinuous urban fabric
1.2 Industrial, commercial, public, military, private and transport units
1.2.1 Industrial, commercial, public, military and private units1.2.2 Road and rail network and associated land1.2.3 Port areas1.2.4 Airports
1.2 Industrial, commercial, public, military, private and transport units
1.2.1 Industrial or commercial units1.2.2 Road and rail network and associated land1.2.3 Port areas1.2.4 Airports
1.3 Mine, dump and construction sites
1.3.1 Mineral extraction and dump sites1.3.3 Construction sites1.3.4 Land without current use
1.3 Mine, dump and construction sites
1.3.1 Mineral extraction1.3.2 Dump sites1.3.3 Construction sites
1.4 Artificial non-agricultural vegetated areas
1.4.1 Green urban areas1.4.2 Sports and leisure facilities
1.4 Artificial non-agricultural vegetated areas
1.4.1 Green urban areas1.4.2 Sports and leisure facilities
UA & CLC nomenclatures
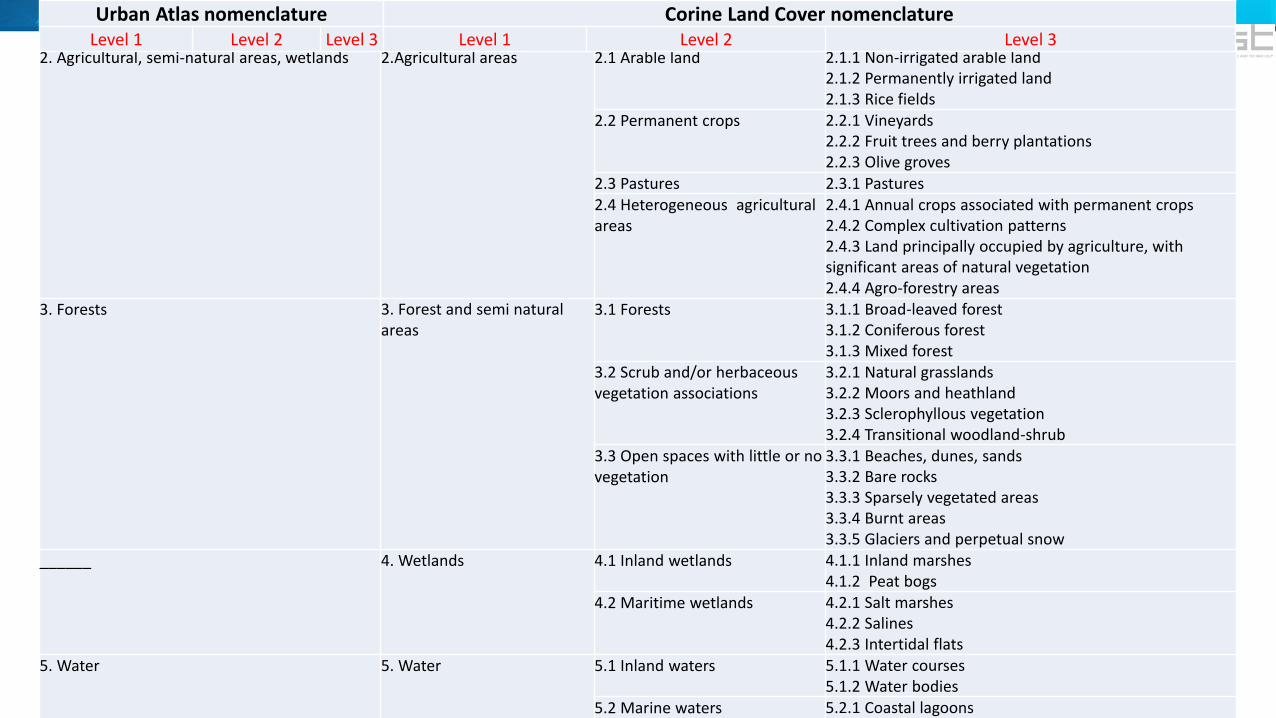
2. Agricultural, semi-natural areas, wetlands 2.Agricultural areas 2.1 Arable land 2.1.1 Non-irrigated arable land2.1.2 Permanently irrigated land2.1.3 Rice fields
2.2 Permanent crops 2.2.1 Vineyards2.2.2 Fruit trees and berry plantations2.2.3 Olive groves
2.3 Pastures 2.3.1 Pastures2.4 Heterogeneous agricultural areas
2.4.1 Annual crops associated with permanent crops2.4.2 Complex cultivation patterns2.4.3 Land principally occupied by agriculture, withsignificant areas of natural vegetation2.4.4 Agro-forestry areas
3. Forests 3. Forest and semi natural areas
3.1 Forests 3.1.1 Broad-leaved forest3.1.2 Coniferous forest3.1.3 Mixed forest
3.2 Scrub and/or herbaceous vegetation associations
3.2.1 Natural grasslands3.2.2 Moors and heathland3.2.3 Sclerophyllous vegetation3.2.4 Transitional woodland-shrub
3.3 Open spaces with little or no vegetation
3.3.1 Beaches, dunes, sands3.3.2 Bare rocks3.3.3 Sparsely vegetated areas3.3.4 Burnt areas3.3.5 Glaciers and perpetual snow
______ 4. Wetlands 4.1 Inland wetlands 4.1.1 Inland marshes4.1.2 Peat bogs
4.2 Maritime wetlands 4.2.1 Salt marshes4.2.2 Salines4.2.3 Intertidal flats
5. Water 5. Water 5.1 Inland waters 5.1.1 Water courses5.1.2 Water bodies
5.2 Marine waters 5.2.1 Coastal lagoons5.2.2 Estuaries
Urban Atlas nomenclature Corine Land Cover nomenclatureLevel 1 Level 2 Level 3 Level 1 Level 2 Level 3

Methodology to convert OSM data into UA & CLC nomenclatureThe main steps of the methodology are:
• Step 1: Associate the key/value combinations available in OSM
with the LULC classes in the LULC product of interest, in this case
UA or CLC
• Step 2: Run the conversion process, based on user-defined
values for some parameters
• Step 3: Eliminate inconsistencies such as overlapping regions
assigned to different classes
• Step 4: If a MMU is to be considered, then generalize the map so
that all regions with smaller areas are merged with neighboring
features

Methodology to convert OSM data into UA & CLC nomenclature
Step 1
Step 2
Step 3
Step 4

Step 2 – Conversion (example class 1.2)

• Aspects considered to create a hierarchical approach
• Elements of the landscape that are more important in the organization of space
• for example roads and water lines
• Most frequent ordering of the overlapping elements in reality
• for example, roads are usually found over water and not the inverse
• Typical relative size of objects in the regions under analysis
• size of parks and urban green areas relative to agricultural regions
• The importance of the features
• industrial areas vs. residential
• The most common topological relations
• for example, an agricultural region may contain buildings but buildings do not contain agricultural regions
Step 3 – Solving inconsistencies

Level of priority
UA class UA class name CLC class CLC class name
1 1 Artificial surfaces 1 Artificial surfaces
2 5 Water 5 Water
3 2Agricultural, semi-natural areas, wetlands
4 Wetlands
4 3 Forests 2 Agricultural areas
5 --- --- 3 Forests
Solving inconsistencies – priority level 1
• Definition of priorities in the UA & CLC classes (level 1):

Level of priority
UA Class UA class name CLC CLC class name
1 1.2Industrial, commercial, public, military, private and transport units
1.2Industrial, commercial, public, military, private and transport units
2 5.0 Water 5.1 Inland water
3 1.4 Artificial non-agricultural vegetated areas 5.2 Marine water
4 1.3 Mine, dump and construction sites 4.1 Inland wetlands
5 1.1 Urban Fabric 4.2 Maritime wetlands
6 2.0 Agricultural, semi-natural areas, wetlands 1.4 Artificial non-agricultural vegetated areas
7 3.0 Forests 1.3 Mine, dump and construction sites
8 --- --- 1.1 Urban Fabric
9 --- --- 2.2 Permanent crops
10 --- --- 2.1 Arable land
11 --- --- 2.4 Heterogeneous agricultural areas
12 --- --- 2.3 Pastures
13 --- --- 3.2Scrub and/or herbaceous vegetation associations
14 --- --- 3.3 Open spaces with little or no vegetation
15 --- --- 3.1 Forests
Solving inconsistencies – priority level 2

Methodology (application workflow)
© OpenStreetMap contributors
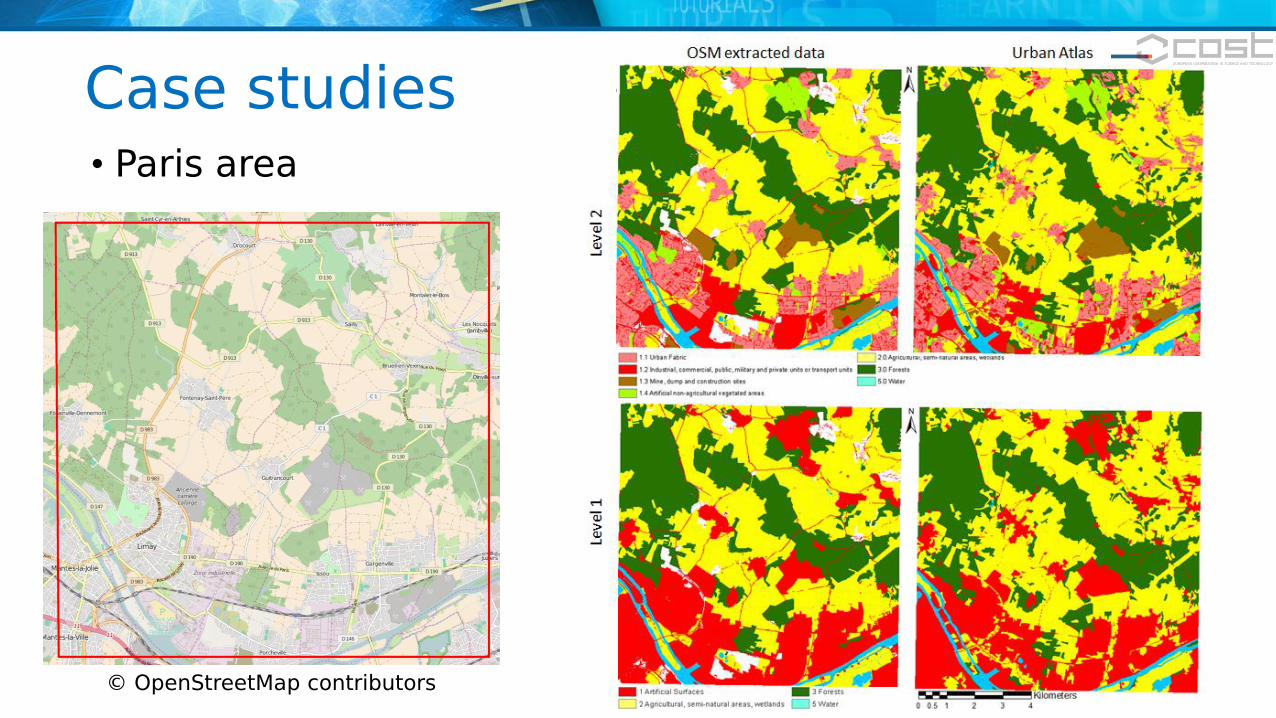
Case studies• Paris area

OSM extracted data Corine Land Cover
© OpenStreetMap contributors
Case studies• Paris area
© OpenStreetMap contributors
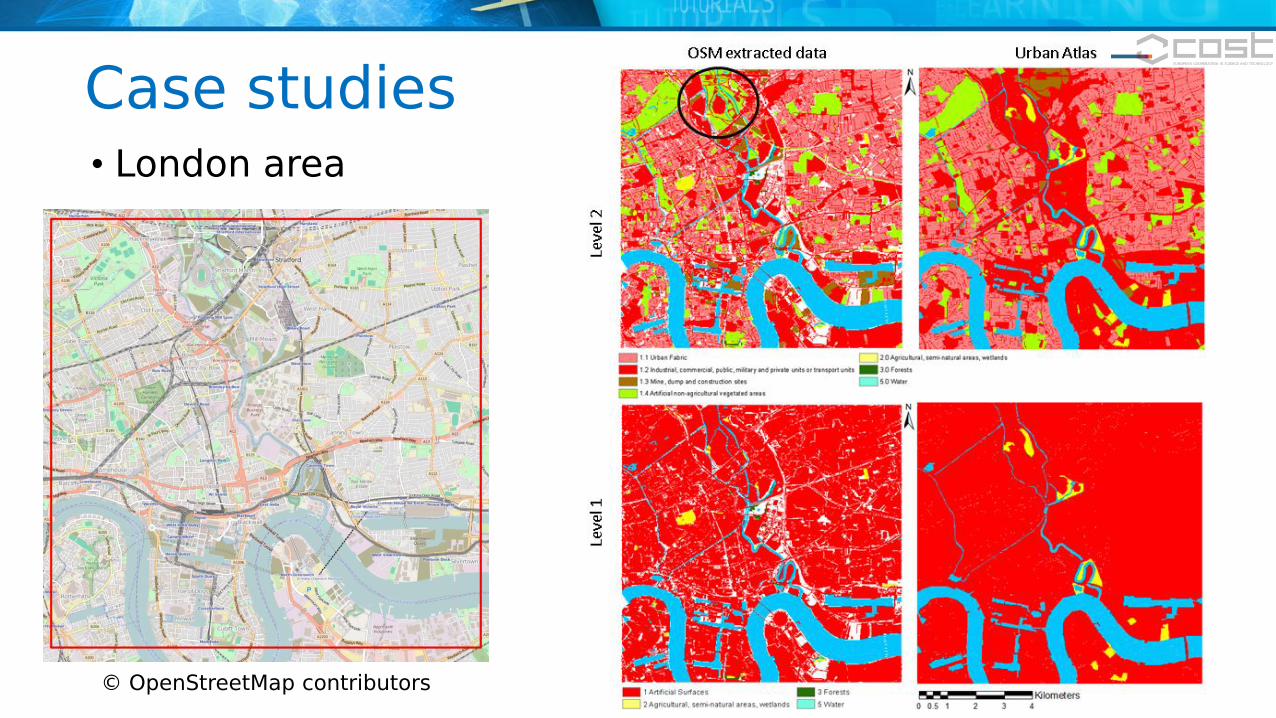
Case studies• London area
© OpenStreetMap contributors
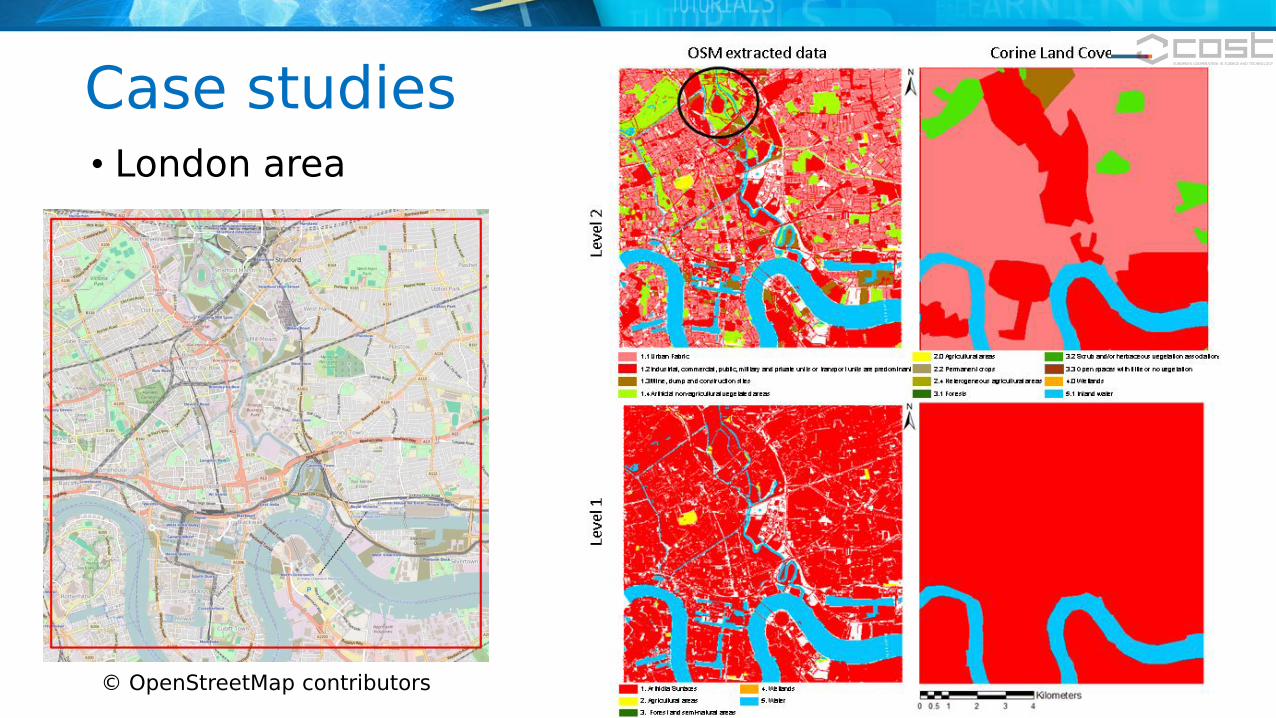
Case studies• London area
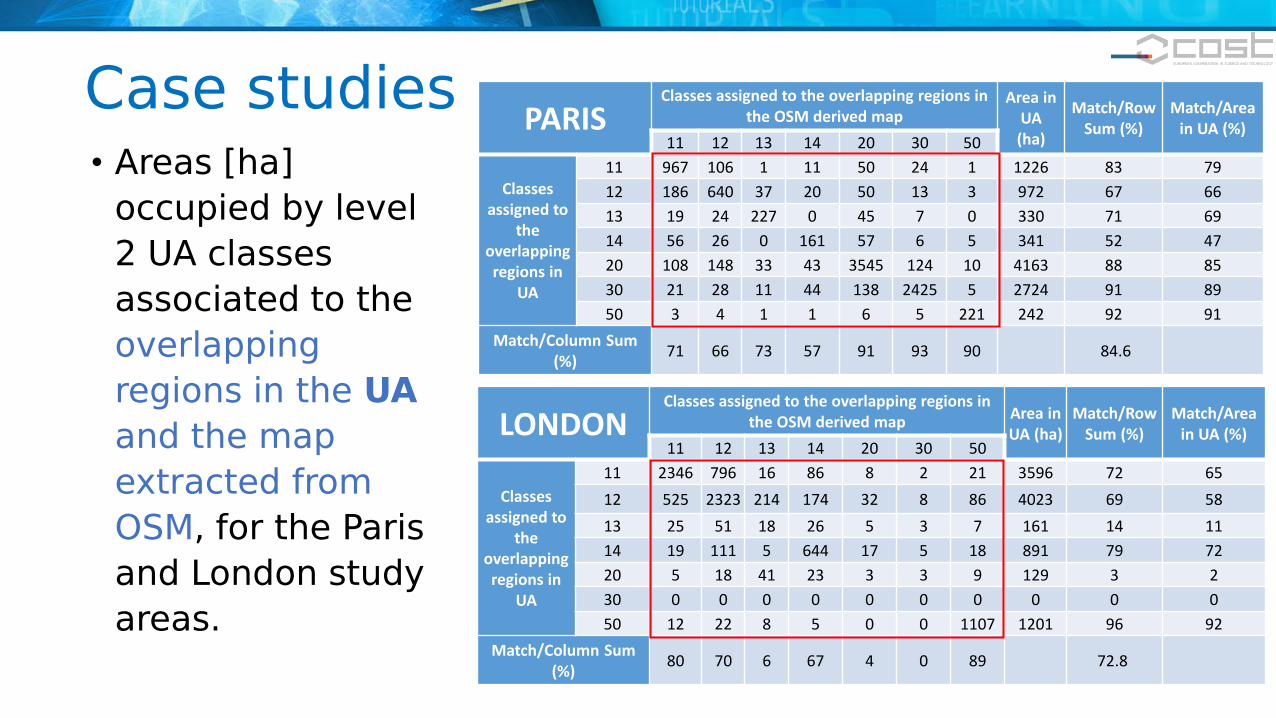
Case studies• Areas [ha]
occupied by level
2 UA classes
associated to the
overlapping
regions in the UA
and the map
extracted from
OSM, for the Paris
and London study
areas.
PARISClasses assigned to the overlapping regions in
the OSM derived mapArea in
UA(ha)
Match/Row Sum (%)
Match/Area in UA (%)
11 12 13 14 20 30 50
Classes assigned to
the overlapping regions in
UA
11 967 106 1 11 50 24 1 1226 83 79
12 186 640 37 20 50 13 3 972 67 66
13 19 24 227 0 45 7 0 330 71 69
14 56 26 0 161 57 6 5 341 52 47
20 108 148 33 43 3545 124 10 4163 88 85
30 21 28 11 44 138 2425 5 2724 91 89
50 3 4 1 1 6 5 221 242 92 91
Match/Column Sum (%)
71 66 73 57 91 93 90 84.6
LONDONClasses assigned to the overlapping regions in
the OSM derived mapArea in UA (ha)
Match/Row Sum (%)
Match/Area in UA (%)
11 12 13 14 20 30 50
Classes assigned to
the overlapping regions in
UA
11 2346 796 16 86 8 2 21 3596 72 65
12 525 2323 214 174 32 8 86 4023 69 58
13 25 51 18 26 5 3 7 161 14 11
14 19 111 5 644 17 5 18 891 79 72
20 5 18 41 23 3 3 9 129 3 2
30 0 0 0 0 0 0 0 0 0 0
50 12 22 8 5 0 0 1107 1201 96 92
Match/Column Sum (%)
80 70 6 67 4 0 89 72.8

PARISClasses assigned to the overlapping regions in
the OSM derived mapArea in
CLC (ha)
Match/Row Sum (%)
Match/Area in CLC (%)
11 12 13 14 20 31 32 51
Classes assigned to
the overlapping regions in
CLC
11 1238 309 20 48 97 7 1 3 1762 72 70
12 31 457 4 16 26 5 0 4 548 84 84
13 0 16 167 0 31 9 0 0 224 75 75
14 5 2 0 131 0 1 0 0 139 94 94
20 52 132 9 37 3480 128 1 9 4109 90 85
31 19 43 310 282 1 0 0 0 2763 0 0
32 5 5 95 0 13 2 23 4 150 16 15
51 9 11 1 7 45 3 0 223 303 75 74
Match/Column Sum (%)
91 47 54 46 90 0 88 91 75.5
Case studies• Areas [ha]
occupied by level
2 UA classes
associated to the
overlapping
regions in the CLC
and the map
extracted from
OSM, for the Paris
and London study
areas.
LONDONClasses assigned to the overlapping regions in
the OSM derived mapArea in
CLC(ha)
Match/Row Sum (%)
Match/Area in CLC (%)
11 12 13 14 20 30 51
Classes assigned to
the overlapping regions in
CLC
11 2685 1861 64 448 45 8 120 5880 51 46
12 218 1258 228 171 17 13 374 2726 55 46
13 12 77 11 29 2 2 2 156 8 7
14 16 120 0 312 0 0 18 478 67 65
20 0 0 0 0 0 0 0 0 0 0
30 0 0 0 0 0 0 0 0 0 0
51 2 6 0 1 0 0 740 760 99 97
Match/Column Sum (%)
92 38 4 32 0 0 59 56.5
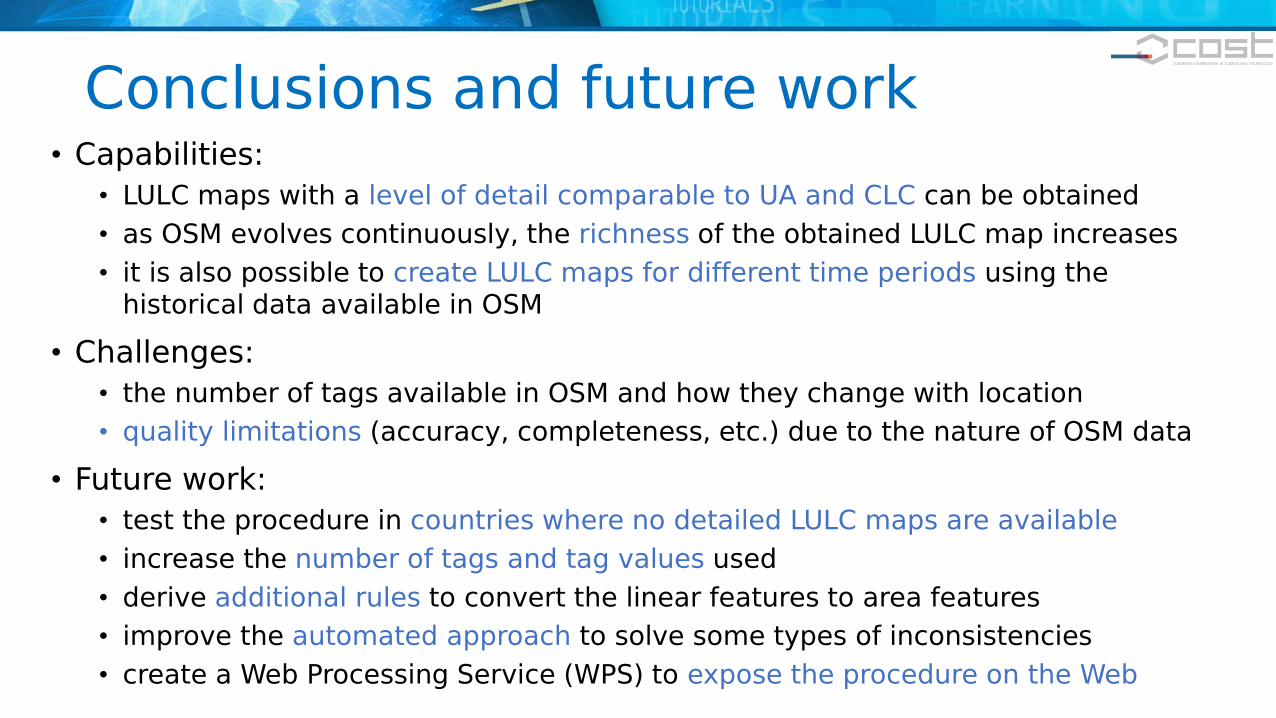
• Capabilities:
• LULC maps with a level of detail comparable to UA and CLC can be obtained
• as OSM evolves continuously, the richness of the obtained LULC map increases
• it is also possible to create LULC maps for different time periods using the historical data available in OSM
• Challenges:
• the number of tags available in OSM and how they change with location
• quality limitations (accuracy, completeness, etc.) due to the nature of OSM data
• Future work:
• test the procedure in countries where no detailed LULC maps are available
• increase the number of tags and tag values used
• derive additional rules to convert the linear features to area features
• improve the automated approach to solve some types of inconsistencies
• create a Web Processing Service (WPS) to expose the procedure on the Web
Conclusions and future work
• Fonte C.C., Minghini M., Antoniou V., See L., Patriarca J., Brovelli M.A. and Milcinski G. (2016) “An automated methodology for converting OSM data into a land use/cover map”. Proceedings of the 6th International Conference on Cartography & GIS, Vol. 1, pp. 462-473, Albena (Bulgaria), June 13-17, 2016, Bulgarian Cartographic Association, ISSN 1314-0604.
• Fonte C.C., Minghini M., Antoniou V., See L., Patriarca J. and Brovelli M.A. “Using OpenStreetMap to Create Land Use and Land Cover Maps: Development of an Application”. Submitted as a book chapter for the forthcoming book “Volunteered Geographic Information and the Future of Geospatial Data”.
• Fonte C.C., Minghini M., Antoniou V., See L., Patriarca J. and Brovelli M.A. “Generation of Detailed Land Use and Land Cover Maps for Developing Regions using OpenStreetMap”. In preparation, to be submitted to ISPRS Journal of Geo-Information.
References

Thanks to both COST Actions for
making this work possible!