building an all-in nation - center for american … an all-in nation ... changing demographics and...
TRANSCRIPT

WWW.AMERICANPROGRESS.ORG
ASSO
CIATED PRESS /JU
LIE JACO
BSON
Building an All-In NationA View from the American Public
Survey research by the Center for American Progress and PolicyLink, in partnership with the Rockefeller Foundation October 2013

Building an All-In NationA View from the American Public
Survey research by the Center for American Progress and PolicyLink, in partnership with the Rockefeller Foundation
Report and analysis written by
Ruy Teixeira and John Halpin, Center for American Progress
with Matt Barreto and Adrian Pantoja, Latino Decisions
October 2013

1 Introduction and summary 3 Methodological note
3 Key findings
8 Section 1: What the public knows and thinks about America’s rising diversity
8 Factual understanding of diversity in America
10 Openness-to-diversity composite index
15 The opportunities from rising diversity
17 The challenges from rising diversity
20 Section 2: Public attitudes toward a new equity agenda 20 Support for new steps and investments to reduce racial and ethnic inequality
22 Beliefs about individual and collective action
25 How individual and collective attitudes shape policy choices
27 Reasons to address racial and ethnic inequality in America and likely outcomes
31 Conclusion 32 Author bios
32 Acknowledgements
33 Endnotes
34 Appendix: Full survey results by race and ethnicity
Contents

1 Center for American Progress | Building an All-In Nation
Introduction and summary
It is an undeniable fact that the United States is becoming increasingly diverse, rapidly heading toward the day when there will no longer be any clear racial or ethnic majority in the U.S. population. Already, more than half of newborns today are children of color, and demographers predict that more than half of all youth will be of color before the end of this decade.1 As youth drive this demographic change, each generation is becoming more racially and ethnically mixed than the one before.
According to Census projections, by 2043, non-Hispanic whites will become a minority of our population. By 2050, they will be only 47 percent of the U.S. pop-ulation, with communities of color combining to form a solid 53 percent majority. Hispanics will make up 28 percent of the population, up from 16 percent in 2010, and African Americans will make up 13 percent, about 1 percentage point higher than their level in 2010. Asians will make up 7 percent, up from 5 percent in 2010, and another 0.7 percent will be made up of American Indian/Alaska Natives, unchanged from their 2010 levels. Finally, multiracial individuals should double in size, from their current 2 percent of the population to 4 percent by 2050.2
Earlier this year, the Center for American Progress and PolicyLink released All-In Nation: An America that Works for All—a comprehensive book analyzing these changing demographics and exploring policies to ensure that a more diverse workforce is prepared for the jobs of the future and that all people are in a position to contribute to and benefit from economic growth. The goal of the book was not only to stress the moral need to ensure greater opportunities for all people but also to highlight the clear economic benefits for the entire nation of reducing racial and ethnic disparities in education, employment, and other areas. As part of this research project and as a complement to the book, CAP and PolicyLink joined with the Rockefeller Foundation and Latino Decisions to assess how Americans view issues of rising diversity and policy proposals to better integrate these com-munities into the mainstream of American society and its economy.

2 Center for American Progress | Building an All-In Nation
We set out to answer a number of questions about the public’s understanding of a changing America, its reactions to rising diversity, and its possible support for a new equity agenda that would lift up both whites and communities of color and help improve our overall economy. Among the questions explored are:
• Do Americans have a clear understanding of the current and future demo-graphic make-up of U.S. society and the workforce?
• How open are Americans overall to diversity? Do they see more opportunities or more challenges with rising racial and ethnic diversity in our nation?
• Are there differences in attitudes both between and among specific communi-ties of color and whites?
• How concerned are people about the racial, ethnic, and economic inequalities in American life?
• Would Americans support or oppose policies and investments to help reduce these inequalities?
This study is one of the largest of its kind. It is based on nearly 3,000 total inter-views with Americans, including large oversamples of the African American, Latino, and Asian American communities. The breadth and depth of the study allowed us to get a clearer picture of exactly how Americans are reacting to ongo-ing social and demographic change.

3 Center for American Progress | Building an All-In Nation
As shown throughout this report, Americans are much more open to diversity and more supportive of steps to reduce racial inequalities than is commonly portrayed in politics and the media. Furthermore, Americans are more likely to see oppor-tunities from rising diversity than they are to see challenges. They understand the problems associated with inequality in society and strongly support new steps and investments to reduce these inequalities and expand economic opportunities. Although differences remain between rising communities of color and whites in terms of openness to diversity and support for new policies to close remaining social gaps, many of these distinctions are more ideological in nature and less about race and ethnicity.
Some of the most important findings and conclusions from the study include:
Americans vastly overestimate current and future levels of diversity. When asked to estimate the current percentage of the U.S. population that is composed of racial and ethnic minorities, Americans are considerably off the mark. The median response—49 percent—indicates that the typical American thinks we are nearly a majority-minority nation already; the actual percent of the nation that is a minor-ity is about 37 percent.3 These overestimates are prevalent across racial groups. Asians were the closest in their estimation, with their range of responses averag-ing 43 percent, followed by whites with an average of 48 percent, Latinos with an average of 50 percent, and African Americans with an average of 53 percent.
Latino Decisions conducted a nationwide telephone survey of 2,943 Americans from June 11 to July 10, 2013.
All respondents were 18 years of age or older and were contacted by live callers, with five total call attempts
made to each number. A base sample of 2,000 respondents was randomly selected from a nationwide random-
digit-dialing, or RDD, sample, with contact made to both landline and cell-phone-only households. In addition,
oversamples were completed to targeted telephone numbers of African American, Latino, and Asian households,
both landline and cell phone only. The total sample includes 1,319 white non-Hispanic respondents, 505 African
American respondents, 502 Latino respondents, 515 Asian respondents, and 102 respondents of “other” races or
ethnicities—American Indians and others who do not identify as either white, African American, Latino, or Asian.
Latino respondents were given the option to answer the survey in either English or Spanish, and Asian respon-
dents were given the option to answer the survey in English, Chinese, Korean, or Vietnamese. The overall sample
contains a nominal margin of error of plus or minus 1.8 percent. The white subsample has a margin of error of 2.7
percent, and the African American, Latino, and Asian subsamples each have a margin of error of 4.4 percent.
Methodological note

4 Center for American Progress | Building an All-In Nation
And Americans’ prediction for the share of the country’s population that will be composed of communities of color by the year 2050—62 percent—considerably exceeds the Census Bureau’s 53 percent projection.
Americans overall are not pressing the panic button about rising diversity in
society. By and large, positive sentiments about opportunities from rising diver-sity tend to outweigh negative concerns about rising diversity. Using two unique composite measures—one that combines levels of agreement with eight state-ments about the opportunities from rising diversity and one that combines levels of agreement with eight statements about concerns with these changes—we find that the average scores on the opportunity index are higher—with a mean of 51—than average scores on our concern index, which have a mean of 44. This relation-ship holds true across racial groups.
Despite the general acceptance of demographic change, there is considerable
variation by race and ethnicity in terms of openness to rising diversity. Our 160-point composite openness index—which combines the responses across all 16 opportunity and concern questions, with 160 being the most open to diversity and zero being the least open to diversity—shows a mean score for the overall population of 86.5, with African Americans reporting a mean of 93, Latinos a mean of 90, Asians a mean of 97, and whites a mean of just 84. Interestingly, these differences are driven mostly by divergent views about the opportunities from ris-ing diversity—where whites are not as optimistic as people of color—rather than by concerns about diversity, where differences are smaller.
The younger generation and those with higher levels of education exhibit much
more openness to rising diversity. Generally, openness to rising diversity goes down with age and up with education. The youngest age group—Americans ages 18 to 29—reports a mean score of 92, compared to the oldest age group—Americans ages 65 or older—which scores an average of 80 on the index. High school graduates score an 83, while postgraduates score a 96. In contrast to varia-tion by race, differences in openness by age and education are primarily driven by concern issues, where the older and less educated are more pessimistic, rather than opportunity issues. This suggests that as rising generations replace older ones and as America becomes a more educated society, concerns about rising diversity will recede and openness to diversity will increase.
5 Center for American Progress | Building an All-In Nation
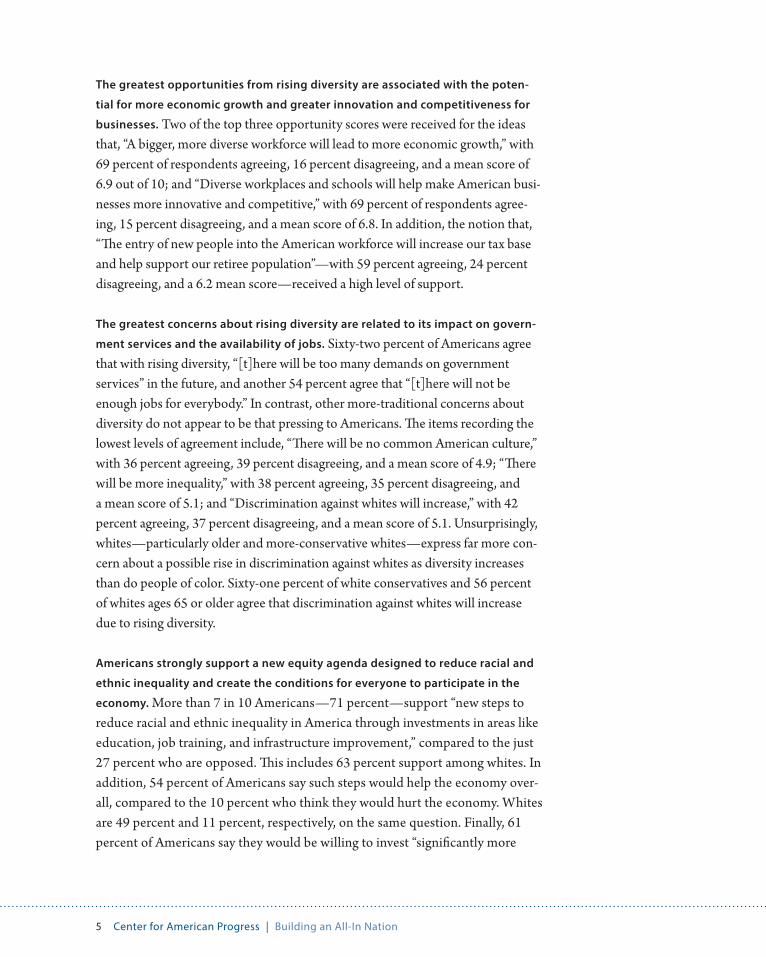
The greatest opportunities from rising diversity are associated with the poten-
tial for more economic growth and greater innovation and competitiveness for
businesses. Two of the top three opportunity scores were received for the ideas that, “A bigger, more diverse workforce will lead to more economic growth,” with 69 percent of respondents agreeing, 16 percent disagreeing, and a mean score of 6.9 out of 10; and “Diverse workplaces and schools will help make American busi-nesses more innovative and competitive,” with 69 percent of respondents agree-ing, 15 percent disagreeing, and a mean score of 6.8. In addition, the notion that, “The entry of new people into the American workforce will increase our tax base and help support our retiree population”—with 59 percent agreeing, 24 percent disagreeing, and a 6.2 mean score—received a high level of support.
The greatest concerns about rising diversity are related to its impact on govern-
ment services and the availability of jobs. Sixty-two percent of Americans agree that with rising diversity, “[t]here will be too many demands on government services” in the future, and another 54 percent agree that “[t]here will not be enough jobs for everybody.” In contrast, other more-traditional concerns about diversity do not appear to be that pressing to Americans. The items recording the lowest levels of agreement include, “There will be no common American culture,” with 36 percent agreeing, 39 percent disagreeing, and a mean score of 4.9; “There will be more inequality,” with 38 percent agreeing, 35 percent disagreeing, and a mean score of 5.1; and “Discrimination against whites will increase,” with 42 percent agreeing, 37 percent disagreeing, and a mean score of 5.1. Unsurprisingly, whites—particularly older and more-conservative whites—express far more con-cern about a possible rise in discrimination against whites as diversity increases than do people of color. Sixty-one percent of white conservatives and 56 percent of whites ages 65 or older agree that discrimination against whites will increase due to rising diversity.
Americans strongly support a new equity agenda designed to reduce racial and
ethnic inequality and create the conditions for everyone to participate in the
economy. More than 7 in 10 Americans—71 percent—support “new steps to reduce racial and ethnic inequality in America through investments in areas like education, job training, and infrastructure improvement,” compared to the just 27 percent who are opposed. This includes 63 percent support among whites. In addition, 54 percent of Americans say such steps would help the economy over-all, compared to the 10 percent who think they would hurt the economy. Whites are 49 percent and 11 percent, respectively, on the same question. Finally, 61 percent of Americans say they would be willing to invest “significantly more

6 Center for American Progress | Building an All-In Nation
public funds to help close [the] gap in college graduation rates” between black and Latino students and white students, compared to the 36 percent who say they are not willing to make such investments. Again, while whites are lower than minorities in their support, they still endorse this proposition by a margin of 53 percent to 46 percent.
Ideological attitudes about individual and collective action explain many of the
differences in the support for an equity agenda. Americans are essentially split on the relative value of individual versus collective action, with 49 percent of the public agreeing that our economic challenges are common and that we all need to work together and 47 percent believing that Americans are basically on their own and cannot count on others to help them. Racial splits are sharp on this basic framing of American life, with majorities of African Americans, Latinos, and Asians agreeing that we should “work together” on common economic challenges—69 percent, 54 percent, and 52 percent, respectively. A majority of whites—52 percent—believe that Americans are “on their own” and cannot count on others. These basic ideological views, in turn, produce sharp differences in support for an equity agenda among whites. More than two-thirds of whites—67 percent—who strongly agree that they are on their own, for example, oppose government intervention in the economy to promote equity. In contrast, a clear majority of whites—53 percent—who strongly believe that we must work together on common economic challenges support government efforts to reduce inequality.
Lower education levels for blacks and Latinos and poverty-level wages are
viewed as the most serious problems associated with inequality in America. We tested a variety of facts related to inequality to see which were regarded as most dire. The three most-serious problems were as follows: 1) “Forty-eight percent of black eighth graders and 43 percent of Latino eighth graders score below basic on math and reading tests, compared to 17 percent of whites,” with 88 percent of respondents saying this is a very serious or a serious problem; 2) “A quarter of all jobs in the United States now pay below poverty-level wages,” with 86 percent of respondents saying this is a very serious or a serious problem; and 3) “One in four children under age 5 live in poverty, including around two in five black and Latino children,” with 85 percent of respondents saying this is a very serious or a serious problem.
7 Center for American Progress | Building an All-In Nation
The potential for a better-prepared workforce and reductions in overall poverty
are the most convincing reasons for Americans to support a new equity agenda.
We also tested a range of research findings on the benefits of eliminating racial inequality to see which ones motivated respondents to support $120 billion a year in new investments to achieve that goal. The two most convincing reasons for Americans to support such investments are as follows: 1) “The estimated 42 per-cent of the workforce who will be black or Latino by 2050 will be better prepared for the jobs of the future,” with 69 percent of respondents saying that reason is very or somewhat convincing; and 2) “13 million people will be lifted out of pov-erty,” with 65 percent saying this reason is very or somewhat convincing. The least convincing reason to support a new equity agenda is the projection that “average incomes would go up by $3000.” Fifty-four percent of respondents said this was very or somewhat convincing.
Let’s examine Americans’ attitudes toward rising diversity in greater detail.

8 Center for American Progress | Building an All-In Nation
Section 1: What the public knows and thinks about America’s rising diversity
Knowledge about diversity
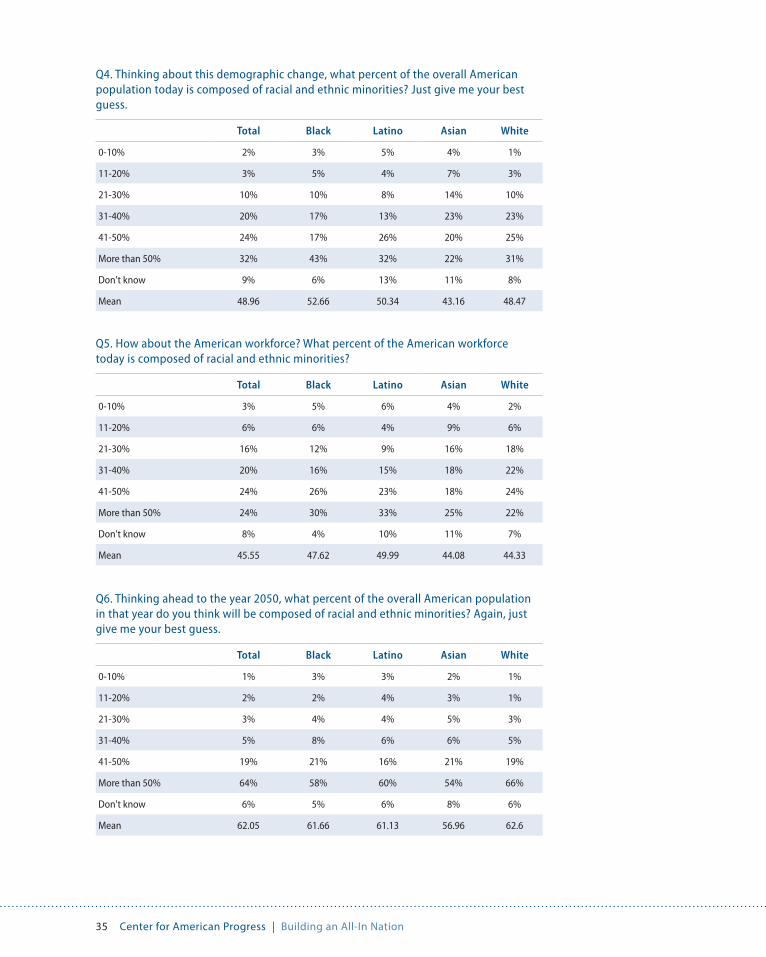
In the survey, we asked a series of open-ended questions to tap into people’s knowledge about rising diversity. We asked people to estimate what percent-ages of the current population and the workforce are racial and ethnic minorities and what those percentages would be 37 years from now, in 2050. The answers showed that Americans are not in denial about the high and rising levels of diver-sity in our society. Indeed, rather than underestimating this diversity, they tend to significantly overestimate both current and future levels of diversity. Let’s start, for example, with their estimates of the current share of people of color in our population. The average response for all respondents was 49 percent. This indicates that the typi-cal American thinks we are nearly a majority-minority nation already; the correct figure is about 37 percent. Just 20 percent of respondents put the percentage in the correct decile—31 percent to 40 percent—and 56 percent put the percentage in the 41 percent-to-50 percent decile or higher.
These overestimates are prevalent across racial groups. Asians had the most accu-rate estimates, with respondents estimating an average of 43 percent—followed by whites with an average of 48 percent, Latinos with an average of 50 percent, and African Americans with an average of 53 percent.
Respondents’ estimates were also high for the percent of racial and ethnic minorities in the population by 2050—an average of 62 percent. This consider-ably exceeds the Census Bureau’s 53 percent projection for the share of people of color by 2050. Again, estimates were high across racial groups. Asians were the closest in their estimations, averaging 57 percent, followed by Latinos at 61 percent, African Americans at 62 percent, and whites at 63 percent.

9 Center for American Progress | Building an All-In Nation
Current people of color population
estimates
Projections of people of color
population by 2050
Current estimates of people of color in the workforce
Projections of people of color in the
workforce by 2050
Projections of elderly population
by 2050
Correct figure
60%
50%
40%37% 36%
53% 55%
21%
30%
20%
10%
CHART 1
Population estimatesAl
l
Whi
te
Blac
k
Latin
o
Asia
n
All
Whi
te
Blac
k
Latin
o
Asia
n
All
Whi
te
Blac
k
Latin
o
Asia
n
All
Whi
te
Blac
k
Latin
o
Asia
n
All
Whi
te
Blac
k
Latin
o
Asia
n
Estimates of the percentage of the current U.S. workforce composed of racial and ethnic minorities told the same basic story. The overall average was 46 percent, compared to the actual figure of around 36 percent.4 Here, Asians and whites were tied for the lowest estimates, both at around 44 percent, while African Americans were at 48 percent and Latinos were at 50 percent.
Finally, respondents’ estimates of the share of the U.S. workforce that will be made up of racial and ethnic minorities by 2050 came in at 59 percent, compared to the Census Bureau’s current projection of around 55 percent.5 This was the most accurate estimate of the four “knowledge of diversity” questions, though still high. There also was less variation by race, with Asians estimating an average of 57 per-cent, Latinos an average of 58 percent, African Americans an average of just less than 59 percent, and whites an average of slightly more than 59 percent.

10 Center for American Progress | Building an All-In Nation
We also asked an additional question about the likely growth of the number of elderly people in our population to gauge whether people had a good sense of the large elderly population that our diversifying workforce will have to support in the future. We found that people were well aware of this challenge—indeed, they substantially overestimated it. While the Census projects that the elderly popula-tion—made up of Americans ages 65 or older—will rise from 13 percent to 21 percent by 2050,6 the average response in our survey projected a rise from 13 per-cent to 36 percent over that time period. Asians gave the lowest average estimate, 30 percent, followed by whites at 35 percent, Latinos at 37 percent, and African Americans at 42 percent.
Openness to diversity
Results from our survey indicate that despite the overestimates of current and future diversity reported in the previous section, Americans are not pressing the panic but-ton when it comes to the nation’s rising diversity. By and large, positive sentiments about opportunities from rising diversity tend to outweigh negative concerns.
We examined this by asking respondents whether they agreed or disagreed with 16 statements about rising diversity in America, evenly divided between concerns and opportunities. (see Table 1) The level of agreement with each statement was recorded on a 10-point scale, with maximum agreement being 10 and maximum disagreement being zero. From these statements, we created an 80-point opportu-nity index—formed by adding responses to the eight 10-point-scale questions on the opportunities presented by rising diversity—and an 80-point concern index, which was formed by adding responses to the eight 10-point-scale questions on concerns about rising diversity.
Analysis of these indices found that average scores on our opportunity index are higher than average scores on our concern index—mean scores of 51 and 44, respectively. This relationship holds across racial groups.
We also created a 160-point index measuring overall openness to diversity. We did this by reverse coding the concerns index so that the lowest level of concern was 80 and the highest level of concern was zero. We then added this to the opportunities index.

11 Center for American Progress | Building an All-In Nation
TABLE 1
16 Reactions to rising diversity Ranked by percentage total agree; dark blue = opportunities and light blue = concerns
Strongly agree (9-10)
Total agree(6-10)
Neutral (5)
Total disagree(0-4)
Strongly dis-agree (0-1)
Don’t know/Refused
Mean
1. Americans will learn more from one another and be enriched by exposure to many different cultures
32 70 15 15 4 0 6.9
2. A bigger, more diverse workforce will lead to more economic growth.
30 69 15 16 6 1 6.9
3. Diverse workplaces and schools will help make American businesses more innovative and competitive.
30 69 15 15 5 1 6.8
4. People will become more accepting of their differences and more willing to find common ground.
24 65 18 16 6 0 6.6
5. There will be too many demands on government services.
34 62 16 21 8 1 6.6
6. With more diverse people working and living together, discrimination will decrease.
24 61 17 21 7 0 6.4
7. The entry of new people into the Ameri-can workforce will increase our tax base and help support our retiree population.
24 59 17 24 9 1 6.2
8. There will not be enough jobs for every-body.
28 54 17 28 12 1 6.0
9. Our country’s ideals of opportunity for everyone will be realized.
17 49 21 30 11 0 5.6
10. Crime and problems in our neighbor-hoods will go up.
20 47 22 31 11 1 5.7
11. The country’s global image will improve. 17 47 23 28 12 1 5.6
12. Our education system will get worse 21 44 20 35 15 0 5.4
13. There will be more conflict between ethnic and racial groups
16 44 21 34 10 1 5.4
14. Discrimination against whites will increase
17 42 21 37 16 1 5.1
15. There will be more inequality. 13 38 26 35 13 1 5.1
16. There will be no common American culture.
17 36 23 39 18 1 4.9
12 Center for American Progress | Building an All-In Nation
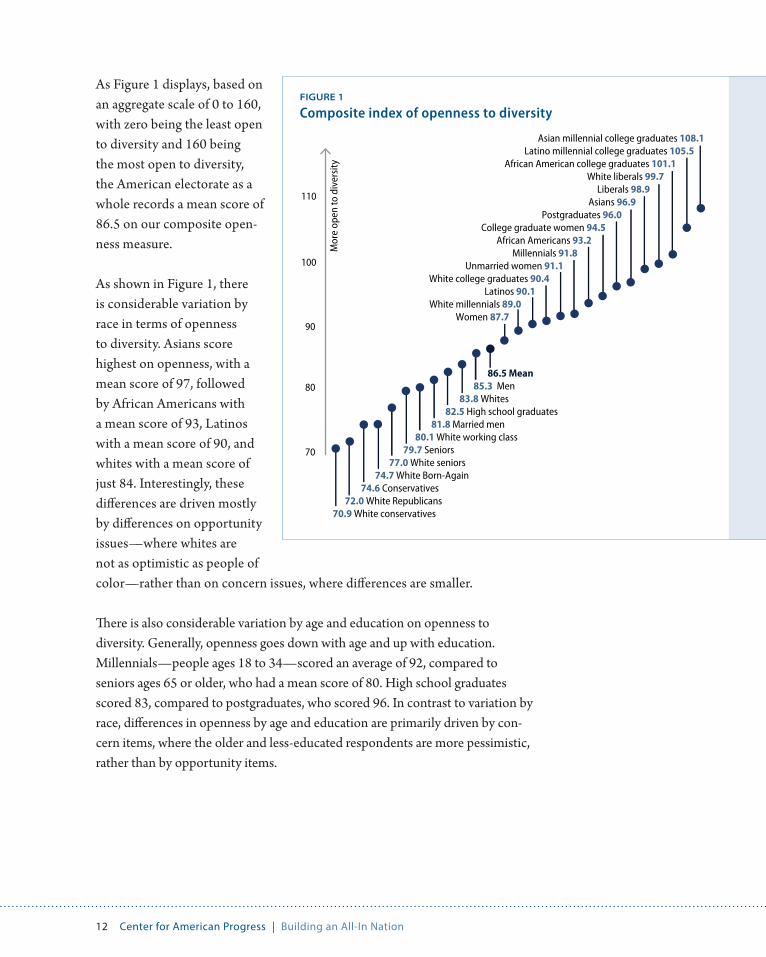
As Figure 1 displays, based on an aggregate scale of 0 to 160, with zero being the least open to diversity and 160 being the most open to diversity, the American electorate as a whole records a mean score of 86.5 on our composite open-ness measure.
As shown in Figure 1, there is considerable variation by race in terms of openness to diversity. Asians score highest on openness, with a mean score of 97, followed by African Americans with a mean score of 93, Latinos with a mean score of 90, and whites with a mean score of just 84. Interestingly, these differences are driven mostly by differences on opportunity issues—where whites are not as optimistic as people of color—rather than on concern issues, where differences are smaller.
There is also considerable variation by age and education on openness to diversity. Generally, openness goes down with age and up with education. Millennials—people ages 18 to 34—scored an average of 92, compared to seniors ages 65 or older, who had a mean score of 80. High school graduates scored 83, compared to postgraduates, who scored 96. In contrast to variation by race, differences in openness by age and education are primarily driven by con-cern items, where the older and less-educated respondents are more pessimistic, rather than by opportunity items.
Asian millennial college graduates 108.1Latino millennial college graduates 105.5
African American college graduates 101.1 White liberals 99.7
Liberals 98.9 Asians 96.9
Postgraduates 96.0 College graduate women 94.5
African Americans 93.2 Millennials 91.8
Unmarried women 91.1 White college graduates 90.4
Latinos 90.1 White millennials 89.0
Women 87.7
86.5 Mean 85.3 Men 83.8 Whites 82.5 High school graduates 81.8 Married men 80.1 White working class 79.7 Seniors 77.0 White seniors 74.7 White Born-Again 74.6 Conservatives 72.0 White Republicans70.9 White conservatives
70
80
90
100
110
Mor
e op
en to
div
ersi
ty
FIGURE 1
Composite index of openness to diversity

13 Center for American Progress | Building an All-In Nation
Looking at the responses to the underlying statements within these composite scores, there are some clear patterns in Americans’ beliefs about rising diver-sity, generally favoring the opportunities side of the ledger. Trends from Table 1 include the following:
• The strongest levels of agreement were registered for statements about rising diversity’s opportunities. Of the top six statements in our 16-item battery—all of which had 60 percent or more agreement and an average score of 6.4 or higher—five were opportunities, including the top three: 1) “Americans will learn more from one another and be enriched by exposure to many different cultures,” with 70 percent agreeing, 15 percent disagreeing, and an average score of 6.9; 2) “A bigger, more diverse workforce will lead to more economic growth,” with 69 percent agreeing, 16 percent disagreeing, and an average score of 6.9; and 3) “Diverse workplaces and schools will help make American businesses more innovative and competitive,” with 69 percent agreeing, 15 percent dis-agreeing, and an average score of 6.8.
• Only one of the top six statements was a concern about rising diversity, specifi-cally, the worry that there will be “too many demands on government services.” Sixty-two percent of respondents agreed with this statement, while 21 percent disagreed, averaging a score of 6.6.
• Majorities of Americans also agreed with the following three opportunity state-ments: 1) “People will become more accepting of their differences and more willing to find common ground,” with 65 percent agreeing, 16 percent disagree-ing, and an average score of 6.6; 2) “With more diverse people working and living together, discrimination will decrease,” with 61 percent of respondents agreeing, 21 percent disagreeing, and an average score of 6.4; and 3) “The entry of new people into the American workforce will increase our tax base and help support our retiree population,” with 59 percent agreeing, 24 percent disagree-ing, and an average score of 6.2.
• Only one other concern statement generated majority agreement: “There will not be enough jobs for everybody.” Fifty-four percent of respondents agreed and 28 percent disagreed, averaging a score of 6.

14 Center for American Progress | Building an All-In Nation
• The least-strong levels of agreement were all registered by concern statements. The bottom three were as follows: 1) “There will be no common American culture,” with 36 percent agreeing, 39 percent disagreeing, and an average score of 4.9; 2) “There will be more inequality,” with 38 percent agreeing, 35 percent disagreeing, and an average score of 5.1; and 3) “Discrimination against whites will increase,” with 42 percent agreeing, 37 percent disagreeing, and an average score of 5.1. Interestingly, on both the common-culture and inequality items, African Americans and Latinos expressed more concern than whites or Asians. Unsurprisingly, whites expressed far more con-cern about a possible rise in discrimination against whites than did respondents of color.
Note: Opportunity and concern scores do not add up to openness scores. Openness score = opportunity score + (80 - concern score).
New England 86.2 Opportunity 48.3Concern 42.2
Mid-Atlantic 93.4 Opportunity 54.1Concern 40.7
East North Central 83.5 Opportunity 50.0Concern 46.5
West North Central 85.1 Opportunity 50.4Concern 45.3
East South Central 78.2 Opportunity 47.3Concern 49.0
West South Central 81.6 Opportunity 49.1Concern 47.5
South Atlantic 84.5 Opportunity 49.9Concern 45.5
Mountain 82.7 Opportunity 47.7Concern 44.9
Pacific 92.3 Opportunity 53.2Concern 40.9
FIGURE 2
Openness to diversity by region
Note: Opportunity and concern scores do not add up to openness scores. Openness score = opportunity score + (80 - concern score).

15 Center for American Progress | Building an All-In Nation
Opportunities from rising diversity
Table 2 highlights the survey’s eight items concerning opportunities from ris-ing diversity. Six of the eight items elicited strong majority agreement from our respondents, suggesting that awareness of the opportunities from rising diversity is high among the American public and, in some cases, approaches consensual levels. Indeed, the top four opportunity items in the table above—learning from one another, promoting economic growth, promoting innovation and competi-tiveness, and finding common ground—all scored higher than any of the items tested on concerns about rising diversity. Moreover, for each of these items, all racial groups registered more than 60 percent support.
TABLE 2
Opportunities from rising diversity WNC= white noncollege; WC = white college
Total agree White
African American Latino Asian 18–34 65+ WNC WC
1. Americans will learn more from one another and be enriched by exposure to many different cultures
70 66 76 75 87 74 64 64 71
2. A bigger, more diverse workforce will lead to more economic growth.
69 65 81 79 75 74 61 64 65
3. Diverse workplaces and schools will help make American businesses more innovative and competitive.
69 65 78 75 82 75 60 62 71
4. People will become more accepting of their dif-ferences and more willing to find common ground.
65 62 71 69 70 69 61 58 70
5. With more diverse people working and living together, discrimination will decrease.
61 59 59 66 70 65 56 57 66
6. The entry of new people into the American work-force will increase our tax base and help support our retiree population.
59 55 65 70 65 57 59 52 62
7. Our country’s ideals of opportunity for everyone will be realized.
49 43 58 62 61 50 43 43 44
8. The country’s global image will improve. 47 41 59 61 64 52 43 40 44

16 Center for American Progress | Building an All-In Nation
But for these items and for the others we tested, there was nevertheless impor-tant variation by group in how people responded. Let’s start with race. While whites did average 65 percent support for the top four opportunity statements, support levels were much higher among people of color. Asians averaged 79 percent support, African Americans averaged 77 percent support, and Latinos averaged 75 percent support.
The next two opportunity statements—decreasing discrimination and increasing the tax base—also elicited majority support across racial groups, though at lower levels. Interestingly, African Americans matched whites in their support for the statement about decreasing discrimination—both at 59 percent. It was the only item on which whites’ level of agreement matched that of a group of color.
The last two statements—realizing our ideals of opportunity for everyone and improving our global image—received the least support and had wide racial varia-tion. Only 43 percent and 41 percent, respectively, of whites agreed with these statements, compared to the high 50 percent range for African Americans and the low 60 percent range for both Asians and Latinos.
Age is another clear source of variation in reactions to rising diversity, with posi-tive sentiment about opportunities dropping as age increased. While seniors ages 65 or older did agree at the 60 percent level or a bit above with each of the first four opportunity statements, Millennials—those Americans 18 to 34 years of age—were substantially higher on each opportunity item, averaging a 12-point gap when compared to seniors. Indeed, the only statement where the views of seniors and Millennials were close was the sixth, which concerns a more diverse workforce supporting our retiree population. On this item, seniors were actually more enthusiastic than Millennials—59 percent compared to 57 percent. This generational pattern means that, as new generations continue to replace older ones, appreciation of the opportunities presented by rising diver-sity will likely rise considerably.
In terms of education, positive sentiment about diversity’s opportunities tends to go up as education increases. The difference between white working-class or noncollege respondents and white college graduates illustrates this point. On the top six opportunity statements, all of which elicited majority support from both working-class whites and white college graduates, the latter showed substantially higher support—65 percent to 71 percent versus 57 percent to 64 percent—on five of the six opportunity items. However, on the statement about a bigger, more

17 Center for American Progress | Building an All-In Nation
diverse workforce leading to more economic growth, agreement among white working-class and white college-graduate respondents was essentially identi-cal—64 percent versus 65 percent.
The same patterns apply within other races. College-educated African Americans, Latinos, and Asians tend to agree with opportunity statements at substantially higher levels than their noncollege-educated counterparts. And if you introduce age into the equation, college-educated people of color from the Millennial gen-eration are higher still, with views on some opportunity statements approaching unanimity. Ninety-four percent of African American college-educated Millennials, for example, agree with the statement on promoting economic growth, and 97 percent of Asian college-educated Millennials agree with the statement on pro-moting innovation and competitiveness.
Finally, it is worth noting that even Republicans and conservatives express majority agreement with the first four opportunity statements. But the range of agreement—51 percent to 57 percent—is far below that of not only Democrats, independents, liberals, and moderates but also all the demographic groups dis-cussed above, even the white working class.
Concerns about rising diversity
Table 3 provides a detailed look at our eight items on concerns about rising diver-sity. In contrast to the opportunity items discussed in the previous section, where six of eight items elicited majority agreement, only two of eight concern items generated majority agreement. These were the items about too many demands on government services—with 62 percent agreement—and too few jobs, with 54 percent agreement. The other six concerns about rising diversity—crime going up, the education system getting worse, increasing racial conflict, increasing discrimination against whites, rising inequality, and having no common American culture—all received less than majority agreement.

18 Center for American Progress | Building an All-In Nation
While there was some racial variation across the concern items, by and large, there was far less of it than on the opportunity items. Whites, for example, who were consistently lower than all groups of color on opportunity items, were not, as one might have expected, consistently higher than those groups on concern items. On the statement concerning too many demands on government services, whites’ level of agreement matched that of Latino respondents—64 percent; on the statement about not enough jobs, whites’ agreement was one point less than that of African Americans—55 percent and 56 percent, respectively; on the statement about increasing crime, whites’ agreement was lower than both African Americans’ and Latinos’ agreement; and so on. The one exception to this pattern was the statement about increasing discrimination against whites, where whites were easily the most concerned about this potential problem—especially com-pared to African Americans and Asians.
Indeed, though the differences were typically rather slight, Latinos, not whites, were the race-ethnic group that registered the highest average levels of agreement. On six of the eight concern items, Latinos were ahead or tied for the lead on their levels of agreement. At the other end of the spectrum, Asians were the racial group that seemed the least sensitive to concerns about rising diversity. On every con-cern item but one, Asians registered lower levels of agreement than every other race-ethnic group.
TABLE 3
Concerns about rising diversity WNC= white noncollege; WC = white college
Total agree White
African American Latino Asian 18–34 65+ WNC WC
1. There will be too many demands on government services.
62 64 52 64 53 60 64 67 59
2. There will not be enough jobs for everybody. 54 55 56 49 47 50 59 59 46
3. Crime and problems in our neighborhoods will go up.
47 47 49 49 38 37 58 55 32
4. Our education system will get worse 44 46 39 48 29 37 54 49 41
5. There will be more conflict between ethnic and racial groups
44 44 46 48 42 39 50 48 36
6. Discrimination against whites will increase 42 46 28 40 25 39 56 52 35
7. There will be more inequality. 38 36 42 44 34 33 42 39 31
8. There will be no common American culture. 36 36 35 44 31 29 44 40 29
19 Center for American Progress | Building an All-In Nation
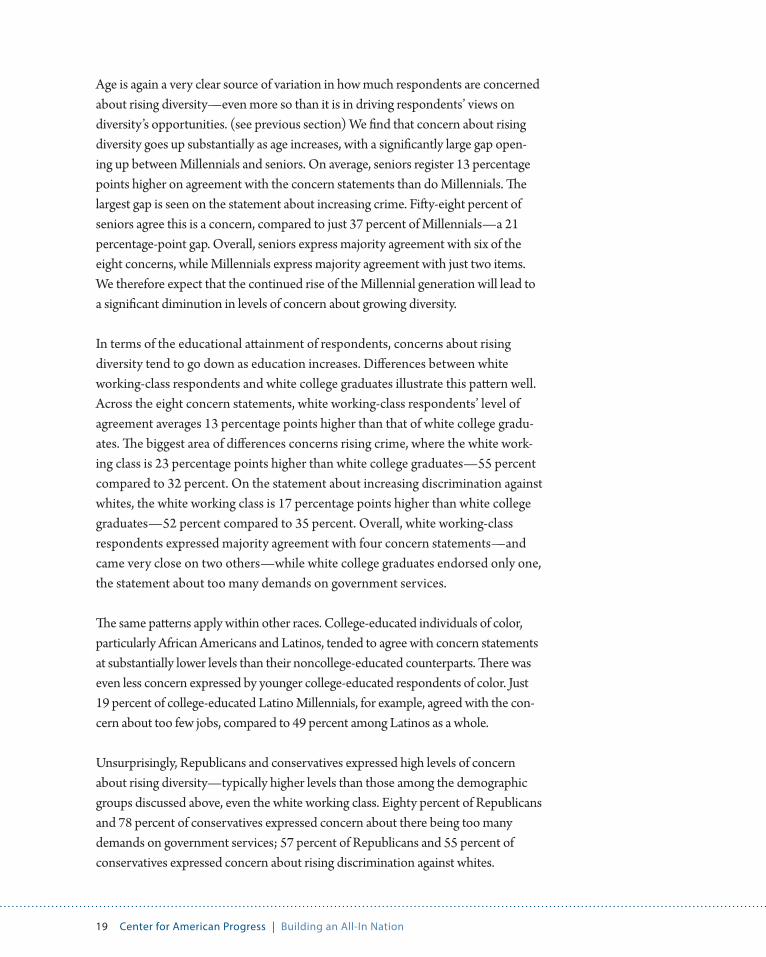
Age is again a very clear source of variation in how much respondents are concerned about rising diversity—even more so than it is in driving respondents’ views on diversity’s opportunities. (see previous section) We find that concern about rising diversity goes up substantially as age increases, with a significantly large gap open-ing up between Millennials and seniors. On average, seniors register 13 percentage points higher on agreement with the concern statements than do Millennials. The largest gap is seen on the statement about increasing crime. Fifty-eight percent of seniors agree this is a concern, compared to just 37 percent of Millennials—a 21 percentage-point gap. Overall, seniors express majority agreement with six of the eight concerns, while Millennials express majority agreement with just two items. We therefore expect that the continued rise of the Millennial generation will lead to a significant diminution in levels of concern about growing diversity.
In terms of the educational attainment of respondents, concerns about rising diversity tend to go down as education increases. Differences between white working-class respondents and white college graduates illustrate this pattern well. Across the eight concern statements, white working-class respondents’ level of agreement averages 13 percentage points higher than that of white college gradu-ates. The biggest area of differences concerns rising crime, where the white work-ing class is 23 percentage points higher than white college graduates—55 percent compared to 32 percent. On the statement about increasing discrimination against whites, the white working class is 17 percentage points higher than white college graduates—52 percent compared to 35 percent. Overall, white working-class respondents expressed majority agreement with four concern statements—and came very close on two others—while white college graduates endorsed only one, the statement about too many demands on government services.
The same patterns apply within other races. College-educated individuals of color, particularly African Americans and Latinos, tended to agree with concern statements at substantially lower levels than their noncollege-educated counterparts. There was even less concern expressed by younger college-educated respondents of color. Just 19 percent of college-educated Latino Millennials, for example, agreed with the con-cern about too few jobs, compared to 49 percent among Latinos as a whole.
Unsurprisingly, Republicans and conservatives expressed high levels of concern about rising diversity—typically higher levels than those among the demographic groups discussed above, even the white working class. Eighty percent of Republicans and 78 percent of conservatives expressed concern about there being too many demands on government services; 57 percent of Republicans and 55 percent of conservatives expressed concern about rising discrimination against whites.
20 Center for American Progress | Building an All-In Nation
Section 2: Public attitudes toward a new equity agenda
This study aimed to assess Americans’ support for or opposition to what we refer to as a “new equity agenda,” which, if fully implemented, would help reduce racial and ethnic inequalities in society and create a stronger economy through better education, job opportunities, and public investments in the foundations of future prosperity. The equity agenda is more fully fleshed out in the recently published book All-In Nation: An America that Works for All and was presented in the survey as a broad proposal for future action.
Support for new steps and investments to reduce racial and ethnic inequality
Along with the general openness to rising diversity expressed by most Americans, we find strong support for new steps to reduce racial and ethnic inequality through investments in education, job training, and infrastructure improvement. As Figure 3 highlights, a full 71 percent of Americans support such an equity agenda, with nearly half—47 percent—of Americans strongly supporting these efforts. Almost 9 in 10 African Americans—87 percent expressing total support and 77 percent expressing strong support—and Latinos—89 percent expressing total support and 66 percent expressing strong support—back these investment ideas, along with more than 8 in 10 Asians—83 percent expressing total sup-port and 54 percent expressing strong support—and 6 in 10 whites—63 percent expressing total support and 38 percent expressing strong support.

21 Center for American Progress | Building an All-In Nation
Interestingly, there are no major age, education, or gender differences among whites in terms of support for a new equity agenda. Millennials, women, and college-educated whites show stronger levels of support than others but not by significant margins. Sixty-eight percent of white college graduates, 68 percent of whites ages 18 to 34, and 68 percent of white women, for example, say that they would support invest-ments to reduce racial and ethnic inequality. But 61 percent of noncollege whites, 58 percent of whites ages 65 or older, and 59 percent of white men would also support these efforts. The divisions among whites appear to be entirely ideological and partisan. White con-servatives are the only subgroup that reported majority opposition to new steps to reduce racial and ethnic inequality—with 51 per-cent totally opposed and 31 percent strongly opposed—along with a plurality of white Republicans—50 percent totally opposed and 30 percent strongly opposed. The ideological nature of these divisions becomes more appar-ent when examining a follow-up question that asked people whether they thought new steps to reduce racial and ethnic inequality would help or hurt the economy overall or make no difference. Although 54 percent of Americans overall said a new equity agenda would help the economy—including 72 percent of African Americans, 63 percent of Latinos, 68 percent of Asians, and 49 percent of whites—majorities of white conservatives, at 51 percent, and white Republicans, at 52 percent, said these efforts would make no difference.
“Based on what you know, would you support or oppose new steps to reduce racial and ethnic inequality in America through investments in areas like education, job training, and infrastructure improvement?”
Support by group
Support by White subgroup
FIGURE 3
Support/opposition for new equity agenda
Total population
Latinos
African Americans
Asians
Whites
White liberals
71% total support 27% total oppose
47% strongly support 16% strongly oppose
White conservatives
White noncollege
White college
White 18-34
White 65+
Strongly supportTotal support
Strongly supportTotal support
66% 89%
68% 87%
19% 46%
35% 61%
30% 58%
43% 68%
43% 68%
54% 83%
38% 63%
77% 87%

22 Center for American Progress | Building an All-In Nation
Beliefs about individual and collective action
Basic beliefs about collective action and the role of the government in the economy seem to explain much of the policy division between whites and other groups. In a more abstract test of political ideology, respondents were asked to choose between two competing ideas about America today. One idea put forth a more individualistic narrative of advancement: “Average Americans are on their own. Jobs and benefits are less secure and you can’t really count on anyone but yourself and your family to get ahead.” The second narrative offered a more collec-tive vision of economic mobility: “In today’s economy, we all face common chal-lenges. Jobs and benefits are less secure, so we all need to work together to make it easier for average Americans to get ahead.”
Americans are essentially split on these core concepts, with 49 percent agreeing with the notion that our challenges are common and that we all need to work together and 47 percent believing that Americans are on their own and cannot count on others for help. But as Figure 4 highlights, racial and ethnic splits are sharp on this basic framing of American life, with majorities of African Americans, Latinos, and Asians agreeing that we should work together on common economic challenges—69 percent, 54 percent, and 52 percent, respectively. A majority of whites—52 percent—believe that Americans are on their own. Ideological and partisan divisions are prominent among whites: 58 percent of white liberals and 62 percent of white Democrats say we should work together. In contrast, 59 per-cent of both white conservatives and white Republicans believe the opposite.
TABLE 4
Would a new equity agenda help or hurt the economy?
“Based on what you know, do you think new steps to reduce racial and ethnic inequality in America would help the economy overall, hurt the economy overall or not make much of a difference to the economy overall?”
Total African
American Latino Asian WhiteWhite liberal
White conservative
White Democrat
White Republican
Help 54 72 63 68 49 73 33 75 31
Hurt 10 6 8 8 11 5 14 5 14
No difference 33 21 27 20 38 21 51 18 52

23 Center for American Progress | Building an All-In Nation
Generational and gender distinctions also emerge among whites on this question. Younger whites are more likely to believe that Americans are “on their own,” while older whites are more evenly split and open to the idea that we must “work together.” Similarly, majorities of college-educated and noncollege-educated men—56 percent and 59 percent, respectively—agree that people are on their own, while both college-educated and noncollege-educated women agree with the idea that we must work together to help people get ahead—53 percent and 50 percent, respectively. Across all white subgroups, married white men display the highest level of individualism, with 62 percent saying Americans are on their own.
The trends among African Americans and Latinos are even more interesting, with higher- educated people of color expressing sharply dif-ferent views about collective versus individual action than their less-educated cohorts. More than three-quarters—77 percent—of African Americans ages 18 to 29 without a college education believe that we must work together on common challenges. In contrast, more than 6 in 10, or 63 percent of college-educated African Americans in the same age range say that Americans are on their own and you can’t count on others to get ahead. Younger Latinos show similar yet less-pronounced differences in their worldview, with 59 percent of noncollege-educated young Latinos believing that we must work together and 50 percent of college-educated Latinos agreeing that people are on their own. Age and education appears to have the opposite influence among Asians, however. Younger noncollege Asians—55 percent—are more likely to believe that people are on their
47% 49%
29% 69%
44% 54%
43% 52%
52% 44%
41% 58%
59% 36%
57% 38%
49% 49%
58% 38%
45% 51%
FIGURE 4
Individual vs. Collective Action
Total population
Latinos
African Americans
Asians
Whites
White liberals
“On their own” “Work together”
White conservatives
White 18-34
White 65+
White men
White women
“Do you agree more with first statement or the second statement?
(First) Average Americans are on their own. Jobs and benefits are less secure and you can’t really count on anyone but yourself and your family to get ahead.
(Second) In today’s economy, we all face common challenges. Jobs and benefits are less secure, so we all need to work together to make it easier for average Americans to get ahead.”

24 Center for American Progress | Building an All-In Nation
own—55 percent—while their college-educated peers are more likely to believe the opposite, that we must work together, coming in at 72 percent.
Support for an equity agenda also depends upon fundamental views about the relationship between racial and ethnic inequalities and economic growth and perceptions about whether steps to reduce these inequalities would help overall economic growth. As Table 5 highlights, majorities of African Americans, Latinos, and Asians agree that inequalities are holding back growth and that government policies and investments to reduce these problems would help our economy grow faster. Whites, and white conservatives in particular, are skeptical about both claims. Notably, examining a split-sample language test, a majority of whites—52 percent—agree with the notion that high levels of “income and wealth inequality” but not high levels of “racial and ethnic inequality” are holding back economic growth. Racial and ethnic inequality received only 43 percent agreement among whites. This suggests that a broader class framing of the issues might help reach whites more effectively.
TABLE 5
Relationship between inequality and growth
Which statement do you agree with most? Statement pair one: (First) “High levels of racial and ethnic inequality are holding back economic growth in this country”. (Sec-ond) “High levels of racial and ethnic inequality are a natural outcome of the economy and don’t hold back overall growth.”
Statement pair two: (First) “Government policies and investments that reduce racial and ethnic inequality would help us grow faster.” (Second) “Government policies and investments to reduce ethnic and racial inequality would not work and would just interfere with economic growth.”
Percent who agree Total African
American Latino Asian WhiteWhite liberal
White conservative
Inequality holding back growth 47 65 55 52 43 53 35
Inequality natural outcome of economy
42 29 37 41 46 40 52
Reducing inequality would help us grow faster
50 61 59 67 46 69 30
Reducing inequality would interfere with growth
43 34 33 25 47 25 63

25 Center for American Progress | Building an All-In Nation
How individual and collective attitudes shape policy choices
Views on individualism and collectivism are very closely correlated with the larger policy issues America will confront in the years ahead. Among whites who most strongly subscribe to the economic-individualism approach, for example, 67 percent oppose any government intervention in the economy to promote equity. Among whites who most strongly subscribe to the economic-collectivism approach, a clear majority support government efforts to reduce income inequal-ity. (see Table 6) Among people of color, these same patterns exist. However, there is more of a tendency to support government efforts that promote income and wealth equity, regardless of larger economic views.
TABLE 6
How individual and collective beliefs shape policy views among whites
Percent who agreeOn their own
(strongly)On their own (somewhat)
Work together (somewhat)
Work together (strongly) Gap
Government policies and invest-ments that reduce income and wealth inequality would help us grow faster
28 36 49 53 (+25)
Government policies and investments to reduce income and wealth inequality would not work and would just inter-fere with economic growth
67 59 38 39 (-28)
Beyond the direct connection to economic policy, the study also finds strong cor-relations among whites between ideological beliefs about individual and collective action and basic beliefs about diversity across a range of areas not related to the economy. As Tables 7 and 8 highlight, on a number of indicators—from rising diversity to immigration—we find a consistent gap of about 20 percentage points between whites who take a strong individualist view of the economy and those who take a strong collectivist view.

26 Center for American Progress | Building an All-In Nation
TABLE 7
How individual and collective beliefs shape openness to diversity among whites
“As you may know, census projections show that by 2043, African American, Latinos, Asians, and other mixed racial groups will together be a majority of the population. Thinking about the likely impact of this coming demographic change, please tell me if you agree or disagree with each statement.”
Percent who agreeOn their own
(strongly)On their own (somewhat)
Work together (somewhat)
Work together (strongly) Gap
Our country’s ideals of opportunity for everyone will be realized
38 45 52 59 (+21)
The country’s global image will improve 38 45 51 58 (+20)
Americans will be enriched by exposure to many different cultures
59 69 74 78 (+19)
Diverse workplace and schools will make American businesses more inno-vative and competitive
61 69 73 77 (+16)
Crime and problems in our neighbor-hoods will go up
56 46 41 39 (-17)
Discrimination against whites will increase
55 43 37 32 (-23)
TABLE 8
How individual and collective beliefs shape views about immigration and inequality among whites
Percent who agreeOn their own
(strongly)On their own (somewhat)
Work together (somewhat)
Work together (strongly) Gap
Immigration
Pathway to citizenship for undocu-mented immigrants could add more than $100 billion to tax revenues – convincing
42 47 50 67 (+25)
Should help integrate undocumented immigrants into our community and eventual pathway to citizenship
48 52 69 66 (+18)
Problems from inequality
Willing to invest public funds to help close black/Latino college gap
48 55 70 76 (+28)
Income gap between whites and minorities is a serious problem
56 56 75 79 (+23)
African American/Latino gap in college education is a serious problem
49 59 64 63 (+14)

27 Center for American Progress | Building an All-In Nation
Reasons to address racial and ethnic inequality in America and likely outcomes of doing so
The study probed deeper into the reasons why Americans might be willing to support a new equity agenda by presenting a series of factual statements about the state of society today and economic projections about the likely outcomes from reducing inequality. As Table 9 highlights, issues surrounding educational dispari-ties and poverty—both broadly and more specifically for African Americans and Latinos—generate the highest levels of concern among a cross-section of the public. More than 8 in 10 Americans across racial and ethnic lines believe that the following three disparities are very serious or serious problems:
• Forty-eight percent of black 8th graders and 43 percent of Latino 8th grad-
ers score below basic on math and reading tests, compared to 17 percent of
whites. Eighty-eight percent of total respondents believe this is a serious prob-lem, and 45 percent of total respondents believe it is a very serious problem.
• One-quarter of all jobs in the United States pay below poverty-level wages. Eighty-six percent of total respondents believe this is a serious problem, and 48 percent of total respondents believe it is a very serious problem.
• One in four children under age 5 live in poverty, including around two in five black
and Latino children. Eighty-five percent of total respondents believe this is a serious problem, and 40 percent of total respondents believe it is a very serious problem.
African Americans and Latinos report higher levels of concern, and generally more intense concerns, than whites and Asians about a variety of problems arising from inequality. Interestingly, given contemporary political discussions, issues of wealth disparities and divergent economic mobility rank lower on the list of prob-lems, primarily because of their lower saliency among whites and Asians. Only 49 percent of whites, for example, believe it is a serious problem that whites “on average have 20 times the net worth of African Americans and 18 times that of Latinos.” In contrast, 81 percent of African Americans and 71 percent of Latinos view the wealth gap as a serious problem. Likewise, only 44 percent of whites and a bare majority of Asians—51 percent—believe that it is a serious problem that “[a] child born into a wealthy family in the U.S. is more than twice as likely as a child born into a poor family to end up in the middle class or above as an adult.” Seventy percent of African Americans and two-thirds of Latinos believe that these differences in social mobility are serious problems.

28 Center for American Progress | Building an All-In Nation
TABLE 9
Problems associated with inequality
“Now I am going to read you a list of facts about inequality in our country today. For each one, I want you to tell me whether you personally think this fact represents a very serious problem, a serious problem, not too serious a problem, or not a problem at all for our country.”
Percent saying very serious or serious problem
Total population
African American
Latino Asian White
Forty-eight percent of black 8th graders and 43 percent of Latino 8th graders score below basic math and reading tests, compared to 17 percent of whites
88 96 91 86 88
One quarter of all jobs in U.S. pay below poverty-level wages
86 91 91 80 84
One in four children under age 5 live in poverty, including around two in five black and Latino children
85 94 89 76 84
Since 1979, income gains for the top 1 percent have been 277 percent, while gains for the middle class have been 38 percent and those for the poor 18 percent
77 87 85 73 75
Predatory loans are five times more likely in black neighborhoods than in white ones
77 88 85 71 76
Sixteen percent of white children born to middle-class parents end up poor, compared to 45 percent of black chil-dren born to middle-class parents
77 77 76 63 78
The average income of white families is $70,000, compared to $40,000 for blacks and Latinos
67 89 81 57 62
Forty percent of whites complete col-lege by age 30, compared to 23 percent of blacks and 15 percent of Latinos
66 66 80 64 59
Whites on average have 20 times the net worth of African Americans and 18 times that of Latinos
55 81 71 60 49
A child born into a wealthy family is more than twice as likely as a child born into a poor family to end up middle class or above as an adult
50 70 66 51 44

29 Center for American Progress | Building an All-In Nation
In general, we found that explicit racial and ethnic framing of inequality led to some drop-off in the belief among whites and Asians that a particular issue is a serious problem for the nation. A poverty item that made no mention of racial and ethnic differences—“A quarter of all jobs in the United States now pay below poverty wages”—scored highest among whites and Asians, with 45 percent and 40 percent, respectively, saying that it was a “very serious problem.” The one issue where this does not seem to be as pronounced is education. All racial and ethnic groups expressed serious concern about the lower math and reading scores for African American and Latino 8th graders. But even on the issue of education, we found whites and Asians more open to a broader framing about the importance of education to society as a whole than they were when we cast the issue in more direct racial terms. Table 10 highlights responses to a series of questions about education, starting with the following: “Every year, more jobs in America require a college degree. By 2018, 63 percent of jobs will require a college degree or post-secondary certification. Yet current education projections say we will produce about 3 million fewer graduates than necessary to fill these jobs. Overall, how big of a problem is it for the country that we are not producing enough college graduates to fill the jobs of the future?” Forty-three percent of Americans said this is a “very serious problem,” including 47 percent of African Americans, 52 percent of Latinos, 44 percent of Asians, and 40 percent of whites.
The intensity of concerns about educational preparation drops noticeably, how-ever, in a follow-up question that provides information about one of the reasons America is not producing enough college graduates to fill the jobs of the future: “African American and Latino college graduation rates are only a half to a third of the rates of whites.” Knowing this, the percentage of Americans saying the gap between minority and white graduation rates is a “very serious problem” drops to 30 percent overall, including only one-quarter of whites and less than one-third of Asians who view the minority education gap as a very serious problem.
TABLE 10
Effects of broader framing of education versus racial/ethnic framing
Percent saying very serious problem
Total population
African American
Latino Asian White
Lack of college graduates necessary to fill jobs of the future…
Without racial and ethnic framing 43 47 52 44 40
With explanation of minority vs. white graduation gap
30 47 44 32 25

30 Center for American Progress | Building an All-In Nation
The study also tested Americans’ reactions to a range of concrete research pro-jections about the potential economic outcomes of reducing racial and ethnic inequality, as featured in CAP and PolicyLink’s book, All-In Nation. The goal of the test was to see how convincing each projection might be as a reason to support spending an estimated $120 billion per year to reduce racial and ethnic inequalities. There was not a huge amount of variance in responses to the items, but projections that, “The estimated 42 percent of the workforce who will be black or Latino by 2050 will be better prepared for the jobs of the future”—as well as projections that, “13 million people will be lifted out of poverty”—were deemed convincing reasons to support new efforts to reduce inequality by more than 6 in 10 Americans. (see Table 11) Arguments about greater equality increasing indi-vidual income or reducing the long-term Social Security deficit proved to be less-convincing reasons to support these efforts, particularly among whites and Asians.
TABLE 11
Reasons to support investments to eliminate racial and ethnic inequality
“Recent academic research has examined the potential economic effects of eliminating racial and ethnic inequality in America. The estimated cost for new investments to eliminate racial and ethnic inequality is $120 billion per year. I’m going to read you some of these potential outcomes and, after each one, please tell me whether this outcome would be a very convincing, somewhat convincing, a little convincing, or not at all convincing reason for you to support new investments to eliminate racial and ethnic inequality.”
Percent saying very or somewhat convincing
Total population
African American
Latino Asian White
The estimated 42 percent of the workforce who will be black or Latino by 2050 will be better prepared for the jobs of the future.
69 84 81 64 65
13 million people will be lifted out of poverty.
65 74 72 63 63
Federal, state, and local tax revenues will increase by $192 billion.
63 70 66 61 61
The size of the economy, or gross domestic product, will be $1.2 trillion higher.
62 74 64 60 61
The long-run deficit faced by Social Security will be reduced by 10 percent.
57 67 63 59 54
Average yearly income for all Americans will be 8 percent—or $3,000—higher.
54 70 58 54 51

31 Center for American Progress | Building an All-In Nation
Conclusion
Contrary to popular beliefs about public attitudes toward rising diversity, this study finds clear and compelling evidence across a range of questions that Americans are open minded about our society’s changing demographics and believe, on the whole, that there are more benefits to the nation from rising diver-sity than costs. Americans understand that more needs to be done to help fully integrate all people into our national economy through expanded educational and job opportunities. Moreover, they are willing to make significant new invest-ments to help reduce racial and ethnic inequalities and close the gaps between the rich and the poor. Although attitudinal differences remain between some whites and communities of color about the relative benefits of diversity and willingness to do more to reduce inequality, these splits are more ideologically focused than racial or ethnic.
Policymakers should take these attitudes into account as they debate the nation’s future. Americans are ready to support necessary and pragmatic policy invest-ments to ensure that all people can participate fully in our economy.
32 Center for American Progress | Building an All-In Nation
Author bios
Ruy Teixeira is a Senior Fellow at both The Century Foundation and the Center for American Progress, where he co-directs the Progressive Studies Program. He is also a visiting scholar at the Brookings Institution. His books include America’s Forgotten Majority: Why the White Working Class Still Matters; The Emerging Democratic Majority; Red, Blue, & Purple America: The Future of Election Demographics; and America’s New Swing Region: Changing Politics and Demographics in the Mountain West.
John Halpin is a Senior Fellow at the Center for American Progress, focusing on political theory, communications, and public opinion analysis. He is the co-direc-tor and creator of the Progressive Studies Program at the Center, an interdisciplin-ary project researching the intellectual history, foundational principles, and public understanding of progressivism. Halpin is the co-author, with CAP Chair John Podesta, of The Power of Progress: How America’s Progressives Can (Once Again) Save Our Economy, Our Climate, and Our Country, a 2008 book about the history and future of the progressive movement.
Dr. Matt A. Barreto is an Associate Professor in political science at the University of Washington, Seattle and the director of the Washington Institute for the Study of Ethnicity and Race. Barreto is a founding principal of Latino Decisions. He received his Ph.D. in political science from the University of California, Irvine in 2005.
Dr. Adrian D. Pantoja is a Senior Analyst at Latino Decisions. He also is also Professor in Political Studies at Pitzer College, a member of the Claremont Colleges in southern California. Prior to his appointment at Pitzer, Pantoja was on the faculty at Arizona State University and the University of Connecticut. He holds a Ph.D. in political science from the Claremont Graduate University.
Acknowledgements
The authors would like to thank the Rockefeller Foundation for its generous sup-port of this research project, as well as Vanessa Cárdenas, Daniella Gibbs Léger, Carl Chancellor, Meghan Miller, Lauren Vicary, and Pete Morelewicz for their expert assistance in developing and producing the final report.
33 Center for American Progress | Building an All-In Nation
Endnotes
1 William H. Frey, “Census Projects New ‘Majority-Minori-ty’ Tipping Points,” Brookings Institution, December 13, 2012, available at http://www.brookings.edu/research/opinions/2012/12/13-census-race-projections-frey.
2 All data in this paragraph are from authors’ analysis of the U.S. Census Bureau’s 2012 Population Projections. See U.S. Census Bureau, “2012 National Population Pro-jections: Summary Tables,” available at http://www.cen-sus.gov/population/projections/data/national/2012/summarytables.html (last accessed October 2013).
3 Hope Yen, “White Majority in U.S. Gone by 2043,” U.S. News blog, June 13, 2013, available at http://usnews.nbcnews.com/_news/2013/06/13/18934111-census-white-majority-in-us-gone-by-2043?lite.
4 Anthony Carnevale and Nicole Smith, “America’s Future Workforce.” In Vanessa Cárdenas and Sarah Truehaft, eds., All-In-Nation: An America that Works for All (Wash-ington and Oakland, California: Center for American Progress and PolicyLink, 2013), available at http://allinnation.org/book/.
5 Ibid.
6 U.S. Census Bureau, “2012 National Population Projec-tions: Summary Tables,” table 3.
34 Center for American Progress | Building an All-In Nation
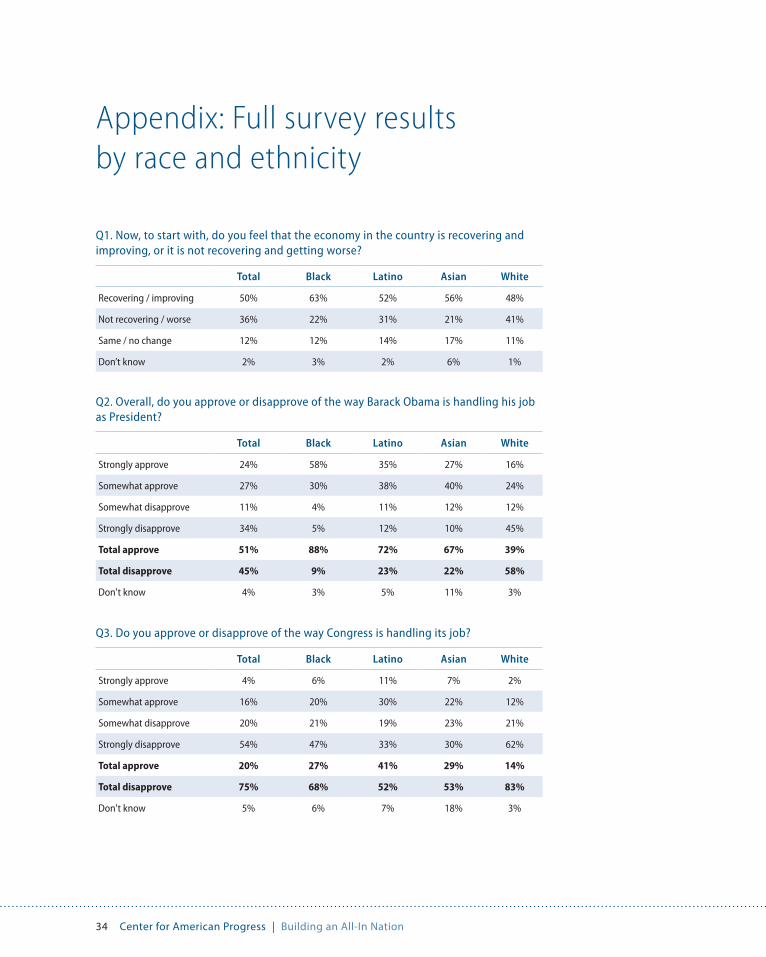
Appendix: Full survey results by race and ethnicity
Q1. Now, to start with, do you feel that the economy in the country is recovering and improving, or it is not recovering and getting worse?
Total Black Latino Asian White
Recovering / improving 50% 63% 52% 56% 48%
Not recovering / worse 36% 22% 31% 21% 41%
Same / no change 12% 12% 14% 17% 11%
Don’t know 2% 3% 2% 6% 1%
Q2. Overall, do you approve or disapprove of the way Barack Obama is handling his job as President?
Total Black Latino Asian White
Strongly approve 24% 58% 35% 27% 16%
Somewhat approve 27% 30% 38% 40% 24%
Somewhat disapprove 11% 4% 11% 12% 12%
Strongly disapprove 34% 5% 12% 10% 45%
Total approve 51% 88% 72% 67% 39%
Total disapprove 45% 9% 23% 22% 58%
Don't know 4% 3% 5% 11% 3%
Q3. Do you approve or disapprove of the way Congress is handling its job?
Total Black Latino Asian White
Strongly approve 4% 6% 11% 7% 2%
Somewhat approve 16% 20% 30% 22% 12%
Somewhat disapprove 20% 21% 19% 23% 21%
Strongly disapprove 54% 47% 33% 30% 62%
Total approve 20% 27% 41% 29% 14%
Total disapprove 75% 68% 52% 53% 83%
Don't know 5% 6% 7% 18% 3%
35 Center for American Progress | Building an All-In Nation
Q4. Thinking about this demographic change, what percent of the overall American population today is composed of racial and ethnic minorities? Just give me your best guess.
Total Black Latino Asian White
0-10% 2% 3% 5% 4% 1%
11-20% 3% 5% 4% 7% 3%
21-30% 10% 10% 8% 14% 10%
31-40% 20% 17% 13% 23% 23%
41-50% 24% 17% 26% 20% 25%
More than 50% 32% 43% 32% 22% 31%
Don't know 9% 6% 13% 11% 8%
Mean 48.96 52.66 50.34 43.16 48.47
Q5. How about the American workforce? What percent of the American workforce today is composed of racial and ethnic minorities?
Total Black Latino Asian White
0-10% 3% 5% 6% 4% 2%
11-20% 6% 6% 4% 9% 6%
21-30% 16% 12% 9% 16% 18%
31-40% 20% 16% 15% 18% 22%
41-50% 24% 26% 23% 18% 24%
More than 50% 24% 30% 33% 25% 22%
Don't know 8% 4% 10% 11% 7%
Mean 45.55 47.62 49.99 44.08 44.33
Q6. Thinking ahead to the year 2050, what percent of the overall American population in that year do you think will be composed of racial and ethnic minorities? Again, just give me your best guess.
Total Black Latino Asian White
0-10% 1% 3% 3% 2% 1%
11-20% 2% 2% 4% 3% 1%
21-30% 3% 4% 4% 5% 3%
31-40% 5% 8% 6% 6% 5%
41-50% 19% 21% 16% 21% 19%
More than 50% 64% 58% 60% 54% 66%
Don't know 6% 5% 6% 8% 6%
Mean 62.05 61.66 61.13 56.96 62.6

36 Center for American Progress | Building an All-In Nation
Q7. How about the American workforce? What percent of the American workforce in the year 2050 will be composed of racial and ethnic minorities?
Total Black Latino Asian White
0-10% 2% 2% 4% 1% 2%
11-20% 2% 4% 4% 4% 2%
21-30% 5% 6% 7% 4% 4%
31-40% 7% 9% 6% 9% 7%
41-50% 24% 23% 22% 19% 25%
More than 50% 53% 51% 51% 51% 54%
Don't know 6% 4% 6% 12% 6%
Mean 58.92 58.69 57.72 57.3 59.27
Q8. Another big demographic change is the aging of the Baby Boom generation. The first Baby Boomers turned 65 in 2011 when the percentage of the elderly in the population was around 13 percent. What percent of the U.S. population will be elderly by the year 2050? Again, just your best guess.
Total Black Latino Asian White
0-10% 7% 8% 10% 6% 6%
11-20% 19% 15% 19% 30% 18%
21-30% 24% 19% 19% 30% 25%
31-40% 16% 13% 13% 10% 18%
41-50% 13% 18% 13% 10% 12%
More than 50% 15% 24% 18% 8% 13%
Don't know 7% 4% 8% 7% 7%
Mean 35.67 41.57 37.24 29.93 34.78
Q9. Which of these two statements do you agree with most? A. In today’s economy, average Americans are on their own. Jobs and benefits are less secure and you can’t really count on anyone but yourself and your family to get ahead.
B. In today’s economy, we all face common challenges. Jobs and benefits are less secure, so we all need to work together to make it easier for average Americans to get ahead.
Total Black Latino Asian White
On their own - Strongly 31% 20% 31% 26% 34%
On their own - Somewhat 16% 9% 13% 17% 18%
Work together - Strongly 32% 54% 37% 31% 28%
Work together - Somewhat 17% 15% 17% 21% 17%
Total on their own 47% 29% 44% 43% 52%
Total work together 49% 69% 54% 52% 44%
Both of these 2% 1% 1% 4% 2%
Neither of these 1% 1% 1% 1% 1%
Don't know 0% 1% - 0% 0%

37 Center for American Progress | Building an All-In Nation
Q10. Which of these two statements do you agree with most? A. High levels of income and wealth inequality are holding back economic growth in this country.
B. High levels of income and wealth inequality are a natural outcome of the economy and don’t hold back overall growth.
Total Black Latino Asian White
Holding back economic growth - Strongly
36% 45% 33% 28% 36%
Holding back economic growth - Somewhat
19% 19% 26% 24% 17%
Natural outcome - Strongly 23% 15% 18% 17% 27%
Natural outcome - Some-what
16% 15% 18% 19% 15%
Total holding back 55% 64% 59% 52% 52%
Total natural outcome 39% 30% 36% 36% 42%
Both of these 1% 1% 2% 4% 1%
Neither of these 2% 0% 1% 3% 3%
Don't know 3% 5% 2% 5% 2%
Q11. Which of these two statements do you agree with most? A. High levels of racial and ethnic inequality are holding back economic growth in this country.
B. High levels of racial and ethnic inequality are a natural outcome of the economy and don’t hold back overall growth.
Total Black Latino Asian White
Holding back economic growth - Strongly
26% 44% 32% 29% 22%
Holding back economic growth - Somewhat
21% 21% 23% 23% 20%
Natural outcome - Strongly 22% 18% 20% 19% 24%
Natural outcome - Some-what
20% 12% 18% 22% 22%
Total holding back 47% 65% 55% 52% 43%
Total natural outcome 42% 29% 37% 41% 46%
Both of these 2% 3% 1% 2% 1%
Neither of these 6% 1% 2% 2% 8%
Don't know 2% 2% 5% 3% 2%
Q10 and Q11: split sample

38 Center for American Progress | Building an All-In Nation
Q12. Which of these two statements do you agree with most? A. Government policies and investments that reduce income and wealth inequality would help us grow faster.
B. Government policies and investments to reduce income and wealth inequality would not work and would just interfere with economic growth.
Total Black Latino Asian White
Grow faster - Strongly 23% 33% 26% 27% 21%
Grow faster - Somewhat 22% 29% 27% 34% 18%
Not work/interfere - Strongly
30% 14% 22% 16% 36%
Not work/interfere - Somewhat
17% 17% 19% 17% 17%
Total grow faster 45% 62% 53% 61% 39%
Total not work/interfere 47% 32% 41% 33% 53%
Both of these 1% 1% 2% 1% 0%
Neither of these 4% 3% 2% 1% 5%
Don't know 3% 3% 2% 4% 4%
Q13. Which of these two statements do you agree with most? A. Government policies and investments that reduce racial and ethnic inequality would help us grow faster.
B. Government policies and investments to reduce ethnic and racial inequality would not work and would just interfere with economic growth.
Total Black Latino Asian White
Grow faster - Strongly 30% 40% 36% 34% 27%
Grow faster - Somewhat 20% 21% 23% 32% 19%
Not work/interfere - Strongly
24% 20% 19% 16% 27%
Not work/interfere - Some-what
18% 14% 15% 9% 20%
Total grow faster 50% 61% 59% 67% 46%
Total not work/interfere 43% 34% 33% 25% 47%
Both of these 1% 1% 1% 1% 1%
Neither of these 3% 2% 2% 4% 3%
Don't know 3% 2% 5% 3% 3%
Q12 and Q13: split sample

39 Center for American Progress | Building an All-In Nation
Q14. Please indicate how much you agree or disagree on a scale of 0-10:
A bigger, more diverse workforce will lead to more economic growth.
Strongly agree
(9-10) Total agree
(6-10) Neutral
(5)Total disagree
(0-4)Strongly
disagree (0-1) Don’t know/
refusedMean
Total 30% 69% 15% 16% 6% 1% 6.9
Black 46% 81% 10% 9% 3% 0% 7.9
Latino 40% 79% 14% 6% 3% 1% 7.6
Asian 33% 75% 12% 11% 4% 2% 7.1
White 25% 65% 16% 19% 7% 1% 6.5
Q15. Please indicate how much you agree or disagree on a scale of 0-10:
With more diverse people working and living together, discrimination will decrease.
Strongly agree
(9-10) Total agree
(6-10) Neutral
(5)Total disagree
(0-4)Strongly
disagree (0-1) Don’t know/
refusedMean
Total 24% 61% 17% 21% 7% 1% 6.4
Black 31% 59% 20% 21% 11% 0% 6.4
Latino 32% 66% 16% 18% 6% 0% 6.8
Asian 30% 70% 15% 13% 3% 1% 6.9
White 21% 59% 17% 23% 8% 1% 6.2
Q16. Please indicate how much you agree or disagree on a scale of 0-10:
The country’s global image will improve.
Strongly agree
(9-10) Total agree
(6-10) Neutral
(5)Total disagree
(0-4)Strongly
disagree (0-1) Don’t know/
refusedMean
Total 17% 47% 23% 28% 12% 1% 5.6
Black 25% 59% 25% 15% 9% 1% 6.5
Latino 24% 61% 22% 17% 7% 0% 6.4
Asian 27% 64% 16% 18% 4% 2% 6.6
White 13% 41% 24% 33% 13% 1% 5.2
Q14–29: questions rotated

40 Center for American Progress | Building an All-In Nation
Q18. Please indicate how much you agree or disagree on a scale of 0-10:
People will become more accepting of their differences and more willing to find common ground.
Strongly agree
(9-10) Total agree
(6-10) Neutral
(5)Total disagree
(0-4)Strongly
disagree (0-1) Don’t know/
refusedMean
Total 24% 65% 18% 16% 6% 0% 6.6
Black 30% 71% 17% 12% 6% 0% 6.9
Latino 25% 69% 17% 13% 4% 0% 6.8
Asian 30% 70% 19% 9% 3% 2% 7
White 21% 62% 19% 18% 6% 0% 6.4
Q19. Please indicate how much you agree or disagree on a scale of 0-10:
Our country’s ideals of opportunity for everyone will be realized.
Strongly agree
(9-10) Total agree
(6-10) Neutral
(5)Total disagree
(0-4)Strongly
disagree (0-1) Don’t know/
refusedMean
Total 17% 49% 21% 30% 11% 0% 5.6
Black 26% 58% 22% 19% 11% 1% 6.2
Latino 24% 62% 21% 17% 5% 0% 6.5
Asian 29% 61% 21% 18% 8% 1% 6.5
White 13% 43% 21% 36% 12% 0% 5.2
Q20. Please indicate how much you agree or disagree on a scale of 0-10:
Americans will learn more from one another and be enriched by exposure to many different cultures.
Strongly agree
(9-10) Total agree
(6-10) Neutral
(5)Total disagree
(0-4)Strongly
disagree (0-1) Don’t know/
refusedMean
Total 32% 70% 15% 15% 4% 0% 6.9
Black 49% 76% 13% 10% 5% 0% 7.7
Latino 38% 75% 14% 10% 4% 0% 7.4
Asian 46% 87% 5% 6% 2% 1% 7.9
White 26% 66% 16% 17% 5% 1% 6.6
Q17. Please indicate how much you agree or disagree on a scale of 0-10:
Diverse workplaces and schools will help make American businesses more innovative and competitive.
Strongly agree
(9-10) Total agree
(6-10) Neutral
(5)Total disagree
(0-4)Strongly
disagree (0-1) Don’t know/
refusedMean
Total 30% 69% 15% 15% 5% 1% 6.8
Black 43% 78% 14% 8% 2% 0% 7.7
Latino 33% 75% 15% 9% 3% 1% 7.3
Asian 40% 82% 7% 8% 4% 2% 7.6
White 25% 65% 16% 18% 7% 1% 6.5

41 Center for American Progress | Building an All-In Nation
Q22. Please indicate how much you agree or disagree on a scale of 0-10:
There will be more conflict between ethnic and racial groups.
Strongly agree
(9-10) Total agree
(6-10) Neutral
(5)Total disagree
(0-4)Strongly
disagree (0-1) Don’t know/
refusedMean
Total 16% 44% 21% 34% 10% 1% 5.4
Black 21% 46% 23% 31% 14% 0% 5.6
Latino 18% 48% 24% 28% 9% 1% 5.8
Asian 14% 42% 22% 34% 9% 2% 5.2
White 15% 44% 20% 36% 9% 1% 5.4
Q23. Please indicate how much you agree or disagree on a scale of 0-10:
There will be no common American culture.
Strongly agree
(9-10) Total agree
(6-10) Neutral
(5)Total disagree
(0-4)Strongly
disagree (0-1) Don’t know/
refusedMean
Total 17% 36% 23% 39% 18% 1% 4.9
Black 17% 35% 26% 38% 18% 1% 5
Latino 17% 44% 25% 29% 13% 2% 5.4
Asian 14% 31% 18% 49% 24% 2% 4.3
White 17% 36% 23% 40% 18% 1% 4.9
Q24. Please indicate how much you agree or disagree on a scale of 0-10:
Crime and problems in our neighborhoods will go up.
Strongly agree
(9-10) Total agree
(6-10) Neutral
(5)Total disagree
(0-4)Strongly
disagree (0-1) Don’t know/
refusedMean
Total 20% 47% 22% 31% 11% 1% 5.7
Black 27% 49% 24% 27% 10% 0% 5.9
Latino 22% 49% 21% 29% 13% 1% 5.8
Asian 14% 38% 22% 38% 12% 2% 5
White 19% 47% 22% 31% 9% 0% 5.7
Q21. Please indicate how much you agree or disagree on a scale of 0-10:
The entry of new people into the American workforce will increase our tax base and help support our retiree population.
Strongly agree
(9-10) Total agree
(6-10) Neutral
(5)Total disagree
(0-4)Strongly
disagree (0-1) Don’t know/
refusedMean
Total 24% 59% 17% 24% 9% 1% 6.2
Black 38% 65% 20% 14% 6% 1% 7
Latino 33% 70% 17% 13% 5% 1% 7
Asian 29% 65% 14% 19% 8% 2% 6.6
White 20% 55% 17% 28% 11% 1% 5.9

42 Center for American Progress | Building an All-In Nation
Q26. Please indicate how much you agree or disagree on a scale of 0-10:
Discrimination against whites will increase.
Strongly agree
(9-10) Total agree
(6-10) Neutral
(5)Total disagree
(0-4)Strongly
disagree (0-1) Don’t know/
refusedMean
Total 17% 42% 21% 37% 16% 1% 5.1
Black 15% 28% 19% 52% 29% 1% 4.1
Latino 14% 40% 24% 35% 19% 1% 5
Asian 7% 25% 21% 52% 23% 2% 4
White 19% 46% 20% 33% 12% 0% 5.5
Q27. Please indicate how much you agree or disagree on a scale of 0-10:
There will be too many demands on government services.
Strongly agree
(9-10) Total agree
(6-10) Neutral
(5)Total disagree
(0-4)Strongly
disagree (0-1) Don’t know/
refusedMean
Total 34% 62% 16% 21% 8% 1% 6.6
Black 26% 52% 21% 26% 13% 1% 5.9
Latino 36% 64% 19% 17% 7% 1% 6.9
Asian 23% 53% 18% 27% 8% 2% 5.9
White 35% 64% 14% 21% 7% 0% 6.7
Q28. Please indicate how much you agree or disagree on a scale of 0-10:
Our education system will get worse.
Strongly agree
(9-10) Total agree
(6-10) Neutral
(5)Total disagree
(0-4)Strongly
disagree (0-1) Don’t know/
refusedMean
Total 21% 44% 20% 35% 15% 1% 5.4
Black 20% 39% 20% 41% 22% 0% 5
Latino 21% 48% 19% 31% 15% 1% 5.6
Asian 10% 29% 20% 49% 19% 1% 4
White 21% 46% 20% 34% 14% 0% 5.5
Q25. Please indicate how much you agree or disagree on a scale of 0-10:
There will not be enough jobs for everybody.
Strongly agree
(9-10) Total agree
(6-10) Neutral
(5)Total disagree
(0-4)Strongly
disagree (0-1) Don’t know/
refusedMean
Total 28% 54% 17% 28% 12% 1% 6
Black 27% 56% 20% 24% 9% 0% 6.2
Latino 23% 49% 20% 30% 14% 1% 5.8
Asian 20% 47% 15% 36% 14% 2% 5.4
White 29% 55% 16% 28% 11% 1% 6.1

43 Center for American Progress | Building an All-In Nation
Q30. Every year, more jobs in America require a college degree. By 2018, 63 percent of jobs will require a college degree or post-secondary certification. Yet current education projections say we will produce about 3 million fewer graduates than necessary to fill these jobs. Overall, how big of a problem is it for the country that we are not producing enough college graduates to fill the jobs of the future?
Total Black Latino Asian White
A very serious problem 43% 47% 52% 44% 40%
A serious problem 36% 38% 38% 31% 37%
Not too serious of a problem
14% 10% 7% 16% 15%
Not a problem at all 7% 5% 3% 7% 7%
Don't know 1% 1% 0% 2% 1%
Q31. One of the reasons why America is not producing enough college educated workers is that African American and Latino college graduation rates are only a half to a third of the rates among whites. How big of a problem do you think the gap between the college graduation rates for African American and Latinos and whites is for our country?
Total Black Latino Asian White
A very serious problem 30% 47% 44% 32% 25%
A serious problem 42% 41% 40% 34% 43%
Not too serious of a problem
18% 7% 11% 21% 21%
Not a problem at all 9% 5% 4% 10% 10%
Don't know 2% 0% 1% 3% 2%
Q29. Please indicate how much you agree or disagree on a scale of 0-10:
There will be more inequality.
Strongly agree
(9-10) Total agree
(6-10) Neutral
(5)Total disagree
(0-4)Strongly
disagree (0-1) Don’t know/
refusedMean
Total 13% 38% 26% 35% 13% 1% 5.1
Black 15% 42% 30% 27% 14% 1% 5.4
Latino 17% 44% 25% 30% 12% 1% 5.5
Asian 12% 34% 24% 40% 15% 2% 4.8
White 12% 36% 26% 36% 14% 1% 5
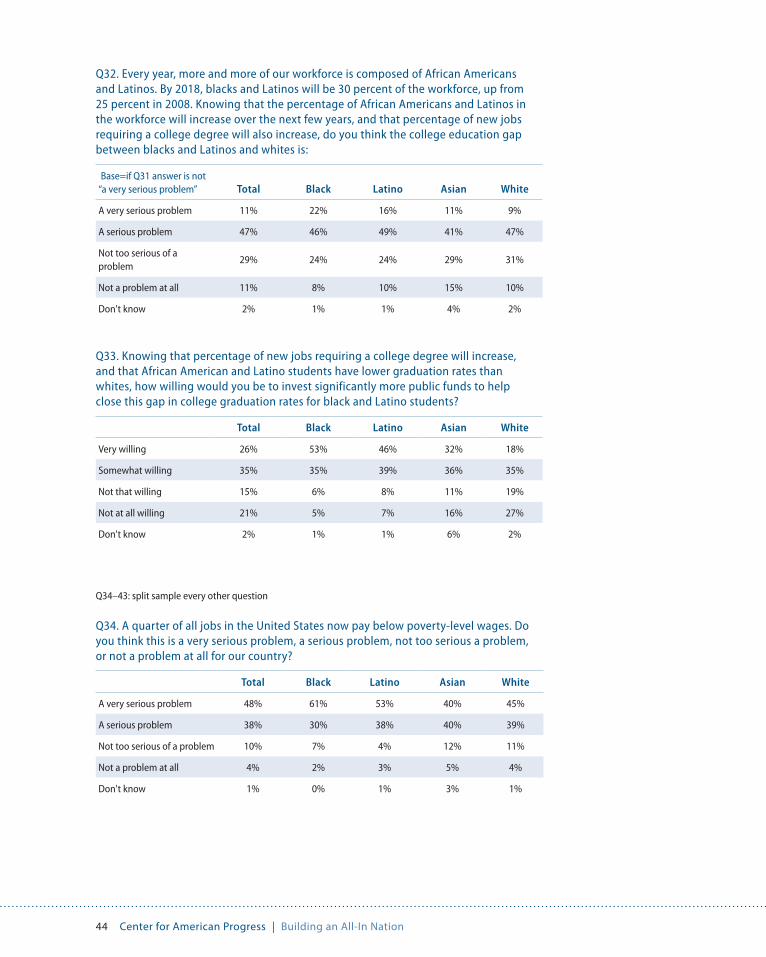
44 Center for American Progress | Building an All-In Nation
Q33. Knowing that percentage of new jobs requiring a college degree will increase, and that African American and Latino students have lower graduation rates than whites, how willing would you be to invest significantly more public funds to help close this gap in college graduation rates for black and Latino students?
Total Black Latino Asian White
Very willing 26% 53% 46% 32% 18%
Somewhat willing 35% 35% 39% 36% 35%
Not that willing 15% 6% 8% 11% 19%
Not at all willing 21% 5% 7% 16% 27%
Don't know 2% 1% 1% 6% 2%
Q34. A quarter of all jobs in the United States now pay below poverty-level wages. Do you think this is a very serious problem, a serious problem, not too serious a problem, or not a problem at all for our country?
Total Black Latino Asian White
A very serious problem 48% 61% 53% 40% 45%
A serious problem 38% 30% 38% 40% 39%
Not too serious of a problem 10% 7% 4% 12% 11%
Not a problem at all 4% 2% 3% 5% 4%
Don't know 1% 0% 1% 3% 1%
Q32. Every year, more and more of our workforce is composed of African Americans and Latinos. By 2018, blacks and Latinos will be 30 percent of the workforce, up from 25 percent in 2008. Knowing that the percentage of African Americans and Latinos in the workforce will increase over the next few years, and that percentage of new jobs requiring a college degree will also increase, do you think the college education gap between blacks and Latinos and whites is:
Base=if Q31 answer is not “a very serious problem” Total Black Latino Asian White
A very serious problem 11% 22% 16% 11% 9%
A serious problem 47% 46% 49% 41% 47%
Not too serious of a problem
29% 24% 24% 29% 31%
Not a problem at all 11% 8% 10% 15% 10%
Don't know 2% 1% 1% 4% 2%
Q34–43: split sample every other question

45 Center for American Progress | Building an All-In Nation
Q37. A child born into a wealthy family in the U.S. is more than twice as likely as a child born into a poor family to end up in the middle class or above as an adult. Do you think this is a very serious problem, a serious problem, not too serious a problem, or not a problem at all for our country?
Total Black Latino Asian White
A very serious problem 18% 31% 23% 22% 15%
A serious problem 32% 39% 41% 29% 29%
Not too serious of a problem 28% 19% 22% 25% 31%
Not a problem at all 17% 11% 13% 21% 19%
Don't know 4% 0% 1% 3% 6%
Q36. Sixteen percent of white children born to middle-class parents end up poor, compared to 45 percent of black children born to middle-class parents. Do you think this is a very serious problem, a serious problem, not too serious a problem, or not a problem at all for our country?
Total Black Latino Asian White
A very serious problem 30% 44% 35% 30% 26%
A serious problem 47% 33% 41% 33% 52%
Not too serious of a problem 15% 15% 13% 22% 14%
Not a problem at all 6% 7% 10% 10% 5%
Don't know 2% 1% 1% 5% 3%
Q35. Whites on average have 20 times the net worth of African Americans and 18 times that of Latinos. Do you think this is a very serious problem, a serious problem, not too serious a problem, or not a problem at all for our country?
Total Black Latino Asian White
A very serious problem 19% 42% 26% 24% 15%
A serious problem 36% 39% 45% 36% 34%
Not too serious of a problem 27% 10% 18% 21% 32%
Not a problem at all 14% 9% 9% 16% 15%
Don't know 4% 1% 2% 4% 4%

46 Center for American Progress | Building an All-In Nation
Q39. One in four children under age 5 live in poverty, including around two in five black and Latino children. Do you think this is a very serious problem, a serious problem, not too serious a problem, or not a problem at all for our country?
Total Black Latino Asian White
A very serious problem 40% 61% 49% 37% 36%
A serious problem 45% 33% 40% 39% 48%
Not too serious of a problem 8% 3% 5% 11% 9%
Not a problem at all 6% 3% 6% 9% 7%
Don't know 1% 0% - 4% 1%
Q40. Forty percent of whites complete college by age 30, compared to 23 percent of blacks and 15 percent of Latinos. Do you think this is a very serious problem, a serious problem, not too serious a problem, or not a problem at all for our country?
Total Black Latino Asian White
A very serious problem 25% 44% 46% 25% 17%
A serious problem 41% 42% 34% 39% 42%
Not too serious of a problem 24% 9% 14% 24% 29%
Not a problem at all 9% 5% 6% 9% 10%
Don't know 1% 0% 0% 4% 2%
Q38. Since 1979, income gains for the top 1 percent have been 277 percent, while gains for the middle class have been 38 percent and those for the poor 18 percent. Do you think this is a very serious problem, a serious problem, not too serious a problem, or not a problem at all for our country?
Total Black Latino Asian White
A very serious problem 41% 48% 46% 35% 40%
A serious problem 36% 39% 39% 38% 35%
Not too serious of a problem 13% 7% 10% 16% 14%
Not a problem at all 7% 5% 4% 8% 8%
Don't know 2% 1% 1% 4% 3%

47 Center for American Progress | Building an All-In Nation
Q42. Forty-eight percent of black eighth-graders and 43 percent of Latino eighth-graders score below basic on math and reading tests, compared to 17 percent of whites. Do you think this is a very serious problem, a serious problem, not too serious a problem, or not a problem at all for our country?
Total Black Latino Asian White
A very serious problem 45% 60% 54% 37% 42%
A serious problem 43% 36% 37% 39% 46%
Not too serious of a problem 8% 4% 6% 13% 8%
Not a problem at all 3% 1% 3% 9% 3%
Don't know 1% - 0% 3% 1%
Q43. Predatory loans are five times more likely in black neighborhoods than in white ones. Do you think this is a very serious problem, a serious problem, not too serious a problem, or not a problem at all for our country?
Total Black Latino Asian White
A very serious problem 37% 48% 45% 39% 34%
A serious problem 40% 40% 40% 32% 42%
Not too serious of a problem 11% 9% 8% 12% 12%
Not a problem at all 5% 2% 5% 8% 5%
Don't know 6% 1% 3% 8% 7%
Q41. The average income of white families is $70,000, compared to $40,000 for blacks and Latinos. Do you think this is a very serious problem, a serious problem, not too serious a problem, or not a problem at all for our country?
Total Black Latino Asian White
A very serious problem 25% 48% 40% 20% 19%
A serious problem 42% 41% 41% 37% 43%
Not too serious of a problem 19% 8% 12% 23% 22%
Not a problem at all 12% 3% 7% 16% 13%
Don't know 3% - 0% 4% 3%
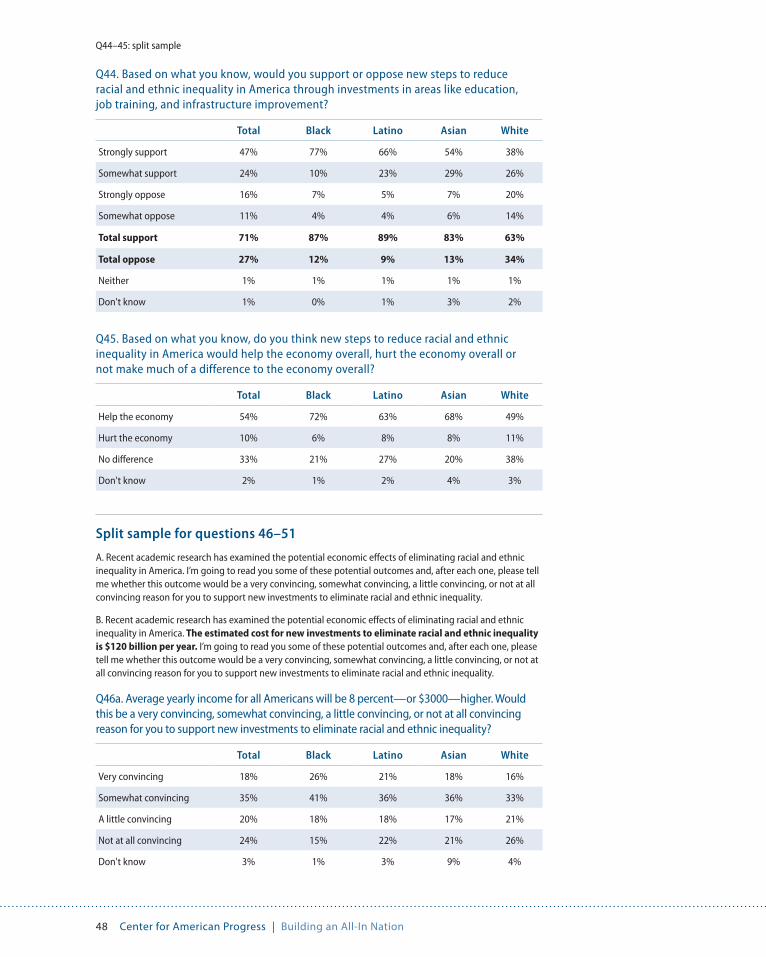
48 Center for American Progress | Building an All-In Nation
Q45. Based on what you know, do you think new steps to reduce racial and ethnic inequality in America would help the economy overall, hurt the economy overall or not make much of a difference to the economy overall?
Total Black Latino Asian White
Help the economy 54% 72% 63% 68% 49%
Hurt the economy 10% 6% 8% 8% 11%
No difference 33% 21% 27% 20% 38%
Don't know 2% 1% 2% 4% 3%
Q46a. Average yearly income for all Americans will be 8 percent—or $3000—higher. Would this be a very convincing, somewhat convincing, a little convincing, or not at all convincing reason for you to support new investments to eliminate racial and ethnic inequality?
Total Black Latino Asian White
Very convincing 18% 26% 21% 18% 16%
Somewhat convincing 35% 41% 36% 36% 33%
A little convincing 20% 18% 18% 17% 21%
Not at all convincing 24% 15% 22% 21% 26%
Don't know 3% 1% 3% 9% 4%
Split sample for questions 46–51
A. Recent academic research has examined the potential economic effects of eliminating racial and ethnic inequality in America. I’m going to read you some of these potential outcomes and, after each one, please tell me whether this outcome would be a very convincing, somewhat convincing, a little convincing, or not at all convincing reason for you to support new investments to eliminate racial and ethnic inequality.
B. Recent academic research has examined the potential economic effects of eliminating racial and ethnic inequality in America. The estimated cost for new investments to eliminate racial and ethnic inequality is $120 billion per year. I’m going to read you some of these potential outcomes and, after each one, please tell me whether this outcome would be a very convincing, somewhat convincing, a little convincing, or not at all convincing reason for you to support new investments to eliminate racial and ethnic inequality.
Q44. Based on what you know, would you support or oppose new steps to reduce racial and ethnic inequality in America through investments in areas like education, job training, and infrastructure improvement?
Total Black Latino Asian White
Strongly support 47% 77% 66% 54% 38%
Somewhat support 24% 10% 23% 29% 26%
Strongly oppose 16% 7% 5% 7% 20%
Somewhat oppose 11% 4% 4% 6% 14%
Total support 71% 87% 89% 83% 63%
Total oppose 27% 12% 9% 13% 34%
Neither 1% 1% 1% 1% 1%
Don't know 1% 0% 1% 3% 2%
Q44–45: split sample

49 Center for American Progress | Building an All-In Nation
Q47a. The size of the economy or Gross Domestic Product will be $1.2 trillion higher. Would this be a very convincing, somewhat convincing, a little convincing, or not at all convincing reason for you to support new investments to eliminate racial and ethnic inequality?
Total Black Latino Asian White
Very convincing 25% 30% 23% 23% 25%
Somewhat convincing 36% 40% 44% 32% 34%
A little convincing 13% 9% 16% 15% 13%
Not at all convincing 21% 19% 14% 17% 23%
Don't know 5% 2% 3% 13% 5%
Q47b. The size of the economy or Gross Domestic Product will be $1.2 trillion higher. Would this be a very convincing, somewhat convincing, a little convincing, or not at all convincing reason for you to support new investments to eliminate racial and ethnic inequality?
Total Black Latino Asian White
Very convincing 25% 37% 22% 30% 24%
Somewhat convincing 37% 37% 42% 30% 37%
A little convincing 12% 7% 21% 13% 11%
Not at all convincing 21% 14% 10% 15% 24%
Don't know 4% 5% 4% 12% 4%
Q46b. Average yearly income for all Americans will be 8 percent—or $3000—higher. Would this be a very convincing, somewhat convincing, a little convincing, or not at all convincing reason for you to support new investments to eliminate racial and ethnic inequality?
Total Black Latino Asian White
Very convincing 16% 23% 21% 21% 14%
Somewhat convincing 38% 47% 37% 33% 37%
A little convincing 17% 9% 23% 20% 17%
Not at all convincing 26% 19% 17% 20% 29%
Don't know 3% 2% 2% 7% 3%
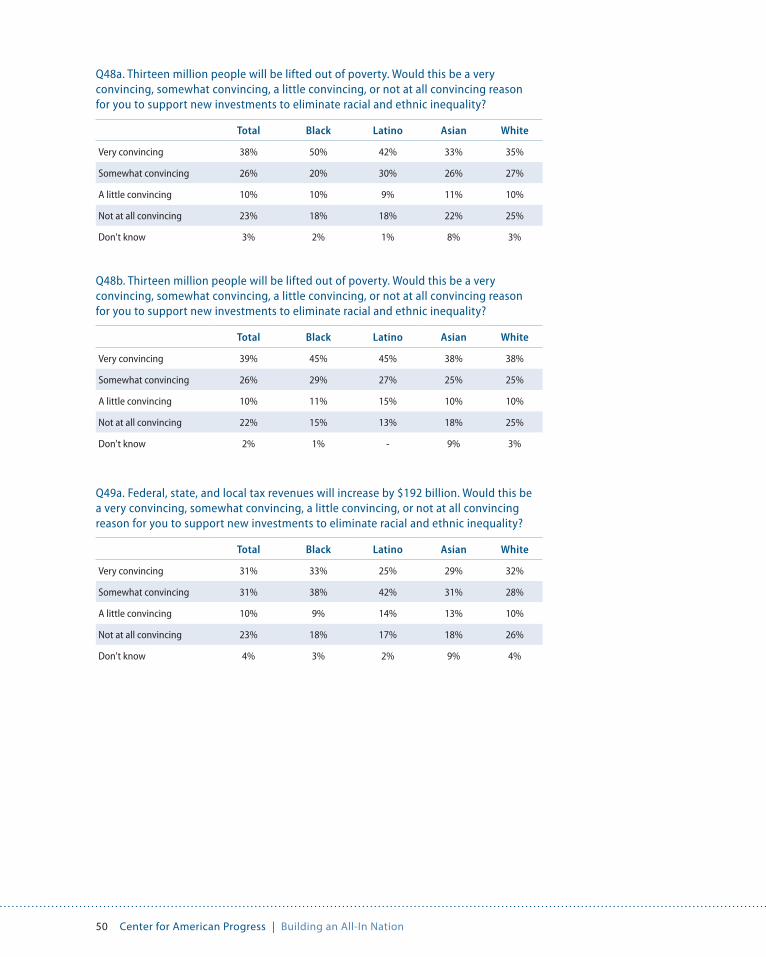
50 Center for American Progress | Building an All-In Nation
Q48b. Thirteen million people will be lifted out of poverty. Would this be a very convincing, somewhat convincing, a little convincing, or not at all convincing reason for you to support new investments to eliminate racial and ethnic inequality?
Total Black Latino Asian White
Very convincing 39% 45% 45% 38% 38%
Somewhat convincing 26% 29% 27% 25% 25%
A little convincing 10% 11% 15% 10% 10%
Not at all convincing 22% 15% 13% 18% 25%
Don't know 2% 1% - 9% 3%
Q49a. Federal, state, and local tax revenues will increase by $192 billion. Would this be a very convincing, somewhat convincing, a little convincing, or not at all convincing reason for you to support new investments to eliminate racial and ethnic inequality?
Total Black Latino Asian White
Very convincing 31% 33% 25% 29% 32%
Somewhat convincing 31% 38% 42% 31% 28%
A little convincing 10% 9% 14% 13% 10%
Not at all convincing 23% 18% 17% 18% 26%
Don't know 4% 3% 2% 9% 4%
Q48a. Thirteen million people will be lifted out of poverty. Would this be a very convincing, somewhat convincing, a little convincing, or not at all convincing reason for you to support new investments to eliminate racial and ethnic inequality?
Total Black Latino Asian White
Very convincing 38% 50% 42% 33% 35%
Somewhat convincing 26% 20% 30% 26% 27%
A little convincing 10% 10% 9% 11% 10%
Not at all convincing 23% 18% 18% 22% 25%
Don't know 3% 2% 1% 8% 3%

51 Center for American Progress | Building an All-In Nation
Q50a. The long-run deficit faced by Social Security will be reduced by 10 percent. Would this be a very convincing, somewhat convincing, a little convincing, or not at all convincing reason for you to support new investments to eliminate racial and ethnic inequality?
Total Black Latino Asian White
Very convincing 26% 30% 26% 20% 26%
Somewhat convincing 33% 32% 34% 38% 33%
A little convincing 12% 12% 15% 17% 10%
Not at all convincing 26% 25% 23% 18% 27%
Don't know 3% 1% 2% 7% 3%
Q50b. The long-run deficit faced by Social Security will be reduced by 10 percent. Would this be a very convincing, somewhat convincing, a little convincing, or not at all convincing reason for you to support new investments to eliminate racial and ethnic inequality?
Total Black Latino Asian White
Very convincing 26% 33% 25% 23% 25%
Somewhat convincing 31% 34% 38% 36% 29%
A little convincing 12% 13% 16% 13% 11%
Not at all convincing 28% 19% 19% 18% 32%
Don't know 3% 1% 2% 10% 3%
Q49b. Federal, state, and local tax revenues will increase by $192 billion. Would this be a very convincing, somewhat convincing, a little convincing, or not at all convincing reason for you to support new investments to eliminate racial and ethnic inequality?
Total Black Latino Asian White
Very convincing 29% 33% 28% 31% 28%
Somewhat convincing 34% 37% 38% 30% 33%
A little convincing 11% 8% 16% 12% 11%
Not at all convincing 22% 17% 15% 17% 25%
Don't know 4% 4% 2% 10% 3%

52 Center for American Progress | Building an All-In Nation
Q51b. The estimated 42 percent of the workforce who will be black or Latino by 2050 will be better prepared for the jobs of the future. Would this be a very convincing, somewhat convincing, a little convincing, or not at all convincing reason for you to support new investments to eliminate racial and ethnic inequality?
Total Black Latino Asian White
Very convincing 34% 45% 44% 32% 30%
Somewhat convincing 35% 39% 37% 32% 35%
A little convincing 10% 6% 14% 10% 10%
Not at all convincing 18% 8% 4% 16% 22%
Don't know 2% 1% 1% 10% 2%
Q52. And moving on to the topic of immigration, recent research has also looked at the potential economic effects of providing a path to citizenship for undocumented immigrants. One study found that doing so would add $109 billion to federal, state and local taxes. Is this a very convincing, somewhat convincing, a little convincing, or not at all convincing reason for you to support a path to citizenship for undocumented immigrants?
Total Black Latino Asian White
Very convincing 28% 24% 47% 29% 25%
Somewhat convincing 25% 39% 27% 18% 22%
A little convincing 13% 15% 13% 20% 12%
Not at all convincing 32% 19% 11% 27% 38%
Don't know 2% 4% 2% 7% 2%
Q51a. The estimated 42 percent of the workforce who will be black or Latino by 2050 will be better prepared for the jobs of the future. Would this be a very convincing, somewhat convincing, a little convincing, or not at all convincing reason for you to support new investments to eliminate racial and ethnic inequality?
Total Black Latino Asian White
Very convincing 34% 47% 40% 34% 30%
Somewhat convincing 38% 33% 39% 28% 40%
A little convincing 10% 12% 10% 17% 10%
Not at all convincing 15% 7% 11% 12% 17%
Don't know 3% 1% 1% 9% 3%

53 Center for American Progress | Building an All-In Nation
Q53. When it comes to undocumented immigrants, which of these statements do you agree with most? Undocumented immigrants are part of our community. If they work hard and pay taxes, we should integrate them into the community by helping them learn English and provide them with a way to earn citizenship.
Undocumented immigrants have broken the law and are here illegally. No matter how hard they work, we must enforce the laws on the books and deport all we can.
Total Black Latino Asian White
Undocumented/community - Strongly 43% 45% 71% 33% 37%
Undocumented/community - Somewhat 16% 22% 12% 28% 15%
Undocumented/broke laws - Strongly 25% 17% 13% 18% 30%
Undocumented/broke laws - Somewhat 10% 14% 2% 11% 11%
Total undocumented/community 59% 67% 82% 61% 52%
Total undocumented/broke laws 35% 31% 15% 29% 41%
Both of these 1% 1% 1% 2% 1%
Neither of these 3% 1% 0% 3% 4%
Don't know 2% 0% 2% 4% 2%
Q54. Are you currently registered to vote?
Total Black Latino Asian White
Yes 85% 89% 58% 68% 91%
No 15% 11% 41% 30% 9%
Don't know 1% - 1% 2% 1%
Q55. A lot of people we talk to wanted to vote, but were too busy or forgot it was Election Day. How about you? Would the official voter history database for [STATE] indicate that you voted in the November 2012 presidential election last year, or did you not get a chance to vote?
Base=registered voter Total Black Latino Asian White
Yes 87% 91% 72% 78% 88%
No 13% 8% 27% 21% 12%
Don't know 0% 0% 1% 0% 0%

54 Center for American Progress | Building an All-In Nation
Q56. [Hispanics/Latinos] have their roots in many different countries in Latin America. To what country do you or your family trace your ancestry?
Total Black Latino Asian White
Argentina 1% - 1% - -
Colombia 0% - 0% - -
Costa Rica 0% - 0% - -
Cuba 2% - 2% - -
Dominican Republic 3% - 3% - -
Ecuador 1% - 1% - -
El Salvador 4% - 4% - -
Guatemala 2% - 2% - -
Honduras 1% - 1% - -
Mexico 60% - 60% - -
Nicaragua 0% - 0% - -
Peru 0% - 0% - -
Puerto Rico 9% - 9% - -
Spain / Spanish 4% - 4% - -
Uruguay 0% - 0% - -
Venezuela 0% - 0% - -
United States / America 4% - 4% - -
Other country 3% - 3% - -
None 0% - 0% - -
Don't know 4% - 4% - -
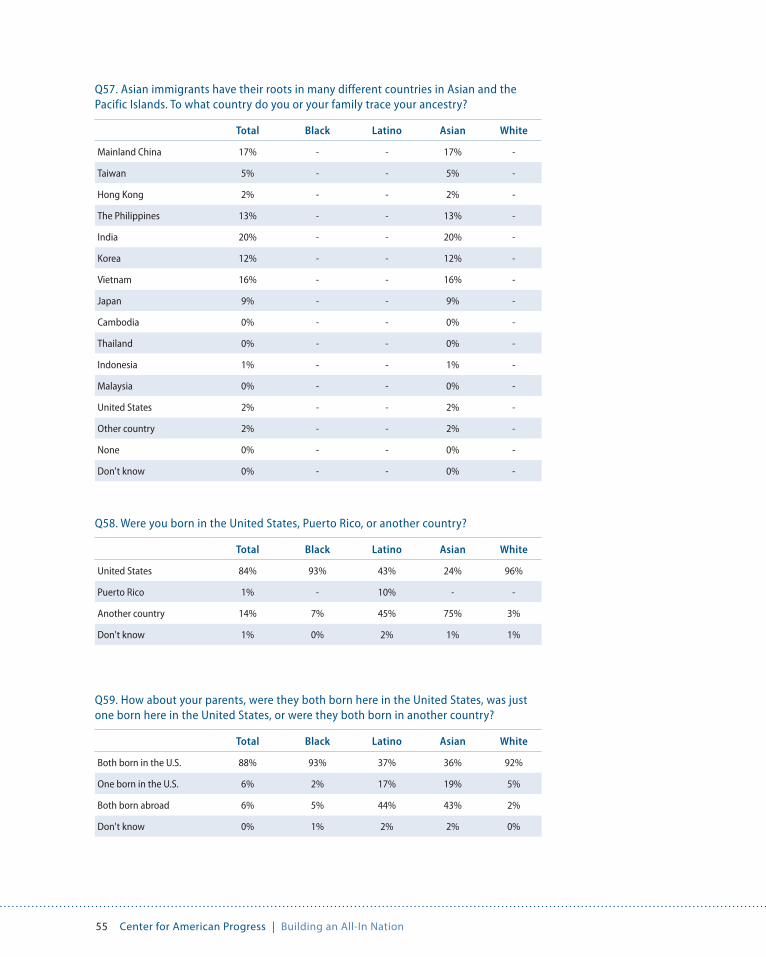
55 Center for American Progress | Building an All-In Nation
Q57. Asian immigrants have their roots in many different countries in Asian and the Pacific Islands. To what country do you or your family trace your ancestry?
Total Black Latino Asian White
Mainland China 17% - - 17% -
Taiwan 5% - - 5% -
Hong Kong 2% - - 2% -
The Philippines 13% - - 13% -
India 20% - - 20% -
Korea 12% - - 12% -
Vietnam 16% - - 16% -
Japan 9% - - 9% -
Cambodia 0% - - 0% -
Thailand 0% - - 0% -
Indonesia 1% - - 1% -
Malaysia 0% - - 0% -
United States 2% - - 2% -
Other country 2% - - 2% -
None 0% - - 0% -
Don't know 0% - - 0% -
Q58. Were you born in the United States, Puerto Rico, or another country?
Total Black Latino Asian White
United States 84% 93% 43% 24% 96%
Puerto Rico 1% - 10% - -
Another country 14% 7% 45% 75% 3%
Don't know 1% 0% 2% 1% 1%
Q59. How about your parents, were they both born here in the United States, was just one born here in the United States, or were they both born in another country?
Total Black Latino Asian White
Both born in the U.S. 88% 93% 37% 36% 92%
One born in the U.S. 6% 2% 17% 19% 5%
Both born abroad 6% 5% 44% 43% 2%
Don't know 0% 1% 2% 2% 0%

56 Center for American Progress | Building an All-In Nation
Q60. How about your grandparents? How many of your grandparents were born here in the United States?
Total Black Latino Asian White
None born in U.S. 6% 1% 12% 35% 6%
One born in U.S. 3% 1% 6% 4% 4%
Two born in U.S. 11% 10% 14% 22% 10%
Three born in U.S. 7% 3% 20% 5% 8%
All four born in U.S. 70% 83% 37% 32% 70%
Don't know 2% 2% 10% 1% 2%
Q62. In what year were you born? (converted to age range)
Total Black Latino Asian White
18-34 28% 33% 38% 29% 25%
35-50 24% 24% 31% 32% 22%
51-69 35% 31% 22% 25% 39%
70+ 11% 10% 5% 8% 13%
Refused 2% 3% 4% 5% 2%
Q61. Blacks and African Americans in the U.S. have their roots in many different countries. To what country do you or your family trace your ancestry?
Total Black Latino Asian White
Jamaica 13% 13% - - -
Haiti 3% 3% - - -
Trinidad & Tobago 2% 2% - - -
Bahamas 1% 1% - - -
Grenada 3% 3% - - -
Nigeria 1% 1% - - -
Ethiopia 4% 4% - - -
Ghana 1% 1% - - -
Liberia 2% 2% - - -
Somalia 1% 1% - - -
Kenya 2% 2% - - -
Sierra Leone 2% 2% - - -
Other (specify) 50% 50% - - -
Don't know 16% 16% - - -
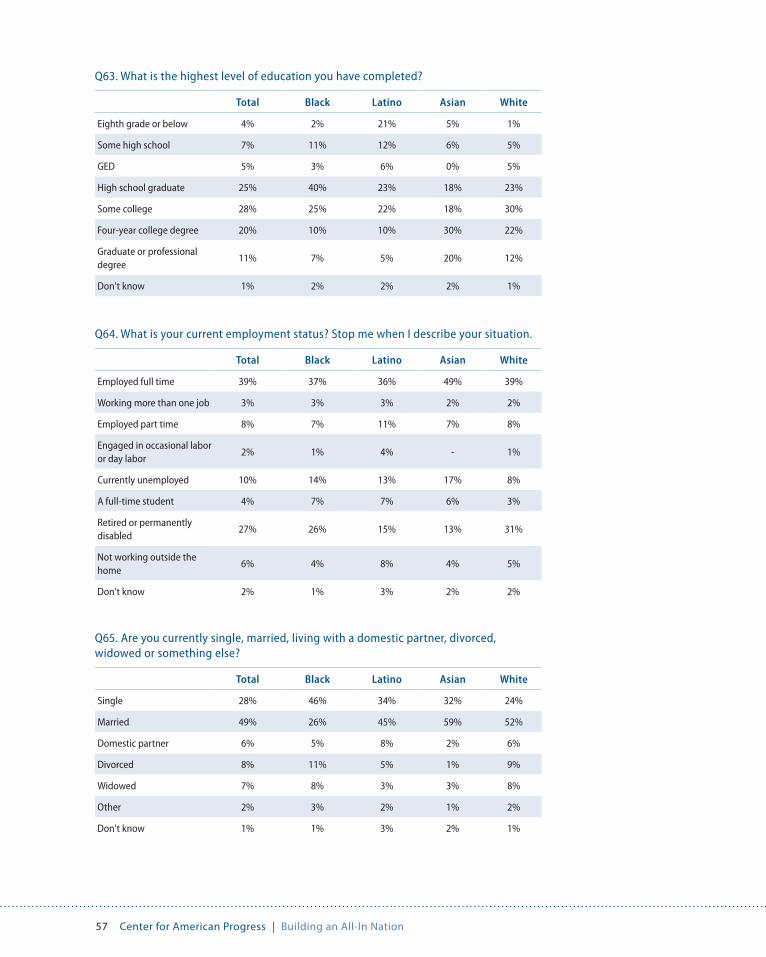
57 Center for American Progress | Building an All-In Nation
Q63. What is the highest level of education you have completed?
Total Black Latino Asian White
Eighth grade or below 4% 2% 21% 5% 1%
Some high school 7% 11% 12% 6% 5%
GED 5% 3% 6% 0% 5%
High school graduate 25% 40% 23% 18% 23%
Some college 28% 25% 22% 18% 30%
Four-year college degree 20% 10% 10% 30% 22%
Graduate or professional degree
11% 7% 5% 20% 12%
Don't know 1% 2% 2% 2% 1%
Q65. Are you currently single, married, living with a domestic partner, divorced, widowed or something else?
Total Black Latino Asian White
Single 28% 46% 34% 32% 24%
Married 49% 26% 45% 59% 52%
Domestic partner 6% 5% 8% 2% 6%
Divorced 8% 11% 5% 1% 9%
Widowed 7% 8% 3% 3% 8%
Other 2% 3% 2% 1% 2%
Don't know 1% 1% 3% 2% 1%
Q64. What is your current employment status? Stop me when I describe your situation.
Total Black Latino Asian White
Employed full time 39% 37% 36% 49% 39%
Working more than one job 3% 3% 3% 2% 2%
Employed part time 8% 7% 11% 7% 8%
Engaged in occasional labor or day labor
2% 1% 4% - 1%
Currently unemployed 10% 14% 13% 17% 8%
A full-time student 4% 7% 7% 6% 3%
Retired or permanently disabled
27% 26% 15% 13% 31%
Not working outside the home
6% 4% 8% 4% 5%
Don't know 2% 1% 3% 2% 2%

58 Center for American Progress | Building an All-In Nation
Q66. What is the race or ethnicity of your spouse or partner?
Total Black Latino Asian White
White 68% 10% 13% 10% 90%
Hispanic / Latino 13% 1% 79% 0% 3%
Asian American 6% 2% 1% 79% 1%
Black / African American 6% 85% 1% 1% 1%
Other 5% 2% 5% 10% 4%
Don't know 1% - 1% 0% 1%
Q67. How many children under the age of 18 do you have living with you?
Total Black Latino Asian White
0 65% 59% 46% 57% 72%
1 12% 14% 14% 16% 11%
2 13% 13% 20% 19% 10%
3 4% 7% 9% 3% 3%
4 2% 3% 5% 1% 2%
5 1% 1% 2% 0% 0%
6 0% 0% 1% 0% 0%
7 0% 1% - - -
8 0% - - - 0%
9 0% - - - 0%
Refused 2% 1% 3% 4% 1%
Q68. What was your total combined household income in 2012 before taxes?
Total Black Latino Asian White
Less than $20,000 20% 33% 32% 20% 16%
$20,000 to less than $40,000
20% 23% 28% 15% 18%
$40,000 to less than $60,000
14% 13% 11% 10% 15%
$60,000 to less than $75,000
8% 8% 4% 8% 9%
$75,000 to less than $90,000
5% 4% 3% 3% 6%
$90,000 to less than $150,000
10% 4% 5% 13% 13%
More than $150,000 6% 2% 2% 13% 7%
Don't know 16% 14% 16% 19% 16%

59 Center for American Progress | Building an All-In Nation
Q69. Generally speaking, do you usually consider yourself a Democrat, a Republican, an independent, some other party, or what?
Total Black Latino Asian White
Democrat 37% 77% 47% 35% 28%
Republican 22% 3% 9% 18% 28%
Independent 26% 14% 21% 25% 30%
Other 7% 3% 7% 5% 9%
Don't care 2% 1% 3% 7% 1%
Don't know 6% 2% 14% 10% 5%
Q70. Do you consider yourself a strong (Democrat or Republican), or a not very strong (Democrat or Republican)?
Base=partisan Total Black Latino Asian White
Strong partisan 62% 76% 51% 43% 62%
Not very strong partisan 36% 22% 47% 53% 36%
Don't know 2% 2% 2% 4% 2%
Q71. Do you think of yourself as closer to the Republican or Democratic Party?
Base=non partisan Total Black Latino Asian White
Republican 36% 6% 17% 14% 43%
Democrat 28% 52% 37% 29% 25%
Don't know 36% 42% 46% 57% 32%

60 Center for American Progress | Building an All-In Nation
Q72. People use different terms to describe their political views. When it comes to your political viewpoints, do you consider yourself to be liberal or conservative?
Total Black Latino Asian White
Very liberal 16% 21% 15% 26% 14%
Somewhat liberal 19% 19% 25% 25% 18%
Slightly liberal 5% 6% 5% 6% 5%
None / other 6% 8% 2% 7% 7%
Slightly conservative 8% 11% 8% 7% 8%
Somewhat conservative 19% 14% 22% 12% 20%
Very conservative 19% 14% 13% 8% 22%
Total liberal 40% 46% 45% 57% 36%
Total conservative 46% 38% 43% 26% 50%
Don't know 7% 8% 9% 10% 7%
Q73. With what religious tradition do you most closely identify? Stop me when I get to the correct one.
Total Black Latino Asian White
Catholic 23% 3% 59% 18% 19%
Assemblies of God 2% 3% 2% 2% 2%
Southern Baptist 12% 33% 2% 3% 12%
Pentecostal 3% 9% 5% 0% 2%
Other Protestant 13% 6% 3% 8% 17%
Mormon 2% - 0% 0% 3%
Jewish 2% 0% 0% 0% 2%
Jehovah's Witness 0% 1% 1% - 0%
Muslim 0% 2% - 0% 0%
Don't identify with any religious denomination
17% 13% 10% 25% 18%
Other (specify) 21% 26% 10% 38% 21%
Don't know 4% 4% 7% 6% 3%

61 Center for American Progress | Building an All-In Nation
Q74. Do you consider yourself a born-again Christian?
Total Black Latino Asian White
Yes 39% 65% 37% 17% 37%
No 56% 31% 53% 71% 59%
Don't know 5% 4% 9% 12% 4%
Q75. How often do you attend religious services?
Total Black Latino Asian White
More than once a week 13% 25% 14% 11% 10%
Once a week 28% 33% 34% 22% 26%
Once a month 14% 14% 17% 12% 14%
Only major religious holidays
16% 12% 14% 26% 17%
Never 24% 11% 14% 25% 29%
Don't know 5% 5% 7% 4% 4%
Race/Ethnicity
%
White, non-Hispanic 68
Latino 14
Black 11
Asian 6
Other 2
Q76. Gender (record by observation)
Total Black Latino Asian White
Male 50% 50% 48% 49% 51%
Female 50% 50% 52% 51% 49%
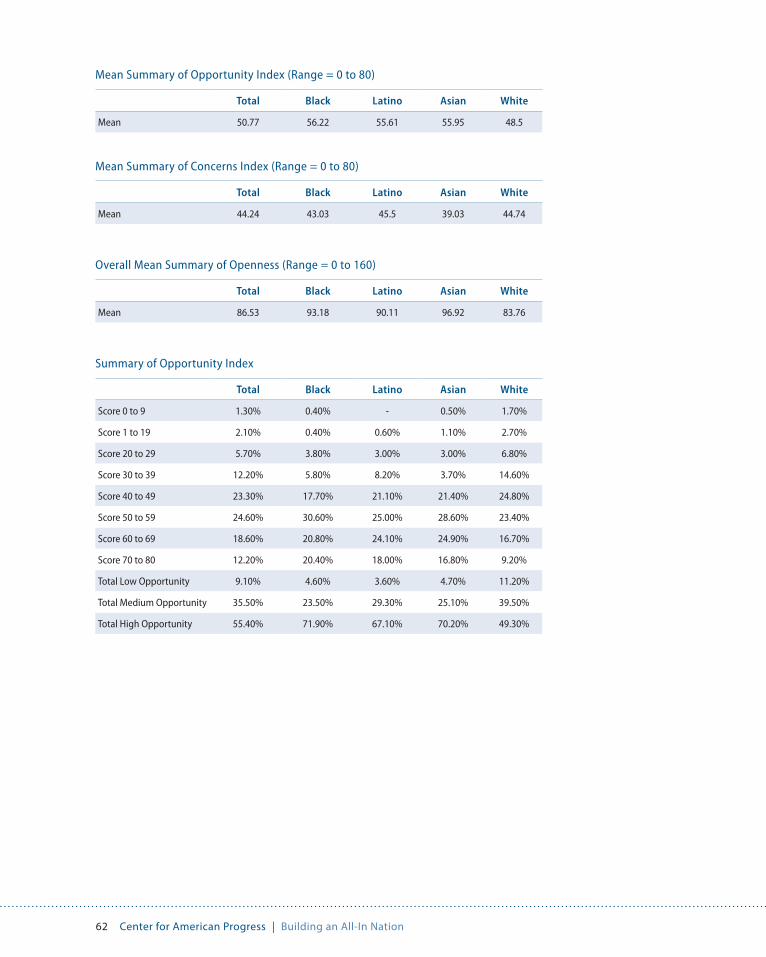
62 Center for American Progress | Building an All-In Nation
Mean Summary of Opportunity Index (Range = 0 to 80)
Total Black Latino Asian White
Mean 50.77 56.22 55.61 55.95 48.5
Mean Summary of Concerns Index (Range = 0 to 80)
Total Black Latino Asian White
Mean 44.24 43.03 45.5 39.03 44.74
Overall Mean Summary of Openness (Range = 0 to 160)
Total Black Latino Asian White
Mean 86.53 93.18 90.11 96.92 83.76
Summary of Opportunity Index
Total Black Latino Asian White
Score 0 to 9 1.30% 0.40% - 0.50% 1.70%
Score 1 to 19 2.10% 0.40% 0.60% 1.10% 2.70%
Score 20 to 29 5.70% 3.80% 3.00% 3.00% 6.80%
Score 30 to 39 12.20% 5.80% 8.20% 3.70% 14.60%
Score 40 to 49 23.30% 17.70% 21.10% 21.40% 24.80%
Score 50 to 59 24.60% 30.60% 25.00% 28.60% 23.40%
Score 60 to 69 18.60% 20.80% 24.10% 24.90% 16.70%
Score 70 to 80 12.20% 20.40% 18.00% 16.80% 9.20%
Total Low Opportunity 9.10% 4.60% 3.60% 4.70% 11.20%
Total Medium Opportunity 35.50% 23.50% 29.30% 25.10% 39.50%
Total High Opportunity 55.40% 71.90% 67.10% 70.20% 49.30%

63 Center for American Progress | Building an All-In Nation
Summary of Concerns Index
Total Black Latino Asian White
Score 0 to 9 2.40% 1.80% 1.20% 2.80% 2.40%
Score 1 to 19 5.70% 5.90% 5.30% 7.90% 5.60%
Score 20 to 29 12.20% 12.20% 8.20% 18.80% 12.70%
Score 30 to 39 16.80% 14.90% 17.80% 20.50% 16.40%
Score 40 to 49 23.40% 33.40% 25.50% 24.50% 21.30%
Score 50 to 59 19.80% 18.60% 23.10% 15.20% 19.70%
Score 60 to 69 12.60% 7.00% 13.20% 6.60% 14.00%
Score 70 to 80 7.10% 6.20% 5.60% 3.70% 7.80%
Total Low Concerns 20.30% 19.90% 14.70% 29.60% 20.70%
Total Medium Concerns 40.20% 48.30% 43.30% 45.00% 37.70%
Total High Concerns 39.50% 31.80% 41.90% 25.50% 41.60%
Summary of Overall Openness Index
Total Black Latino Asian White
Score 20 to 39 1.00% - 0.20% 0.10% 1.40%
Score 40 to 59 3.60% 0.10% 0.40% 1.60% 4.90%
Score 60 to 79 10.00% 4.20% 5.60% 3.60% 12.30%
Score 80 to 99 23.90% 19.20% 24.30% 15.90% 25.40%
Score 100 to 119 31.60% 42.10% 40.00% 35.20% 27.70%
Score 120 to 139 18.60% 24.00% 20.70% 26.60% 16.90%
Score 140 to 159 8.20% 6.20% 6.70% 13.00% 8.50%
Score 160 to 180 3.20% 4.40% 2.00% 3.90% 2.90%
Total Low Openness 4.60% 0.10% 0.60% 1.70% 6.30%
Total Medium Openness 33.80% 23.30% 29.90% 19.50% 37.70%
Total High Openness 61.60% 76.60% 69.40% 78.80% 56.00%

The Center for American Progress is a nonpartisan research and educational institute
dedicated to promoting a strong, just, and free America that ensures opportunity
for all. We believe that Americans are bound together by a common commitment to
these values and we aspire to ensure that our national policies reflect these values.
We work to find progressive and pragmatic solutions to significant domestic and
international problems and develop policy proposals that foster a government that
is “of the people, by the people, and for the people.”
1333 H STREET, NW, 10TH FLOOR, WASHINGTON, DC 20005 • TEL: 202-682-1611 • FAX: 202-682-1867 • WWW.AMERICANPROGRESS.ORG