bugårdsdammen in the perspective of alternative stable states
TRANSCRIPT

Master’s Thesis 2019 60 ECTS Environmental Sciences and Natural Resource Managementt
Bugårdsdammen in the perspective of alternative stable states
Bjørn Sverre Sondrup Masters of Science in Biology


Acknowledgements:
I would like to thank my supervisors Jan Vermaat and Thomas Rohrlack at NMBU. You have offered support and guidance throughout the process from planning to finishing the thesis. I would also like to thank the personnel at the water- and soil laboratory of MINA for help with preparation of samples and analysis and Sandefjord kommune for contribution of information and equipment for data collection. Least but not last, I would like to thank my family and Dominika for help and support.


Abstract:
The topic of this thesis is conditions of a shallow lake where extent of aquatic plants is considered problematic. The aim is to identify possible drivers for mass-development of broad-leaved pondweed in Bugårdsdammen. The lake is managed by Sandefjord municipality. The municipality has received concerns from the public about mass development of aquatic plants in the lake and wish to increase the open water. To identify possible drivers for mass-development chemical and physical conditions in the lake has been measured. Water and plant content have been analysed. A time series ranging from the 1950s to 2018 was constructed to map the change in plant-cover. The lake is shallow (average depth >1m.) and the theory of alternative stable states in shallow lakes is considered particularly relevant in interpreting the collected data. Analysis and estimated of external nutrient load indicate that the aquatic plants and filamentous algae is playing a crucial role in keeping the lake in a clear-water state.
sammendrag:
Denne masteroppgaven handler om tilstanden til en grunn innsjø, hvor vannplanters utbredelse anses som problematisk. Målet med denne masteroppgaven er å identifisere drivere for utbredelse av tjønnaks i Bugårdsdammen i Sandefjord kommune. Dammen forvaltes av kommunen, som har mottatt en rekke henvendelser for gjengroing av dammen. Kommunen ønsker å identifisere årsaker til gjengroing for å kunne gjøre tiltak som vil gi mer åpent vann i dammen. I arbeidet med å identifisere drivere for gjengroing er fysiske og kjemiske forhold blitt kartlagt. Det er gjort analyser av vannprøver og plantemateriale. En tidsserie fra 1950-tallet til 2018 er laget for å kartlegge endringer i utbredelse av vannplanter i dammen. Bugårdsdammen er en grunn innsjø (gjennomsnittsdybde > 1m.). Teorien om alternative stabile stadier i grunne innsjøer anses derfor som særlig relevant for tolkning av dataene som har bilt samlet inn. Analyser av vannprøver og estimert ekstern næringsbelastning tyder på at dammen er eutrofiert og at vannplanter og trådalger spiller en viktig rolle i å motvirke et skifte til et plankton-dominert grumsete stadium.


TTable of contents 1. Introduction ............................................................................................................................. 1
2. Methods and materials ............................................................................................................. 4
2.1 Study area and species ................................................................................................................ 4
2.2 Data collection ............................................................................................................................. 5
2.3 Laboratory procedures ................................................................................................................ 7
2.4 Time series ................................................................................................................................... 7
2.5 Uncertainties in the data ............................................................................................................. 8
3. Results ..................................................................................................................................... 9
3.1 Limnological observations ........................................................................................................... 9
3.2 Vegetation samples ................................................................................................................... 11
3.3 Water balance ............................................................................................................................ 13
3.5 Nutrient balance ........................................................................................................................ 13
3.6 Timeseries .................................................................................................................................. 14
4. Discussion .............................................................................................................................. 15
4.1 Overall physio-chemical conditions .......................................................................................... 15
4.2 Water- and nutrient balances.................................................................................................... 16
4.3 Nutrient concentration and loading: potential for state shift? ................................................ 16
4.4 Time series of the extent of water plant beds .......................................................................... 17
4.5 Synthesis and evaluation of possible measures ........................................................................ 18
4.6 conclusions................................................................................................................................. 22
5. Literature ............................................................................................................................... 23

1
1. Introduction
This thesis aims to give advice on the management of a shallow lake where the aquatic plant broad-leaved pondweed (Potamogeton natans L.) is considered to be a nuisance. The lake is located close to Sandefjord city centre and is frequently visited for recreation. In the past years the municipality has received several inquiries about the condition of the lake. Most concerns are about mass development of this pondweed which is felt to fully fill up the lake and affect water quality negatively (Rønningen & Ankersen 2016). The municipality has taken measures in the past, but these have not given satisfying results over time.
In order to give management advice that could improve the condition of the lake over time, it is important to investigate the underlying causes for pondweed mass development. It also appears useful to verify the perceived problem with data. To identify effective measures and to avoid unwanted consequence it is also important to consider the ecology of shallow lakes in general.
The management objective for this lake is to have limited plant cover with sufficient open water. To achieve this might prove challenging since presence of macrophytes is a strong regulating factor for the nutrient availability in a shallow lake and hence to probability of phytoplankton blooms. Macrophytes also reduce resuspension of sediment which causes water turbidity. The theory of alternative stable states in shallow lakes (Scheffer 1998) is highly relevant in this regard. It explains why shallow lakes are either in a clear water or a turbid stable state. There are several factors in this theory that are relevant for Bugårdsdammen. This introduction will now first focus on to the theory of alternative stable states before it will return to the specific research questions for Bugårdsdammen.
Shallow lakes are different from their deeper counterparts in two important ways. First, the photic zone can potentially reach through the whole water column and permit photosynthesis at the bottom. Second, long term temperature induced stratification is absent, which impacts the recycling of nutrients. In a well-mixed shallow lake, water and sediment contact gives rapid recycling of materials that can be caused by wind, waves and animals (Scheffer 1998). Phosphorus can also be mobilised from iron compounds under anoxic conditions and from microbial processes (Søndergaard et al. 2003). In deep lakes water layers are separated during stratification and there is less contact between sediment and epilimnion which results in lower return of nutrients from the sediment to the upper, well-light layer where plankton would grow (Scheffer 1998).
In shallow lakes it is competition among macrophytic angiosperms, periphytic algae on various substrata including sediment and phytoplankton for limited resources such as light, nutrients and space (Scheffer 1998). Macrophyte is a term for multicellular photosynthesising organisms including both angiosperms and multicellular algae. Phytoplankton refers to freely suspended photosynthesising organisms that inhabit the pelagic zone (Dobson & Frid 2009). Plant life in shallow lakes is often dominated by either
2
macrophytes or by phytoplankton (Scheffer 1998) and this has a major impact on water clarity (Scheffer 1998). There are several factors that influence the competition between macrophytes and phytoplankton. These can be both abiotic and biotic, and in nature they are often highly interconnected.
Nutrient level is an important abiotic factor affecting the state of a shallow lake. Phosphorus and in some cases nitrogen, is often the limiting factor for biomass production in aquatic ecosystems. High levels of nutrients will lead to an increase in biomass production. A number of studies has shown that with very high nutrient load, phytoplankton will dominate a shallow lake. For very low levels macrophytes will dominate (Scheffer 1998, Janse et al. 2010, Hilt 2018 et al.) the mechanism works through high availability of nutrients which will favour fast-growing phytoplankton. The theory assumes that several feedback mechanisms exists, which each reinforce one of the two stable states and may oppose transition to the other (Scheffer 1998).
Phytoplankton will attenuate light and thus shade out macrophytes growing at the bottom. Low light conditions can also arise from resuspension of sediment particles. Studies have shown that turbidity and low light condition may favour tall or fast-growing macrophyte species, which are able to occupy the upper water column (Hilt et al. 2018). Growth and settlement of organisms and debris on plant tissue can also affect macrophyte photosynthesis and will favour the same traits in turbid waters. Examples of vegetation with these growth forms are canopy-forming species near or at the water surface such as pondweeds and water lilies and free-floating species such as duckweed (Lemna minor). Competition may also be influenced towards species that are able to complete their lifecycle early in the growth season, before phytoplankton has reached high densities (Hilt et al. 2018). Low growing and slow developing species are outcompeted, because they are not able to reach toward the light (Hilt et al. 2018).
Macrophyte presence can reduce turbidity through reduced resuspension of sediment (Vermaat et al. 2000) and by reducing nutrients available for phytoplankton. Spatial heterogeneity and the large submerged surface offered by macrophytes can also provide suitable habitat for other periphytic organisms that feed on phytoplankton (Cazzanelli et al. 2008), just like trees form a forest. Interactions in the food web in shallow lakes can influence abundance of both macrophytes and phytoplankton and in turn affect turbidity of the water (Phillips et al. 2016). While nutrient-induced changes are referred to as bottom-up control of the ecosystem, the top down control is when organisms in higher trophic levels control abundance of organisms at lower trophic levels (Scheffer 1998). Zooplankton such as water fleas have the potential to significantly reduce phytoplankton biomass in shallow lakes, while planktivorous fish have the potential to control zooplankton grazing (Scheffer 1998). Piscivorous fish again can control the abundance of planktivorous fish. This mechanism is referred to as a trophic cascade, where the actions of organisms in one trophic level are having effects down through several trophic levels.

3
Bottom-feeding fish may also influence turbidity more directly by feeding on sediment and resuspending particles (Scheffer 1998). This makes the water more turbid and may enhance the release of nutrients from the sediment, influencing the competition to favour phytoplankton. Fish feeding in the sediment may also disturb macrophyte growth by uprooting (Scheffer 1998). This is yet another example of self-enforcing dynamics that contribute to make the turbid state stable.
Bugårdsdammen can be regarded in the theoretic framework of alternative stable states. This is important from a precautionary viewpoint, because small changes in the management or external conditions may cause a sudden, large change. Currently the lake is dominated by macrophytes and has clear water, but the underlying factors affecting the competition between macrophytes and phytoplankton are not known. Shallow lakes can undergo abrupt changes caused by extreme events, changes in the food web or an increase in nutrient loading over critical levels (Hilt et al. 2018; Janse et al. 2010; Scheffer 1998). To investigate the lake’s position in the context of alternative stable states, it is necessary to examine its conditions such as water transparency, abundance of submerged vegetation, sediment condition and nutrient concentration. Plant cover of broad-leaved pondweed in Bugårdsdammen is affected by these conditions directly and indirectly. This thesis focuses on three concrete research questions that are outlined below. Together their answers will allow me to draw conclusions on the likely most important factors determining the current state of this shallow lake, on the postulated mass development of the pondweed, and it will allow me to give advice on the meaningfulness of several potential measures.
1 How is the variation in water chemistry through the growth season? what do the variables suggest about the status of the lake?
2 Is it possible to estimate external and internal P-load through water and nutrient balances and what can we learn from this about the conditions in Bugårdsdammen?
3 Has the plant cover increased in the past 50 years?
Together these research questions relate possible mass development of pondweed to the main potential underlying drivers. Based on local perception, a conservative null hypothesis should be the starting point: The null hypothesis is that broad-leafed pondweed has not expanded massively. This implies that plant cover increase has been moderate, but also that there may have been a stand-still or a decline.

4
2. Methods and materials
22.1 Study area and species Bugårdsdammen consists of two parts that are connected by waterflow from east to west. Both parts have separate water inflow and share the same water outflow in the western part over a fixed weir structure. The lake covers 57 000 m−2 in total and the average depth is less than 1 meter. The eastern part is dominated by macrophytic filamentous algae of the genus Rhizoclonium and also patches of the angiosperms Polygonum amphibium (L.) and Potamogeton obtusifolius (Mert. & W.D.J.Koch) are present. In the western part broad-leaved pondweed is dominant, and there are also substantial stands of Potamogeton alpinus (Balb.) and Phragmites australis (Cav.) and areas with filamentous algae. Most likely the two parts of the lake share all macrophyte species, but there is a difference in dominance. Which fish species are present is not certain, except for northern pike (Esox lucius L.) and Crucian carp (Carassius carassius L.). Pike was introduced sometime before the year 1999 and is considered invasive (Rønningen & Ankersen 2016). Before the introduction of pike, there was trout (Salmo trutta L.), eel (Anguilla Anguilla L.) and ide (Leuciscus idus L.) in the lake in addition to crucian carp (Rønningen & Ankersen 2016).
The lake was constructed in 1876 to be used as a source of drinking water (Rønningen & Ankersen 2016) and serve as a place for recreation. Today the lake and its surrounding areas form a park and have mainly the function of recreation including out- and indoor-sports. There are educational facilities near the area, as well as a residence for elderly people, which is likely to be a source of additional visitors to the park and lake. Numerous wild and tame birds such as ducks are foraging in the area in the summer months.

5
figure 1 lake Bugårdsdammen with sampling points (norgeibilder.no 2018)
22.2 Data collection Limnological observations
The data were collected seven times in the period August to November of 2018. A series of transects was made with boat and GPS across the two parts of the lake on the first day of data collection, August 9th. The transects consisted of 20 points where dissolved oxygen (mg/l), conductivity (μS/cm) and temperature were measured at the surface, at 50 cm depth and at the bottom. This was done with a YSI dissolved oxygen probe. At each sampling point Secchi-disk transparency was measured as well as depth where macrophytic algae covered the Secchi-disk.
In four points of the transect, it was decided to have sampling points for water chemistry that were to be used in the following sampling, with a later addition of one point. Water was collected at 30 cm depth for each sample. A volume of 500 ml was taken and stored cold and dark until return to the lab.
Vegetation samples
Four vegetation samples were collected on August 9th, by cutting vegetation in a 50x50 cm square. An estimate of plant cover inside the square was made. Wet weight for the total

6
sample was measured and for the parts kept for later analysis. This was done to have a basis for estimating values per area and for the total area covered by plant. Filamentous algae samples were collected in October, using a plastic tube with 7 cm radius.
Water and nutrient balance
Water flow out of the lake was measured by the salt dilution method (Haaland 2018. see annex 1 for detailed description in Norwegian). The salt dilution method gave outflow litre per second for 4 days in the period September – October. The average from the measurements was checked with measurements from the nearest monitored stream Istreelva (sildre .no by NVE). The yearly flow out of the lake is estimated to occur during 6 months of the year. Personal observations several times in the period May to November confirms there was minimal outflow during the summer months. The average value for outflow from the measurements in September combined with the months of outflow gave the estimate water flow out of the lake.
Water sample analysis gave information on the concentration of nutrients in the water. The average values of total phosphorus and total nitrogen was used to estimate the transportation of the two nutrients out of the lake.
External nutrient loading
The Norwegian Water Resources and Energy Directorate (NVE) offers a free service to identify any drainage basin in Norway (nevina.nve.no). The program generates the catchment area and contains information about area, land use and annual weather conditions. See annex 2 for the generated catchment area. Data from the Sandefjord meteorological weather station, located about 1 km east of the lake, was used to calculate the yearly precipitation in the catchment area (eklima.no).
External nutrient loading was estimated based on information about land use in the catchment area. A nutrient budget for Vestfold county from 2011 (Smith 2012) was used as basis for estimate of nutrient loading from different categories of land use. Atmospheric nutrient deposition on surface water was estimated based on measurements in southern Norway (Oredalen & Aas 2000). Area and fraction of land use in Vestfold county for 2017 was available from The Norwegian institute of bioeconomic research (NIBIO 2017). Information from NEVINA on land use area in the catchment for Bugårdsdammen was used to estimate the yearly load of tot-P and tot-N.

7
2.3 Laboratory procedures Water chemistry analysis
All analysis was done at the Soil-and Water Laboratory at MINA- NMBU for the following elements and compounds according to Norwegian standards
Table 1 list of elements and compounds and standard used for analysis.
Element/Compound Standard used: Total nitrogen (Tot-N) NS- 1743. 2nd edition 1993 Nitrate (NO 3-) NS-EN ISO 10304-1 Total nitrogen-chloride (Tot-N-Cl −) NS-EN ISO 10304-1 Chloride (Cl −) NS-EN ISO 10304-1 Sulphate (SO4 2-) NS-EN ISO 10304-1 Phosphate (PO3−4) NS-EN 1st edition 1997 Ammonium (NH4+) NS-4746 modified (NSF 1975) 1st edition 1975 Total Phosphorus (Tot-P) NS-EN 1st edition 1997
Chemical plant analysis
Sample processing and analysis was done by qualified personnel at the Soil- and Water Laboratory of MINA - NMBU. Vegetation samples were dried at 60 for 60 hours. The samples were then pulverised.
For Total Nitrogen and Total Carbon, 100 mg of dried plant material was analysed in a LECO Truespec analyser. The result is percent of element in the sample (Nelson & Sommers 1996).
Magnesium and Phosphorus were analysed by Inductively Coupled Plasma Optical Emission Spectrometry (ICP-OES). A weighted sub-sample of approximately 0,25g of dried material form each sample was decomposed by adding 2ml water (H2O) and 5 ml distilled nitric acid (HNO3). After decomposition, the samples were diluted to 50 ml. The analysis was calibrated against plant tissue standards from apple.
Pigment analysis
Was done by professor Thomas Rohrlack see annex 3 for description.
2.4 Time series Aerial imagery was used to make a time series for water plant cover of the lake. The Norwegian Mapping Agency (Statens Kartverk) has freely available imagery of the area for the period 1959 to 2017. Images were obtained for the growth season May through September, for 1959, 1979, 2003, 2007, 2010,2011 and 2015. These images were processed into a GIS program (QGIS) and the area covered by plants was mapped, and the extent was calculated. The data from 2018 was registered as GPS points of the outer edge of plant cover on the second day of data collection August 30th and processed in the same way in QGIS. The
8
coordinate system used was euref89 and projection was set to UTM 32 N, for all the GIS processes. To ensure the same level of detail in registering the plant cover, the same level of zoom (1:776) was used for the whole time series.
22.5 Uncertainties in the data The GIS registration of plant cover was done manually so there is possibility for human error. To minimize the room for error a zoom level of 1:776 was used on all photos. It is possible to analyse plant cover automatically, but this method also has room for error. I chose to do it manually to be aware of the possible errors in the process and have a close control of the boundary zone of vegetation. In the period 1959 – 2003 there are only 3 available photos, which makes the early period uncertain. In the period after there are 4 photos and my registration of coordinates. Photos accepted for the timeseries are taken in the growth season, June through September. Since there was a lack of available data in the early part of the timeseries, two photos from May was included.
The data for water balance is based on measurements of out-flow this was done at 4 days in the period August - October, due to big variation and very low levels for 3 of the days, only measurements from September form basis for annual estimate. This is done so it can fit with annual inflow and seems plausible. The estimated water evapotranspirasjon is done by manually adjusting the level to correlate with the water inflow and precipitation data and measured water outflow in September.
The annual supply of nutrients from the catchment have been estimated from calculations made for Vestfold county in 2011. In the calculations, no degree of uncertainty is given. There is also a difference in coding for land use that gives a 5 % discrepancy in the total area. The category used by NIBO “other uncultivated area” (annen utmark) is included to the category forest, in the estimate for external loading. This will have minor impact on the total estimate. NVE also state that the data for the catchment area is generated, and not guaranteed to be accurate, and the land use in the generated catchment sums up to 90%.
The extent of submerged filamentous algae is unknown. Secchi-disk reading indicate that the algae cover substantial parts of the lake. A careful estimate of 50 % is chosen as basis for estimate.
Four of the points for water samples were in the lake and collected from a boat. It proved difficult to position the boat at the exact coordinates by the use of GPS coordinates. A difference of up to a few meters was accepted and is expected to be of minor importance.
The weather conditions in southern Norway in 2018 were significantly drier and hotter than normal (The Norwegian Meteorological Institute). This is likely to give higher nutrient levels and less water circulation than for a normal year.
9
3. Results
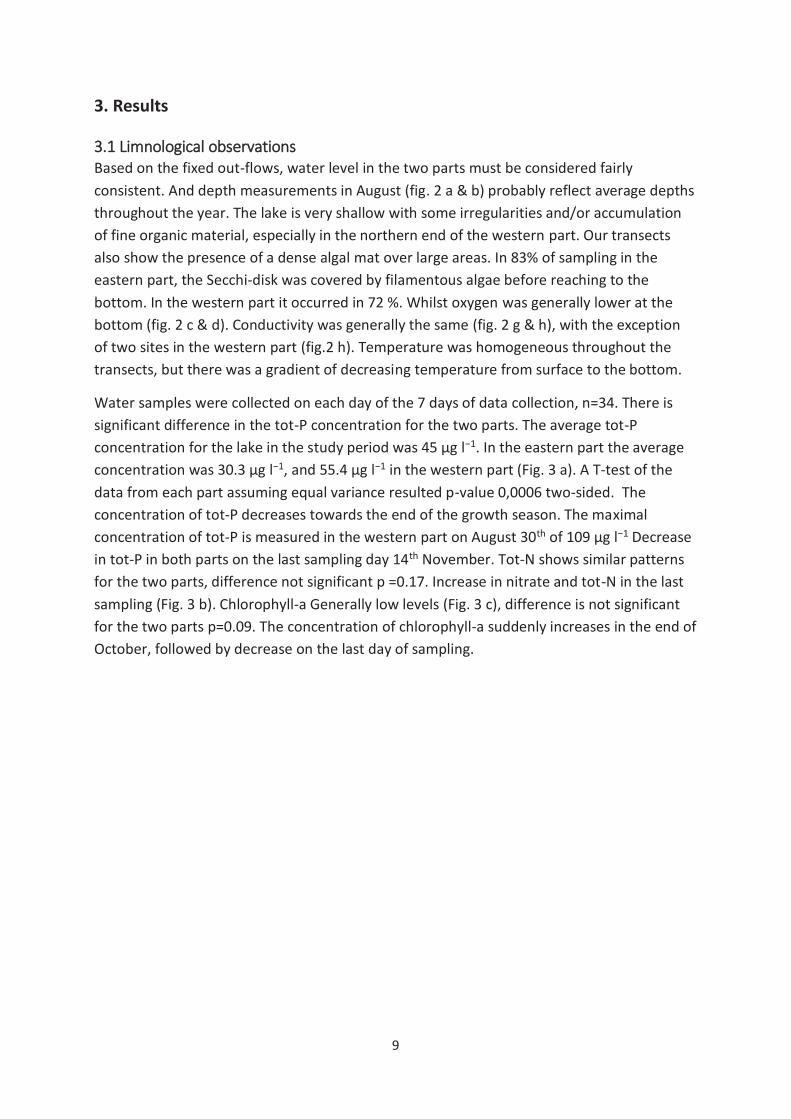
33.1 Limnological observations Based on the fixed out-flows, water level in the two parts must be considered fairly consistent. And depth measurements in August (fig. 2 a & b) probably reflect average depths throughout the year. The lake is very shallow with some irregularities and/or accumulation of fine organic material, especially in the northern end of the western part. Our transects also show the presence of a dense algal mat over large areas. In 83% of sampling in the eastern part, the Secchi-disk was covered by filamentous algae before reaching to the bottom. In the western part it occurred in 72 %. Whilst oxygen was generally lower at the bottom (fig. 2 c & d). Conductivity was generally the same (fig. 2 g & h), with the exception of two sites in the western part (fig.2 h). Temperature was homogeneous throughout the transects, but there was a gradient of decreasing temperature from surface to the bottom.
Water samples were collected on each day of the 7 days of data collection, n=34. There is significant difference in the tot-P concentration for the two parts. The average tot-P concentration for the lake in the study period was 45 μg l−1. In the eastern part the average concentration was 30.3 μg l−1, and 55.4 μg l−1 in the western part (Fig. 3 a). A T-test of the data from each part assuming equal variance resulted p-value 0,0006 two-sided. The concentration of tot-P decreases towards the end of the growth season. The maximal concentration of tot-P is measured in the western part on August 30th of 109 μg l−1 Decrease in tot-P in both parts on the last sampling day 14th November. Tot-N shows similar patterns for the two parts, difference not significant p =0.17. Increase in nitrate and tot-N in the last sampling (Fig. 3 b). Chlorophyll-a Generally low levels (Fig. 3 c), difference is not significant for the two parts p=0.09. The concentration of chlorophyll-a suddenly increases in the end of October, followed by decrease on the last day of sampling.

10
figure 2 data from transects sampled August 9th. presented with sampling distance from a line that seperates the the lake in two parts. a and b - Secchi-disk reading showing depth and top of filamentous algae in the two parts of the lake. c and d - concentration of dissolved oxygen mg O2 L-1. Measured at surface, 50 cm depth and at the bottom. e and f -temperature measured at surface, 50 cm depth and at the bottom. g and h - conductivity μS/cm measured at surface, 50 cm depth and at the bottom.
0.000.200.400.600.801.001.201.40
32 32 49 56 67
dept
h m
distance (m) from separating dam
east
0.00
0.20
0.40
0.60
0.80
1.00
1.2013 20 21 28 44 52 67 90 104 105 120
dept
h m
distance (m) from separating dam
west
Sechi disk reading sechi algae
0
5
10
15
0 50 100 150
mg
O2
L-1
Distance from seperating dam
Eastern part
0
5
10
15
0 50 100 150
mg O
2L-1
Distance from separating dam
western part
surface50 cmbottom
18
19
20
21
22
23
0 50 100 150
Tem
pera
ture
°C
distance (m) from separating dam
eastern part
18
19
20
21
22
23
0 50 100 150
Tem
pera
ture
°C
distance (m) from separating dam
western part
°C surface
°C 50 cm
°C bottom
100
150
200
250
300
350
400
0 50 100 150
cond
uctiv
ity μ
S/cm
distance (m) from separating dam
eastern part
100
150
200
250
300
350
400
0 50 100 150
cond
uctiv
ity μ
S/cm
Distance (m) from separating dam
western part
μS/cm surfaceμS/cm 50 cmμS/cm bottom
(a) (b)
(c) (d)
(e) (f)
(g) (h)

11
fig 3 a - concentration of total phosphorus μ/L. b - concentration of total nitrogen for both parts of the lake and nitrate from the western part μ/ L. c - concentration μ/ L of chlorophyll-a
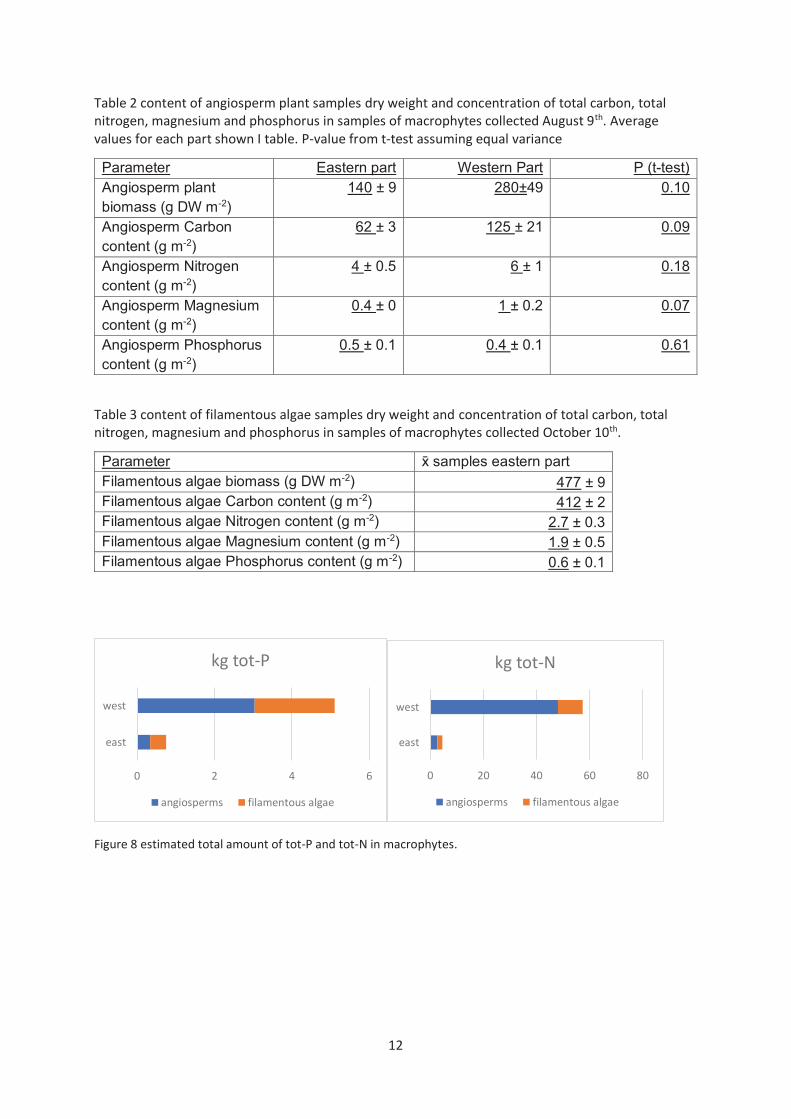
33.2 Vegetation samples The content of macrophytes samples show that filamentous algae has higher dry weight per m−2 than the aquatic plants (Table 2 and 3). This may reflect denser growth of the filamentous algae. The tot-P content is relatively high in the samples from filamentous algae, only one sample of the aquatic plants had the same or higher level. Tot-N concentration is higher in all samples from aquatic plants than in the filamentous algae. To estimate the total mass of tot-P and tot-N in the lake average sample values for aquatic plants for each part was multiplied by the measured extent in each part. For filamentous algae only samples from the eastern part was collected, and the average value serves as basis for estimate for both parts. The extent of filamentous algae is not certain. Measurements with Secchi-disk show that it was present in most of the sampling points 83 % in east and 72 % in west. The actual value is thereby likely to be higher than the conservative estimate that it covers about 50 % the area covered by aquatic plants. The estimated amount (Figure 4) of tot-P is 0.4 kg in filamentous algae and 0.3 kg in aquatic angiosperms in the eastern part. In The western part the estimated amount is 2 kg in filamentous algae and 3 kg in aquatic angiosperms. The estimated amount of tot-N in the eastern part is 1.9 kg in filamentous algae and 2.7 kg in angiosperms. The estimated tot-N amount in the western part is 9 kg in filamentous algae and 48 kg in aquatic angiosperms.
0
50
100
30/6/ 30/7/ 29/8/ 28/9/ 28/10/ 27/11/
tota
l P (
ug P
/L) West
east
0
1000
2000
3000
30/6/ 30/7/ 29/8/ 28/9/ 28/10/ 27/11/
tota
l N (
ug N
/L) West
East
W-nitrate
0
10
20
30
40
50
30/6/ 30/7/ 29/8/ 28/9/ 28/10/ 27/11/
chlo
roph
yll a
(ug/
L) WestEast
(a) (b)
(c)
12
Table 2 content of angiosperm plant samples dry weight and concentration of total carbon, total nitrogen, magnesium and phosphorus in samples of macrophytes collected August 9th. Average values for each part shown I table. P-value from t-test assuming equal variance
Parameter Eastern part Western Part P (t-test) Angiosperm plant biomass (g DW m-2)
140 ± 9 280±49 0.10
Angiosperm Carbon content (g m-2)
62 ± 3 125 ± 21 0.09
Angiosperm Nitrogen content (g m-2)
4 ± 0.5 6 ± 1 0.18
Angiosperm Magnesium content (g m-2)
0.4 ± 0 1 ± 0.2 0.07
Angiosperm Phosphorus content (g m-2)
0.5 ± 0.1 0.4 ± 0.1 0.61
Table 3 content of filamentous algae samples dry weight and concentration of total carbon, total nitrogen, magnesium and phosphorus in samples of macrophytes collected October 10th.
Parameter x̄ samples eastern part Filamentous algae biomass (g DW m-2) 477 ± 9 Filamentous algae Carbon content (g m-2) 412 ± 2 Filamentous algae Nitrogen content (g m-2) 2.7 ± 0.3 Filamentous algae Magnesium content (g m-2) 1.9 ± 0.5 Filamentous algae Phosphorus content (g m-2) 0.6 ± 0.1
Figure 8 estimated total amount of tot-P and tot-N in macrophytes.
0 2 4 6
east
west
kg tot-P
angiosperms filamentous algae
0 20 40 60 80
east
west
kg tot-N
angiosperms filamentous algae

13
33.3 Water balance Table 4 annual water balance Bugårdsdammen
m3 % in rainfall (on lake) (a) 51136 15 in (netto) inflow from catchment (percent x rain on catchment) (b)
292810 85
total in (c)
343946 100
out evapotranspiration (d) 30943 9 out through stream (e) 311040 90 total out (f) 341983 Difference - 1936 -0,57
(A - average annual precipitation in the period 2012 – 2018 from Sandefjord meteorological station scaled with lake surface. B – generate water inflow from the catchment area. C – sum yearly water supplied. D – estimated evapotranspiration. E- estimated yearly water outflow based on the measured outflow in September assuming water flow occurs for 6 months of the year. F - estimated total annual water balance).
The estimated water balance is based on generated data for the catchment and measurements from September. The results indicate that 90 % of precipitation is transported out by the stream in the southern outlet of the western part of the lake.
External nutrient loading
Table 5 land use in catchment area and estimated annual external loading of tot-P and tot-N.
Land use areal km−2 tot-P load kg tot N load Kg Forest 0.2 1.0 25.4 Agriculture 0.1 7.7 287.6 Urban 0.9 16.4 101.5 lake surface 0.1 0.8 18.1 Sum 1.1 25.9 432.7
The estimated annual external tot-P loading is 25.9 kg or 1,24 mg tot-P m−2d−1. For Tot-N the estimated annual loading is 432.7 kg or 20,68 mg tot/P m−2d−1.
3.5 Nutrient balance Table 6 Estimated nutrient balance calculated from estimated water transport out of the lake, average for both parts of the lake and high concentration from the western part of tot p and estimated nutrient load.
Tot-P balance average concentration
Tot-P balance max. concentration western part
inn kg 25.9 25.9 out kg 14.0 23.6 difference kg 11.9 2.3

14
The estimated nutrient balance indicates that there is a net retention of tot-P in the lake. The level of retention depends on which measured concentration is used. For the total average value, the retention is almost 12 kg. for the maximal measured concentration for a single sample day in the western part, the retention is 2.3 kg. The water samples were collected on 7 days in the period August – November, so it is possible higher concentration would be measured between the sampling points. This implies that the retention could be lower than 2.3 kg.
33.6 Timeseries
Figure 5 plant cover as percent of the total surface area of the two parts of the lake. Photos are taken in the growth period June through September, except for 1979 and 2003 which are both taken in May. Aquatic plants were harvested in 2012 (personal communication with Sandefjord kommune).
The available data indicates that the plant-cover was low in the early period (1959 – 2003), but due to limited data this is not certain. There is an increase in the western part after 2003 from 5 % to 20 % in the next data point from 2007. From 2007 to 2018 the plant cover increased by 1.6 % in the western part and 1.5 % in the eastern part. Within the last 11 years of the time series there was variation from 20 % to 31 % in the western part. From the maximal value of plant cover in 2011, there has been a decrease of 10.5 % to 2018. The difference in plant-cover for the two parts is significant P(T<=t) 0.0066. Values for the eastern part > 4 % throughout the time series.

15
4. Discussion
A set of research questions was formulated relating possible mass development of pondweed to the main potential underlying drivers. Based on scientific practise, a conservative null hypothesis should be the starting point. The null hypothesis is that pondweed has not expanded massively. This implies that plant cover increase may have been moderate, but also that there may have been a stand-still or a decline. This appears to be the case in Bugårdsdammen.
1. How is the variation in water chemistry through the growth season? what do the variables suggest about the status of the lake?
2. Is it possible to estimate external and internal P-load through water and nutrient balances and what can we learn from this about the conditions in Bugårdsdammen?
3. Has the plant cover increased in the past 50 years?
First will physical-chemical conditions be discussed, then water- and nutrient balances and the time series for plant-cover. The findings will be summarized with relation to possible management measures before a set of possible measures will be presented. Finally, the research questions will be answered.
44.1 Overall physio--chemical conditions Planned sediment sampling was unsuccessful, due to a lack of suitable soft sediment. This can reflect low levels of accumulation of organic material, or previous management measures, or possibly local sediment focusing within the water plant beds which were inaccessible for the corer. There are other factors which relates to sediment conditions that were successfully measured such as temperature, oxygen and conductivity.
The measurements of dissolved oxygen show no anoxic conditions, throughout the water column (fig. 2 c & d). This has major implications for internal P-loading. Phosphorus in sediments in shallow lakes is mostly bound to iron compounds that are sensitive to anoxic conditions. Redox reactions will release phosphorus when the compounds are reduced (Søndergaard et al. 2013). Iron-bound P can be a substantial storage of P in shallow lakes. According to Søndergaard (2013), the quantity of P in sediment is often more than 100 times the quantity in the water.
The supply of oxygen to the water in the deepest parts of shallow lakes is mostly governed by movement of oxygen rich water caused by wind (Scheffer 1998). Macrophytes both produce and consume oxygen, which can result in fluctuation with higher level in periods with light and lower levels in dark. Oxygen is also consumed by microbial organisms in decomposing processes, generally in the sediment. Often sediments become anoxic within a few millimetres. If sediment oxygen demand becomes too high, the water above the sediment also becomes anoxic, and dissolved P can exchange freely with the overlying water (Søndergaard et al. 2013).

16
The temperature measurements show that there little overall difference in the temperature in Bugårdsdammen >3 °C. there is a gradient from surface to bottom, where the temperatures are lower at the bottom (Fig. 2). Temperature affect internal loading both through mineralization rate and microbial activity. Higher temperature stimulates mineralization and allows greater biological activity, which both can result in higher release of phosphorus from the sediment (Jensen & Andersen 1992).
For most of the sampling points measured conductivity was similar for the surface and the bottom of the lake, except for two points in the western part, with much higher values at the bottom. Dissolved oxygen concentration is low for sampling points in the two areas, but other areas with average level of conductivity has lower concentration of dissolved oxygen. The two areas of high conductivity (station 11,12 & 16) are located outside the dense patches of pondweed. Other transect points outside the pondweed patches do not show high levels of conductivity.
Measurements with Secchi-disk of depth to the bottom and to the top of filamentous algae indicate that matts of filamentous algae covered substantial parts of the lake (Fig 2 a & b). In the eastern part there is difference in 83% of the measurements, and in 72 % in the western part. A conservative estimate of 50% cover by filamentous algae was used as basis for estimated nutrient content in both parts.
44.2 Water- and nutrient balances The estimated annual water balance (Table 4) is comparable to the values for the closest monitored stream, Istreelva (NVE). Minimal waterflow occurs for 6 summer months. The estimate for annual evaporation combined with data on precipitation makes the estimated annual discharge plausible. This is an important perquisite to arrive at a nutrient balance.
The nutrient content in the vegetation samples and the measured (pondweed) and estimated abundance (filamentous algae) indicates that the macrophytes in the lake store considerable amount of phosphorus and nitrogen (Fig. 4). The total amount of Tot-P in macrophytes is estimated to be 5 kg and 62 kg for tot-N.
4.3 Nutrient concentration and loading: potential for state shift? The estimated annual external load of tot-p is 25.9 kg or 1.24 mg tot-P m−2d−1. This seems plausible compared with two other lakes in southern Norway that are monitored by the Norwegian Institute for Water Research (NIVA). Vansjø had an annual load of tot-p 1.361 mg tot-P m−2d−1 in 2015-16 (Skarbøvik et al. 2017.) and Gjersjøen 1.761 mg tot-P m−2d−1 in 2015 (Haande et al. 2016).1
Janse et al. (2010) worked with a shallow lake model PClake and found the critical P-load for a macrophyte-dominated shallow lake to switch to a turbid algal-dominated state at 3 mg tot-P m−2d−1. Hilt et al. (2018) recalibrated critical loading of 1.3 mg tot-P m−2d−1 (Hilt et al. 2018). The difference arises from different processing of light- and temperature variables, 1 Area-specific loading calculated from P-loading data in the reports
17
where in the 2018 model light attenuation by phytoplankton and periphyton was included as well as phenology in macrophytes. According to the two different models Bugårdsdammen would be classified correctly as a macrophyte dominated lake, but there is a great difference in how close the lake is to the switching point. Since Hilt et al. (2018) uses a version of the same PClake, a precautionary approach would be to use this 1.3 mg tot-P m−2d−1 as the critical loading threshold.
The relationship of estimated external P-loading and concentration is similar to what Janse et al. (2010) report from modelling many shallow lakes. With macrophyte dominance, the concentration will be relatively lower than with phytoplankton dominance at the same loading level. This holds up to the critical loading point, where macrophytes are out competed by phytoplankton.
Similar results were found in shallow lakes in the boreal plains in Canada (Bayley et al. 2007). Abundance of submerged vegetation was a strong regulating factor for chlorophyll-a concentration at different concentrations of tot-P. Although weather conditions were the most important factor for state shift through. In lakes with minimal submerged vegetation, the switching point from clear to turbid was 50 μg/l, which is very close to the average concentration in Bugårdsdammen. In lakes with 25-75 % submerged vegetation cover, like Bugårdsdammen, the switch occurred at concentration of 100 μg/l. The relation between submerged vegetation and resistance to switch for the current concentration in Bugårdsdammen is a strong argument against removal of pondweed without combing removal with other measures. It is not straight forward to relate concentration to loading, and the latter are preferred when we want to understand what happens in a lake. Still the state of Bugårdsdammen confirms to both groups of literature.
The low level of nitrate throughout most of the growth season tells us that tot-N was not nitrate or ammonium during most of the growth season until November. When tot-P decreased chlorophyll a went down again and tot-N suddenly largely is nitrate. This is caused by denitrification from decomposition of organic material from ammonium to nitrate.
44.4 Time series of the extent of water plant beds The data indicates that there has been an increase in plant-cover after 2003 (Fig. 5). The increase has been from 5 to 21.6 % in the western part and from 1.7 to 3.2 % in the eastern part. The actual increase is probably lower since the data from 2003 is based on imagery from May, before maximal annual extent of plant-cover. In the past 11 years of the timeseries there has been a moderate increase of 1,6 % and 1,5 %, for the western and eastern part respectively. In 2012 aquatic plants were removed (Personal communication with Sandefjord Kommune). There was a moderate increase from 2011 to 2015, which is likely to be higher without the plant removal in 2012. The cause for the decrease from 2015 to 2018 is not known.

18
4.5 Synthesis and evaluation of possible measures The physic-chemical conditions in Bugårdsdammen indicates that there is potential for shift in state. The concentration of tot-P reached high values relative to the chlorophyll-a concentration, especially in the western part. The chlorophyll-a concentration remained low in both parts of the lake throughout the growth season for macrophytes. In the end of October there was an increase indicating that phytoplankton was taking advantage of the stored nutrients rapidly. The inverse relationship of chlorophyll-a and macrophyte biomass, is also found in many other shallow lakes. The chlorophyll-a concentration typically is high in spring, low in summer and again high in the end of growth season (Scheffer 1998). The explanation for the inverse relationship is probably a combination of mechanisms related to competition for nutrients and light and by interactions in the food web (Scheffer 1998).
The concentration of tot-P was low relative to the high estimated external loading. This is likely related to nutrient storage in macrophytes. This supported by the changes measured after the end of the growth season. Although macrophytes can also take up nutrients from the sediment, nutrients from the water may be stored in plant tissue (Malthus et al. 1990; Marion & Paillisson 2003).
The sampling of Secchi-disk transparency showed that filamentous algae is present in most of the sampling points. The filamentous algae is likely to reduce resuspension of sediment, allowing light to penetrate the water and reduce the potential for internal loading. The dense filamentous algae mat may also enhance internal release of P by reduction of circulation of oxygen-rich water and produce temporary anoxic sediment conditions that can lead to internal loading.
Reduction of external loading should be a top priority. Studies from the Netherlands and Denmark show that internal loading will continue after reduction of external loading (Søndergaard, Jeppesen, Scheffer 1998). Extended internal loading has implications of the sequence of management efforts. External loading reduction should be done early, while other measures should follow. A situation with still high nutrient concentration and removal of macrophytes may open a “window of opportunity” for phytoplankton dominance. As seen in lakes where macrophytes were lost due to extreme weather events (Scheffer 1998). Significant difference between tot-P concentration in east and west, indicates that it is higher external loading to the western part, and may explain the higher abundance of pondweeds in the western part.
The biggest estimated source of Tot-P in external loading comes from surface water from urban areas. Reduction in supply of surface water could help to reduce external loading to Bugårdsdammen. Flushing with nutrient poor water may also be effective in transporting phytoplankton and nutrients out of the lake (Scheffer 1998). The impact on nutrient concentration may be delayed due to increased internal loading caused by higher potential of diffusion to water with low P concentration (Søndergaard 2013). Vegetation can function

19
as filters of nutrients in the supplied water (Scheffer 1998). The external load is likely to be influenced by the numerous wild and tame birds in the area (Chichana et al. 2010). Small ducks, swans and coots were observed during sampling in the summer and autumn. Small ducks were most numerous and can daily excrete 69 mg tot-P per individual (Chichana et al. 2010). Birds were not counted, but a careful estimate would be more than 50 for most of the sampling days. That could lead to an additional Tot-P load of 0.06 mg tot-P m−2d−1 for the period that the birds are present. Restriction in feeding might contribute to a decrease in external tot-P loading.
The function of pondweed on nutrient concentration should be considered when deciding management measures. Macrophytes can take up nutrients from both sediment and water. Other macrophytes may have the same function as pondweed and be considered more as a positive aspect in the lake. Development of other macrophytes without or before removal of pondweed can lead to a decrease in nutrient concentration and may be considered before removal of pondweed.
Selective harvest at the end of growth season can reduce the amount of tot-P in the lake if the plant material is removed from the lake and immediate vicinity. Harvest of above-ground (sediment) biomass of pondweed will not permanently remove the plant from the lake, as indicated by previous removal. Because the plant reproduces vegetative by rhizomes protected in the sediment. This means that harvest could be repeated over a long time period and could result in removal of substantial amount of nutrients (Marion & Paillisson 2003.)
Reduction of crucian carp which is both planktivorous and benthivorous (Penttinen & Holopainen 1992), will reduce resuspension of sediment particles and thus reduce the internal loading of nutrients (Scheffer 1998). Reduced predation on zooplankton will give higher rates of grazing on phytoplankton through trophic cascades. In several studies, it is found that the composition of zooplankton is related to predatory pressure from fish (Anderson et al. 1978, Cazzanelli et al. 2008; Scheffer 1998,). Predation pressure is highest on bigger species such as daphnia, which are also the most effective phytoplankton grazers (Scheffer 1998). Pike can reduce the abundance of crucian carp, but the effect of predation may decrease over time, as cannibalism can reduce the number of smaller pike (Scheffer 1998). Crucian carp is also more resilient to anoxic conditions and low temperatures (Lappalien & Malien 2013) and may survive conditions that would remove other fish species from a lake. Removal of all fish and should be considered. The water supply to the lake comes from water pipe systems, so it is likely the only available access for fish is through movement up-stream. Up-stream movement could be reduced with physical barriers.
Water level adjustment could affect macrophyte composition and abundance. The optimal depth is different for macrophytes species and relates also to other factors such as light condition and wave action. In general, macrophyte growth is restricted to shallow water >2 m and optimal >1m (Scheffer 1998).
20
Dredging the sediments could reduce potential for internal loading by physical removal of the sediment that contains nutrients (Scheffer 1998). Dredging may lead to temporary increased resuspension and release of nutrients and may open a window of opportunity for phytoplankton if substantial parts of the macrophytes are removed with the sediment. Emptying the lake could make it easier to remove sediments, and colonialization by terrestrial plants may reduce future resuspension.
Physical barriers, like sheets, between the sediment and water could be used to keep parts of the lake free from plants. However, the effect will diminish over time as sediment builds up on top of the barriers and there is possibility of gasses to build up and remove barriers (Scheffer 1998.)
Information of the ecological function of macrophytes in shallow lakes might help to improve the perception of the lake. Signs explaining the concept of alternative stable states could contribute to a more positive perception of the situation in Bugårdsdammen. This might be especially valuable for a lake located close to educational facilities from kindergarten to high school level. This might also improve the general consciousness about nutrient pollution.
On may speculated that there has been changes in factors affecting the change in plant-cover. One plausible factor may relate to different use of the lake and thereby different intensity of management efforts. The lake was previously used for swimming with an out-door swimming pool (Rønningen & Ankersen 2016). To have a similar situation with clean water and lower plant-cover, it is likely that a combination of several measures is needed.
Following is a short summary of possible measures for reduced plant-cover.
21
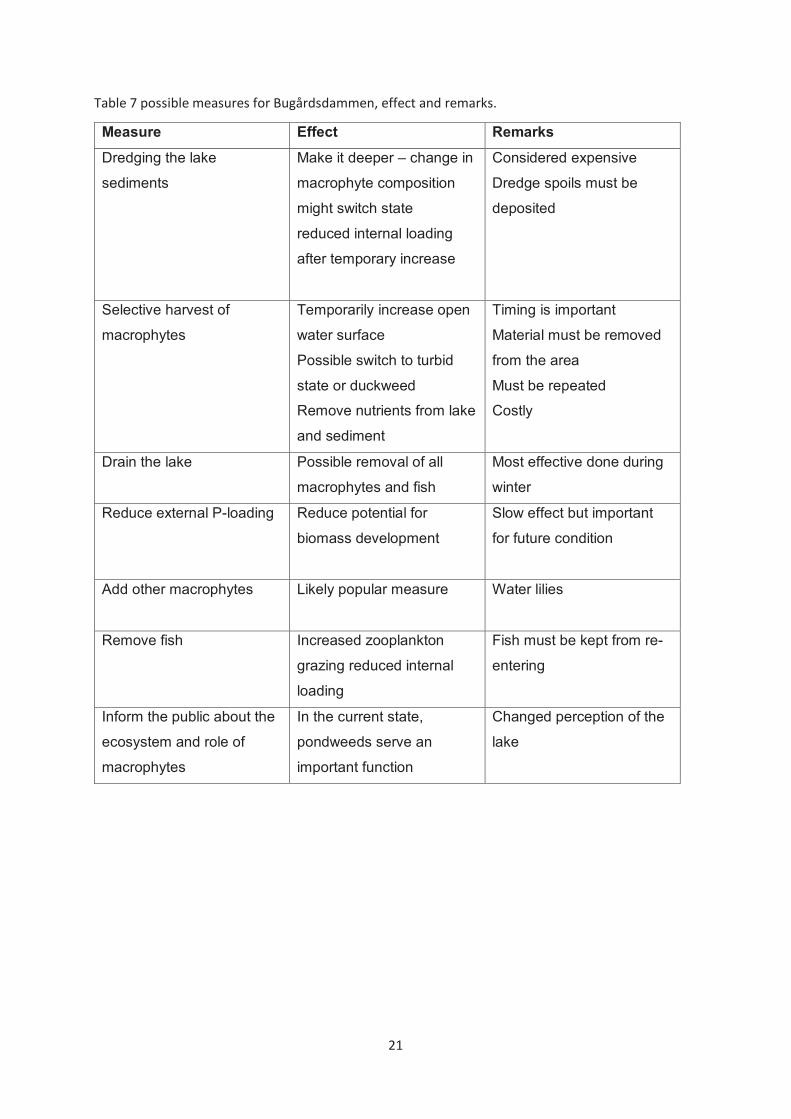
Table 7 possible measures for Bugårdsdammen, effect and remarks.
Measure Effect Remarks Dredging the lake
sediments
Make it deeper – change in
macrophyte composition
might switch state
reduced internal loading
after temporary increase
Considered expensive
Dredge spoils must be
deposited
Selective harvest of
macrophytes
Temporarily increase open
water surface
Possible switch to turbid
state or duckweed
Remove nutrients from lake
and sediment
Timing is important
Material must be removed
from the area
Must be repeated
Costly
Drain the lake Possible removal of all
macrophytes and fish
Most effective done during
winter
Reduce external P-loading
Reduce potential for
biomass development
Slow effect but important
for future condition
Add other macrophytes Likely popular measure
Water lilies
Remove fish Increased zooplankton
grazing reduced internal
loading
Fish must be kept from re-
entering
Inform the public about the
ecosystem and role of
macrophytes
In the current state,
pondweeds serve an
important function
Changed perception of the
lake

22
4.6 conclusions The variation in water chemistry in the growth season indicates that macrophytes plays a central role in keeping Bugårdsdammen in a clear-water state.
The external- and internal loading of nutrients has been estimated. The results indicate that Bugårdsdammen likely is close to the critical loading point, where it can switch to a turbid phytoplankton dominated state.
The third research question is answered. The plant cover in the lake has increased in the past 50 years.
Depending on the timescale used the null hypothesis can be considered strength by the data. The plant-cover has not expanded massively, at least not in the last decade. Although, on a longer timescale the increase has been more substantial.

23
5. Literature
Andersson, G., H. Berggren, G. Cronberg, C. Gelin, (1978). Effects of planktivorous and benthivorous fish on organisms and water chemistry in eutrophic lakes. Hydrobiologia 59: 9–15.
Bayley, S. Creed, I. Sass, G. Wong, A. (2007). Frequent regime shifts in trophic states in shallow lakes on the Boreal Plain: Alternative“unstable” states? Limnol. Oceanogr., 52, pp. 2002-2012
Cazzanelli, M., T. P. Warming & K. S. Christofferssen, (2008). Emergent and floating-leaved macrophytes as refuge for zooplankton in a eutrophic temperate lake without submerged vegetation. Hydrobiologia 605: 113–122.
Chaichana, R., Leah, R. & Moss, B. Hydrobiologia (2010) Birds as eutrophicating agents: a nutrient budget for a small lake in a protected area. 646: 111.
Dobson, M., & Frid, C. (2009). Ecology of aquatic systems. 2nd edition. New York, The united states: Oxford University Press.
Janse, J. H., De Senerpont Domis, L. N., Scheffer, M., Lijklema, L., Van Liere, L., Klinge, M., et al. (2008). Critical phosphorus loading of different types of shallow lakes and the consequences for management estimated with the ecosystem model PCLake. Limnologica 38, 203–219.
Janse, J. H., Scheffer, M., Lijklema, L., Van Liere, L., Sloot, J. S., and Mooij, W. M. (2010). Estimating the critical phosphorus loading of shallow lakes with the ecosystem model PCLake: sensitivity, calibration and uncertainty. Ecol. Model. 221, 654–665.
Jensen, H. S. & F. Ø. Andersen, (1992). Importance of temperature, nitrate, and pH for phosphate release from aerobic sediments of four shallow, eutrophic lakes. Limnol. Oceanogr. 37: 577–589.
Jeppesen E., Søndergaard M., Meerhoff M., Lauridsen T.L., Jensen J.P. (2007) Shallow lake restoration by nutrient loading reduction—some recent findings and challenges ahead. In: Gulati R.D., Lammens E., De Pauw N., Van Donk E. (eds) Shallow Lakes in a Changing World. Developments in Hydrobiology, vol 196. Springer, Dordrecht
Haande, S. Hostyeva V. Segtnan Skogan, O. (2016). Overvåking av Gjersjøen og Kolbotnvannet med tilløpsbekker 1972-2015. Med vekt på resultater fra 2015. rapport L.NR. 7026-2016
Hilt, S, Alirangues Nuñez, MM, Bakker, ES, Blindow, I, Davidson, TA, Gillefalk, M, Hansson, L-A, Janse, JH, Janssen, ABG, Jeppesen, E, Kabus, T, Kelly, A, Köhler, J, Lauridsen, TL, Mooij, WM, Noordhuis, R, Phillips, G, Rücker, J, Schuster, H-H, Søndergaard, M, Teurlincx, S, van de Weyer, K, van Donk, E, Waterstraat, A, Willby, NJ & Sayer, CD (2018). 'Response of Submerged Macrophyte Communities to External and Internal Restoration Measures in North Temperate Shallow Lakes' Frontiers in Plant Science, vol. 9, 194.
Lappalainen, J, Vinni, M, Malinen, T. (2013). Consumption of crucian carp (Carassius carassius L., 1758) by restocked pike (Esox lucius L., 1758) in a lake with frequent winter hypoxia. Journal of Applied Ichthyology 29: 1286– 1291.

24
Malthus, T. J., Best, E. P. H., Dekker, A. G. (1990). An assessment of the importance of emergent and floating leaved macrophytes to trophic status in the Loosdrecht Lakes (The Netherlands) Hydrobiologia191257263
Marion L, Paillisson J-M (2002). A mass balance assessment of the contribution of floating-leaved macrophytes in nutrient stocks in an eutrophic macrophyte-dominated lake. Aquat Bot 75:249–260
Nelson DW, Sommers LE (1996). Total carbon, organic carbon, and organic matter. In: Sparks DL, Page AL, Helmke PA, Loeppert RH (eds) Methods of soil analysis part 3—chemical methods, SSSA Book Series, vol 5.3. Soil Science Society of America, American Society of Agronomy, Madison, pp 961–1010.
Oredalen, T.J. & Aas, W. (2000). Vurdering av atmosfærisk fosforavsetning i sørøst-Norge. Norsk Institutt for Vannforskning.
Penttinen OP., Holopainen I.J. (1992). Seasonal feeding activity and ontogenetic dietary shifts in crucian carp, Carassius carassius. In: Wieser W., Schiemer F., Goldschmidt A., Kotrschal K. (eds) Environmental biology of European cyprinids. Developments in environmental biology of fishes, vol 13. Springer, Dordrecht
Phillips, G. L., Willby, N., and Moss, B. (2016). Submerged macrophyte decline in shallow lakes: what have we learnt in the last forty years? Aquat. Bot. 135, 37–45.
Rønningen, P. Ankersen, V. (2016). Bugårdsparken - status og videre utvikling.
Scheffer, M. (1998). Ecology of Shallow Lakes. 1st edition. Great Brittan. Chapman & Hall.
Skarbøvik, E. Strand,D. Bechmann, M. Skjelbred, B. & Haane, S. (2017). Overvåking Morsa 2015-2016 Resultater fra overvåking av innsjøer, elver og bekker i perioden 1. november 2015–31. oktober 2016. NIVA rapport vol 3, NR 38.
Søndergaard, M., Jensen, J.P. & Jeppesen, E. Hydrobiologia (2003). Role of sediment and internal loading of phosphorus in shallow lakes 506: 135.
Søndergaard, M., Bjerring, R., and Jeppesen, E. (2013). Persistent internal phosphorus loading in shallow eutrophic lakes. Hydrobiologia 710, 95–107.
Smith, J. (2012). Forurensingregnskap for Vestfold 2011. Ask rådgivning. Oslo.
Vermaat, J. Santamaría, L. Roos, P. (2000). Water flow across and sediment trapping in submerged beds of contrasting growth form Arch. Hydrobiol., 148 pp. 549-562

SALT
FORT
YNNI
NGSM
ETO
DEN
- et e
ksem
pel p
å en
kel b
ruk
i fel
t Jf
fore
lesn
inge
n om
em
net t
idlig
ere
i kur
set
Stål
e Ha
alan
d - F
eltm
etod
e ba
sert
på
stan
dard
ene
ISO
9555
-1 (1
994)
og
ISO
9555
-3 (1
992)
Met
oden
ben
ytte
r seg
av
at e
n gi
tt m
asse
salt
(m),
som
tilse
ttes e
n be
kk m
ed k
onst
ant v
annf
ørin
g (Q
), lø
ses o
pp (f
orty
nnes
) i e
t viss
t vol
um (V
) til
en v
iss k
onse
ntra
sjon
(C).
m [g
] = V
[L] ·
C [g
/L] =
Q [L
/s] ·
t [s
] · C
[g/L
] (id
eel b
ekk
med
kon
stan
t van
nfør
ing
og sa
ltkon
sent
rasjo
n)Vi
ben
ytte
r oss
av
natr
ium
klor
id (N
aCl;
dvs v
anlig
hav
salt,
bor
dsal
t som
vi f
år k
jøpt
i bu
tikke
n). T
ørr f
orm
, vei
es in
n og
hiv
es u
t i b
ekk.
Saltk
onse
ntra
sjone
n m
åles
et s
tykk
e ne
dstr
øms u
tslip
pet a
v sa
lt et
ter g
od in
nbla
ndin
g.
Salte
t kom
mer
som
en
puls
nedo
ver b
ekke
n m
ed g
radv
is st
igen
de k
onse
ntra
sjon,
for s
å å
avta
(se
figur
1).
Å m
åle
C [L
/s] f
or N
aCl i
felt
er v
ansk
elig
, men
vi k
an (e
nkel
t og
robu
st) b
ereg
ne C
[L/s
] ind
irekt
e ve
d å
mål
e Na
Cl si
tt bi
drag
til e
ndrin
g av
van
nets
ele
ktris
ke le
dnin
gsev
ne (K
salt)
. Sa
mm
enhe
ngen
mel
lom
C o
g K
er li
neæ
r (C
= k
· Ksa
lt; se
figu
r 2),
men
avh
enge
r av
tem
pera
tur (
se ta
bell
1).
Fra
dett
e: Q
= m
/(k
·are
al u
nder
kur
ven)
Omre
gnin
gsfa
ktor
en k
kan
ber
egne
s i fe
lt el
ler t
eore
tisk.
-
Felt:
Fin
ner k
ved
å re
kons
true
re k
urve
n i f
igur
2, v
ed å
tilse
tte sa
lt (i
bøtte
r) til
gitt
e ko
nsen
tras
jone
r i k
jent
e vo
lum
og
mål
er K
. -
Teor
etisk
: Vet
NaC
l sin
spes
ifikk
e le
dnin
gsev
ne. D
en e
r på
ca 1
00 0
00 (u
S/cm
) / (m
ol/L
) ved
15°
C. N
aCl h
ar m
olek
ylve
kt 5
8,4
g/m
ol. F
ra d
et fi
nner
vi a
t 1 g
/L N
aCl g
ir 17
10 u
S/cm
.
Vid
ere
vet v
i at k
= C
/K. F
ra d
et fi
nner
vi a
t et k
= 1
[g/L
] / 1
710
[uS/
cm] =
0,5
84 ·
10-3
[(g/
L)/(
uS/c
m)].
k ju
ster
es så
for k
orre
kt te
mpe
ratu
r i fe
lt (jf
tabe
ll 1)
M
rk: M
ålt k
kan
avv
ike
noe
ifra
teor
etisk
ber
egne
t k, e
vt v
ia a
dsor
psjo
n av
salti
oner
til p
artik
ler,
ol. V
ann
med
lite
susp
ende
rt st
off g
ir tr
olig
bes
t ove
rste
mm
else
.
Ekse
mpe
l: jf
figur
1.
m =
258
,4 g
ram
NaC
l som
tilse
ttes b
ekke
nDe
t er m
ange
måt
er å
ber
egne
are
alet
und
er k
urve
n på
, ink
l int
egre
ring
av k
urve
, sum
av
stol
pear
eal,
osv.
Eks
empe
l med
trek
ante
r er v
ist.
k =
0,58
4 · 1
0-3 [(
g/L)
/(uS
/cm
)] ve
d 15
°CQ
= 2
58,4
/ (0
,584
· 10
-3 ·
2250
) [L/
s] =
196
[L/s
]
tid [s
]Kt
otKs
alt
3116
80
3316
80
3516
80
3016
80
4516
91
6018
719
6519
527
7020
537
7521
042
9020
537
9520
032
100
195
2710
519
325
120
184
1613
517
911
150
172
417
517
02
200
168
0
-Fin
og
enke
l met
ode,
rela
tivt n
øyak
tig o
g eg
net i
små
bekk
er.
-Tem
pera
tura
vhen
gig
mht
spes
ifikk
ledn
ings
evne
.-I
kke
avhe
ngig
av
gode
pro
filer
, men
av
god
innb
land
ing
(her
: vi m
åler
ned
enfo
ret l
ite fo
ssef
all).
-Rep
etisj
on ø
ker p
resis
jon!
∫−
bere
gnes
til 2
250
[(uS/
cm) ·
(s)]
Figu
r1Fi
gur2
-På
baks
iden
av
arke
t er v
annf
ørin
gsku
rven
for Å
rung
selv
a ve
dlag
t. Ku
rven
vise
r sam
men
heng
en
mel
lom
van
nhøy
den
(H [c
m])
nær u
tløpe
t og
vann
førin
gen
(Q [L
/s]).
Vi
kan
alts
å le
se a
v va
nnhø
yden
når
vi e
r ute
og
mål
er v
annf
ørin
gen
i Åru
ngse
lva,
for å
kon
trol
lere
at v
i ha
r mål
t rik
tig.
Tabe
ll 1
C
Kk
1
k er
om
regn
ings
fakt
or m
ello
m
kons
entr
asjo
n av
et s
alt (
her:
NaCl
) og
ledn
ings
evne
n. S
amm
enhe
ngen
er
line
ær,
C =
k · K
,men
den
er
tem
pera
tura
vhen
gig
(jf ta
bell
1)
°Ck
51,
346
1,30
71,
268
1,22
91,
1810
1,15
111,
1212
1,09
131,
0614
1,03
151,
0016
0,98
170,
9518
0,94
190,
9120
0,89
210,
8722
0,85
230,
8324
0,82
250,
80
051015202530354045
010
2030
4050
6070
8090
100
110
120
130
140
150
160
170
180
190
200
Ledningsevne fra tilsatt NaCl (μS/cm)
Tid
(sek
unde
r)
Area
let k
an fi
nnes
via
en
sum
av
søyl
er ∑
(∆Ti
d*∆L
edni
ngse
vne)
, evt
via
en
funk
sjon
for e
n til
pass
et k
urve
og
inte
grer
ing
av d
enne
. 'H
er: A
real
via
en
sum
av
trek
anta
real
er.
Mål
t led
ning
sevn
e (μ
S/cm
)
Kjap
t(fe
lt)es
timat
av
area
l: (3
0*42
/2 +
73*
42/2
+ ci
rka
45*4
/2) (
μS/c
m)*
sek


1) V
erdi
en e
r edi
tert
1085
Feltp
aram
eter
e
Are
al (A
)Ef
fekt
iv sj
ø (S
)
Elve
leng
de (E
)El
vegr
adie
nt (E
)
Feltl
engd
e(F
)H H H H H H H H H H H B
reD
yrke
t mar
kM
yrSj
øSk
ogSn
aufje
llU
rban
eff
1085
L
min
10 20 30 50 60 70 80 90 max
4,5
0,3
0,0
2,0 41 44 51 55 59 60 62 64 66 73 83 0,0
5,1
0,0
4,6
13,0 0,0
68,0
km²
% km m/k
mm
/km
km moh
.m
oh.
moh
.m
oh.
moh
.m
oh.
moh
.
moh
.m
oh.
moh
.% % % % % % %
Lavvannskart
40
Vas
sdra
g:
Vas
sdra
gsnr
.:K
omm
une:
Fylk
e:Is
treel
va
015.
2ZSa
ndef
jord
Ves
tfold
1,0
Van
nfør
ings
inde
ks, s
e m
erkn
ader
Mid
delv
annf
ørin
g (6
1-90
)A
lmin
nelig
lavv
annf
ørin
g5-
pers
entil
(hel
e år
et)
5-pe
rsen
til (1
/5-3
0/9)
5-pe
rsen
til (1
/10-
30/4
)
16,8 1,1
1,1
0,4
3,0
l/(s*
km²)
l/(s*
km²)
l/(s*
km²)
l/(s*
km²)
l/(s*
km²)
Klim
a
Klim
areg
ion
Års
nedb
ørSo
mm
erne
dbør
Vin
tern
edbø
rÅ
rste
mpe
ratu
rSo
mm
erte
mpe
ratu
rV
inte
rtem
pera
tur
Tem
pera
tur J
uli
Tem
pera
tur A
ugus
t
Det
er g
ener
elt s
tor u
sikk
erhe
t i b
ereg
ning
er a
v la
vvan
nsin
deks
er. R
esul
tate
ne
bør v
erifi
sere
s m
ot e
gne
obse
rvas
jone
r elle
r sam
men
lignb
are
mål
esta
sjon
er.
Ost
1,4
I ned
børfe
lt m
ed h
øy b
repr
osen
t elle
r sto
r inn
sjøp
rose
nt v
il tø
rrvæ
rsav
renn
ing
(bas
eflo
w) h
a st
ore
bidr
ag fr
a di
sse
lagr
ings
mag
asin
ene.
Bas
e flo
w6,
40,
4B
FIl/(
s*km
²)
Ned
børfe
ltgre
nser
, fel
tpar
amet
ere
og v
annf
ørin
gsin
deks
er e
r aut
omat
isk
gene
rert
og
kan
inne
hold
e fe
il. R
esul
tate
ne m
å kv
alite
tssi
kres
.Kartb
akgr
unn:
EUR
EF89
WG
S84
Kartd
atum
:
Stat
ens
Kartv
erk
Proj
eksj
on:
UTM
33N
6,3
16,1
mm
833
460
mm
mm
°C °C
13,5
°C
15,3
°C
373
1,1
°C
G
L
Elve
grad
ient
(G
)
moh
.
© n
evin
a.nv
e.no

Det
påg
ar fo
rtsa
tt fo
rskn
ing
for å
bes
tem
me
klim
apås
lag
for m
omen
tanf
lom
mer
i sm
å ne
dbør
felt.
Fre
m ti
l re
sulta
tene
fra
diss
e pr
osje
kten
e fo
relig
ger a
nbef
ales
et
klim
apås
lag
på 1
.2 fo
r døg
nmid
delfl
om o
g 1.
4 fo
r ku
lmin
asjo
nsflo
m i
små
nedb
ørfe
lt.
Area
l (km
²)
1,26Q
QQQ
Q QQ
Vestfo
ld
015.2Z
Istreelva
Sandefjord
Flom
beregning
Vassdragsnr.:
Kom
mune:
Fylke:
Vassdrag:
Flom
frekv
ensf
akto
rer
Q
Kulm
inas
jons
vann
førin
g:97
,5 p
erse
ntil(
m3/
s)
Kulm
inas
jons
vann
førin
g (m
3/s)
Kulm
inas
jons
vann
førin
g: 2
,5 p
erse
ntil
(m3/
s)
Klim
apås
lag
(kul
min
asjo
n, 2
0 pr
osen
t)
--
1,26
1,52
1,81
2,24
2,62
3,07
M10
3,07
-
2,6
Flom
mer
med
klim
apås
lag
(m³/s
)
2,62 2,2
Flom
verd
ier (
m³/s
)
0,6
95%
inte
rval
l øvr
e gr
ense
(m³/s
)
95%
inte
rval
l ned
re g
rens
e (m
³/s)
1,81
1,3
1,26
-Fl
omfre
kven
sfak
tore
r1,
522,
24
0,8
0,5
0,3
0,5
0,6
0,3
0,6
173
1,4
0,4
1,2
0,2
307
0,9
1,8
1,1
Istreelva
Klim
afak
tor
-2,
62
95%
inte
rval
l ned
re g
rens
e (m
³/s)
Flom
verd
ier (
m³/s
)
95%
inte
rval
l øvr
e gr
ense
(m³/s
)
Flom
frekv
ensf
akto
rer
95%
inte
rval
l ned
re g
rens
e (m
³/s)
Flom
verd
ier (
m³/s
)
95%
inte
rval
l øvr
e gr
ense
(m³/s
)
Flom
frekv
ensf
akto
rer
95%
inte
rval
l ned
re g
rens
e (m
³/s)
Flom
mer
med
klim
apås
lag
(m³/s
)
Flom
verd
ier (
m³/s
)
95%
inte
rval
l øvr
e gr
ense
(m³/s
)
Flom
frekv
ensf
akto
rer
2,24
2,62
--
1,26
1,52
0,4
1,81
542,
61,
00,
7
m3/s
l/(s*km
²)
1,81
Ber
egni
ngen
e er
aut
omat
isk
gene
rert
og k
an in
neho
lde
feil.
Det
er g
ener
elt s
tor u
sikk
erhe
t i d
enne
type
n be
regn
inge
r. R
esul
tate
ne m
å ve
rifis
eres
mot
egn
e ob
serv
asjo
ner e
ller s
amm
enlig
nbar
e m
åles
tasj
oner
. Res
ulta
tene
er i
kke
gyld
ig so
m g
runn
lag
til fl
ombe
regn
inge
r for
kla
ssifi
serte
dam
mer
.
200
5010
100
520
1,37 1,4
Istreelva
0,6
429,
20,
50,
91,
11,
31,
51,
8
Flom
verd
iene
vis
er st
ørre
lsen
på
kulm
inas
jons
flom
mer
for
ulik
e gj
enta
ksin
terv
all.
De
er b
ereg
net v
ed b
ruk
av e
t fo
rmel
verk
som
er u
tarb
eide
t for
ned
børf
elt u
nder
ca
50
km2.
Fel
tpar
amet
ere
som
inng
år i
form
elve
rket
er a
real
, ef
fekt
iv sj
øpro
sent
og
norm
alav
renn
ing
(l/s*
km²).
For
mer
ut
dype
nde
besk
rive
lse
av fo
rmel
verk
et h
envi
ses d
et ti
l NVE
–R
appo
rt 7
/201
5 «V
eile
der f
or fl
ombe
regn
inge
r i sm
å ur
egul
erte
felt»
. Det
påg
ar fo
rtsa
tt fo
rskn
ing
for å
© n
evin
a.nv
e.no

Annex 3- Pigment analysis The samples were filtered through 45 mm GF/C glass fiber filters, which were then placed in 15 ml plastic tubes to be stored air-tight and dark at -21 . Pigments were extracted from freshly lyophilized filters by adding 3 ml acetone containing 0.5 μg ml-1 internal standard (apocarotenal reference standard, Sigma-Aldrich, Oslo, Norway) to each filter and by keeping the samples at 4 overnight. The extracts were centrifuged at 2000 x g for 10 minutes to remove particles. Pigment analysis was done by HPLC immediately after extraction to avoid post-extraction derivatization. The instrumental setup included a Thermo Fisher Ultimate 3000 UHPLC RS system equipped with diode array detector and an Acclaim C30 LC column (150 x 2.1 mm, 3 μm particle size). The entire hardware was supplied by Nerliens Meszansky AS (Oslo, Norway). Pigment separation and identification followed the method described by Wright and coworkers [23], except for the flow rate of the HPLC pump that had to be reduced to 0.5 ml min-1 to match the specifications of the C30 LC column. Pigments were quantified using a pre-determined calibration factor between the internal standard and a commercial chlorophyll a standard (DHI LAB products, Hørsholm, Denmark).

