buffalo and fort erie public bridge … pba fs final.pdf · public bridge authority financial...
TRANSCRIPT

BUFFALO AND FORT ERIEPUBLIC BRIDGE AUTHORITY
FINANCIAL STATEMENTS
December 31, 2015

BUFFALO AND FORT ERIE PUBLIC BRIDGE AUTHORITY
Table of Contents
December 31, 2015
Independent Auditors’ Report
Management’s Discussion and Analysis
Financial Statements
Balance SheetStatement of Revenues, Expenses, and Changes in Net PositionStatement of Cash Flows
Notes to Financial Statements
Required Supplementary Information (Unaudited)
Schedule of Funding Progress Postemployment Benefit PlansSchedules of Changes in the Authority’s Net Pension Asset and Related RatiosSchedule of Canadian Plan ContributionsSchedule of U.S. Plan Contributions

INDEPENDENT AUDITORS’ REPORT
The Board of DirectorsBuffalo and Fort Erie Public Bridge Authority
We have audited the accompanying financial statements of Buffalo and Fort Erie Public Bridge Authority (the Authority), a business-type activity, as of and for the year ended December 31, 2015, and the related notes to the financial statements, which collectively comprise the Authority’s basic financial statements as listed in the table of contents.
Management’s Responsibility for the Financial Statements
Management is responsible for the preparation and fair presentation of these financial statements in accordance with accounting principles generally accepted in the United States of America; this includes the design, implementation, and maintenance of internal control relevant to the preparation and fair presentation of financial statements that are free from material misstatement, whether due to fraud or error.
Auditors’ Responsibility
Our responsibility is to express an opinion on these financial statements based on our audit. We conducted our audit in accordance with auditing standards generally accepted in the United States of America. Those standards require that we plan and perform the audit to obtain reasonable assurance about whether the financial statements are free from material misstatement.
An audit involves performing procedures to obtain audit evidence about the amounts and disclosures in the financial statements. The procedures selected depend on the auditors’ judgment, including the assessment of the risks of material misstatement of the financial statements, whether due to fraud or error. In making those risk assessments, the auditor considers internal control relevant to the entity’s preparation and fair presentation of the financial statements in order to design audit procedures that are appropriate in the circumstances, but not for the purpose of expressing an opinion on the effectiveness of the entity’s internal control. Accordingly, we express no such opinion. An audit also includes evaluating the appropriateness of accounting policies used and the reasonableness of significant accounting estimates made by management, as well as evaluating the overall presentation of the financial statements.
We believe that the audit evidence we have obtained is sufficient and appropriate to provide a basis for our audit opinion.
Opinion
In our opinion, the financial statements referred to above present fairly, in all material respects, the financial position of the Authority as of December 31, 2015, and the changes in its financial position and its cash flows for the year then ended in accordance with accounting principles generally accepted in the United States of America.
Cyclorama Building | 369 Franklin Street | Buffalo, New York 14202
716-856-3300 | Fax 716-856-2524 | www.LumsdenCPA.com

2
Other Matters
Change in Accounting Principle
As described in Note 2 to the financial statements, the Authority adopted GASB Statement No. 68, Accounting and Financial Reporting for Pensions and GASB Statement No. 71, Pension Transition for Contributions Made Subsequent to the Measurement Date. Our opinion is not modified with respect to this item.
Required Supplementary Information
Accounting principles generally accepted in the United States of America require that management’s discussion and analysis and other required supplementary information, as listed in the table of contents, be presented to supplement the financial statements. Such information, although not a part of the basic financial statements, is required by the Government Accounting Standards Board who considers it to be an essential part of financial reporting for placing the financial statements in an appropriate operational, economic, or historical context. We have applied certain limited procedures to the required supplementary information in accordance with auditing standards generally accepted in the United States of America, which consisted of inquiries of management about the methods of preparing the information and comparing the information for consistency with management’s responses to our inquiries, the financial statements, and other knowledge we obtained during our audit of the financial statements. We do not express an opinion or provide any assurance on the information because the limited procedures do not provide us with sufficient evidence to express an opinion or provide any assurance.
February 26, 2016

i
Buffalo and Fort Erie Public Bridge AuthorityManagement’s Discussion and Analysis
December 31, 2015 and 2014(Unaudited)
The management of the Buffalo and Fort Erie Public Bridge Authority (hereinafter referred to as the Authority) offers the following overview and analysis of the Authority’s financial activities as of and for the years ended December 31, 2015 and 2014, which should be read in conjunction with the Authority’s financial statements and notes to the financial statements.
OVERVIEW OF THE FINANCIAL STATEMENTS
This discussion and analysis is intended to serve as an introduction to the Authority’s financial statements. It begins by presenting and explaining the financial statements. These statements have been prepared according to accounting principles generally accepted in the United States of America (GAAP). Revenues and expenses are recorded using the accrual basis of accounting, meaning that they are recorded and recognized by the Authority as earned/incurred, regardless of when cash is received or paid.
Effective January 1, 2015, the Authority adopted GASB Statement No. 68, Accounting and Financial Reporting for Pensions (GASB 68) and GASB Statement No. 71, Pension Transition for Contributions Made Subsequent to the Measurement Date. These statements require the Authority to include in its statement of net position its net pension asset, deferred outflows and deferred inflows of resources for the pension provided to Authority employees and administered by the Authority. The cumulative effect on the current statements is an increase in beginning of year net position totaling $3,903,000 as detailed in Note 2 to the financial statements.
The balance sheets present information on all of the Authority’s assets, deferred outflows of resources,liabilities, and deferred inflows of resources with the difference reported as net position. Increases or decreases in net position serve as a relative indicator as to whether the Authority’s financial position is strengthening or weakening over time.
The statements of revenues, expenses, and changes in net position show the results of the Authority’s operations during the year and reflect both operating and non-operating activities. Changes in net positionreflect the operational impact of the current year’s activities on the financial position of the Authority.
The statements of cash flows provide an analysis of the sources and uses of cash. The cash flow statementsshow net cash provided or used in operating, capital and related financing, and investing activities.
The notes to the financial statements include additional information needed to provide a further understanding of the financial statements.

ii
FINANCIAL STATEMENT ANALYSIS
Comparative Balance Sheets as of December 31:
U.S. $, in thousands
2015 2014
96,930$ 101,972$
10,229 11,055
Net pension asset 5,430 -
139,457 128,680
252,046 241,707
Deferred outflows of resources
Defeasance loss 582 695
Deferred outflows of resources from pensions 800 -
1,382 695
Total assets and deferred outflows of resources 253,428$ 242,402$
9,264$ 9,259$
36,257 38,397
45,521 47,656
Deferred inflows of resources
Deferred inflows of resources from pensions 722 -
105,869 92,710
Restricted 10,029 10,855
91,287 91,181
207,185 194,746
253,428$ 242,402$
Assets
Current assets
Restricted assets
Capital assets, net
Total assets
Liabilities and net position
Total deferred outflows
Current liabilities
Unrestricted
Total net position
Total liabilities, deferred inflows and net position
Noncurrent liabilities
Total liabilities
Net position
Net investment in capital assets
As noted earlier, net position serves as an indicator of the Authority’s overall financial strength. The Authority’s net position increased by approximately $12 million during 2015 and $10 million during 2014 as a result of operating income earned through all Authority activities and the $3.9 million cumulative effect adjustment related to the adoption of GASB 68. As required by the Authority’s bond indenture, the restricted portion of net position is reserved for debt service, governmental payments, and operating reserves. Restricted amounts fluctuate based upon required debt service and operating reserve requirements. Substantially all unrestricted net position has been designated by the Board of Directors for acquisition or construction of capital projects and/or major repairs and replacements.

iii
Statements of Revenues, Expenses, and Changes in Net Position for the years ended December 31:
U.S. $, in thousands2015 2014
21,441$ 22,177$
7,643 9,126
29,084 31,303
3,087 3,411
5,899 5,075
3,034 2,750
224 487
Other postemployment benefits 1,656 1,681
1,115 1,169
4,899 4,980
19,914 19,553
9,170 11,750
188 178
(774) (1,053)
(90) (64)
Bond issuance costs - (424)
Other 42 -
(634) (1,363)
Change in net position 8,536 10,387
Net position, beginning of year 194,746 184,359
Restatement - GASB 68 3,903 -
207,185$ 194,746$
Operating revenues
Toll revenues
Operating expenses
Maintenance of bridge, building, plazas & equip.
Other revenues
Total operating revenues
Toll collection and traffic control
Administration
Operating income
Total operating expenses
Non-operating revenues (expenses)
Interest expense
Net position, end of year
Currency remeasurement
Total non-operating net expense
Interest income
Other expenses
Pension
Depreciation
As a bi-national toll bridge operator, the Authority earns revenue and incurs expenses in both U.S. and Canadian dollars. All Canadian revenue and expenses are converted to U.S. dollars at the average rate of exchange for the year. In 2015, the weakening of the Canadian dollar continued the trend that started in 2013, resulting in a decrease in the remeasured value of both the revenue earned and expenses incurred in Canadian dollars.
Toll revenues decreased slightly during 2015 due to a 4% and 2% decline in passenger and commercialcrossings, respectively. Toll rates remained unchanged. Other revenues, consisting primarily of rental income, were impacted by a decrease in rental income from duty-free operators during 2015.

iv
Operating expenses for 2015 increased by $361,000 or 1.8%. This increase was primarily the result of an increase in plaza maintenance of $1,100,000 for radiation portal monitors installed on the U.S. plaza partially offset by decreases in salaries and benefits of $875,000.
Total non-operating net expense decreased $729,000 in 2015 due to the non-recurring item of costs associated with the issuance of the Series 2014 Bonds in 2014. These expenses were partially offset by a reduction in interest expense of $279,000, due to a reduction in outstanding principal and a decrease in the effective interest rate paid on the bonds. Currency remeasurement was negatively impacted by the continued weakening of the Canadian dollar during 2015.
CAPITAL ASSETS AND LONG TERM DEBT
The Authority’s total investment in capital assets as of December 31, 2015 approximated $139,000,000, representing 55% of the Authority’s total assets. Capital assets consist of land, the Peace Bridge, buildings and plaza improvements, equipment, and construction-in-progress.
In August 2005, the Authority issued $44,120,000 in Series 2005 Toll Bridge System Revenue Refunding Bonds, bearing interest at 3% through July 1, 2007. On July 1, 2007, the bonds were remarketed at an interest rate of 4% through July 1, 2010. On July 1, 2010, the bonds were again remarketed at an interest rate of 2.625% until July 1, 2014, at which time the bonds were refunded.
In June, 2014, the Authority issued $28,840,000 in fixed rate Toll Bridge System Revenue Refunding Bonds at a premium of $4,262,000, to currently refund $33,500,000 of outstanding Series 2005 bonds, with interest rates ranging from 4% to 5%, and a true interest cost of 2.22%. The Series 2014 bond proceeds of $33,102,000 plus $3,710,000 in Series 2005 bond reserve monies were used to refund the Series 2005 bonds under a mandatory tender and establish the Series 2014 debt reserves.
Standard & Poor’s Rating Services and Fitch Ratings have assigned ratings of “A+” and “A” respectively, to the Series 2014 Bonds.
FACTS THAT WILL IMPACT FINANCIAL POSITION
The Authority has initiated requests for proposals (RFP) to re-deck the Peace Bridge “under traffic,” which will require a full-time single bridge lane closure during off-peak traffic periods (October through April) for three years, beginning in 2016. Although a maintenance and protection of traffic plan has not yet been finalized to minimize the negative impact, preliminary analysis indicates diversion of 3-5% of total traffic during years of construction. As design progresses, the Authority will take all reasonable steps to minimize the negative effect on toll revenue.
CONTACT FOR AUTHORITY’S FINANCIAL MANAGEMENT
This report is designed to provide a general overview of the finances of the Authority for interested parties. Questions concerning any information within this report or requests for additional information should be addressed to Karen L. Costa, Finance Manager, 100 Queen Street, Fort Erie, ON L2A 3S6.

BUFFALO AND FORT ERIE PUBLIC BRIDGE AUTHORITY
Balance Sheet (In thousands)
December 31, 2015
Assets
Current assets:
Cash 697$
Accounts receivable, net 936
Prepaid expenses and other assets 332
Investments 94,965
96,930
Noncurrent assets:
Restricted assets:
Cash 4,078
Investments 6,151
10,229
Net pension asset 5,430
Capital assets, net (Note 6) 139,457
155,116
Total assets 252,046
Deferred outflows of resources
Defeasance loss 582
Deferred outflows of resources from pensions 800
1,382
Total assets and deferred outflows of resources 253,428$
Liabilities
Current liabilities:
Current portion of bonds payable 2,130$
Accounts payable and accrued liabilities 5,275
Accrued compensation and benefits 739
Other current liabilities 1,120
9,264
Noncurrent liabilities:
Bonds payable 27,803
Other postemployment benefits 8,454
36,257
Total liabilities 45,521
Deferred inflows of resources
Deferred inflows of resources from pensions 722
Net Position
Net investment in capital assets 105,869
Restricted 10,029
Unrestricted 91,287
Total net position 207,185
Total liabilities, deferred inflows of resources, and net position 253,428$
See accompanying notes. 3

BUFFALO AND FORT ERIE PUBLIC BRIDGE AUTHORITY
Statement of Revenues, Expenses, and Changes in Net Position (In thousands)
For the year ended December 31, 2015
Operating revenues:
Commercial tolls 15,522$
Passenger tolls 5,919
Rentals 7,425
Other 218
Total operating revenues 29,084
Operating expenses:
Toll collection and traffic control 3,087
Maintenance of bridge, buildings, plazas and equipment 5,899
Administration 3,034
Pension 224
Other postemployment benefits 1,656
Canadian property taxes and U.S. equalization payments 915
Payments to New York State 200
Depreciation 4,899
Total operating expenses 19,914
Operating income 9,170
Non-operating revenues (expenses):
Interest income 188
Interest expense (774)
Currency remeasurement (90)
Other 42
Total non-operating net expense (634)
Change in net position 8,536
Net position - beginning of year, as restated (Note 2) 198,649
Net position - end of year 207,185$
See accompanying notes. 4

BUFFALO AND FORT ERIE PUBLIC BRIDGE AUTHORITY
Statement of Cash Flows (In thousands)
For the year ended December 31, 2015
Operating activities:
Toll revenue 21,386$
Payments to suppliers (7,097)
Payments for wages and employee benefits (7,040)
Other revenues 8,030
Net operating activities 15,279
Capital and related financing activities:
Acquisition and construction of capital assets (15,254)
Interest paid on debt (1,353)
Principal payment on debt (2,230)
Proceeds from asset disposal and other 55 Net capital and related financing activities (18,782)
Investing activities:
Decrease in investments 4,253
Interest income 188
Net investing activities 4,441
Effect of exchange rate changes (1,046)
Change in cash (108)
Cash - beginning 4,883
Cash - ending 4,775$
Reconciliation of operating income to net cash
provided from operating activities:
Operating income 9,170$
Adjustments to reconcile operating income to
net cash provided from operating activities:
Depreciation 4,899
Net pension benefits (188)
Gain on disposal (10)
Accrued compensation and other postemployment benefits 792
Changes in assets and liabilities:
Accounts receivable 388
Prepaid expenses and other assets 46
Accounts payable and accrued liabilities 182
15,279$
See accompanying notes. 5

6
BUFFALO AND FORT ERIE PUBLIC BRIDGE AUTHORITY
Notes to Financial Statements
1. Summary of Significant Accounting Policies:
Reporting Entity
Buffalo and Fort Erie Public Bridge Authority (the Authority) was established through a legislative act as a public benefit corporation to own and operate an international toll bridge connecting the United States and Canada. The enabling Act, under which the Authority was created, provides that on July 1, 2020, or when all bonds issued by the Authority have been discharged (current final maturity date is January 1, 2025), whichever shall be later, the powers, jurisdiction and duties of the Board shall cease and the property and assets acquired and held by the Authority within the State of New York and within Canada shall be under jurisdiction of the State of New York and Her Majesty The Queen in Right of Canada, respectively.
Basis of Presentation
The financial statements of the Authority are prepared in conformity with U.S. generally accepted accounting principles (GAAP) as applied to governmental units. The Governmental Accounting Standards Board (GASB) is the accepted standard-setting body for establishing governmental accounting and financial reporting principles.
Measurement Focus
The Authority reports as a special purpose government engaged in business-type activities, as defined by GASB Statement No. 34. Business-type activities are those that are financed in whole or in part by fees charged to external parties for goods or services. The Authority’s financial statements are reported using the economic resources measurement focus and the accrual basis of accounting. Revenues are recorded when earned and expenses are recorded when a liability is incurred. Grants and similar items are recognized as revenue as soon as all eligibility requirements imposed by the provider have been satisfied.
The Authority’s policy for defining operating activities in the statements of revenues, expenses, and changes in net position are those that generally result from exchange transactions such as payments received for services and payments made to purchase those goods or services. Certain other transactions are reported as non-operating activities and include investment income, interest paid on capital debt, and the net effect of currency remeasurement.
Use of Estimates
The preparation of financial statements in conformity with accounting principles generally accepted in the United States of America requires management to make estimates and assumptions that affect the amounts reported in the financial statements and accompanying notes. Actual results could differ from those estimates.
Cash
At various times, cash in financial institutions may exceed insured limits and subject the Authority to concentrations of credit risk.

7
Investments
Investments consist of money market funds, short-term commercial paper, and U.S. mortgage and government agency obligations and are stated at fair market value.
Restricted Assets
The Authority established the following accounts in order to comply with bond resolution requirements:
Bond – trustee accounts established to receive amounts necessary to meet current principal and interest payments and to maintain a sufficient balance in a debt service reserve fund.
Government payments – holds amounts necessary to fund payments to the State of New York as required under current legislation.
Operating expense reserve – holds amounts necessary to pay current year operating expenses as defined, plus an operating reserve equal to one-sixth of the operating expenses of the Authority for the preceding year.
Capital Assets
Capital assets are reported at historical cost. For assets being depreciated, expense is calculated over estimated useful lives using the straight-line method. Maintenance and repairs are expensed as incurred; significant improvements are capitalized.
Capitalization thresholds for determining which asset purchases are added to capital accounts and the estimated useful lives of capital assets are:
Capitalization Estimated
policy useful life
Bridge infrastructure 5,000$ 10-150 years
Buildings and improvements 5,000$ 10-40 years
Equipment - general 1,000$ 3-10 years
Equipment - toll system 1,000$ 7 years
Currency Translation
Due to its bi-national operations, the Authority accounts for transactions in either United States dollars (USD) or Canadian dollars (CAD). The Authority translates all Canadian asset and liability accounts at the year end exchange rate, except for property and equipment, which is translated at historical rates in effect in the year of acquisition. The statement of revenues, expenses, and changes in net position is converted at the average rate of exchange for the year. Translation gains and losses are included as a component of non-operating revenues (expenses) as a currency remeasurement.
Compensated Absences
The Authority provides for vacation, sick, and compensatory time that is attributable to services already rendered and vested. The liabilities are recorded based on employees' rates of pay as of the end of the year, and include all payroll-related liabilities.

8
Pensions
For purposes of measuring the net pension asset, deferred outflows and deferred inflows of resources, pension expense, information about and changes in the fiduciary net position of the Authority’s defined benefit pension plans (Note 8) have been determined on the same basis as reported by the plans. For this purpose, benefit payments in the plans are recognized when due and payable in accordance with the benefit terms and investments are reported at fair value.
Net Position
Net investment in capital assets – consists of net capital assets reduced by outstanding balances of any related debt obligations attributable to the acquisition, construction, or improvement of the assets.
Restricted – consists of restricted assets, reduced by liabilities and deferred inflows of resources related to those assets, subject to externally imposed restrictions by creditors (such as through debt covenants), federal or state laws, or enabling legislation.
Unrestricted – the net amount of assets, deferred outflows of resources, liabilities, and deferred inflows of resources that are not included in the definition of the above restrictions and are available for general use of the Authority.
The Authority has adopted a policy of using restricted funds, when available, prior to unrestricted funds.
2. Change in Accounting Principle:
Effective January 1, 2015, the Authority adopted GASB Statement No. 68, Accounting and Financial Reporting for Pensions (GASB 68) and GASB Statement No. 71, Pension Transition for Contributions Made Subsequent to the Measurement Date (GASB 71). These statements address the accounting and financial reporting for pensions provided to Authority employees. The statements also require various note disclosures (Note 8) and required supplementary information. As a result, beginning net position has been restated as follows:
Net position previously reported, January 1, 2015 194,746$
Net pension asset 3,871
Less amount previously included in the net pension asset (1,038)
Deferred outflows of resources for contributions
made subsequent to the measurement date 1,070
Net position as restated 198,649$
3. Deposits and Investments:
The Authority's policy is to obtain collateral from U.S. financial institutions for its cash deposits. Cash deposits maintained in banks within the United States are covered by U.S. Federal Deposit Insurance and by collateral held by a custodial bank in the Authority's name based upon the average daily funds available as determined by the bank. Canada Deposit Insurance covers cash deposits maintained at banks within Canada.
Custodial credit risk is the risk that in the event of a bank failure, the Authority's deposits may not be returned to it. At December 31, 2015, $1,236,000 of the Authority's bank deposits were exposed to custodial credit risk.
The Authority's exposure to foreign currency risk derives from its deposits in Canadian denominated deposits totaling $1,540,000 (USD).

9
The Authority manages its investments pursuant to the bond resolution, which defines the nature and maturity of allowable investments. In general, the Authority invests conservatively in short-term U.S. and Canadian government agency securities and certificates of deposit.
4. Accounts Receivable, net:
(in thousands) 2015Accounts receivable for rental and tolls 937$ Less allowance for doubtful accounts 1
936$
5. Investments:
(in thousands) 2015Unrestricted:
U.S. Treasury & mortgage notes 92,745$ Money market funds 2,220
94,965$
Restricted:U.S. Treasury notes 6,151$
6. Capital Assets:
January 1, Reclassifications December 31,(in thousands) 2015 Additions and Disposals 2015Non-depreciable capital assets:
Land 25,245$ -$ (2)$ 25,243$ Construction-in-progress 13,065 15,022 (21,252) 6,835
Total non-depreciable assets 38,310 15,022 (21,254) 32,078
Depreciable capital assets:Bridge 63,451 311 - 63,762 Buildings and plazas 94,754 58 20,643 115,455 Equipment - general 4,329 271 307 4,907 Equipment - toll 4,533 18 (30) 4,521
Total depreciable assets 167,067 658 20,920 188,645
Less accumulated depreciation:Bridge (32,203) (1,726) - (33,929) Buildings and plazas (36,932) (2,773) 238 (39,467) Equipment - general (3,252) (345) 50 (3,547) Equipment - toll (4,310) (55) 42 (4,323)
Total accumulated depreciation (76,697) (4,899) 330 (81,266) Total depreciable assets, net 90,370 (4,241) 21,250 107,379
128,680$ 10,781$ (4)$ 139,457$
Net investment in capital assets as of December 31, 2015 consists of the following (in thousands):
2015Capital assets, net of accumulated depreciation 139,457$ Bonds and related premiums (29,933) Capital asset purchases included in accounts payable (3,606) Accrued interest (631) Defeasance loss 582
105,869$

10
7. Bond Indebtedness:
January 1, December 31, Due Within(in thousands) 2015 Increases Decreases 2015 One Year
Serial bonds 28,840$ -$ (2,230)$ 26,610$ 2,130$ Unamortized premium
2014 refunding 3,924 - (601) 3,323 -
32,764$ -$ (2,831)$ 29,933$ 2,130$
In August 2005, the Authority issued $44,120,000 in variable rate Toll Bridge System Revenue Refunding Bonds to currently refund $43,915,000 of outstanding 1995 Series bonds with interest rates ranging from 5.125% to 6.0%. The net proceeds of $43,639,000 (after payment of $481,000 for underwriting fees and other issuance costs) plus $4,789,000 in Series 1995 bond reserve monies were used to refund the original bonds and establish the series 2005 debt reserves.
The refunding resulted in a difference between the reacquisition price and the net carrying amount of the old debt of $2,242,000. This difference, reported in the accompanying balance sheets as a deferred outflow, is being charged to operations through the year 2024 using the effective interest method. The net difference is $582,000 at December 31, 2015.
The Series 2005 bonds, which were special revenue obligations of the Authority, were issued as variable rate obligations. They bore an initial term rate interest of 3% through July 1, 2007. On July 1, 2007, the bonds were remarketed at an interest rate of 4% until July 1, 2010. On July 1, 2010, the bonds were again remarketed at an interest rate of 2.625% until July 1, 2014, when the bonds were subject to mandatory tenderwithout a bondholder right to retain.
In June 2014, the Authority issued $28,840,000 in fixed rate Toll Bridge System Revenue Refunding Bonds at a premium of $4,262,000, with interest rates ranging from 4% to 5%, to currently refund $33,500,000 of outstanding Series 2005 bonds. The Series 2014 bond proceeds, including premium, of $33,102,000 plus $3,710,000 in Series 2005 bond reserve monies were used to refund the Series 2005 bonds under mandatory tender and establish the Series 2014 debt reserves.
Debt service requirements are as follows (in thousands):
Years ending
December 31, Principal Interest
2016 2,130$ 1,177$ 2017 2,220 1,089
2018 2,320 973
2019 2,440 875
2020 2,550 748
2021-2025 14,950 1,574
26,610$ 6,436$
11
8. Pension Plans:
Defined Benefit Plans
The Authority maintains two non-contributory, single-employer defined benefit pension plans: Pension Plan for Employees of Buffalo and Fort Erie Public Bridge Authority in the United States (U.S. Plan) and Pension Plan for Employees of Buffalo and Fort Erie Public Bridge Authority in Canada (Canadian Plan), collectively, the Defined Benefit Plans. The Defined Benefit Plans cover full and part-time employees hired before September 29, 2006 (union) and January 1, 2009 (non-union) in the United States, and before July 27, 2007 (union) and January 1, 2009 (non-union) in Canada. The Board of Directors has the responsibility to establish and amend benefit provisions. Audited financial statements of the Defined Benefit Plans are not required and have not been prepared.
Benefits: The Defined Benefit Plans provide retirement, death benefits, and if applicable, certain annual cost of living adjustments to members and beneficiaries. Cost of living adjustments are effective when the most recent actuarial valuation reports reveal a surplus which is greater than twice the annual service cost. The cost of living adjustment, on a percentage basis, is equal to 50% of the change in consumer price indices based on the average change over the 12 month period ending on September 30th of the calendar year prior to the effective date of the adjustment. The cost of living adjustments are included in the Authority’s annual pension cost only in the applicable years.
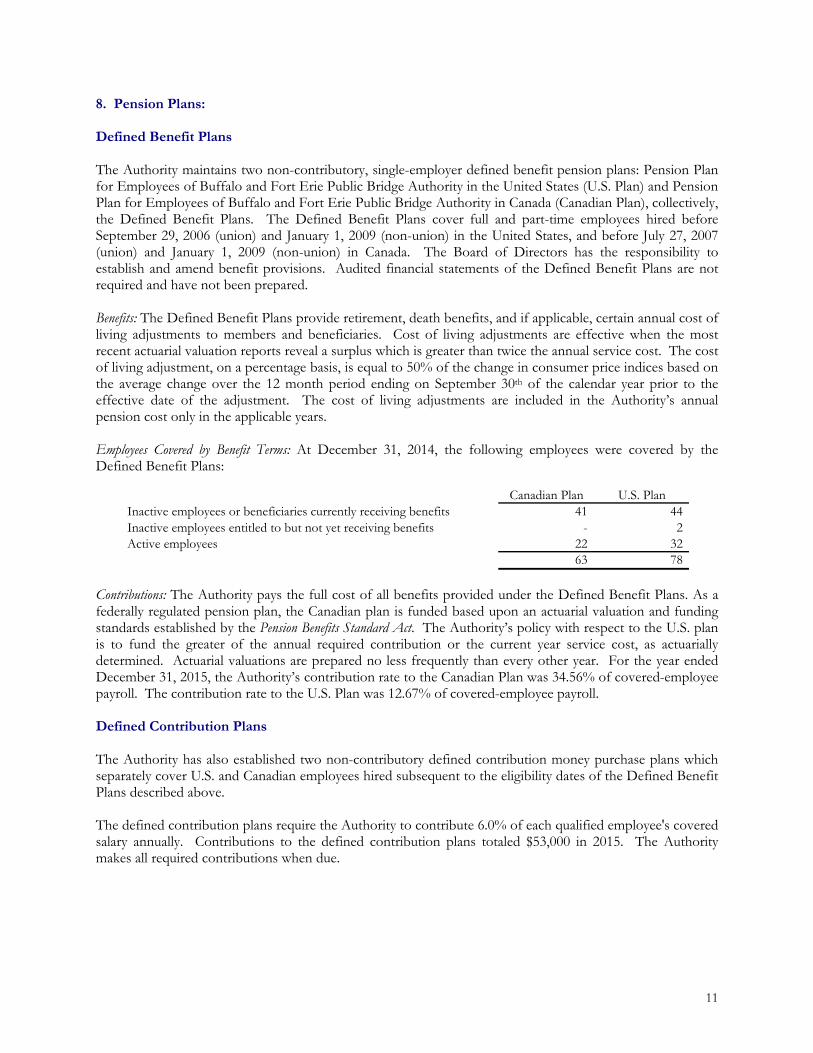
Employees Covered by Benefit Terms: At December 31, 2014, the following employees were covered by the Defined Benefit Plans:
Canadian Plan U.S. PlanInactive employees or beneficiaries currently receiving benefits 41 44 Inactive employees entitled to but not yet receiving benefits - 2 Active employees 22 32
63 78
Contributions: The Authority pays the full cost of all benefits provided under the Defined Benefit Plans. As a federally regulated pension plan, the Canadian plan is funded based upon an actuarial valuation and funding standards established by the Pension Benefits Standard Act. The Authority’s policy with respect to the U.S. plan is to fund the greater of the annual required contribution or the current year service cost, as actuarially determined. Actuarial valuations are prepared no less frequently than every other year. For the year ended December 31, 2015, the Authority’s contribution rate to the Canadian Plan was 34.56% of covered-employee payroll. The contribution rate to the U.S. Plan was 12.67% of covered-employee payroll.
Defined Contribution Plans
The Authority has also established two non-contributory defined contribution money purchase plans which separately cover U.S. and Canadian employees hired subsequent to the eligibility dates of the Defined Benefit Plans described above.
The defined contribution plans require the Authority to contribute 6.0% of each qualified employee's covered salary annually. Contributions to the defined contribution plans totaled $53,000 in 2015. The Authority makes all required contributions when due.

12
Net Pension Asset
The net pension asset was measured as of December 31, 2014 and the total pension liability was determined by an actuarial valuation as of January 1, 2015. The January 1, 2014 beginning of year measurement used in this report reflects an actuarial roll back of the January 1, 2015 valuation. There have been no changes in benefits or other plan provisions from the beginning of the year to the end of the year.
Actuarial Assumptions: Based on the size of the plans, it was not deemed appropriate to perform an experience study. The total pension liability in the January 1, 2015 actuarial valuation was determined using the following actuarial assumptions, applied to all periods included in the measurement:
Canadian U.S.Plan Plan
Inflation 2.25% 2.75%Salary increases 2.75% 2.75%Investment rate of return 5%, compounded annually, 6%, compounded annually,
net of all expenses net of all expenses
Mortality CPM2014 Mortality Table with RP-2000 Blended Mortality Tablegenerational mortality improvements fully generational with Scale BB projected using Scale B - no assumed improvements - no assumed
preretirement deaths preretirement deaths
Discount rate 5.00% 6.00%
COLA increases 1.01% COLA assumed .83% COLA assumed

13
The long-term expected rates of return on plan assets were determined using best estimate ranges of expected future real rates of return (expected returns, net of pension plan investment and inflation) developed for each major asset class. These ranges are combined to produce the long-term expected rates of return by weighting the expected future real rates of return by the target asset allocation percentage and by adding expected inflation. The target allocation and best estimates of geometric real rates of return for each major asset class are summarized as follows:
Long-Term
Expected
Target Real Rate of
Asset Class Allocation Return
Canadian PlanCanadian equities 30% 6.0%Foreign equities 20% 6.0%
Fixed income 50% 0.2%Cash equivalents - 0.1%
100%
U.S. PlanDomestic equities 40% 8.4%International equities 10% 7.0%Fixed income 47% 1.3%Cash 3% 0.8%
100%
Discount rate: The projection of cash flows used to determine the respective discount rates assumed that the Authority’s contributions will continue to follow the current funding policy. Based on this assumption, the Authority’s fiduciary net position was projected to be sufficient to make all projected future benefit payments of the Defined Benefit Plans’ current members. A municipal bond rate of 3.34% was used in the development of the blended GASB discount rate after that point for the Defined Benefit Plans. The 3.34% rate is based on the S&P Municipal Bond 20 Year High Grade Rate Index as of December 31, 2014. Based on the long-term rate of return of 5.0% (Canadian Plan) and 6.0% (U.S. Plan) and the municipal bond rate of 3.34%, the blended GASB discount rate would be 5.0% (Canadian Plan) and 6.0% (U.S. Plan).

14
Changes in the Net Pension Asset
Canadian Plan Total Pension Plan Fiduciary Net Pension(in thousands) Liability Net Position AssetBalances at 12/31/14 (11,391)$ 11,788$ 397$ Changes for the year:
Service cost (190) - (190) Interest (565) - (565) Employer contributions - 647 647 Net investment income - 1,432 1,432 Benefit payments 565 (565) - Administrative expense - (19) (19)
Net changes (190) 1,495 1,305 Balances at 12/31/15 (11,581)$ 13,283$ 1,702$
U.S. Plan Total Pension Plan Fiduciary Net Pension(in thousands) Liability Net Position AssetBalances at 12/31/14 (21,073)$ 24,547$ 3,474$ Changes for the year:
Service cost (267) - (267) Interest (1,252) - (1,252) Employer contributions - 300 300 Net investment income - 1,515 1,515 Benefit payments 936 (936) - Administrative expense - (42) (42)
Net changes (583) 837 254 Balances at 12/31/15 (21,656)$ 25,384$ 3,728$
The following presents the Authority’s net pension asset for the plans calculated using the discount rate of 5.0% (Canadian Plan) and 6.0% (U.S. Plan) and the impact of using a discount rate that is 1.0% higher or lower than the current rate.
1.0% Decrease Discount Rate 1.0% Increase
Authority's Canadian Plan net pension asset 297$ 1,702$ 2,879$
Authority's U.S. Plan net pension asset 1,160$ 3,728$ 5,881$

15
Pension Expense and Deferred Outflows of Resources and Deferred Inflows of Resources Related to Pensions
For the year ended December 31, 2015, the Authority recognized pension expense of $16,000 for the Canadian Plan and $96,000 for the U.S. Plan. At December 31, 2015, the Authority reported deferred outflows and deferred inflows of resources as follows:
Deferred Deferred Deferred DeferredOutflows of Inflows of Outflows of Inflows of
(in thousands) Resources Resources Resources Resources
Net difference between projected and actual earnings on pension plan investments -$ 672$ -$ 50$
Authority contributions subsequent to the measurement date 534 - 266 -
534$ 672$ 266$ 50$
Canadian Plan U.S. Plan
Authority contributions subsequent to the measurement date will be recognized as a reduction of the net pension liability in the year ending December 31, 2016. Other amounts reported as deferred inflows of resources related to pensions will be recognized in pension expense as follows:
Deferred Inflows
Years ending December 31, of Resources2016 181$ 2017 181 2018 180 2019 180
722$
Payable to the Pension Plan
At December 31, 2015, no amounts were payable for contributions to the pension plans required for the year ended December 31, 2015.

16
9. Other Postemployment Benefits:
The Authority maintains two single-employer defined benefit postemployment healthcare plans (the Plans), one covering certain Canadian employees and one plan covering certain U.S. employees. The Plans provide benefits in the form of insurance premium payments for coverage of eligible retirees and dependents. Plan provisions and Authority and member contribution rates are determined by the Authority. The Plans do not issue publicly available financial reports.
Eligibility is based on date of hire, attainment of retirement age, and years of service. The Authority pays 100% of the health, dental, and life insurance premiums for employees meeting the following criteria:
Canadian PlanFull-time employees hired prior to September 19, 2003 (union) or November 21, 2003 (non-union), upon attainment of age 50 with 2 years of service.
Full-time employees hired on or after September 19, 2003 but prior to July 27, 2007 (union) or on or after November 21, 2003 but prior to December 31, 2008 (non-union), upon attainment of age 50 with 10 years of service.
U.S. PlanFull-time employees hired prior to July 18, 2003 (union) or November 21, 2003 (non-union), upon attainment of age 50 with 2 years of service.
Full-time employees hired on or after July 18, 2003 but prior to September 29, 2006 (union) or on or after November 21, 2003 but prior to December 31, 2008 (non-union), upon attainment of age 50 with 10 years of service.
Accounting standards require that the Authority recognize the cost of postemployment benefits during the periods when employees render the services that will ultimately entitle them to the benefits. This cost is referred to as the annual required contribution (ARC) and includes:
Amortization of the unfunded actuarial accrued liability (UAAL) for the current year, which is the actuarially-determined, unfunded present value of all future OPEB costs associated with current employees and retirees at the beginning of the year.
Normal cost which is the actuarially-determined cost of future OPEB earned in the current year.
The ARC represents an amount that, if funded each year, would ultimately satisfy the UAAL at the end of the amortization period (the Authority is using the maximum period of 30 years) as well as each year's normal cost during that timeframe. A liability is recognized to the extent that actual funding of the Plans is less than the ARC. This liability is reflected on the balance sheet as other postemployment benefits. The Authority's Board of Directors has the authority to establish funding policies for the Plans. The current policy is to fund the Plans to the extent of premium payments and reimbursements on the pay as you go basis.

17
The following table summarizes the Authority's annual OPEB for the years ended December 31, 2015 (in thousands):
2015Annual required contribution
Normal cost 555$ Amortization of UAAL 1,249 Annual required contribution 1,804 Interest on OPEB obligation 268 ARC adjustment (416)
Annual OPEB cost 1,656 Contribution made (1,065) Increase in net OPEB obligation 591 Net OPEB obligation - beginning of year 7,863 Net OPEB obligation - end of year 8,454$
The Authority's annual OPEB cost, the percentage of annual OPEB cost contributed to the plan, and the net OPEB obligation for the previous three years were as follows (in thousands):
Percentage ofAnnual Annual OPEB Net OPEB
OPEB Cost Cost Contributed Obligation2015 1,656$ 64% 8,454$ 2014 1,681 42% 7,863 2013 1,791 41% 6,894
As of January 1, 2015, the total actuarial accrued liability for future benefits was $23,300,000. Since there are no Plan assets, the entire liability is unfunded. The annual payroll of employees eligible to be covered by the Plans was $3,156,000 and the ratio of the unfunded actuarial accrued liability to the covered payroll was 738%.
The schedule of funding progress presented as required supplementary information (RSI) following the notes to the financial statements presents multi-year trend information about whether the actuarial values of plan assets, if any, are increasing or decreasing over time relative to the UAALs for benefits.
The actuarial valuation involves estimates of costs and the impact of events far into the future. Examples include employee turnover and retirement rates, employee and retiree mortality, changes in healthcare costs,and interest rates. The Plans will be subject to routine actuarial valuations in future years and these analyses will reflect revised estimates and assumptions as actual results are compared to past projections and expectations of the future. Similarly, the valuations reflect the Plans’ benefits and cost sharing between the Authority and members of the Plans in effect at the time. Any changes in these factors will impact the results of future valuations.
The actuarial calculations reflect a long-term perspective and use techniques designed to reduce short-term volatility in actuarial accrued liabilities. A summary of the methods and assumptions is provided below:
Healthcare cost trend:Canadian Plan: 7.0% grading down by 0.25% each year through 2024, and 4.5% per year thereafter
U.S. Plan: 7.5% grading down by 0.25% each year through 2024, and 5.0% per year thereafter
Actuarial cost method:Projected unit credit

18
Discount rate:3.5%
Amortization methods:30 years, open, level dollar
Mortality:US and CanadaIRS Fully Generational, using scale BB
Retirement:Provided by the Authority for active employees based upon their unreduced pension eligibility
Termination:Rates calibrated to produce 3% aggregate turnover of the active data based on the Authority's historical experience
Postemployment benefits on the balance sheet also include $407,100 termination benefits due to former and current management employees beginning at retirement. Payments made during 2015 total $4,800.
10. Rentals:
The Authority, as lessor, has entered into non-cancelable operating leases with separate U.S. and Canadian entities operating duty-free enterprises. The Authority recognized $5,100,000 in rental income in 2015 from the duty-free enterprises. This amount included $1,600,000 of additional contingent rental payments based upon the sales levels of the lessees in 2015.
The Authority maintains a lease through October 31, 2016 with the Canadian duty-free enterprise. Based upon the agreement, the minimum rental payments to be received by the Authority are approximately $1,300,000 for 2016; subsequent years' minimum rentals are based on 75% of the immediately preceding year's minimum and contingent rental payments.
The Authority maintains a lease with the U.S. duty-free enterprise through December 31, 2020. Based upon the agreement, the minimum rental payments to be received by the Authority are approximately $1,500,000for 2016; subsequent years' minimum rentals are based on 50% of the immediately preceding year’s minimum and contingent rental payments.
The Authority also leases space to a governmental entity under a non-cancelable ten year operating lease expiring June 2019. Rental revenue received by the Authority amounted to $1,500,000 in 2015.
Minimum amounts to be received under this lease are as follows (in thousands):
2016 1,922$ 2017 1,922 2018 1,922 2019 881
6,647$
The Authority also leases certain real property under cancelable operating leases to commercial enterprises and governmental agencies. These leases are generally maintained on a month-to-month basis.

19
11. Deferred Compensation Plan:
All employees of the Authority in the United States are offered participation in a deferred compensation plan (the plan) created in accordance with Internal Revenue Code Section 457. The plan permits eligible participants to defer a portion of their salary until future years. Under the plan, amounts deferred are not available to employees until separation, retirement, death, or unforeseen emergency. All amounts deferred under the plan, all property and rights purchased with those amounts, and all income attributable to those amounts, property or rights are held in trust until paid or made available to the employee or other beneficiary.
The Authority also has unfunded liabilities of $928,000 to current and former management employees due under separate deferred compensation agreements. Payments made under these agreements totaled $8,300 in 2015.
12. Commitments and Contingencies:
Risk Management
The Authority purchases commercial insurance for various risks of loss due to torts, theft, damage, errors and omissions, injuries to employees, and natural disasters. Settled claims resulting from these risks have not exceeded commercial coverage in any of the past three years. Losses resulting from acts of terrorism have been excluded from property and excess liability policies. The Terrorism Risk Insurance Act of 2002 of the United States governs coverage for acts of terrorism under the general liability policy.
Contractual Commitments
As of December 31, 2015, the Authority had contractual commitments of approximately $4,000,000,primarily related to ongoing capital construction projects.
Litigation
The Authority is involved in various legal proceedings. The outcome of these proceedings cannot be determined at this time.
13. Net Position:
Unrestricted - Designated
The Board of Directors has designated available unrestricted amounts for acquisition or construction of capital projects and maintenance.
Restricted
(in thousands) 2015Debt service funds:
Debt service fund 2,763$ Debt service reserve fund 3,311
Operating expense reserve account 3,955 Total restricted assets 10,029$

20
BUFFALO AND FORT ERIE PUBLIC BRIDGE AUTHORITY
Required Supplementary Information Schedule of Funding Progress Postemployment Benefits (In thousands)
December 31, 2015
Unfunded UAAL as a Actuarial Actuarial Percentage
Actuarial Accrued Accrued of CoveredValuation Actuarial Value Liability Liability (UAAL) Funded Covered Payroll
Date of Assets (a) (AAL) (b) (b-a) Ratio (a/b) Payroll (c) ((b-a)/c)
1/1/2013 -$ 23,679$ 23,679$ - 3,390$ 698%
1/1/2014 -$ 23,549$ 23,549$ - 3,458$ 681%
1/1/2015 -$ 23,300$ 23,300$ - 3,156$ 738%

BUFFALO AND FORT ERIE PUBLIC BRIDGE AUTHORITY
Schedule of Changes in the Authority's Net Pension Asset and Related Ratios
(In thousands)
As of the measurement date of December 31, 2014
Total pension liability
Service cost 190$
Interest 565
Benefit payments, including refunds of employee contributions (565)
Net change in total pension liability 190
Total pension liability - beginning 11,391
Total pension liability - ending 11,581$
Plan fiduciary net position
Employer contributions 647$
Net investment income 1,432
Benefit payments, including refunds of employee contributions (565)
Administrative expense (19)
Net change in plan fiduciary net position 1,495$
Plan fiduciary net position - beginning 11,788
Plan fiduciary net position - ending 13,283
Authority's net pension (asset) liability - ending (1,702)
Plan fiduciary net position as a percentage of the total pension liability 114.7%
Covered-employee payroll 1,545
Authority's net pension (asset) liability as a percentage of
covered-employee payroll -110.16%
* Data prior to 2015 is unavailable.
Required Supplementary Information
Canadian Plan
21

BUFFALO AND FORT ERIE PUBLIC BRIDGE AUTHORITY
Schedule of Changes in the Authority's Net Pension Asset and Related Ratios
(In thousands)
As of the measurement date of December 31, 2014
Total pension liability
Service cost 267$
Interest 1,252
Benefit payments, including refunds of employee contributions (936)
Net change in total pension liability 583
Total pension liability - beginning 21,073
Total pension liability - ending 21,656$
Plan fiduciary net position
Contributions - employer 300$
Net investment income 1,515
Benefit payments, including refunds of employee contributions (936)
Administrative expense (42)
Net change in plan fiduciary net position 837$
Plan fiduciary net position - beginning 24,547
Plan fiduciary net position - ending 25,384
Authority's net pension (asset) liability - ending (3,728)
Plan fiduciary net position as a percentage of the total pension liability 117.2%
Covered-employee payroll 2,099
Authority's net pension (asset) liability as a percentage of
covered-employee payroll -177.61%
* Data prior to 2015 is unavailable.
Required Supplementary Information
U.S. Plan
22

BUFFALO AND FORT ERIE PUBLIC BRIDGE AUTHORITY
Required Supplementary Information
Schedule of Canadian Plan Contributions (In thousands)
December 31, 2015
Actuarially determined contribution 548$
Contributions in relation to the
actuarially determined contribution 534
Contribution deficiency 14$
Covered-employee payroll 1,545$
Contributions as a percentage of covered-employee payroll 34.56%
Notes to Schedule
Valuation date January 1, 2015
Methods and assumptions used to determine contribution rates:
Actuarial cost method Projected Unit Cost
Amortization method Straight-line
Remaining amortization period 5 years
Asset valuation method Market value of assets
Inflation 2.25% per annum
Salary increases 2.75% per annum
Investment rate of return 5.0% per annum, net of investment expenses
Retirement age Members eligible to retire are assumed to retire at the age which
produces the highest value; other members are assumed to
retire at age 65
Mortality UP 1994 Table with dynamic generational mortality projection
using Scale AA
COLA increases 1.01% COLA assumed for 2015
* Data prior to 2015 is unavailable.
23

BUFFALO AND FORT ERIE PUBLIC BRIDGE AUTHORITY
Required Supplementary Information
Schedule of U.S. Plan Contributions (In thousands)
December 31, 2015
Actuarially determined contribution 270$
Contributions in relation to the
actuarially determined contribution 266
Contribution deficiency 4$
Covered-employee payroll 2,099$
Contributions as a percentage of covered-employee payroll 12.67%
Notes to Schedule
Valuation date January 1, 2015
Methods and assumptions used to determine contribution rates:
Actuarial cost method Projected Unit Cost
Amortization method Level dollar, closed
Remaining amortization period 7 years
Asset valuation method Fair market value, adjusted for any contributions and benefit
payments in-transit
Inflation 2.75% per annum
Salary increases 2.75% per annum
Investment rate of return 6.0%, compounded annually, net of all expenses
Retirement age Participants are assumed to retire at age 59; participants who have
already reached age 59 are assumed to retire one year from current
valuation date
Mortality Postretirement: RP-2000 Blended Mortality Table Fully Generational
with Scale BB Improvement, no preretirement deaths are assumed
COLA increases .83% COLA assumed for 2015
* Data prior to 2015 is unavailable.
24