annual report - buffalo and fort erie public bridge … annual report.pdf · we have audited the...
TRANSCRIPT

ANNUAL REPORTBUFFALO AND FORT ERIE PUBLIC BRIDGE AUTHORITY
2008


Board of Directors
Board ChairmanKennethSCHOETZ
CatherineDENNAHOWER MaryFICKELHankFROESE GeraldLEWANDOWSKI JohnMAGGIORE
Vice ChairmanAnthony
ANNUNZIATA
GregorySTAMM AnnaTARTAGLIA
Directors


2008 was a year of great challenges, many of which will remain open items in 2009.
In July the Authority lost its Chairman, Paul Koessler. Mr. Koessler served the Authority with great distinction since 2000 and is missed not only by the Peace Bridgebut also by many in the community. In his honor a 10 year, $5,000 annual scholarship was established with the engineering school at the University of Buffalo.
From a traffic perspective, the last quarter of 2008 saw a significant traffic decline, mirroring the overall economic decline in both Canada and the United States.For the year commercial traffic declined 2% while autos declined 5%. Notwithstanding the traffic declines, overall revenue increased by 4% to $31.2 million dueprimarily to the full year effect of the mid-year 2007 toll increase and stronger than anticipated Duty Free sales.
The Authority continued to work through the intricacies of capacity expansion and obtaining the Record of Decision for the final environmental approval. Gettingthe necessary consensus and obtaining the final approvals from both the U.S. and Canadian governments is expected in 2009 to finally allow this long delayedproject to move forward.
The Authority continued to excel at all facets of existing operations and has made considerable improvements in those operations over the past twelve months.The Authority was successful in obtaining the necessary approvals to re-light the bridge and the contract for that project was let late in the year. The re-roofingproject for the Canada Customs commercial building at 10 Queen Street was completed. The Mentholatum building was sold. The reconstruction of Queen Streetfrom Central Avenue to the Niagara River was 90% completed. Contracts were let and construction is underway for the renovation and expansion of the Customsand Border Protection space in the old Authority administration building.
Administratively, steps were taken to cope with the poor economic conditions being faced by all and to ensure the Authority remains on a solid financial footing. These are very difficult times for all private and public entities in both countries, but the small and large budgetary steps taken during the final two quarters of 2008 will certainly assist the Authority in navigating the world’s financial uncertainty in 2009 and beyond.
Kenneth A. SchoetzChairman
A N N U A L R E P O R T 2008
Chairman’s Report

4
Independent Auditors’ ReportThe Board of DirectorsBuffalo and Fort Erie Public Bridge AuthorityBuffalo, New York
We have audited the accompanying balance sheets of Buffalo and Fort Erie Public Bridge Authority (the Authority) as of December 31, 2008 and 2007, andthe related statements of revenues, expenses, and changes in net assets, and cash flows for the years then ended. These basic financial statements are the responsibility of the Authority's management. Our responsibility is to express an opinion on these basic financial statements based on our audits.
We conducted our audits in accordance with auditing standards generally accepted in the United States of America and the standards applicable to financialaudits contained in Government Auditing Standards, issued by the Comptroller General of the United States. Those standards require that we plan and performthe audit to obtain reasonable assurance about whether the basic financial statements are free of material misstatement. An audit includes examining, on a testbasis, evidence supporting the amounts and disclosures in the basic financial statements. An audit also includes assessing the accounting principles used and significant estimates made by management, as well as evaluating the overall financial statement presentation. We believe that our audits provide a reasonablebasis for our opinion.
In our opinion, the basic financial statements referred to above present fairly, in all material respects, the financial position of the Authority as of December 31,2008 and 2007, and the changes in its net assets and cash flows for the years then ended in conformity with accounting principles generally accepted in theUnited States of America.
In accordance with Government Auditing Standards, we have also issued our report dated February 16, 2009 on our consideration of the Authority's internalcontrol over financial reporting and our tests of its compliance with certain provisions of laws, regulations, contracts, grant agreements, and other matters. Thepurpose of that report is to describe the scope of our testing of internal control over financial reporting and compliance and the results of that testing and not toprovide an opinion on the internal control over financial reporting or on compliance. That report is an integral part of an audit performed in accordance withGovernment Auditing Standards and should be considered in assessing the results of our audit.
The management's discussion and analysis preceding the basic financial statements is not a required part of the basic financial statements but is supplementaryinformation required by accounting principles generally accepted in the United States of America. We have applied certain limited procedures, which consistedprincipally of inquiries of management regarding the methods of measurement and presentation of the supplementary information. However, we did not audit theinformation and express no opinion on it.
February 16, 2009

5
A N N U A L R E P O R T 2008
Management’s Discussion & AnalysisFor the Years ended December 31, 2008 and 2007 (Unaudited)The management of the Buffalo and Fort Erie Public Bridge Authority (hereinafter referred to as the Authority) offers the following overview and analysis of theAuthority’s financial activities for the years ended December 31, 2008 and 2007, which should be read in conjunction with the Authority’s basic financial statements and notes to the basic financial statements.
OVERVIEW OF THE BASIC FINANCIAL STATEMENTSThis discussion and analysis is intended to serve as an introduction to the Authority’s basic financial statements. It begins by presenting and explaining the basicfinancial statements. These statements have been prepared according to accounting principles generally accepted in the United States of America (GAAP).Revenues and expenses are recorded using the accrual basis of accounting, meaning that they are recorded and recognized by the Authority as earned/incurred,regardless of when cash is received or paid.
The balance sheet presents information on all of the Authority’s assets and liabilities, with the difference between the two reported as net assets. Increases ordecreases in net assets serve as a relative indicator as to whether the Authority’s financial position is strengthening or weakening over time.
The statement of revenues, expenses, and changes in net assets shows the results of the Authority’s operations during the year and reflects both operating and non-operating activities. Changes in net assets reflect the operational impact of the current year’s activities on the financial position of the Authority.
The statement of cash flows provides an analysis of the sources and uses of cash. The cash flow statement shows net cash provided or used in operating, capital financing and investing activities.
The notes to the basic financial statements include additional information needed to provide a further understanding of the basic financial statements.

6
Management’s Discussion & Analysis continued
Financial Statement AnalysisComparative Balance Sheets as of December 31:U.S. $, in thousands
2008 2007Assets
Current assets $ 47,844 $ 35,794 Restricted assets 8,006 7,853 Capital assets, net 148,885 148,643 Other assets 536 636
Total assets $ 205,271 $ 192,926
Liabilities and net assetsCurrent liabilities $ 6,728 $ 5,534 Non-current liabilities 43,624 42,494
Total liabilities 50,352 48,028
Net assetsInvested in capital assets, net of related debt 102,827 104,095 Restricted 7,806 7,653 Unrestricted 44,286 33,150
Total net assets 154,919 144,898 Total liabilities and net assets $ 205,271 $ 192,926
As noted earlier, net assets serves as an indicator of the Authority’s overall financial position. The Authority’s net assets and unrestricted investments have increasedby approximately $10 million during 2008 as a result of net income earned through all Authority activities. Restricted net assets are reserved for debt service,governmental payments and operating reserves, as required by the Authority’s bond indenture. Substantially all unrestricted net assets have been designated bythe Board of Directors for acquisition or construction of capital projects and/or major repairs and replacements.
Noncurrent liabilities have increased due to the adoption of Government Accounting Standards Board Statement 45, Accounting and Financial Reporting byEmployers for Postemployment Benefits Other Than Pensions which requires the recognition of the costs of postemployment benefits other than pensions during peri-ods when employees render services that eventually entitle them to the benefits, rather than continuing to use the “pay-as-you-go” method.

7
A N N U A L R E P O R T 2008
Management’s Discussion & Analysis continued
Statements of Revenues, Expenses, and Changes in Net Assets for the years ended December 31:U.S. $, in thousands
2008 2007Operating revenue
Toll revenues $ 22,755 $ 21,717 Other revenues 8,433 8,324
Total operating revenues 31,188 30,041
Operating expensesToll collection and traffic control 3,588 3,643 Maintenance of bridge and facilities 4,889 4,811 Administration 3,051 2,884 Contributions to pension plans 1,377 1,662 Other post employment benefits 1,599 555 Other expenses 1,104 1,068 Depreciation 5,356 5,152
Total operating expenses 20,964 19,775 Operating Income 10,224 10,266
Non-operating revenues (expenses)Interest income 1,277 1,783 Interest expense & amortization of deferred financing cost (2,094) (1,909)Currency remeasurement (418) 183 Loss on asset disposal (44) -
Total non-operating net revenue (expense) (1,279) 57 Capital contributions 1,076 2,088
Increase in net assets 10,021 12,411 Net assets, beginning of year 144,898 132,487
Net assets, end of year $ 154,919 $ 144,898

8
Management’s Discussion & Analysis continued
As a bi-national toll bridge operator, the Authority earns revenue and incurs expenses in both U.S. and Canadian dollars. All Canadian revenue and expensesare converted to U.S. dollars at the average rate of exchange for the year. The average exchange rate for 2008 approximated the average exchange rate for2007, thus the change in the exchange rate had a negligible impact on comparative revenues and expenses.
Toll revenues increased during 2008 due to the full year impact of the toll increase implemented for passenger and commercial vehicles effective April 1, 2007and July 1, 2007, respectively. Commercial vehicle volume decreased by 1.9% while passenger vehicle volume declined by 4.9%.
Operating expenses increased by approximately $1.2 million. This increase is primarily attributable to the adoption of GASB 45 which requires the recognitionof the costs of post-employment benefits other than pensions during periods when employees render services that eventually entitle them to the benefits, rather thancontinuing to use the “pay-as-you-go” method.
Total non-operating net expense increased by approximately $1.3 million. Investment income was negatively impacted by sustained declines in investment rates,while interest expense was negatively impacted by an increase in the interest rate on the 2005 Series Bonds from 3% to 4% effective July 1, 2007. Currencyremeasurement was impacted by the weakening of the Canadian dollar as of the balance sheet date and the conversion of U.S. dollars to Canadian dollars tofund capital expenditures.
CAPITAL ASSETS AND LONG TERM DEBTThe Authority’s investment in capital assets as of December 31, 2008 approximated $149 million, representing 73% of the Authority’s total assets. Capital assetsconsist of land, the Peace Bridge, buildings and plaza improvements, equipment and construction-in-progress.
In August 2005, the Authority issued $44.1 million in 2005 Series Toll Bridge System Revenue Refunding Bonds, bearing interest at 3% through June 30, 2007.On July 1, 2007, the 2005 Series Bonds were remarketed at an interest rate of 4% through July 1, 2010.
The principal of, purchase or redemption price of, and interest on, the Series 2005 Bonds are payable from funds drawn under an irrevocable, direct-pay letterof credit issued by the New York Agency of Scotiabank. Moody’s Investors Service, Inc., Standard & Poor’s Rating Services, Inc., and Fitch Ratings have assignedratings of “Aa1”/“VMIG-1”, “AA-”/“A-1+”, and “AA-”/“F1+”, respectively, to the 2005 Series Bonds.
FACTS THAT WILL IMPACT FINANCIAL POSITIONDesign and construction of a capacity expansion project resulting from the Bi-National Integrated Environmental Review Process is expected to require a futurebond offering or other debt financing. The Authority may not have sufficient financial capability to fund the entire cost of construction and maintenance of this project, although it does expect to contribute materially to such cost. A draft finance plan has been developed to consider enhancement of the current financialcapacity of the Authority to undertake the project and to determine the availability of other funding sources.

9
A N N U A L R E P O R T 2008
Management’s Discussion & Analysis continued
Various factors may affect the timing and costs ultimately required to implement certain provisions of the capacity expansion project, which remains in the environmental assessment phase. Consequently, it is not currently possible to accurately predict the timing of the issuance or the amount of any financing that maybe required to implement the capacity expansion project.
During 2006, the Authority applied for and received a $25 million earmark for planning, design, and construction of certain capacity expansion project components under the “Safe, Accountable, Flexible, Efficient Transportation Equity Act: A Legacy for Users” or “SAFETEA-LU”. Subsequent to approving the earmark, the Federal government reduced the state appropriation, including the $25 million earmark by approximately 14%. In addition, a portion of the available earmark has been and will be used towards funding completion of the environmental review process. The remaining available funding will be analyzed in conjunction with the overall finance plan and will be used to establish the financial threshold for evaluating project alternatives and the selection of a preferred alternative.
CONTACT FOR AUTHORITY’S FINANCIAL MANAGEMENTThis report is designed to provide a general overview of the finances of the Authority for interested parties. Questions concerning any information within this report or requests for additional information should be addressed to Lynne M. Bogdan, Finance Manager, 100 Queen Street, Fort Erie, ON L2A 3S6.

10
Balance SheetsDecember 31, 2008 2007 Assets Current assets:
Cash $ 1,190,937 $ 540,016 Accounts receivable, net 2,683,857 2,801,725 Grants receivable 443,581 1,116,303 Prepaid expenses and other assets 168,231 183,371 Investments 43,357,701 31,152,784
47,844,307 35,794,199
Noncurrent assets:Restricted assets:
Cash 3,185,636 1,156,922 Investments 4,820,078 6,695,958
8,005,714 7,852,880 Capital assets, net 148,885,344 148,642,537 Deferred financing costs 536,075 636,271
149,421,419 149,278,808 Total assets $ 205,271,440 $ 192,925,887
See accompanying notes.

11
A N N U A L R E P O R T 2008
Balance Sheets continued
December 31, 2008 2007 Liabilities Current liabilities:
Accounts payable and accrued liabilities $ 3,756,052 $ 2,393,265 Accrued interest payable 882,404 877,498 Allowance for unredeemed tokens and deferred toll revenue 996,481 1,055,744 Accrued compensation and benefits 893,515 1,007,122 Due to other governments 200,000 200,000
6,728,452 5,533,629
Noncurrent liabilities: Bonds payable 42,630,447 42,494,183 Other post-employment benefits 993,100 -
43,623,547 42,494,183 Total liabilities $ 50,351,999 $ 48,027,812
Net AssetsInvested in capital assets, net of related debt 102,827,253 104,095,262 Restricted 7,805,714 7,652,880 Unrestricted 44,286,474 33,149,933
Total net assets 154,919,441 144,898,075 Total liabilities and net assets $ 205,271,440 $ 192,925,887
See accompanying notes.

12
Statements of Revenues, Expenses, and Changes in Net AssetsFor the years ended December 31, 2008 2007Operating revenues:
Commercial tolls $ 15,692,250 $ 14,283,105Passenger tolls 7,062,807 7,433,577Rentals 8,248,116 8,141,999Other 184,391 182,736
Total operating revenues 31,187,564 30,041,417
Operating expenses:Toll collection and traffic control 3,588,073 3,643,424Maintenance of bridge, buildings, plazas and equipment 4,889,262 4,810,968Administration 3,050,551 2,883,786Contributions to pension plans 1,377,058 1,662,155Other post-employment benefits 1,599,196 555,221Canadian property taxes and U.S. equalization payments 903,760 867,936Payments to New York State 200,000 200,000Depreciation 5,355,648 5,151,968
Total operating expenses 20,963,548 19,775,458Operating income 10,224,016 10,265,959
Non-operating revenues (expenses):Interest income 1,276,609 1,783,095Interest expense (1,993,371) (1,846,120)Amortization of deferred financing costs (100,196) (63,401)Currency remeasurement (418,189) 183,283Loss on asset disposal (44,152) -
Total non-operating net revenue (expense) (1,279,299) 56,857Increase in net assets before grant contributions 8,944,717 10,322,816
Capital contributions from grants 1,076,649 2,087,890Increase in net assets 10,021,366 12,410,706
Net assets - beginning of year 144,898,075 132,487,369Net assets - end of year $ 154,919,441 $ 144,898,075 See accompanying notes.

13
A N N U A L R E P O R T 2008
Statements of Cash FlowsFor the years ended December 31, 2008 2007Cash flows from operating activities:
Toll revenue $ 22,749,913 $ 21,994,526Payments to suppliers (5,556,059) (5,550,120)Payments for wages and employee benefits (8,962,297) (9,206,946)Other revenues 8,517,845 7,778,701
Net cash provided from operating activities 16,749,402 15,016,161Cash used for capital financing activities:
Acquisition and construction of capital assets (4,272,961) (10,175,439)Capital contributions from grants 1,747,365 2,611,779Interest paid on debt (1,852,201) (1,420,552)Payment of financing fees - (220,770)
Net cash used for capital financing activities (4,377,797) (9,204,982)Cash flows from investing activities:
Net deposits to investments (10,329,037) (8,172,201)Interest income 1,276,609 1,783,095
Net cash provided for investing activities (9,052,428) (6,389,106)Effect of exchange rate changes (639,542) 286,694Net increase (decrease) in cash 2,679,635 (291,233)
Cash, beginning of year 1,696,938 1,988,171Cash, end of year $ 4,376,573 $ 1,696,938Reconciliation of operating income to net cashprovided from operating activities:
Operating income $ 10,224,016 $ 10,265,959Adjustments to reconcile operating income tonet cash provided from operating activities:
Depreciation 5,355,648 5,151,968Allowance for unredeemed tokens and deferred toll revenue (8,597) 3,684
Changes in assets and liabilities:Accounts receivable 80,752 (161,786)Prepaid expense and other assets (9,158) 11,483Accounts payable and accrued liabilities 1,098,702 (145,059)Deferred revenue 8,039 (110,088)
$ 16,749,402 $ 15,016,161 See accompanying notes.

14
Notes to Basic Financial Statements1. Summary of Significant Accounting Policies:Reporting EntityBuffalo and Fort Erie Public Bridge Authority (the Authority) was established through a legislative act as a public benefit corporation to own and operate an international toll bridge connecting the United States and Canada. The Enabling Act, under which the Authority was created, provides that on July 1, 2020 orwhen all bonds issued by the Authority have been discharged (current bonds final maturity date is January 1, 2025), whichever shall be later, the Authority’s functions shall cease.
Basis of PresentationThe financial statements of the Authority are prepared in conformity with U.S. generally accepted accounting principles (GAAP) as applied to government units.The Authority applies all Governmental Accounting Standards Board (GASB) pronouncements as well as applicable Financial Accounting Standards Board (FASB)pronouncements issued on or before November 30, 1989.
Measurement FocusThe Authority reports as a special purpose government engaged in business-type activities, as defined by GASB Statement No. 34. Business-type activities arethose that are financed in whole or in part by fees charged to external parties for goods or services. The Authority’s financial statements are reported using theeconomic resources measurement focus and the accrual basis of accounting. Revenues are recorded when earned and expenses are recorded when a liabilityis incurred. Grants and similar items are recognized as revenue as soon as all eligibility requirements imposed by the provider have been satisfied.
The Authority’s policy for defining operating activities in the statements of revenues, expenses and changes in net assets are those that generally result fromexchange transactions such as payments received for services and payments made to purchase those goods or services. Certain other transactions are reportedas non-operating activities and include investment income, interest paid on capital debt and the net effect of currency re-measurement.
Use of EstimatesThe preparation of financial statements in conformity with accounting principles generally accepted in the United States of America requires management to makeestimates and assumptions that affect the amounts reported in the financial statements and accompanying notes. Actual results could differ from those estimates.
CashAt various times, cash in financial institutions may exceed insured limits and subject the Authority to concentrations of credit risk.
InvestmentsInvestments consist of a bank term investment and U.S. mortgage and government agency obligations and are stated at fair market value.

15
A N N U A L R E P O R T 2008
Notes to Basic Financial Statements continued
1. Summary of Significant Accounting Policies (continued):Restricted Assets The Authority established the following accounts in order to comply with bond resolution requirements:
Bond - trustee accounts established to receive amounts necessary to meet current principal and interest payments and to maintain a sufficient balance in adebt service reserve fund. Government payments - holds amounts necessary to fund payments to the State of New York as required under current legislation. Operating expense reserve - holds amounts necessary to pay current year operating expenses as defined, plus an operating reserve equal to one-sixth ofthe operating expenses of the Authority for the preceding year.
Capital AssetsCapital assets are reported at actual historical cost. For assets being depreciated, expense is calculated over estimated useful lives using the straight-line method.Maintenance and repairs are expensed as incurred, significant improvements are capitalized.
Capitalization thresholds for determining which asset purchases are added to capital accounts and the estimated useful lives of capital assets are:
Capitalization policy Estimated useful lifeBuilding infrastructure $ 5,000 10-150 yearsBuildings and improvements $ 5,000 10-40 yearsEquipment - general $ 1,000 5-10 yearsEquipment - toll system $ 1,000 7 years
Currency TranslationDue to its bi-national operations, the Authority maintains accounts within its accounting records in either United States or Canadian dollars. The Authority translatesall Canadian asset and liability accounts at the year end exchange rate, except for property and equipment accounts, which are translated at historical rates in effect in the year of acquisition. The statement of revenues and expenses is converted at the average rate of exchange for the year. Translation gains and losses are included as a component of non-operating revenues (expenses) as a currency re-measurement.
Compensated Absences The Authority provides for vacation, sick and compensatory time that is attributable to services already rendered. The liabilities are recorded based on employees’rates of pay as of the end of the fiscal year, and include all payroll related liabilities.

16
Notes to Basic Financial Statements continued
1. Summary of Significant Accounting Policies (continued):Net Assets
Invested in capital assets, net of related debt – consists of net capital assets reduced by outstanding balances of any related debt obligations attributable tothe acquisition, construction, or improvement of the assets.Restricted net assets – consists of net assets subject to externally imposed restrictions by creditors (such as through debt covenants), federal or state laws orenabling legislation.Unrestricted – consists of all other net assets that do not meet the definition of the above restrictions and are available for general use of the Authority.
The Authority has adopted a policy of using restricted funds, when available, prior to unrestricted funds.
ReclassificationThe 2007 financial statements have been reclassified to conform to the presentation adopted for 2008.
2. Change in Accounting Principle: For the year ended December 31, 2008 the Authority adopted GASB Statement No. 45 – Accounting and Financial Reporting by Employers for PostemploymentBenefits Other Than Pensions. This pronouncement establishes standards for the measurement, recognition, and display of other postemployment benefits (OPEB)expenses and related liabilities, note disclosures, and required supplementary information (Note 9).
3. Deposits and Investments:The Authority’s policy is to obtain collateral for its cash deposits from U.S. financial institutions. Cash deposits maintained in banks within the United States arecovered by U.S. Federal Deposit Insurance and by collateral held by custodial banks in the Authority’s name based upon the average daily funds available asdetermined by the banks. Canada Deposit Insurance covers cash deposits up to $81,766 ($100,000 CAD) maintained in banks within Canada.
Custodial credit risk is the risk that in the event of a bank failure, the Authority’s deposits may not be returned to it. At December 31, 2008, $3,218,518 of the Authority’sbank deposits and bank term investments totaling $8,202,360 were exposed to custodial credit risk.
The Authority’s exposure to foreign currency risk derives from its deposits in Canadian denominated deposits totaling $3,379,729 (USD).
The Authority manages its investments pursuant to the bond resolution, which defines the nature and maturity of allowable investments. In general, the Authorityinvests conservatively in short-term U.S. and Canadian government agency securities and certificates of deposit.

17
A N N U A L R E P O R T 2008
Notes to Basic Financial Statements continued
4. Accounts Receivable, net:2008 2007
Accounts receivable $ 2,693,857 $ 2,802,725 Less allowance for doubtful accounts 10,000 1,000
$ 2,683,857 $ 2,801,725
5. Investments:2008 2007
Unrestricted:U.S. Treasury & mortgage notes $ 39,553,601 $ - Bank term investment 3,804,100 31,152,784
$ 43,357,701 $ 31,152,784
Restricted:U.S. Treasury notes $ 4,796,648 $ 4,837,140 Bank term investment - 1,835,388 Accrued interest receivable 23,430 23,430
$ 4,820,078 $ 6,695,958
18
Notes to Basic Financial Statements continued
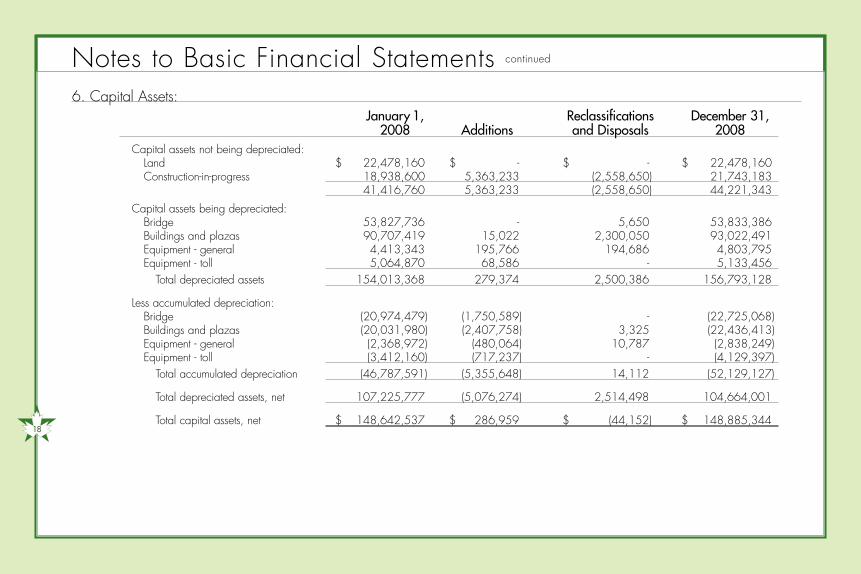
6. Capital Assets:January 1, Reclassifications December 31,
2008 Additions and Disposals 2008Capital assets not being depreciated:
Land $ 22,478,160 $ - $ - $ 22,478,160Construction-in-progress 18,938,600 5,363,233 (2,558,650) 21,743,183
41,416,760 5,363,233 (2,558,650) 44,221,343
Capital assets being depreciated:Bridge 53,827,736 - 5,650 53,833,386Buildings and plazas 90,707,419 15,022 2,300,050 93,022,491Equipment - general 4,413,343 195,766 194,686 4,803,795Equipment - toll 5,064,870 68,586 - 5,133,456
Total depreciated assets 154,013,368 279,374 2,500,386 156,793,128
Less accumulated depreciation:Bridge (20,974,479) (1,750,589) - (22,725,068)Buildings and plazas (20,031,980) (2,407,758) 3,325 (22,436,413)Equipment - general (2,368,972) (480,064) 10,787 (2,838,249)Equipment - toll (3,412,160) (717,237) - (4,129,397)
Total accumulated depreciation (46,787,591) (5,355,648) 14,112 (52,129,127)
Total depreciated assets, net 107,225,777 (5,076,274) 2,514,498 104,664,001
Total capital assets, net $ 148,642,537 $ 286,959 $ (44,152) $ 148,885,344

19
A N N U A L R E P O R T 2008
Notes to Basic Financial Statements continued
6. Capital Assets (continued):January 1, Reclassifications December 31,
2007 Additions and Disposals 2007Capital assets not being depreciated:
Land $ 22,478,160 $ - $ - $ 22,478,160 Construction-in-progress 29,532,007 9,311,581 (19,904,988) 18,938,600
52,010,167 9,311,581 (19,904,988) 41,416,760
Capital assets being depreciated:Bridge 53,820,695 7,041 - 53,827,736 Buildings and plazas 70,857,505 26,186 19,823,728 90,707,419 Equipment - general 4,147,312 243,793 22,238 4,413,343 Equipment - toll 4,509,143 496,705 59,022 5,064,870
Total depreciated assets 133,334,655 773,725 19,904,988 154,013,368
Less accumulated depreciation:Bridge (19,224,299) (1,750,180) - (20,974,479)Buildings and plazas (17,785,321) (2,246,659) - (20,031,980)Equipment - general (1,940,786) (428,186) - (2,368,972)Equipment - toll (2,685,217) (726,943) - (3,412,160)
Total accumulated depreciation (41,635,623) (5,151,968 - (46,787,591)
Total depreciated assets, net 91,699,032 (4,378,243) 19,904,988 107,225,777
Total capital assets, net $ 143,709,199 $ 4,933,338 $ - $ 148,642,537

20
Notes to Basic Financial Statements continued
7. Bond Indebtedness:January 1, December 31, Due Within
2008 Increases Decreases 2008 One YearSerial Bonds $ 44,120,000 $ - $ - $ 44,120,000 $ -
January 1, December 31, Due Within 2007 Increases Decreases 2007 One Year
Serial Bonds $ 44,120,000 $ - $ - $ 44,120,000 $ -
In August 2005, the Authority issued $44,120,000 in variable rate Toll Bridge System Revenue Refunding Bonds to currently refund $43,915,000 of outstanding 1995 Series bonds with interest rates ranging from 5.125% to 6.0%. The net proceeds of $43,639,394 (after payment of $480,606 for underwriting fees and other issuance costs) plus $4,788,824 in Series 1995 bond reserve monies were used to refund the original bonds and establish theSeries 2005 debt reserves.
The current refunding resulted in a difference between the reacquisition price and the net carrying amount of the old debt of $2,242,465. This difference, reportedin the accompanying balance sheets as a reduction of bonds payable, is being charged to operations through the year 2024 using the effective interest method.The net difference is $1,489,553 and $1,625,817 at December 31, 2008 and 2007.
The Series 2005 bonds, which are special revenue obligations of the Authority, were issued as variable rate obligations. They bore an initial term rate interest of3% through July 1, 2007. On July 1, 2007 the bonds were remarketed at an interest rate of 4% until July 1, 2010, payable semi-annually on July 1 and January1, beginning January 1, 2008. On July 1, 2010, the bonds will be subject to mandatory tender without a bondholder right to retain, at which time the bondswill be subject to alternate methods of determining interest rates from time to time and conversion to a fixed rate of interest to maturity.
Under an irrevocable letter of credit issued by a bank, the trustee is entitled to draw an amount sufficient to pay the principal of the bonds when due, the purchaseprice of the bonds tendered by the holders and not remarketed, and up to 199 days interest. This letter of credit has an initial stated amount of $46,558,856and accrues interest on the stated amount at .195% per annum. It will expire on August 4, 2010 unless earlier terminated or extended.

21
A N N U A L R E P O R T 2008
Notes to Basic Financial Statements continued
7. Bond Indebtedness (continued):Debt service requirements based on the 4.0% rate in effect at year end are as follows:
Years endingDecember 31, Principal Interest
2009 $ - $ 1,764,8002010 1,380,000 1,709,600 2011 2,185,000 1,622,200 2012 2,265,000 1,531,600 2013 2,350,000 1,437,600
2014-2018 13,120,000 5,651,000 2019-2023 15,700,000 2,725,400 2024-2025 7,120,000 145,000
$ 44,120,000 $ 16,587,200
8. Pension Plans:Plan DescriptionsThe Authority contributes to two single-employer defined benefit pension plans: the Pension Plan for Employees of Buffalo and Fort Erie Public Bridge Authority inthe United States (U.S. Plan) and Pension Plan for Employees of Buffalo and Fort Erie Public Bridge Authority in Canada (Canadian Plan)(collectively the Plans).The Plans cover substantially all full and part-time employees in the United States and Canada, and provide retirement and death benefits and certain annual costof living adjustments to plan members and beneficiaries. The Board of Directors has the authority to establish and amend benefit provisions of the Plans. Separatefinancial statements are not required, nor have they been prepared for either pension plan.
The Authority has also established two defined contribution plans which separately cover U.S. and Canadian employees. These plans are offered to all newemployees in place of the Plans beginning in 2008. Contributions to the defined contribution plans totaled $5,000 in 2008.
Funding Policy The Authority pays the full cost of all benefits provided under the Plans and its policy is to fund the annual required contributions each year.
Annual required contributions to the Plans are actuarially determined no less frequently than every other year and are computed based on Canadian governmentalfunding requirements to eliminate certain deficiencies over five years.
Annual required contributions and payments to the Plans totaled approximately $1.4 million in 2008, $1.6 million in 2007 and $1.7 million in 2006.

22
Notes to Basic Financial Statements continued
8. Pension Plans (continued):Plan Information The Authority’s annual pension cost to the Plans for the current year and related information for each plan is as follows:
Canadian United StatesRetirement Plan Retirement Plan
Actuarial valuation date 1/1/08 1/1/08
Actuarial cost method Projected Unit Credit
Remaining amortization period 4 8
Asset valuation method Market value basis
Actuarial assumptions:Investment rate of return 5.5 % 6.0 %Projected salary increases 3.5 % 3.5 %Includes inflation at 2.5 % 2.5 %Cost of living adjustments 1.0 % 1.0 %
Funded Status and Funding ProgressThe funded status of each plan as of January 1, 2008, the most recent actuarial evaluation date, is as follows:
Schedule of Funding Progress
Excess UAAL as aActuarial (Deficiency) Percentage of
Actuarial Value Accrued Liability of Assets over Funded Covered Covered Payrollof Assets (a) (AAL) (b) AAL (a-b) Ratio (a/b) Payroll (c) ((b-a)/c)
Canadian Plan $ 13,970,000 $ 13,833,000 $ 137,000 101% $ 2,045,000 N/A
U.S. Plan $ 18,416,000 $ 18,341,000 $ 75,000 100% $ 2,693,000 N/A
The schedule of funding progress presented as required supplementary information (RSI) following the notes to the financial statements, present multi-year trend information about whether the actuarial values of plan assets are increasing or decreasing over time relative to the AALs for benefits.

23
A N N U A L R E P O R T 2008
Notes to Basic Financial Statements continued
9. Postemployment Healthcare Benefits:The Authority maintains two single-employer defined benefit postemployment healthcare plans (the Plans), one covering certain Canadian employees and oneplan covering certain U.S. employees. The Plans provide benefits in the form of insurance premium payments for coverage of eligible retires and spouses. Planprovisions and Authority and member contribution rates are determined through negotiations between the Authority and its employees or the collective bargainingunits that represent its employees. The Plans do not issue a publicly available financial report.
Eligibility is based on the date of hire, attainment of retirement age, and years of service. The Authority pays 100% of the health, dental and life insurance premiums for employees meeting the following criteria:
Canadian PlanFull-time employees hired prior to September 19, 2003 (union) or November 21, 2003 (non-union), upon attainment of age 50 with 2 years of service
Full-time employees hired after September 19, 2003 but prior to July 27, 2007 (union) or after November 21, 2003 but prior to December 31, 2008 (non-union),upon attainment of age 50 with 10 years of service
U.S. PlanFull-time employees hired prior to July 18, 2003 (union) or November 21, 2003 (non-union), upon attainment of age 50 with 2 years of service
Full-time employees hired after July 18, 2003 but prior to September 29, 2006 (union) or after November 21, 2003 but prior to December 31, 2008 (non-union),upon attainment of age 50 with 10 years of service
For the year ended December 31, 2007, the Authority recognized the cost of these benefits as an expense when paid. That amount was $555,000.
As mentioned in Note 2, the Authority adopted GASB Statement No. 45 for the year ended December 31, 2008. The objective of this statement is to improvethe faithfulness and usefulness of financial information presented with respect to postemployment benefits other than pensions (OPEB). For the Authority, that involvesthe above-described Plans. GASB Statement No. 45 requires that the Authority recognize the cost of these benefits during the periods when employees render the services that will ultimately entitle them to the benefits, rather than continuing to use the “pay as you go” method (recognize the cost as the retiree premiums and reimbursements are paid). This cost is referred to as the annual required contribution (ARC) and includes three components:
— amortization of the unfunded actuarial liability (UAL) for the current year, the UAL being the actuarially-determined and unfunded present value of all future OPEB costs associated with current employees and retirees as of the beginning of the year
— the actuarially-determined cost of future OPEB ascribed to, or “earned”, in the current year (normal cost)— interest on the UAL for the current year

24
Notes to Basic Financial Statements continued
9. Postemployment Healthcare Benefits (continued):The ARC represents an amount that, if funded each year, would ultimately satisfy the UAL at the end of the amortization period (the Authority is using the maximumperiod allowed by GASB Statement No. 45 of 30 years) as well as each year’s normal cost during that timeframe. A liability is recognized to the extent thatactual funding of the Plans is less than the ARC. This liability is reflected on the balance sheets as other postemployment benefits. The Authority’s Board of Directorshas the authority to establish funding policy for the Plans. The current policy is to fund the Plans to the extent of premium payments and reimbursements on the“pay as you go” basis.
The following table summarizes the Authority’s ARC for 2008, the amount actually contributed to the Plans, and changes in the Authority’s net OPEB obligation:
Annual required contributionNormal cost $ 693,360 Amortization of UAL 905,836
Annual required contribution 1,599,196 Contributions made 606,096 Increase in net OPEB obligation 993,100 Net OPEB obligation - beginning of year - Net OPEB obligation - end of year $ 993,100
In future years, the annual expense for OPEB will include interest on the balance of the net OPEB liability and any adjustments to the ARC as a result of revaluations.During 2008, the Authority’s contribution of $606,096 toward the Plans represented 38% of the ARC.
The actuarial analysis supporting the GASB Statement No. 45 implementation for 2008 was completed using a valuation date of January 1, 2008. As of thatdate, the total actuarial accrued liability for future benefits was $22,804,848. Since there are no Plan assets, the entire liability is unfunded. The annual payrollof employees eligible to be covered by the Plans was $4,509,632, thus the ratio of the AAL to covered payroll was approximately 506%.
The actuarial valuation involves estimates of costs and the impact of events far into the future. Examples include employee turnover and retirement rates, employeeand retiree mortality, and changes in health care costs and interest rates. The Plans will be subject to routine actuarial revaluations in future years and these analyses will reflect revised estimates and assumptions as actual results are compared to past projections and expectations of the future. Similarly, the January 1,2008 valuation reflected the Plans’ benefits and cost sharing between the Authority and members of the Plans in effect at the time. Any changes in these factorswill impact the results of future valuations.

25
A N N U A L R E P O R T 2008
Notes to Basic Financial Statements continued
9. Postemployment Healthcare Benefits (continued):The actuarial calculations reflect a long-term perspective and utilize techniques designed to reduce short-term volatility in actuarial accrued liabilities. A summaryof the methods and assumptions is provided below:
Healthcare cost trend:Canadian Plan: 10% grading down by 0.5% each year through 2018, and 4.5% per year thereafter.
U.S. Plan: 10.5% grading down by 0.5% each year through 2018, and 5.0% per year thereafter.
Actuarial cost method:Projected unit credit
Discount rate:4%
Amortization methods:30 years, open, level percentage of pay30 years remaining at January 1, 2008
10. Rentals:The Authority, as lessor, has entered into noncancelable operating leases with a U.S. duty-free enterprise and a Canadian duty-free enterprise. The Authority recognized approximately $6.2 million and $6.1 million in rental income in 2008 and 2007, respectively, from the duty-free enterprises. This amount includedapproximately $2.5 million and $2.7 million of additional contingent rental payments based upon the sales levels of the lessees in 2008 and 2007, respectively.
The Authority maintains a twelve-year lease through 2010, subject to optional renewal, with the Canadian duty-free enterprise. Based upon the agreement, the minimum rental payments to be received by the Authority are approximately $1.6 million for 2009; subsequent years’ minimum rental is based on 75% of the immediately preceding year’s minimum and contingent rental payments.
The Authority maintains a five-year lease with the U.S. duty-free enterprise. This lease is subject to three 5 year renewals, with the last renewal period expiring in 2020. Based upon the agreement, the minimum rental payments to be received by the Authority are approximately $2 million for 2009; subsequent years’minimum rental is based on 50% of the immediately preceding year’s minimum and contingent rental payments.
The Authority also leases certain real property space under cancelable operating leases to commercial enterprises and governmental agencies. These leases aregenerally maintained on a month-to-month basis.
26
Notes to Basic Financial Statements continued
11. Deferred Compensation Plan:All employees of the Authority in the United States are offered participation in a deferred compensation plan (the “plan”) created in accordance with InternalRevenue Code Section 457. The plan permits eligible participants to defer a portion of their salary until future years. Under the plan, amounts deferred are notavailable to employees until separation, retirement, death or unforeseen emergency.
All amounts deferred under the plan, all property and rights purchased with those amounts, and all income attributable to those amounts, property or rights areheld in trust, until paid or made available to the employee or other beneficiary.
12. Commitments and Contingencies:Risk ManagementThe Authority purchases commercial insurance for various risks of loss due to torts, theft, damage, errors and omissions, injuries to employees and natural disas-ters. Losses resulting from acts of terrorism have been excluded from property and excess liability policies. The Terrorism Risk Insurance Act of 2002 of the UnitedStates governs coverage for acts of terrorism under the general liability policy.
GrantsThe Authority receives financial assistance from federal and state agencies in the form of grants. The expenditure of funds received under these programs generallyrequires compliance with the terms and conditions specified in the grant agreements and are subject to audit by the grantor agencies. Any disallowed claimsresulting from such audits could become a liability of the Authority. Based on prior experience, the Authority expects any such amounts to be immaterial.
The Authority is a party to a funding agreement whereby the U.S. Federal Government has agreed to fund the bi-national integrated environmental process relatedto the proposed construction of a capacity expansion project, up to a maximum of $18.9 million. The terms and conditions of the agreement specify that if theAuthority suspends or delays work on the aforementioned process, or takes other actions resulting in the loss of federal participation, the Authority must repay allamounts received under the funding agreement. Potential recoveries under this agreement as of December 31, 2008 approximate $17.7 million. The Authorityhas no plans to suspend or delay work on the project and completion is expected in 2009. Capacity expansion costs continue to be recorded as construction-in-progress at December 31, 2008. In the event that the expansion project is suspended or delayed for an extended period, the future benefit of expendituresmay be unpaid and subject to adjustment.

27
A N N U A L R E P O R T 2008
Notes to Basic Financial Statements continued
12. Commitments and Contingencies (continued):Operating Lease CommitmentsIn October 2005, a new duty-free store opened on the U.S. plaza and the old store was demolished. The new store, constructed at a cost of $2.8 million andfinanced by the operator, is expected to be temporary in nature, as completion of the Authority’s capacity expansion project may require the reconfiguration orrelocation of the U.S. plaza. In the event that relocation of the temporary store is required prior to 2015, the Authority’s lease with the duty free operator requirespartial reimbursement, on a descending scale ranging from 25% to 5%, for the cost of construction of such temporary store.
Contractual CommitmentsAs of December 31, 2008 the Authority had contractual commitments of approximately $4 million, primarily related to on-going capital construction projects.
LitigationThe Authority is involved in various legal proceedings, which, in the opinion of management, will not have a material adverse effect upon the financial positionof the Authority.
13. Net Assets:Unrestricted – Designated Net AssetsThe Board of Directors has designated available unrestricted net assets for acquisition or construction of capital projects and maintenance.
Restricted Net Assets2008 2007
Debt service funds:Debt service fund $ 885,714 $ 901,422 Debt service reserve fund 3,934,779 3,960,120
Operating expense reserve account 2,985,221 2,791,338 Total restricted assets $ 7,805,714 $ 7,652,880

28
Required Supplementary Information (Unaudited)
Schedules of Funding Progress for Defined Benefit Pension PlansCanadian Plan
UAAL as aExcess Percentage
Actuarial Actuarial Accrued (Deficiency) of CoveredValuation Actuarial Value Liability of Assets over Funded Covered Payroll
Date of Assets (a) (AAL) (b) AAL (a-b) Ratio (a/b) Payroll (c) ((b-a)/c)
1/1/2008 $ 13,970,000 $ 13,833,000 $ 137,000 101% $ 2,045,000 N/A
1/1/2007 $ 11,930,000 $ 11,762,000 $ 168,000 101% $ 1,903,000 N/A
1/1/2006 $ 10,586,000 $ 11,701,000 $(1,115,000) 90% $ 1,896,000 59%
U.S. Plan
UAAL as aExcess Percentage
Actuarial Actuarial Accrued (Deficiency) of CoveredValuation Actuarial Value Liability of Assets over Funded Covered Payroll
Date of Assets (a) (AAL) (b) AAL (a-b) Ratio (a/b) Payroll (c) ((b-a)/c)
1/1/2008 $ 18,416,000 $ 18,341,000 $ 75,000 100% $ 2,693,000 N/A
1/1/2006 $ 14,415,000 $ 17,453,000 $(3,038,000) 83% $ 2,822,000 108%
1/1/2004 $ 11,301,000 $ 14,661,000 $(3,360,000) 77% $ 3,203,000 105%

Chairman
Paul Koessler1937 — 2008
This annual report is dedicated to the memory
of Paul Koessler who passed away while serving as Chairman
of the Buffalo and Fort Erie Public Bridge Authority.
Mr. Koessler served on the Board for eight years. He was devoted
to Buffalo and Western New York; a very involved civic leader
serving on numerous boards and committees and donating
generously to many philanthropic causes.
I N M E M O R I A M

BUFFALO AND FORT ERIE PUBLIC BRIDGE AUTHORITYmobile.peacebridge.com | peacebridge.com
100 Queen StreetFort Erie, ON L2A 3S6
905 -871-1608
1 Peace Bridge PlazaBuffalo, NY 14213-2494
716 -884 -6744