budget planning supplementary information report - dec 13
TRANSCRIPT


Attachment A
Responses to Council’s Requests for Information regarding 2011/12 and 2012/13 Budget
and Business Plan Framework.
Fiscal Theme Index
# Source Question
1 McCluskey Entertaining?
2 Clerk A request for costing for in house snow removal compared to contractor snow removal
3 Clerk How HRM can consider anticipated growth in a smart, sustainable economic manner
4 Clerk How supplementary funding will this affect budget
5 Clerk Stress the requirement for bilateral funding from the Province, ie. Education
6 Uteck Supplementary funding- i will make the motion that we move to disband.. (are we still
bound by the 10% cut?)
7 Blumenthal Is there a risk the Provincial funding reduction for school boards will lead to increased
costs through supplementary or mandatory education?
8 Uteck Wants to know impact of changes in Supp Ed before we come back in January. We could
tell them what a 10% or 20% reduction would equate to, plus how much it currently is,
what the rates are, and would be projected to be if we continue it status quo.
9 Clerk Commercial tax impacts and the work on the Commercial Tax Reform
10 Sloane Wants to know what would happen if commercial taxes were equal across all commercial
centres.
11 Watts How are we going to address the question on slide 25 of “what does a competitive tax
burden look like?”
12 Watts I would like to have the tax increase for property assessed starting at $100,000 and rising
every $50,000 til $600,000 of the $13 million gap and also a gap of $7.5 million – using
urban, suburban and rural tax rates.
13 Fisher Could we flesh our what we meant by ways we can mitigate the impacts of the
assessment cap and what opportunities there are around this?
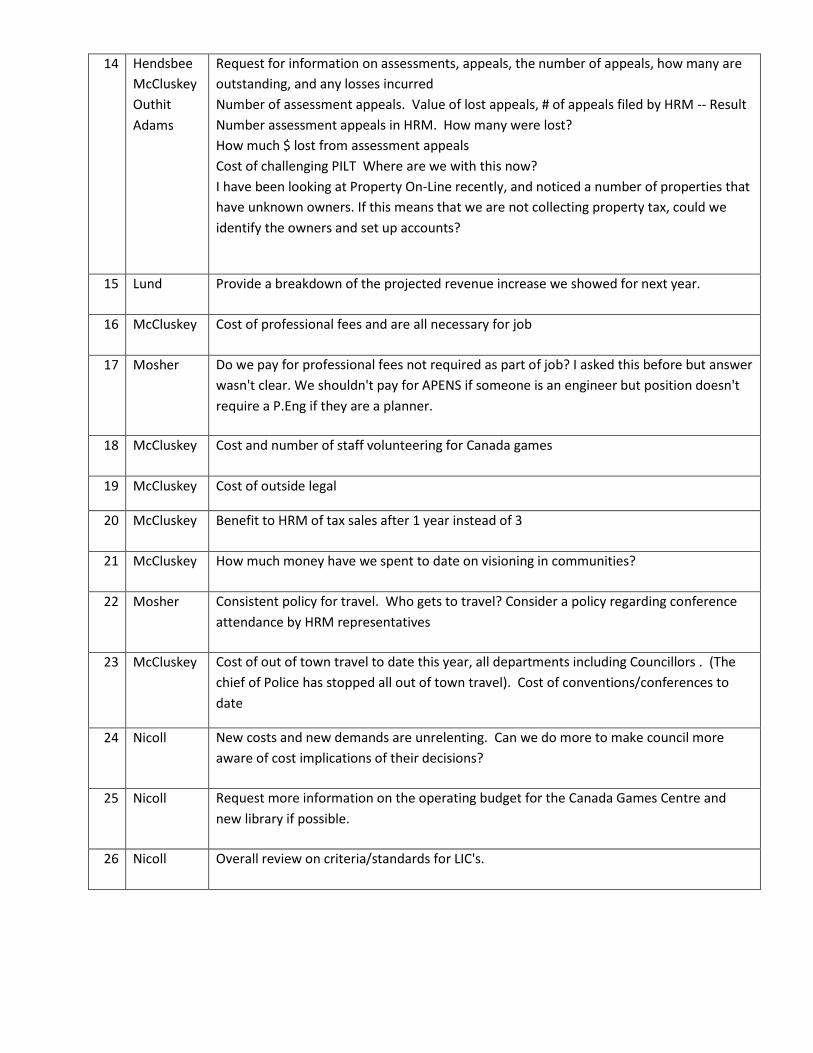
14 Hendsbee
McCluskey
Outhit
Adams
Request for information on assessments, appeals, the number of appeals, how many are
outstanding, and any losses incurred
Number of assessment appeals. Value of lost appeals, # of appeals filed by HRM -- Result
Number assessment appeals in HRM. How many were lost?
How much $ lost from assessment appeals
Cost of challenging PILT Where are we with this now?
I have been looking at Property On-Line recently, and noticed a number of properties that
have unknown owners. If this means that we are not collecting property tax, could we
identify the owners and set up accounts?
15 Lund Provide a breakdown of the projected revenue increase we showed for next year.
16 McCluskey Cost of professional fees and are all necessary for job
17 Mosher Do we pay for professional fees not required as part of job? I asked this before but answer
wasn't clear. We shouldn't pay for APENS if someone is an engineer but position doesn't
require a P.Eng if they are a planner.
18 McCluskey Cost and number of staff volunteering for Canada games
19 McCluskey Cost of outside legal
20 McCluskey Benefit to HRM of tax sales after 1 year instead of 3
21 McCluskey How much money have we spent to date on visioning in communities?
22 Mosher Consistent policy for travel. Who gets to travel? Consider a policy regarding conference
attendance by HRM representatives
23 McCluskey Cost of out of town travel to date this year, all departments including Councillors . (The
chief of Police has stopped all out of town travel). Cost of conventions/conferences to
date
24 Nicoll New costs and new demands are unrelenting. Can we do more to make council more
aware of cost implications of their decisions?
25 Nicoll Request more information on the operating budget for the Canada Games Centre and
new library if possible.
26 Nicoll Overall review on criteria/standards for LIC's.

27 Nicoll Why are we budgeting more than we can actually spend each year? Is it realistic to try to
grow a municipality based on CPI? Are current projected expenditure requirements
sustainable at $11.4 m? During the presentation at Council on this particular slide, it was
noted "we don't have time and resources? Please elaborate in that regard. MULTIPLE
QUESTIONS
28 Outhit
Blumenthal
HRM owned vehicles including where are they used and is and where there is a need for
HRM vehicles. Vehicles - Of the 1200 vehicles, do we really need them? Vehicles... who
has vehicles? who can take them home, what are our policies?
29 Rankin Details on Boots on the Street Program and if possible confirmation of our assumption of
continued funding
30 Rankin Need to be able to discuss tax burden on the 13th and 14th
31 Sloane Status of increasing development related fees and work of Harry Kitchen and Enid Slack?
32 Sloane Parking - when are parking fees coming back and what are we proposing?
33 Uteck Woodlawn library- why is library expected to absorb the taxes assoc. with rent?
34 Watts Slide 41 – I would like to see a breakdown in what actually is police overtime? Where
are the police being used overtime – ie concerts on the common, student related issues in
the south end, etc?
35 Watts Please provide information about any decisions council has made since we passed the
budget this year that increased the budgets of any departments.please indicate who
initiated the request (ie a council decision or from the business unit itself for transit,
police, winter operations, etc). If it is easy to provide I would like to see what requests
there were for 2009.
36 Watts Need to have a clear message about impact of residential suburban growth on the capital
and operating budget. I do not want to have this discussion every year of reducing
services, raising taxes, not taking on new projects without a clear understanding of how
new residential development is impacting both parts of our budget. Operating costs need
to be defined and clear so that with the CCS and LICs and area rates for capital projects
(like community centres etc) have a clear cost associated with them in the long term for
all of taxpayers given the operating and recapitalization costs. There was some reference
in the Nov 23 presentation about the need to restrain growth – can staff be more explicit
about this please. I don’t want to keep hitting the wall.let’s build the community we want
and need without creating walls.

37 Watts On slide 33 I would like more information on various costs recovery opportunities – what
are they? List the development permit fees and what specifically are the proposed hikes?
38 Watts Can we see an exact budget for the Mayor’s office – number of staff and job descriptions,
discretionary funds, PR, hosting etc. At the very least why should the Mayor have capital
funds – capital investments should only be done through the local councillor so that there
is no overlap and that there is a plan – apparently the Mayor funded the batting cage at
Larry O’Connell and I, as the local councillor, did not even know it was going in – how and
why did and can this happen?
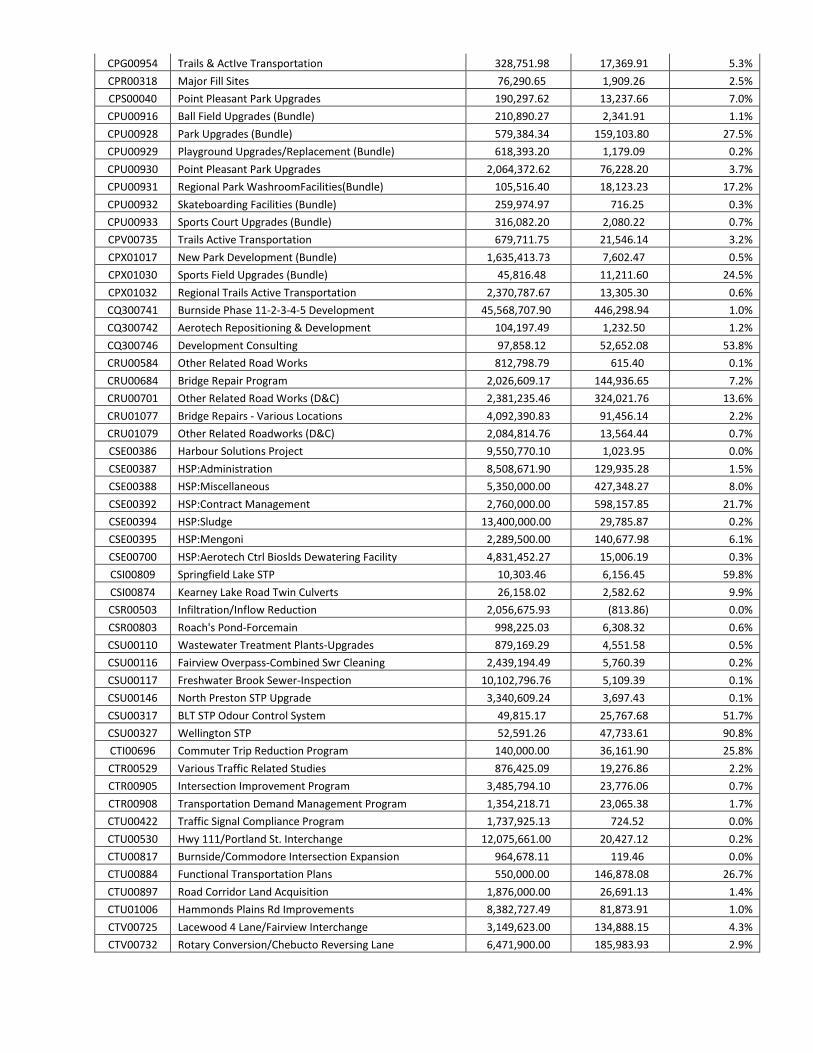
39 Wile Wanted information on how much we spend on consultants
40 Wile Wanted information on how much we spend on overtime, and where it is spent
41 Clerk Consideration of reduced transit funding
42 Nicoll Increase efforts to manage consumption of commodity and utility costs (energy, diesel,
gasoline). Asphalt consumption would need its own review on consumption
management.
43 Watts Move to permit parking in strategic locations whether linked to ecoMobility or not – see
slide 34
44 Mosher Cost of external functions catered at City Hall. Can I get a breakdown of these, perhaps by
HRM event, New Year's Levee and non-hrm events. What we would we save by
eliminating non -HRM
45 Mosher Cost of promotional items purchased by HRM (including Councillors Office and all
departments, give sways,etc). How much will we save to eliminate all?

46 Mosher Staff Christmas parties - how much do these cost per department? We have an overall
Christmas party, duplication of questionable expense.
47 Mosher How much money did we spend/save by the smart car program?
48 Mosher What is the total cost of our involvement in UNSM (including hosting conferences, partial
payment of external staff, attending conferences, etc ). Are receiving value for this
money?
49 Mosher Area rates - do they completely actual costs, including costs to administer?
50 Clerk Consider area rates for services, ie. solid waste, policing
Human Resource Theme Index
Index Source Question
1 Lund Asked on slide 18 why the compensation cost for Transit, Fire, Police almost double in
the last 10 years, when the FTE increase is only 349?
2 Blumenthal Transit.. how many management staff are there, versus workers? Would like to see
an audit done of transit by MAG
3 Clerk A request for the number of management positions in relation to non management
staff
4 Clerk The number of overtime hours including information on whether can split shifting be
considered
5 Mosher Overtime - the total amount overall and per business unit. Some of my specific
comments included: are planning staff and other staff that are required to attend
evening council meetings and/or public meetings paid overtime? And, if so can we
have split shifts or staggered hours, or time in lieu instead of overtime
6 Lund What % of increases in compensation is driven by collective agreements? Could we
show a breakdown of last five years % increase by collective agreement? (and NU I
presume)

7 McCluskey Break down of the vacancy list.
Vacancy management saving of $3.5m Which departments and how much in each
department.
8 Nicoll Since compensation/benefits are main drivers, I would like more information on
vacancy management. Are there opportunities to incorporate this with the current
succession plan? Are there opportunities to reduce personnel without a negative
impact on productivity? Are some business units overstaffed while others are
understaffed? Are there opportunities to retrain?
9 Nicoll Staff increased by 404 in the last six years. Was there that much more work created
over the same time period?
10 Outhit Wants a breakdown of how many people are eligible to retire, and when. Vacancy
Management including how many retirees over the next couple of years with a
breakdown of numbers and the areas affected by retirees; a breakdown of position
vacancies to Council; and is there a mentorship program in place
11 Uteck a base salary comparison of say 5 departments to the private sector- real estate,
planner (senior), engineer, public works manager, (compared to a comparable private
sector) and legal (5 years experience as an example)Referred to email re: positions
with starting salaries higher than market. Asked if we could pick 10 positions and
compare them to the private sector. We should likely do something more broad.
HRM starting salaries.... are they out of line with other organizations? Are we striving
to be Employer with the highest salaries?
12 Watts Please provide a breakdown on the new FTEs in transit, police and fire – which
department is getting the new FTEs and where are they be deployed?
13 Wile The number of union negotiations are coming forward over the next two years
14 Nicoll Consider exploring on-line training versus other training where possible.
15 Mosher The amount of overtime for Supervisors per business unit. Is there another way to
conduct business to avoid overtime completely or at least reduce to Supervisors who
are paid more? Example- allegations of Supervisors being called in to close up fire
stations when an employee who is there working could do it.

16 Mosher Previously I requested a staffing analysis, looking at our upper management
structure. Do we need this number of managers, and if so, are they in the appropriate
business unit? Do we need this size of executive management team?
17 Mosher The participation rate of edo's and total number of employees and total number of
days. Do we know how the edo's affect the workload of others? Is there a policy for
edo participation within a department?
18 Mosher Do we have a policy for the number of staff attending conferences, such as AMA?
Similar to FCM, can a certain number go each year instead of everyone? When
people do attend conferences do they provide a report back to their colleagues to
share the information.
19 Mosher New business units have been created - have they resulted in more staff, and if so at
what cost? Example: Infrastructure and Asset Management, Corporate
Communications, etc. Is there a measurement of success?
20 Mosher Do we pay overtime to staff to work on floats, etc at community events. Can some of
this work be done by community volunteers?
21 Lund Is it true that if someone is in Acting position, when someone else takes position and
Acting person reverts back to original position, that person's salary does not revert
back accordingly
Process and Service Theme Index
Index Source Question
1 Sloane Is the Dec 13th/14th meeting going to be in-house?
2 Hum We need to be clear of the format for the 13th & 14th
3 Clerk Council Focus Areas vs. CAO Focus Areas, do they work together
4 Nicoll I would like to see a balance of how we grow the municipality between a visionary
process and a management process. I do believe this is the role of the CAO. It is
ultimately the CAO who takes the vision of Council (Focus Areas) and provides the
management (Fiscal Responsibility/Employer of Choice) to make it become reality
5 Blumenthal We could cut back on "Communications" positions. Why do we have so many people
doing "Communications" throughout the organization, rather than one designated
office?.

6 McCluskey Corporate planning framework and its relation to communities' expectations, as well
as a plan to the community aware of costs
7 McCluskey Destination Halifax/GHP. When will a report come back on that? Any savings?
8 Mosher Why is analysis required around merging Mayor's Office and Councillors Support
Office?
9 Outhit What functionality or services can be outsourced possibly? Looking at our
demographics, more use of contractors and consultants may have to occur in future
10 Mayor Investigate outsourcing Human Resources, Payroll, and I/T
11 Blumenthal Contracting out. Are there services contracted out we should look at taking in-
house?
12 McCluskey Savings by having library use our HR, finance depts, etc.
13 Nicoll Rationalization of tools and fleet (service review) to include various business units
and trades.
14 Watts Slide 37 – what is meant by light fleet – what is not included here and why?
15 Nicoll Are we exploring all opportunities to "work smarter not harder" (invest in
systems/processes/workforce development)? And can we also consider to aim to
"work smarter AND harder"? Consideration be given to train staff with time
management and budgeting.
16 Nicoll Perhaps Regional Council could be provided with a reality check with money matters
more often than is presently done. Consider how this could be achieved.
17 Outhit As an alternative to the open house sessions would like to go back to having business
units present their budgets.
18 Outhit What opportunities for "back-office" sharing
19 Sloane Park Patrol - what were the impacts of eliminating that one position?
20 Sloane Expressed worry for the relationship with the Arts Community if we do anything with
Public Art funding.

21 Watts I am getting a lot of calls about streetcleaning services – some people are saying that
they do not get weekly service now so why should this be expected? How important
is the streetcleaning service to the storm water system – is it needed to move debris
that will reduce our costs downstream?
22 Watts How does winter works affect summer works in terms of staff commitment and
hours?
23 Nicoll Identify which service reductions would yield the most significant dollars.
24 Watts Please provide a schedule for all reviews being done – whether they are service
reviews or audits by the Auditor General and anticipated dates of when they will be
completed (Publication review, fleet, economic development governance, facility
review – all the ones mentioned in the attachment to Nov 23 staff report under the
title Expenditure Reduction Opportunities). Please link this to the other major
planning exercises we are undertaking such as the regional plan review and the new
economic plan – trying to understand when we will have information on other
efficiencies that can happen and also how we are tackling economic development.
Also link with Capital Ideas initiative.
25 Mosher Have we explored technology options such as thin client, so we reduce energy and
capital costs? There are good protocols locally, in U.K., etc
Asset Themed Questions
# Source Question
1 Blumenthal What is the status of the Bloomfield plan?
2 Clerk A list of upcoming capital works projects
3 Clerk The status of building renovations relating to cost cutting, ie. energy efficient lighting,
lower heat
4 McCluskey A list of HRM-owned facilities be provided to Council including how many facilities have
had replacement costs determined
5 Sloane What are we doing to make building renovations more sustainable? IE lights that turn
off when no one is there, energy efficiency

6 Uteck Land Holdings- detailed list please - 259.7 million- why only 3 transactions in last
quarter?

Fiscal Themed Questions
Question - 1 Question re: Entertaining
HRM does not budget specifically for entertainment, as such expenditures are very infrequent in nature. The Employment Expense Reimbursement Policy states that Entertainment/Hospitality Expenses for conducting municipal business with the following are eligible for reimbursement subject to appropriate authorization: Visiting elected officials from other levels of government and municipalities “Dignitaries”, Senior administrative officials from other municipalities “Dignitaries”. Only employees at the M4 Level and above are eligible to claim entertainment/hospitality expenses where it is a functional responsibility of the employee’s position to provide meals, beverages, refreshments, or participate or provide for receptions, shows, or performances, in the conduct of municipal business. These expenditures must be preauthorized in writing by the Director, CAO or DCAO. When such expenses are incurred, the Employer related purpose of the entertainment/hospitality and the persons entertained must be identified on the claim form, and receipts must be provided. The cost elements typically used to charge these types of expenditures to are local travel, or meals. Question - 2 A request for costing for in house snow removal compared to contractor snow removal
This is a complex question and staff is unable to answer it at this time. The Winter Works Service Review should help to better inform Council of the intricacies of in-house vs. contract snow removal. The Service Review is expected to be presented to Council in February 2011. There is some dated
information available on this topic as a result of previous reviews done on the winter works programs.
Question 3 – How can HRM consider anticipated growth in a smart, sustainable economic manner?
HRM’s Regional Plan sets out guidelines meant to ensure growth occurs in a smart and sustainable
manner, and the Economy and Finance section of the Regional Plan in particular addresses this question.
A key deliverable of the Regional Plan was a Finance Functional Plan to address a revenue strategy
(including property taxes and other forms of revenue), broad fiscal policy, and a plan to address the
financial impacts of implementing the Regional Plan. HRM has been working toward various aspects
that will eventually form a Finance Functional Plan. The Tax Reform project resulted in implementation
of a revised transit tax structure, work on Commercial tax structure is occurring as part of the Economic
Strategy renewal, Fiscal Health Indicators were adopted in May 2009, and HRM’s Debt Strategy was
revised in November 2009. Other work required to complete a Finance Functional Plan that will
eventually update HRM’s Multi-Year Financial Strategy are review of Reserve and Capital policies. There
is work underway to bring forward new CCCs (capital cost contribution charges), and updates to policies
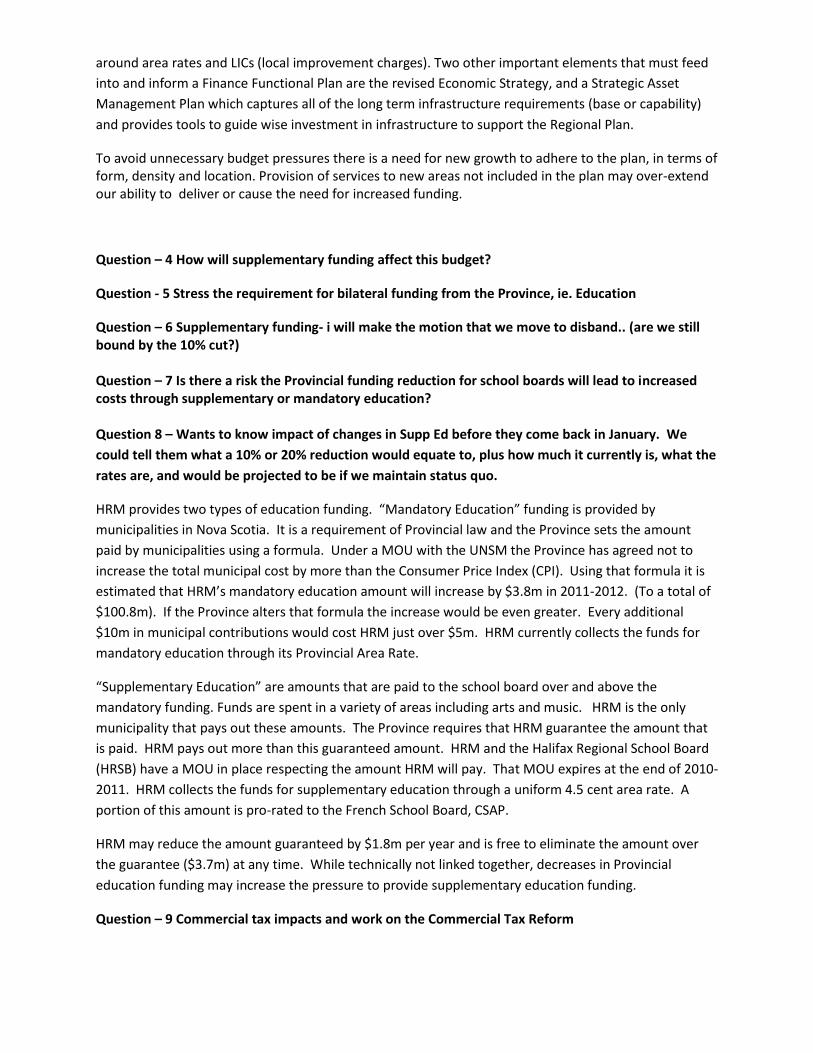
around area rates and LICs (local improvement charges). Two other important elements that must feed
into and inform a Finance Functional Plan are the revised Economic Strategy, and a Strategic Asset
Management Plan which captures all of the long term infrastructure requirements (base or capability)
and provides tools to guide wise investment in infrastructure to support the Regional Plan.
To avoid unnecessary budget pressures there is a need for new growth to adhere to the plan, in terms of form, density and location. Provision of services to new areas not included in the plan may over-extend our ability to deliver or cause the need for increased funding.
Question – 4 How will supplementary funding affect this budget?
Question - 5 Stress the requirement for bilateral funding from the Province, ie. Education
Question – 6 Supplementary funding- i will make the motion that we move to disband.. (are we still bound by the 10% cut?) Question – 7 Is there a risk the Provincial funding reduction for school boards will lead to increased costs through supplementary or mandatory education? Question 8 – Wants to know impact of changes in Supp Ed before they come back in January. We
could tell them what a 10% or 20% reduction would equate to, plus how much it currently is, what the
rates are, and would be projected to be if we maintain status quo.
HRM provides two types of education funding. “Mandatory Education” funding is provided by
municipalities in Nova Scotia. It is a requirement of Provincial law and the Province sets the amount
paid by municipalities using a formula. Under a MOU with the UNSM the Province has agreed not to
increase the total municipal cost by more than the Consumer Price Index (CPI). Using that formula it is
estimated that HRM’s mandatory education amount will increase by $3.8m in 2011-2012. (To a total of
$100.8m). If the Province alters that formula the increase would be even greater. Every additional
$10m in municipal contributions would cost HRM just over $5m. HRM currently collects the funds for
mandatory education through its Provincial Area Rate.
“Supplementary Education” are amounts that are paid to the school board over and above the
mandatory funding. Funds are spent in a variety of areas including arts and music. HRM is the only
municipality that pays out these amounts. The Province requires that HRM guarantee the amount that
is paid. HRM pays out more than this guaranteed amount. HRM and the Halifax Regional School Board
(HRSB) have a MOU in place respecting the amount HRM will pay. That MOU expires at the end of 2010-
2011. HRM collects the funds for supplementary education through a uniform 4.5 cent area rate. A
portion of this amount is pro-rated to the French School Board, CSAP.
HRM may reduce the amount guaranteed by $1.8m per year and is free to eliminate the amount over
the guarantee ($3.7m) at any time. While technically not linked together, decreases in Provincial
education funding may increase the pressure to provide supplementary education funding.
Question – 9 Commercial tax impacts and work on the Commercial Tax Reform

Question – 10 What would happen in commercial taxes were equal across all commercial centres?
Question 11 – How are we going to address the question on slide 25 of “what does a competitive tax
burden look like”?
The answers to these questions are still under review. Staff is currently looking at the commercial
taxation system through both the “Economic Prosperity” initiative and the Strategic Urban Partnership.
The current commercial tax system is based on taxable assessment. There is an urban/suburban
commercial tax rate and a rural commercial tax rate. There are also a series of commercial area rates.
Some of the issues that are being explored are:
- The relationship between the commercial tax rate and the residential tax rate (ie “Commercial
Multiplier”). Currently, the commercial tax rate for municipal services is 3.77 times higher than
the comparable residential tax rate. With changes in transit tax, business occupancy, the
assessment cap and the Provincial area rate, this relationship has become increasingly complex
and difficult to follow. Staff are looking for new ways to define the relationship.
- Does the commercial tax system discriminate against certain types of commercial businesses or
against businesses in certain geographic areas of the municipality. For example, are smaller
firms disadvantaged or are firms in high-growth areas disadvantaged. Is there are relationship
between land-use planning and commercial taxation that can be better defined. Or, could there
be a stronger link to municipal services. An “equal” tax system could be established in different
manners. For instance, the rates could be equalized, or the tax rate might be applied in a
different manner. For example, taxes on frontage, on area, on services or on density/height.
The full impact of these types of options has not been calculated.
- How do commercial taxes in the municipality compare to tax rates and tax bills elsewhere? Is
this a competitive issue? Is there an economic impact?
- Should tax rates differ by commercial sector? For example, should there be one tax rate for
office towers and another for retail or warehouse operations. Could these rates be used to
support land use planning in the industrial parks, commutersheds and Regional Center.
Question – 12 I would like to have the tax increase for property assessed starting at $100,000 and rising every $50,000 til $600,000 of the $13 million gap and also a gap of $7.5 million – using urban, suburban and rural tax rates.

Urban Suburban Rural
100,000 27 26 26
150,000 41 39 39
200,000 54 52 52
250,000 68 65 65
300,000 81 78 78
350,000 95 91 91
400,000 108 104 104
450,000 122 117 117
500,000 135 130 130
550,000 149 143 143
600,000 162 156 156
Residential
For $13m (using 2010 Gen Tax Rates,
Assessment Roll and Structure)
Urban Suburban Rural
100,000 16 15 15
150,000 24 23 23
200,000 32 30 30
250,000 40 38 38
300,000 48 45 45
350,000 56 53 53
400,000 64 60 60
450,000 72 68 68
500,000 80 75 75
550,000 88 83 83
600,000 96 90 90
Residential
For $7.5m (using 2010 Gen Tax Rates,
Assessment Roll and Structure)
Question – 13 Could we flesh out what was meant by ways we can mitigate the impacts of the
assessment cap and what opportunities are around this?
The assessment cap does not apply to all properties. Recently built or sold homes, larger apartment
buildings and properties owned by non-residents are excluded from the cap. As a result these

properties have much higher assessment growth than others and there is a growing tax burden on these
properties. This is true even as the tax burden on most homes is held to CPI. In the longer run, this may
have an impact on homes sales and construction.
The most effective solution to dealing with this issue is to alter the cap itself. For instance, if the
province included all properties in the cap, then all properties would be dealt with in a similar manner
and would see similar changes in tax burden.
Another possible solution is for HRM to provide its own cap on the tax paid by newly built or newly sold
homes. This would likely be more complex than an amendment to the cap legislation. There are likely
several ways in which this might be done under the current HRM Charter. Staff are currently reviewing
the options that could be available to Council
Question – 14 Request for information on assessments, appeals, the number of appeals, how many
are outstanding, and any losses. Request for information on Payments in Lieu of Taxes (PILTS)
HRM is on track in terms of current year appeals to date as we budgeted $2M, and are at approximately $2,044,927 (see table below). The amounts outstanding are going through the court process and most likely will carry-over to next year. We also started 2010 with a balance in the valuation allowance of $1.2M for prior year appeals outstanding. As of close of Nov we have processed $700K in adjustments. This was allowed for so no overall impact to current year revenue. Finance is working with legal to address the owner unknown issues. This is more of a collection/cash flow issue as opposed to new revenue as we bill taxes to these accounts. Legal has spent approx. $35,000 this year on federal appeals.
HRM appealed 11 accounts in 2010
Halifax Regional Municipality
2010 Assessment Roll Appeals
AAN Location Sale Date Sale $$ 2010 Roll Value Sale/Value Variance
05458935 255 Lacewood Dr. 1-Aug-07 9,850,000$ 7,537,500$ 2,312,500-$
04674316 6065 Cunard St. 10-Sep-07 1,491,500$ 619,000$ 872,500-$
00768774 11 Simmonds Dr. 28-Sep-07 9,848,332$ 3,687,100$ 6,161,232-$
00132063 20 Pettipas Dr. 28-Sep-07 15,720,569$ 3,737,900$ 11,982,669-$
08990409 141 Norm Newman Dr. 1-Oct-07 1,075,000$ 156,100$
00661848 600 Portland St. 1-Oct-07 594,800$
Total 1,075,000$ 750,900$ 324,100-$
01622749 1226 Cole Harbour Rd. 22-Oct-07 1,000,000$ 749,000$ 251,000-$
00238376 1748 Bedford Hwy. 8-Nov-07 1,473,000$ 683,900$ 789,100-$
05196272 1 Mills Dr. 4-Dec-07 1,475,000$ 1,022,100$ 452,900-$
00661864 610 Portland St. 13-Dec-07 1,125,000$ 670,100$ 454,900-$
09664254 109 Williams Ave. 18-Dec-07 4,300,000$ 3,214,600$ 1,085,400-$
24,686,301-$

HRM 2010-11 Appeals - Dec 8, 2010
Residential - Dwellings 2010 Assessment Roll
Total # of appeals filed 2,160
Total value of appeals 471,034,100$
Total # amended 1,259
Total Value Amended 37,334,500$
Appeal Loss Ratio 8%
Residential Tax Rate Municipal Services 0.7088
Residential Dwelling Tax Loss 264,627$
Residential - Apartments
Total # of appeals filed 303
Total value of appeals 996,720,600$
Total # amended 120
Total Value Amended 19,357,400$
Appeal Loss Ratio 2%
Residential Tax Rate Municipal Services 0.7088
Residential Apartments Tax Loss 137,205$
Total Revenue Loss from Residential Appeals 401,832$
Commercial
Total # of appeals filed 849
Total value of appeals 1,629,273,700$
Total # amended 341
Total Value Amended 50,448,100$
Appeal Loss Ratio 3%
Commercial Tax Rate Municipal Services 3.2570
Commercial Tax Loss 1,643,095$
Grand Total Tax Loss 2,044,927$
Question – 15 Provide a breakdown of the projected revenue for next year.
The initial Framework developed in November each year is based only on planning assumptions.
The projected revenue is based on an assumption of a 2% increase in overall property tax revenue. It
was calculated by simply multiplying last year’s property tax revenue by 1.02. This percentage was
chosen based on the then current CPI level. The attached illustrates the components involved in the
calculation.
We have been recently informed that the CPI level to be used will be 2.9% and that commercial
assessment levels will rise in the range of 6% or possibly higher.

We are not in a position to provide an adequate estimate of the financial impact of these changes until
the assessment roll is received late in December. However, an initial rough calculation places the
positive impact of these changes at, perhaps, an additional $6 million dollars.
We do expect to also add additional expenses to our framework over the course of the next months, so
this additional revenue is not likely to be fully available to address the anticipated shortfall.
Regular changes to our Framework continue, as we gather more and more information, with additions
to both revenues and expenses until we present the Proposed Budget.
Revenue Business Planning & Information Management ($435,700) ($584,000) ($584,000) $0
Community Development ($15,943,917) ($16,430,877) ($16,430,877) $0
Finance ($8,353,100) ($10,831,383) ($10,831,383) $0
Fire & Emergency Services ($544,500) ($653,500) ($653,500) $0
Fiscal Services ($578,755,839) ($589,723,518) ($597,153,418) ($7,429,900)
Area Rate Revenue ($134,664,540) ($132,137,160) ($132,137,160) $0
Area Rate LIC Commercial ($386,500) ($254,930) ($254,930) $0
Area Rate LIC Residential ($940,000) ($933,796) ($933,796) $0
Area Rate Revenue ($133,338,040) ($130,948,434) ($130,948,434) $0
Deed Transfer Tax ($29,430,000) ($30,000,000) ($30,000,000) $0
Deed Transfer Taxes ($29,430,000) ($30,000,000) ($30,000,000) $0
HRWC Dividend ($3,700,000) ($3,700,000) ($3,700,000) $0
Halifax Regional Water Commission Divide ($3,700,000) ($3,700,000) ($3,700,000) $0
Interest Revenue ($5,715,000) ($3,632,000) ($3,632,000) $0
Interest Revenue - Capital Charges ($413,000) ($440,000) ($440,000) $0
Interest Revenue - Investments ($715,000) $0 $0 $0
Interest Revenue - Other ($165,000) ($170,000) ($170,000) $0
Interest Revenue - Taxes ($2,222,000) ($2,510,000) ($2,510,000) $0
Investment Income ($2,200,000) ($512,000) ($512,000) $0
Other Revenue ($2,102,607) ($1,775,971) ($1,775,971) $0
Miscellaneous Revenue ($455,000) ($430,465) ($430,465) $0
NSF Chq Fee ($10,000) ($10,000) ($10,000) $0
Recoveries from External Parties ($1,637,607) ($1,335,506) ($1,335,506) $0
Parking Meters ($2,625,000) ($2,630,000) ($2,630,000) $0
Parking Meters ($2,625,000) ($2,630,000) ($2,630,000) $0
Payments in Lieu of taxes ($29,514,900) ($28,842,098) ($28,842,098) $0
Grant in Lieu - Canada Post ($558,000) ($627,160) ($627,160) $0
Grant in Lieu - CBC ($300,900) ($297,000) ($297,000) $0
Grant in Lieu - Citadel ($1,610,700) ($1,546,000) ($1,546,000) $0
Grant in Lieu - Federal ($17,651,600) ($18,081,000) ($18,081,000) $0
Grant in Lieu - Halifax Ports Corporatio ($1,935,200) ($1,894,000) ($1,894,000) $0
Grant in Lieu - National Research Counci $0 ($71,000) ($71,000) $0
Grant in Lieu - Other ($1,180,400) ($11,438) ($11,438) $0
Grant in Lieu - Provincial ($6,007,700) ($6,029,500) ($6,029,500) $0
Grant in Lieu - Via Rail ($140,600) ($167,000) ($167,000) $0
Grant in Lieu - WCB ($129,800) ($118,000) ($118,000) $0
Rental & Leasing ($1,554,100) ($1,554,100) ($1,554,100) $0
Parking Rentals ($1,554,100) ($1,554,100) ($1,554,100) $0
Tax Agreements ($3,830,000) ($8,734,940) ($8,734,940) $0
Halifax International Airport Tax Offset $1,494,000 $1,600,000 $1,600,000 $0
Tax Agreement - Heritage $0 ($140,000) ($140,000) $0

Tax Agreement - Imperial Oil $0 ($3,608,000) ($3,608,000) $0
Tax Agreement - Maritimes Northeast $0 ($1,248,000) ($1,248,000) $0
Tax Agreement - MT&T ($2,636,000) ($2,600,000) ($2,600,000) $0
Tax Agreement - North Atlantic Marine $0 ($6,440) ($6,440) $0
Tax Agreement - NSLC ($550,000) ($570,000) ($570,000) $0
Tax Agreement - NSPI ($2,132,000) ($2,162,500) ($2,162,500) $0
Tax Agreement - Other ($6,000) $0 $0 $0
Tax Revenues ($362,737,292) ($373,676,091) ($381,105,991) ($7,429,900)
Allowance for Commercial Appeals $1,143,000 $1,143,000 $1,165,860 $22,860
Allowance for Residential Appeals $417,000 $417,000 $425,340 $8,340
Allowance for Resource Appeals $14,000 $14,000 $14,280 $280
Business Occupancy Appeals $123,000 $123,000 $125,460 $2,460
Business Occupancy Taxes ($14,881,000) ($5,079,000) ($5,180,580) ($101,580)
Capital Charges ($2,454,892) ($2,363,891) ($2,363,891) $0
Commercial Property Taxes ($167,207,000) ($175,632,000) ($179,144,640) ($3,512,640)
Fire Protection ($4,969,000) ($9,189,000) ($9,372,780) ($183,780)
Residential Property Taxes ($173,858,600) ($181,990,000) ($185,629,800) ($3,639,800)
Resource Property Taxes ($1,257,000) ($1,302,000) ($1,328,040) ($26,040)
Transfer - General Rate $37,800 $27,400 $27,400 $0
Transfer - Urban Rate $155,400 $155,400 $155,400 $0
Transfers from other Gov'ts ($2,882,400) ($3,041,158) ($3,041,158) $0
Public Housing Amortization ($82,400) ($41,158) ($41,158) $0
Unconditional Grants NS (Other) ($2,800,000) ($3,000,000) ($3,000,000) $0
Halifax Regional Library ($4,525,900) ($5,310,801) ($5,310,801) $0
Halifax Regional Municipality Police Services ($8,567,400) ($9,004,900) ($9,004,900) $0
Human Resources $0 ($80,000) ($80,000) $0
Infrastructure & Asset Management ($70,000) ($129,600) ($129,600) $0
Legal Services & Risk Management ($144,000) ($228,000) ($228,000) $0
Office of the Chief Administrator ($287,400) ($116,400) ($116,400) $0
Transportation & Public Works ($85,991,849) ($93,480,845) ($93,480,845) $0
Revenue Total ($703,619,605) ($726,573,824) ($734,003,724) ($7,429,900)
Question - 16 Cost of professional fees and are all necessary for job
By professional fees, it is assumed that this refers to membership dues paid to maintain professional
designations and certifications, or fees/dues to belong to associations required by work function.
$387,720 was budgeted in Memberships and Dues for 2010, and actual spent to date as of December 9,
2010 is $280,698. A survey of business unit practices indicate that membership dues and fees are
approved on the basis of job function, specific relevance to job function, and benefit or value to HRM.
Payment of memberships and dues is of increasing importance in a competitive employment market if
HRM wishes to be an Employer of Choice.
If this question was meant to refer to professional fees, (fees paid to outside professionals to acquire
specific services), $807,387 was budgeted in 2010 and $727,130 has actually be spent as of December 9,
2010.

Question - 17 Do we pay for professional fees not required as part of job? I asked this before but
answer wasn't clear. We shouldn't pay for APENS if someone is an engineer but position doesn't
require a P.Eng if they are a planner.
Our practice is to pay for professional fees specifically related to job function. (See answer above)
Community Development Comment - The total cost of professional fees (membership dues) paid within
Community Development is $31k. Membership in the Canadian Institute of Planners is identified in the
Planners Job Description as a prerequisite for the job. Also, in 2006, the Province of Nova Scotia
enacted legislation on which is based the Licensing of Professional Planners in Nova Scotia. It is
fundamental to their work that planners achieve and maintain appropriate credentials. Engineering
certifications are required for the jobs of which they are paid.
IAM Comment - In some instances professional certification it is a requirement of the job and necessary
in order to produce work in house. Loss of the professional designation of those staff members would
require that this work be moved to outside consultants who do have the required professional
certification. However, there are other staff who are not required to maintain profession certification as
a job condition even though the job description identifies professional certification as desirable. In some
of these instances HRM financially assists these professionals in maintaining their professional
designation and in turn HRM benefits significantly from the continued learning and personal effort that
is a part of the requirement of professional certification. Maintaining current knowledge in professional
fields of expertise is fundamental not only to the ability of HRM staff to generate work internally but
also to their ability to review and comment on the work submitted by other professionals for HRM
consumption. IAM is forecasting expenses of $4000 in this category for 2010/11.
TPW Comment – TPW has staff that are required to maintain certification which is required for their job
functions. Solid Waste resources and Traffic and Right of Way services have approximately 10
professionally certified engineers. The dues are paid for these staff and are estimated to be
$3000/year.TPW has additional staff in Metro Transit that require planning association dues ($100/staff)
or NS Gov't Licencing ($200/staff) related to their jobs. The Sr Real Estate Officer in Real Estate and
Facility Services is required to be registered with the Appraisal institute of Canada ($1000/staff).
Finance Comment – Finance has staff with accounting designations who are required to have the
designation as part of their job function, and pays the associated professional memberships with the
Certified General Accountants Association, Canadian Management Accountants Association, or
Chartered Accountants Association. Additionally, as part of succession planning Finance assists staff in
the professional development towards achievement of designations through payment of memberships
dues. The other memberships beneficial to certain positions are membership in the Association of
Municipal Administrators, NS Tax Collectors Association, and Government Financial Officers Association.
Total budget for membership dues for Finance is $22,350 in 2010, and actuals spent to date are $15,585.
It is important to note that to maintain accounting designations, accountants are required to complete a
certain number of professional development hours each year and participation through the associations
mentioned above is an important method of obtaining professional development and ensuring the skills
of the finance professionals stay sharp.

Other business units with significant professional fees (memberships and dues) are Legal Services and
Human Resources.
Question – 18 Cost and number of staff volunteering for Canada games
Employer information was not collected for 2011 volunteer applications. The Host Society did a search through the database, looking for 490 telephone numbers and halifax.ca email extensions. It looks like there are approximately 101 volunteer applicants that have one of those two as a match. It is inclusive of councilors and staff. The total number of registered volunteers today is 6,183. Volunteers will not be scheduled for games time roles until mid January, at which time they will be
required to submit an application for Special Leave approval from their Director. All approvals are
subject to operational requirements. New pay codes have been created to track and report on the # of
hours volunteered and the cost. This information will not be available until post games.
Question - 19 Cost of external legal
The total amount budgeted for legal fees within various accounts in HRM is $ 542,100 dollars. This
amount is split between nine different business units. The Business Units with the larger budgets are:
Legal $296,700 ($123,500 for legal fees, $ 173,200 for night court)
Police $135,000
Real Estate $67,000 (Business Parks $35,000, Real Estate $32,000)
Others $18,400
The Legal Services account includes work assigned to outside counsel, the majority of which is for
external prosecutors to provide night court services at a flat rate of $225/night for 14 trials per night.
The night court prosecutors undertake approximately 10,000 matters scheduled for trial / year. The
remaining fees are required to respond to a limited number of matters which in 2009/10 have included
the Symington case, the Citadel appeal and an arbitration. The Real Estate fees are in payment for
transactions for the purchase and sale of business park lots and other land including migration costs and
registration fees. This is felt to be a very cost effective use of funds. The Police funds have been used
this year to respond to the Hyde inquiry.
During the past five years the budgets for legal costs have been slowly reduced. The graph below
compares the total budget and actual cost over the last five years. A trend line has been added to
show what a 3% increase each year would represent. As shown there is a slight downward trend in cost
as more of this work is competed inside the organization and staff work to control costs.
With the exception of night prosecutions and property transaction costs, external legal fees are an
expensive means of securing legal services. Therefore to the extent possible, HRM Legal Services has
been moving as much legal work internally as is possible. We have seen in the last couple of years
marked increases in external hourly rates, but nevertheless the trend has been downward because of
the internal assumption of additional legal work. And the downward trend has been in spite of spikes in
costs from time to time demonstrating that these expenses are not easy to predict on a yearly basis and
every couple of years an issue arises which increase costs dramatically as was the case last year. Note
the 2010 actual amount represents a partial year. Staff continues to review the proper mix of internal
and external legal services to determine the best cost for this work.

$0
$200,000
$400,000
$600,000
$800,000
$1,000,000
2005 2006 2007 2008 2009 2010
Legal Fees
Budget
Actual
3% increase
Question – 20 Benefit to HRM of tax sales after 1 year instead of 3
Tax sale after one year would require many more resources. All tax accounts that meet the MGA criteria for tax sale action do receive an advanced notice of tax sale along with a $50 admin charge each year (Feb/Mar). This equates to approx 2,500 accounts. Our current resource compliment (3 staff) can handle about 150 tax sale accts for each sale. With the phase out of Bus Occ almost complete, we will be able to add another staff resource to this process.
Question - 21 How much money have we spent to date on visioning in communities?
Community visioning is supported and funded by both Community Relations & Cultural Affairs and
Community Planning divisions of Community Development. The visioning program is integrated into the
community planning program, therefore, draws on both operating and capital budgets.
Operating Budgets (D710, C730): The Community Vision program costs comprise mostly of staff resources and program administration. The following analysis is based on the average cost of administering the program from the start to today. More resources were required to develop the program. Staff Resources: 0.10 FTE (1Community Developer) = $7,000 Staff Resources: 0.10 FTE (1 Senior Planner) = $8,000 Program budget: $5000 per community (printing. advertising, venue rentals, etc.)
TOTAL OPERATING @ 6 Communities: $120,000 - NOTE: Over 110 volunteers have actively participated on Community Visioning Liaison Groups and have dedicated a total of 7442 hours which equates to a total VIK of $150K
Capital Program Budget: In accordance with the Community Planning Program defined to operationalize the Regional Plan, there are requirements for watershed, design and transportation studies to be completed in advance of detailed planning. Given that this information is important in the development of a vision, Council approved to undertake these in advance of the community vision program, where required. The following is an overview of the expenditures to date:

Design Studies Graphic design - $8000
Planning Studies: Bedford Waterfront Consultant study - $90,000 (Note: $90,000 leveraged from WDC L) Question - 22 Consistent policy for travel. Who gets to travel? Consider a policy regarding conference attendance by HRM representatives Question – 23 Cost of out of town travel to date this year, all departments including Councillors .
The HRM Employment Expense Reimbursement Policy specifies that all employees incurring expenses as a result of conducting HRM business are entitled to reimbursement; and sets out the controls and processes for reimbursement. Out of town travel only occurs when it is considered to add a strategic value to a current project/initiative being carried out within the department. For example, most business units do not support the annual attendance of conferences and only sends staff on conferences if they are deemed relevant to current projects/initiatives. All out of town travel must be approved by Directors, and in the case of Directors themselves, must be approved by the DCAO or CAO. Some travel is necessary for staff so they can obtain the required professional development hours to maintain their respective certifications. The other benefits of travel to attend conferences is to meet venders and stay up to date on the latest design and product information on equipment such as buses, and to meet counterparts from other municipal governments to exchange ideas and best practices. Out of town travel was budgeted at $437,661 in 2010/11, down from $662,588 in 2009, and actuals as of December 9, 2010 are at $382,166. These expenditures account for less than 0% of HRM’s operating budget and the largest expenditure areas are TPW, Police, and Fire on a gross basis. Question – 24 New costs and demands are unrelenting. Can we do more to make council more aware
of cost implications in their decisions?
Yes, there are ways we could improve the quality of analysis and financial reporting the support Council
decision making. To improve quality, more time would need to be permitted for development of
Council reports and to enable thorough reviews. Other things to consider as improvements would be:
changing the report template to take a broader look at budget implications, particularly for
reports that don’t impact the current fiscal year budget, but may have broad future
implications.
wherever possible, we could also start expressing budget impacts in terms of the related impact
on tax burden if Council would find this helpful.
more focus on developing alternatives, and also articulating risks
expressing operating budget impacts for all capital transactions
conducting training (in-house by Finance staff) to expand report writers’ knowledge of HRM
financial policies and processes

Question – 25 Request more information on the operating budget for the Canada Games Centre and
new library if possible.
RE: Canada Games Centre
The approved 2010/11 HRM Operating and Capital Budget included a budget of up to $1.4M in operating costs of new capital as this facility is completing construction and gets ready to open. This cost is to cover start-up costs such as hiring and training employees, paying utilities, etc. as the facility prepares to open its doors and collect its first revenues. Initial budget estimates also forecast that up to $700,000 in additional operating costs will be necessary in 2011/12 as the facility begins to generate its first revenues, but is not yet achieving sufficient revenues to balance expenses. As the user base builds, a balanced budget was projected to happen in the third year, 2012/13. These budget implications were created 18 months ago and now that the management team is in place and the Management Board recently recruited, these figures are being re-evaluated in time for the completion of the draft HRM 2011/12 budgets. The operating budget increase for the new Central Library is currently projected at $2.291 Million as follows: SGR / Central Library
Description
2010/2011
Budget
2013/2014
Budget
Central 2013/2014
Budget Increase
Salaries Regular $1,268,600 $1,481,180 $2,239,718 758,538
Benefits - Salaries 217,500 246,863 373,286 126,423
Retirement Allowance 6,700 16,575 25,064 8,488
Workers Comp 7,400 18,691 28,263 9,572
Photocopier Rental 3,900 4,200 8,400 4,200
Office Supplies 8,200 8,400 10,500 2,100
Janitorial Service 28,000 30,000 162,000 132,000
Cleaning Supplies 5,500 5,750 7,188 1,438
Heating Fuel 72,900 76,000 194,400 118,400
Electricity 46,000 48,000 298,080 250,080
Water 2,000 2,200 2,750 550

Other Building Maintenance 82,000 84,000 367,200 283,200
Library Materials 211,600 215,000 315,000 100,000
Branch Programming 2,500 2,750 4,125 1,375
$1,962,800 $2,239,610 $4,035,974 $1,796,364
Administration
Description
2010/2011
Budget
2013/2014
Budget
Central 2013/2014
Budget Increase
Regional Services 1,737,882 1,985,033 247,151
Information Technology 484,664 484,664 0
e-Learning 135,983 183,296 47,313
Maintenance and Security 140,324 341,432 201,108
$0 $2,498,853 $2,994,425 $495,572
Total Increase $2,291,936
Question – 26 – Overall review on the criteria/standards for LIC’s
Local Improvement Charges are established under By-Law L100, and the criteria and standards are
described in detail. Local Improvement Charges are lienable charges, and the amount of tax levied can
be calculated based on: a) a uniform amount for each lot or parcel of land in existence or subsequently
created by subdivision; b) the frontage of the lot on any street; c) the use of the lot; d) the area of the
lot; e) any combination of two or more such methods of calculating the tax; or f) such other method as
Council deems fit. Section 104 of the HRM Charter grants the authority to levy local improvement
charges via the by-law and specifies what Local Improvement Charges can be applied for.
Question - 27. Why are we budgeting more than we can actually spend each year? Is it realistic to try
to grow a municipality based on CPI? Are current projected expenditure requirements sustainable at
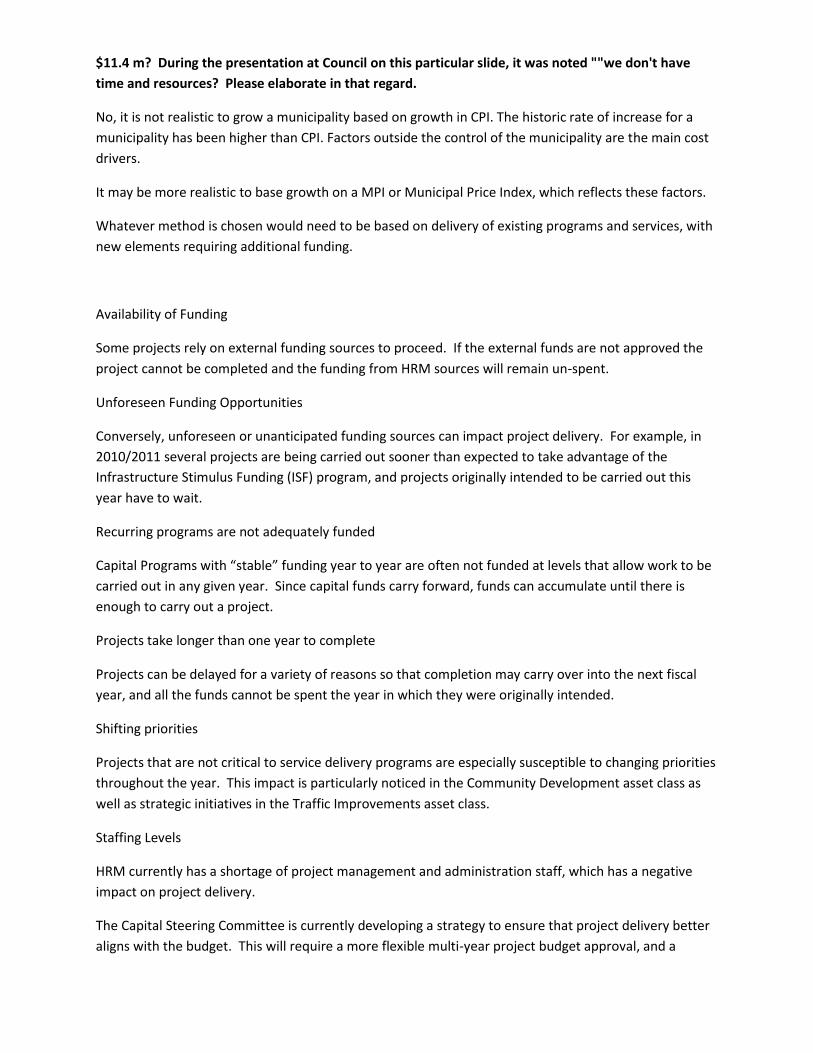
$11.4 m? During the presentation at Council on this particular slide, it was noted ""we don't have
time and resources? Please elaborate in that regard.
No, it is not realistic to grow a municipality based on growth in CPI. The historic rate of increase for a
municipality has been higher than CPI. Factors outside the control of the municipality are the main cost
drivers.
It may be more realistic to base growth on a MPI or Municipal Price Index, which reflects these factors.
Whatever method is chosen would need to be based on delivery of existing programs and services, with
new elements requiring additional funding.
Availability of Funding
Some projects rely on external funding sources to proceed. If the external funds are not approved the
project cannot be completed and the funding from HRM sources will remain un-spent.
Unforeseen Funding Opportunities
Conversely, unforeseen or unanticipated funding sources can impact project delivery. For example, in
2010/2011 several projects are being carried out sooner than expected to take advantage of the
Infrastructure Stimulus Funding (ISF) program, and projects originally intended to be carried out this
year have to wait.
Recurring programs are not adequately funded
Capital Programs with “stable” funding year to year are often not funded at levels that allow work to be
carried out in any given year. Since capital funds carry forward, funds can accumulate until there is
enough to carry out a project.
Projects take longer than one year to complete
Projects can be delayed for a variety of reasons so that completion may carry over into the next fiscal
year, and all the funds cannot be spent the year in which they were originally intended.
Shifting priorities
Projects that are not critical to service delivery programs are especially susceptible to changing priorities
throughout the year. This impact is particularly noticed in the Community Development asset class as
well as strategic initiatives in the Traffic Improvements asset class.
Staffing Levels
HRM currently has a shortage of project management and administration staff, which has a negative
impact on project delivery.
The Capital Steering Committee is currently developing a strategy to ensure that project delivery better
aligns with the budget. This will require a more flexible multi-year project budget approval, and a

project delivery structure with better internal alignment that can focus on projects that can be
completed.
Question – 28 HRM owned vehicles including where are they used, and where there is a need for HRM
vehicles. Of the 1,200 vehicles, do we really need all of them? Who has them? Who can take them
home? What are our policies?
The information required to analyze this could not be gathered within the permitted time frame. Staff
will continue to work on this under the Fleet Service Review.
Question – 29 Details on Boots on the Street Program and if possible confirmation of our assumption
of continued funding.
The NS Department of Justice has indicated it is very early in their budget process, at this point no
decisions have been made.
$3.9 million in funding under this program is made available by the Province of Nova Scotia.
Question – 30 Need to be able to discuss tax burden on the 13th and 14th
Residential properties are currently eligible for the assessment cap. It is expected that the assessment
cap for 2011 will be set by the Province at 2.9%. This means that, without a tax rate change, the average
home will likely see an increase from 2,318 to 2,385. Home without the cap (newly built or just sold)
and apartments will likely see larger tax increases. More complete information on tax burden will be
available early in 2011 when the new assessment roll has arrived.
Question - 31 Status of increasing development related fees and work of Harry Kitchen and Enid
Slack?
Council recently approved increases to some development related fees.
The study is looking at development charges for recreation, library, police, and fire. It is expected to be
completed early in 2011. HRM currently does not have the ability under the Charter to collect
development charges for these types of services, and the study is intended to be complete in time for
the Province to consider a request for the enabling legislation at the spring sitting of the Provincial
Legislature.
Question – 32 Parking – When are parking fees coming back and what are we proposing?
A report has been drafted and will be coming forward to Council in January.
Question – 33 Woodlawn Library – why is the library expected to absorb the taxes associated with the
rent?
The Library asked for new operating funds related to the new capital, and were provided them. They forgot to include property taxes in the calculation of their request. As there is no extra money available, they were advised, as with all other business units, to find the money in their own budget for this year and it will be covered in 11-12.

Question 34 - Slide 41 – I would like to see a breakdown in what actually is police overtime? Where
are the police being used overtime – ie concerts on the common, student related issues in the south
end, etc?
The majority of HRP over time is spent in 2 areas; Criminal Investigation Division and Patrol Division .
The largest driver of overtime in the Criminal Investigation Division is generated from Major Crimes,
Special Enforcement and GIS. Over time in Patrol is normally replacements to ensure there is enough
staff working to handle the day to day work. Factors that are outside HRP's control are Parental Leave,
Suspensions, Sick/injured and court attendance. This has a cost impact as we need to ensure we have
the correct resources on the street at any given time.
Overtime associated with Concerts on the Commons in 2010/11 was completely recovered through Civic
Events.
Question 35 – Please provide information about any decisions council has made since we passed the
budget this year that increased the budgets of any departments. Please indicate who initiated the
request (council or business unit). If it is easy to provide, would like to see what decisions were made
for 2009.
We can provide a list of changes to the capital budget; which occur as a result of obtaining external cost
sharing or reserve funding. The only additional operating budget increase was the recent approval by
Council to find general tax rated funds to subsidize water/waste water issues – Giles Road, and Monarch
Rivendale subdivision. To provide exact information related to 2010/11 and 2009/10 we would have to
review all of the Council reports and minutes, as there is no easy way to generate this information.
Business Unit increases to the operating budget during the course of the Fiscal Year are not permitted. Any pressures are addressed through our projections process. Question 36 - Need to have a clear message about impact of residential suburban growth on the capital and operating budget. I do not want to have this discussion every year of reducing services, raising taxes, not taking on new projects without a clear understanding of how new residential development is impacting both parts of our budget. Operating costs need to be defined and clear so that with the CCS and LICs and area rates for capital projects (like community centres etc) have a clear cost associated with them in the long term for all of taxpayers given the operating and recapitalization costs. There was some reference in the Nov 23 presentation about the need to restrain growth – can staff be more explicit about this please. I don’t want to keep hitting the wall. Let’s build the community we want and need without creating walls. Currently, HRM estimates new growth at .57% each year. This translates into new tax revenues for the municipality. While the actual result may vary from year to year, this serves as a reasonable approximation until we receive actual growth numbers from PVC. New developments do cause increases in service demands for street and sidewalk services; park and playground services; transportation services, among others. These costs may or may not relate to the additional revenue being development

With current available development, HRM commits itself to pre-fund the necessary infrastructure to facilitate development. (Example: Larry Uteck interchange) Funds to carry this out are recovered over the development life of particular land developments. However, they represent a particular pressure on our available capital dollars as the return of the invested funds is sometimes not for many years. The more land is developed and added to the available inventory, the higher the level of this type of investment and the longer it takes to recover the investment.
Question 37 – On slide 33 I would like more information on various cost recovery opportunities – what
are they? List the development permit fees and what specifically are the proposed hikes?
The primary cost recovery opportunities being contemplated when that slide was prepared were
development related fees, and possible recovery of some administrative costs associated with
establishing and administering area rates. Nothing specific is being contemplated at this time, as staff
were interesting in gauging interest of Council before expending a lot of capacity working on these
ideas.
Question 38 – Can we see an exact budget for the Mayor’s office – number of staff and job
descriptions, discretionary funds, PR, hosting etc. At the very least why should the Mayor have
capital funds – capital investments should only be done through the local councillor so that there is no
overlap and that there is a plan – apparently the Mayor funded the batting cage at Larry O’Connell
and I, as the local councillor, did not even know it was going in – how and why did and can this
happen?
Cost Element Total
Compensation and Benefits (salary and benefits for 7 full time positions, including the Mayor) $598,160
Office Costs (i.e. phone, office supplies, equipment, furniture, postage, etc.) $27,136
Contract Services (costs for Commissionaire services) $2,500
Other Goods and Services (primarily donations for events, community groups, etc. but also
travel, hosting, advertising, training/conferences, etc.)
$160,950
TOTAL $788,746
The budget for the Mayor’s Office contains no capital funds. In regard to the project referenced in the question, the Mayor’s Office contributed a $250 donation toward the total project cost of approximately $15,000. Question 39 – How much do we spend on consultants The Operating Budget provides for the following consulting expenses:
2010 Budget
Expense Legal & Consulting Fees Consulting Fees $596,841
Business Planning & Information Management $223,001

Business Solutions $30,852
Customer Care $4,560
Data Knowledge Management $16,084
Director of Business Plan. & Info Mgmt $28,880
Information Technology $15,200
Project Management $96,567
Technology Intrastructure $30,858
Community Development $145,603
Community Relations $76,562
Facilities $24,079
Outdoor Recreation $1,140
Planning Services $43,822
Finance $4,160
Administration - Finance $760
Finance $3,400
Human Resources $56,204
Human Resources Services $56,204
Infrastructure & Asset Management $63,601
Facility Development $1,070
IAM Admin $2,280
Parks Planning $3,894
Sustainable Environment $56,357
Office of the Chief Administrator $34,960
CAO Office $27,360
External & Corp. Affairs $7,600
Transportation & Public Works $69,312
Facilities $7,068
Operations $7,600
Real Estate $7,600
Service Delivery & Quality Improvement $19,000
Sportsfields & Playgrounds $8,512
Streets & Roads $11,704
TPW Administration $7,828
Expense Total $596,841
Grand Total $596,841
The capital budget consulting expenditures vary by project needs and have been as follows:
Capital Funds - Consulting Services CAPITALEXP - 6303 (Consulting Services) From April 1, 2007 to March 31, 2009
Project No. Project Description Gross Capital Budget (as at 09/17/2009)
Consulting Consulting as a
% of Budget
CB100077 Transit Facilities Upgrades 712,412.58 36,496.99 5.1%
CB100080 Fire Services-Station Upgrades 667,906.04 2,139.51 0.3%
CB100091 Mainland Commons Recreation Facility 39,033,682.00 1,030,726.74 2.6%
CB200427 Satellite Garage Facility 27,324,950.00 18,149.72 0.1%
CB200428 Transit Terminal Upgrade & Expansion 5,542,140.00 14,480.06 0.3%
CB200453 East Dartmouth Recreation Facility 4,460,000.00 2,606.42 0.1%
CB200454 Gordon R. Snow Community Centre 9,300,000.00 193,178.05 2.1%

CB300555 Major Facilities Upgrade 2004/05 2,002,799.04 303.61 0.0%
CB300628 Bus Rapid Transit Showcase 14,470,429.09 3,888.89 0.0%
CB300770 Bill Bollong Mem.Prk-oil spill remed. 207,143.91 8,976.44 4.3%
CB300774 100 Wyse Rd Redevelopment (Phase1) 241,561.37 35,727.34 14.8%
CB300776 High School Rationalization 41,075.17 7,916.78 19.3%
CBA00629 Environmental Remediation & Bldg Demoltn 316,656.31 4,024.00 1.3%
CBC00712 Mainland Commons Aquatic & Community Ctr 430,462.36 92,752.45 21.5%
CBF00444 Station Replacement (4) 6,214,524.09 (0.01) 0.0%
CBG00306 Evergreen&Quaker House 136,792.69 11,170.33 8.2%
CBG00720 Prospect Community Centre 8,547,194.00 257,961.94 3.0%
CBJ00168 New Station (Zone 4 Fire Dept) 4,361,000.00 14,137.48 0.3%
CBJ00905 Rural Fire Station Upgrades 36,163.62 5,378.31 14.9%
CBJ00979 Dutch Settlement - New Fire Station 1,675,000.00 50,277.00 3.0%
CBK00678 Police Training Center - Northbrook Sch 1,198,574.72 26,996.41 2.3%
CBM00711 Fuel Depot Upgrade 1,475,000.00 16,388.63 1.1%
CBR00436 Fountains/Wading Pools/Backflow Prevent 140,000.00 4,799.10 3.4%
CBR00724 Ferry Terminals-Pontoon Protection 117,893.41 1,290.92 1.1%
CBR00748 200 Illsley Ave-Air Quality Improvements 1,427,825.46 3,414.46 0.2%
CBR00750 200 Illsley Ave-Safety Upgrades 813,335.83 15,019.29 1.8%
CBU00876 200 Ilsley Upgrades 915,584.68 22,009.68 2.4%
CBU00938 200 Ilsley Avenue - Safety Upgrades 248,294.46 8,991.70 3.6%
CBU00941 Environ Remediation &Building Demolition 512,074.26 4,780.49 0.9%
CBU00942 Facilities Upgrades - General (Bundle) 197,332.76 5,171.45 2.6%
CBU00944 HRM Admin Buildings-Upgrades (Bundle) 321,767.24 8,051.22 2.5%
CBU00951 Transit Facilities Upgrades (Bundle) 565,892.73 43,440.18 7.7%
CBU00962 All Buildings Program (Bundle) 181,391.79 64,125.98 35.4%
CBU01004 Former CA Beckett School - Soil Remediat 2,000,000.00 284,116.34 14.2%
CBW00481 Facilities Review & Plan Implementations 189,693.13 790.39 0.4%
CBW00977 Woodlawn Library Expansion/ Replacement 1,160,000.00 75,901.00 6.5%
CBW00978 Central Liby Replacement-Spring Garden Rd 2,900,000.00 466,775.97 16.1%
CBX01042 Facilities Upgrades-General(Bundle) 604,480.84 292.19 0.0%
CBX01046 Halifax City Hall StoneRestoration 2,000,000.00 13,233.43 0.7%
CBX01047 HRM Admin Bldgs-Upgrades (Bundle) 587,409.03 15,112.12 2.6%
CBX01052 Reg Library Fac'ty Upgrades Bundle 937,474.36 1,303.21 0.1%
CBX01057 TransitFacilitiesUpgrades(Bundle) 1,539,302.38 11,956.39 0.8%
CBX01097 Energy Efficiency Projects Bundle 177,332.00 103.43 0.1%
CBX01144 Arena Capacity 19,667,000.00 96,177.71 0.5%
CCV00653 District 3 Capital Funds 261,242.23 1,921.43 0.7%
CCV00654 District 4 Capital Funds 362,555.94 15,000.01 4.1%
CCV00668 District 18 Capital Funds 241,222.98 2,265.10 0.9%
CDE00105 Regional Planning Program 2,447,659.05 374,730.90 15.3%
CDG00271 Downtown Streetscapes 4,154,618.51 349,434.08 8.4%
CDG00302 Community Signs 157,957.15 1,034.29 0.7%
CDG00490 Urban Design Study 1,458,993.43 65,378.08 4.5%
CDG00509 Heritage & Culture Facilities 24,903.63 4,757.73 19.1%
CDG00520 Real Prop. Opportunities/Facilities Ph 2 151,794.79 10,101.55 6.7%
CDG00984 Regional Trails-Active Transport 1,058,000.00 9,011.25 0.9%
CDI00697 District Energy Concept 150,365.59 25,799.05 17.2%
CDS00101 Capital Cost Contributions Area Studies 669,000.00 53,537.21 8.0%
CDS00274 Wenworth Estates/Bedford South 1,461,276.57 317.53 0.0%
CDV00721 Watershed Environmental Studies 930,000.00 185,884.44 20.0%

CDV00723 Harbour Plan 250,000.00 17,146.31 6.9%
CDV00734 Streetscaping In Center Hubs/Corridors 2,231,000.00 26,333.96 1.2%
CDV00738 Center Plans/Design (Visioning) 1,015,949.77 260,040.43 25.6%
CFG00993 Captain William Spry Retrofit 1,635,000.00 193,922.34 11.9%
CGI00610 Bedford Sackville Trunk Sewer 565,236.77 28,722.76 5.1%
CGI00614 Eastern Passage WWTF Expansion & Upgrade 532,948.15 (21,909.67) -4.1%
CGI00615 Ellenvale Run - Drainage Improvements 2,144,000.00 126,220.40 5.9%
CGI00616 Fairfield Holding Tank, Halifax 133,400.68 7,602.03 5.7%
CGI00676 Raymond St., Dartmouth Storm Sewer Rehab 68,628.02 16,177.12 23.6%
CGI00767 Ellenvale Sewer Shed I/I Study 188,069.58 7,291.05 3.9%
CGI00786 Service Extension to Lively Subdivision 6,896,817.82 173,366.61 2.5%
CGI00912 Jamieson St-Comb Trunk Sewer Replacement 54,393.10 30,486.57 56.0%
CGI00958 Elliot Street, Dartmouth - Sewer Renewal 33,398.84 4,702.14 14.1%
CGR00374 200 Waverley Road Pumping Station 5,411,938.67 16,324.98 0.3%
CGR00788 Studies & Investigations(Var.Locations) 536,958.90 8,584.61 1.6%
CGU00386 Majestic Ave/Trinity Lane-Ph 4E 2,299,266.63 55,728.31 2.4%
CGU00458 Crescent Ave-Storm Sewer Rehabilitation 543,745.33 103.43 0.0%
CGU00573 Riverwood Dr PS, Lakeside/Timberlea 355,309.26 (237.68) -0.1%
CGU00575 Uplands Park - Sanitary & Storm Sewers 745,060.17 1,680.20 0.2%
CGU00576 Whimsical Lake PS, Halifax 722,261.07 17,493.81 2.4%
CGU00582 Balcome Dr PS, Halifax 679,000.00 1,038.94 0.2%
CGU00645 Herring Cove Water and Sewer 11,740,800.00 318,724.94 2.7%
CGU00686 North West Arm Sewer, Halifax 167,696.29 6,596.35 3.9%
CGU00689 Chandler Drive PS, Sackville 720,000.00 4,460.28 0.6%
CGU00753 Bedford Hwy/Millview Water and Sewer 2,450,000.00 294.77 0.0%
CHJ00525 Rural Fire Water Supply 2,046,406.00 113.77 0.0%
CHJ00882 Potable Water-Rural Fire 500,000.00 12,722.73 2.5%
CIB00206 CFW-Class for Windows 223,577.91 2,735.70 1.2%
CID00707 Web Service Delivery 63,654.75 59,026.94 92.7%
CID00710 Corporate Document/Record Management 1,060,000.00 128,662.77 12.1%
CII00740 Whole System Methodology 170,000.00 2,265.10 1.3%
CIM00204 SAP Process Stabilization & Enhancement 340,348.12 33,039.27 9.7%
CIM00566 Revenue Tools Replacements 2,947,000.00 264,248.10 9.0%
CIP00763 Computer Aided Dispatch (CAD) 6,798,883.83 26,943.26 0.4%
CIV00533 Integrated City-Information Technology 590,500.00 75,463.86 12.8%
CIV00726 Lindar Mapping 200,000.00 13,357.18 6.7%
CJU00785 New Sidewalks 4,230,612.44 5,100.45 0.1%
CJU01083 New Sidewalks 5,462,922.26 4,352.96 0.1%
CJV00724 Highfield to Burnside Pedestrian Op 682,050.88 12,806.06 1.9%
CMU00973 Rural Express Transit 3,122,000.00 9,930.14 0.3%
CMU01095 Transit Strategy 329,000.00 81,498.67 24.8%
CP300845 New Park Development (Bundle) 464,206.88 1,963.38 0.4%
CP300849 Parks Upgrades (Bundle) 393,879.31 933.75 0.2%
CP300853 Regional Trails Development (Bundle) 223,035.52 11,768.71 5.3%
CP300867 Building Communities Capital Fund 386,442.07 3,052.85 0.8%
CPB00059 HRM Urban Forest Master Plan 145,750.00 6,722.88 4.6%
CPC00467 Regional Trails Development 2,408,791.27 9,252.34 0.4%
CPC00468 Don Bayer Sports Fields Upgrade 50,000.00 15,707.04 31.4%
CPG00492 Public Gardens Management Plan 1,291,100.00 30,261.48 2.3%
CPG00497 Dartmouth Common 119,000.00 12,316.84 10.4%
CPG00581 Dartmouth Artificial Sports Field 4,940,725.14 3,121.29 0.1%
CPG00954 Trails & ActIve Transportation 328,751.98 17,369.91 5.3%
CPR00318 Major Fill Sites 76,290.65 1,909.26 2.5%
CPS00040 Point Pleasant Park Upgrades 190,297.62 13,237.66 7.0%
CPU00916 Ball Field Upgrades (Bundle) 210,890.27 2,341.91 1.1%
CPU00928 Park Upgrades (Bundle) 579,384.34 159,103.80 27.5%
CPU00929 Playground Upgrades/Replacement (Bundle) 618,393.20 1,179.09 0.2%
CPU00930 Point Pleasant Park Upgrades 2,064,372.62 76,228.20 3.7%
CPU00931 Regional Park WashroomFacilities(Bundle) 105,516.40 18,123.23 17.2%
CPU00932 Skateboarding Facilities (Bundle) 259,974.97 716.25 0.3%
CPU00933 Sports Court Upgrades (Bundle) 316,082.20 2,080.22 0.7%
CPV00735 Trails Active Transportation 679,711.75 21,546.14 3.2%
CPX01017 New Park Development (Bundle) 1,635,413.73 7,602.47 0.5%
CPX01030 Sports Field Upgrades (Bundle) 45,816.48 11,211.60 24.5%
CPX01032 Regional Trails Active Transportation 2,370,787.67 13,305.30 0.6%
CQ300741 Burnside Phase 11-2-3-4-5 Development 45,568,707.90 446,298.94 1.0%
CQ300742 Aerotech Repositioning & Development 104,197.49 1,232.50 1.2%
CQ300746 Development Consulting 97,858.12 52,652.08 53.8%
CRU00584 Other Related Road Works 812,798.79 615.40 0.1%
CRU00684 Bridge Repair Program 2,026,609.17 144,936.65 7.2%
CRU00701 Other Related Road Works (D&C) 2,381,235.46 324,021.76 13.6%
CRU01077 Bridge Repairs - Various Locations 4,092,390.83 91,456.14 2.2%
CRU01079 Other Related Roadworks (D&C) 2,084,814.76 13,564.44 0.7%
CSE00386 Harbour Solutions Project 9,550,770.10 1,023.95 0.0%
CSE00387 HSP:Administration 8,508,671.90 129,935.28 1.5%
CSE00388 HSP:Miscellaneous 5,350,000.00 427,348.27 8.0%
CSE00392 HSP:Contract Management 2,760,000.00 598,157.85 21.7%
CSE00394 HSP:Sludge 13,400,000.00 29,785.87 0.2%
CSE00395 HSP:Mengoni 2,289,500.00 140,677.98 6.1%
CSE00700 HSP:Aerotech Ctrl Bioslds Dewatering Facility 4,831,452.27 15,006.19 0.3%
CSI00809 Springfield Lake STP 10,303.46 6,156.45 59.8%
CSI00874 Kearney Lake Road Twin Culverts 26,158.02 2,582.62 9.9%
CSR00503 Infiltration/Inflow Reduction 2,056,675.93 (813.86) 0.0%
CSR00803 Roach's Pond-Forcemain 998,225.03 6,308.32 0.6%
CSU00110 Wastewater Treatment Plants-Upgrades 879,169.29 4,551.58 0.5%
CSU00116 Fairview Overpass-Combined Swr Cleaning 2,439,194.49 5,760.39 0.2%
CSU00117 Freshwater Brook Sewer-Inspection 10,102,796.76 5,109.39 0.1%
CSU00146 North Preston STP Upgrade 3,340,609.24 3,697.43 0.1%
CSU00317 BLT STP Odour Control System 49,815.17 25,767.68 51.7%
CSU00327 Wellington STP 52,591.26 47,733.61 90.8%
CTI00696 Commuter Trip Reduction Program 140,000.00 36,161.90 25.8%
CTR00529 Various Traffic Related Studies 876,425.09 19,276.86 2.2%
CTR00905 Intersection Improvement Program 3,485,794.10 23,776.06 0.7%
CTR00908 Transportation Demand Management Program 1,354,218.71 23,065.38 1.7%
CTU00422 Traffic Signal Compliance Program 1,737,925.13 724.52 0.0%
CTU00530 Hwy 111/Portland St. Interchange 12,075,661.00 20,427.12 0.2%
CTU00817 Burnside/Commodore Intersection Expansion 964,678.11 119.46 0.0%
CTU00884 Functional Transportation Plans 550,000.00 146,878.08 26.7%
CTU00897 Road Corridor Land Acquisition 1,876,000.00 26,691.13 1.4%
CTU01006 Hammonds Plains Rd Improvements 8,382,727.49 81,873.91 1.0%
CTV00725 Lacewood 4 Lane/Fairview Interchange 3,149,623.00 134,888.15 4.3%
CTV00732 Rotary Conversion/Chebucto Reversing Lane 6,471,900.00 185,983.93 2.9%
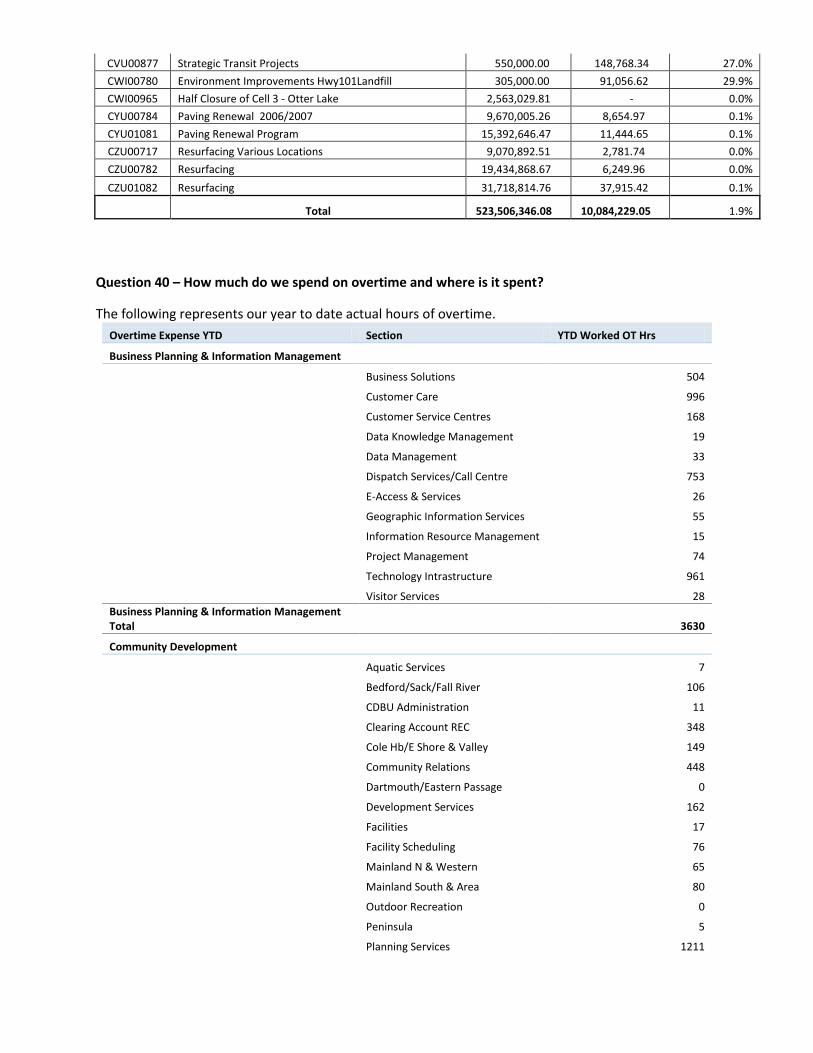
CVU00877 Strategic Transit Projects 550,000.00 148,768.34 27.0%
CWI00780 Environment Improvements Hwy101Landfill 305,000.00 91,056.62 29.9%
CWI00965 Half Closure of Cell 3 - Otter Lake 2,563,029.81 - 0.0%
CYU00784 Paving Renewal 2006/2007 9,670,005.26 8,654.97 0.1%
CYU01081 Paving Renewal Program 15,392,646.47 11,444.65 0.1%
CZU00717 Resurfacing Various Locations 9,070,892.51 2,781.74 0.0%
CZU00782 Resurfacing 19,434,868.67 6,249.96 0.0%
CZU01082 Resurfacing 31,718,814.76 37,915.42 0.1%
Total 523,506,346.08 10,084,229.05 1.9%
Question 40 – How much do we spend on overtime and where is it spent?
The following represents our year to date actual hours of overtime.
Overtime Expense YTD Section YTD Worked OT Hrs
Business Planning & Information Management
Business Solutions 504
Customer Care 996
Customer Service Centres 168
Data Knowledge Management 19
Data Management 33
Dispatch Services/Call Centre 753
E-Access & Services 26
Geographic Information Services 55
Information Resource Management 15
Project Management 74
Technology Intrastructure 961
Visitor Services 28
Business Planning & Information Management Total
3630
Community Development
Aquatic Services 7
Bedford/Sack/Fall River 106
CDBU Administration 11
Clearing Account REC 348
Cole Hb/E Shore & Valley 149
Community Relations 448
Dartmouth/Eastern Passage 0
Development Services 162
Facilities 17
Facility Scheduling 76
Mainland N & Western 65
Mainland South & Area 80
Outdoor Recreation 0
Peninsula 5
Planning Services 1211

Recreation Services 7
Community Development Total
2690
Finance
Accounting 2231
Finance 3
Financial Services Admin 54
Payroll Operations 439
Procurement 3488
Revenue 315
Finance Total
6530
Fire & Emergency Services
Operations 27654
Operations Support 1865
Fire & Emergency Services Total
29519
Halifax Regional Municipality Police Services
Administration 660
Chief's Office 826
City Watch 10
Community Projects & Bylaw 106
Community Standards 139
Contractual Services 1331
Criminal Investigations Division 17565
Emergency 911 Communications 2453
External Services 129
Initiatives 14
Operations 15
Patrol Division 32249
Support Division 559
Halifax Regional Municipality Police Services Total
56054
Human Resources
Human Resources Services 154
Human Resources Total
154
Infrastructure & Asset Management
CCC Implementation Project 9
Design & Construction 1696
Facility Development 214
IAM Admin 116
Parks Planning 238
Regional Transportation Planning 40
Sustainable Environment 131
Infrastructure & Asset Management Total
2442
Legal Services & Risk Management
Legal Services 7
Legal Services & Risk Management Total
7
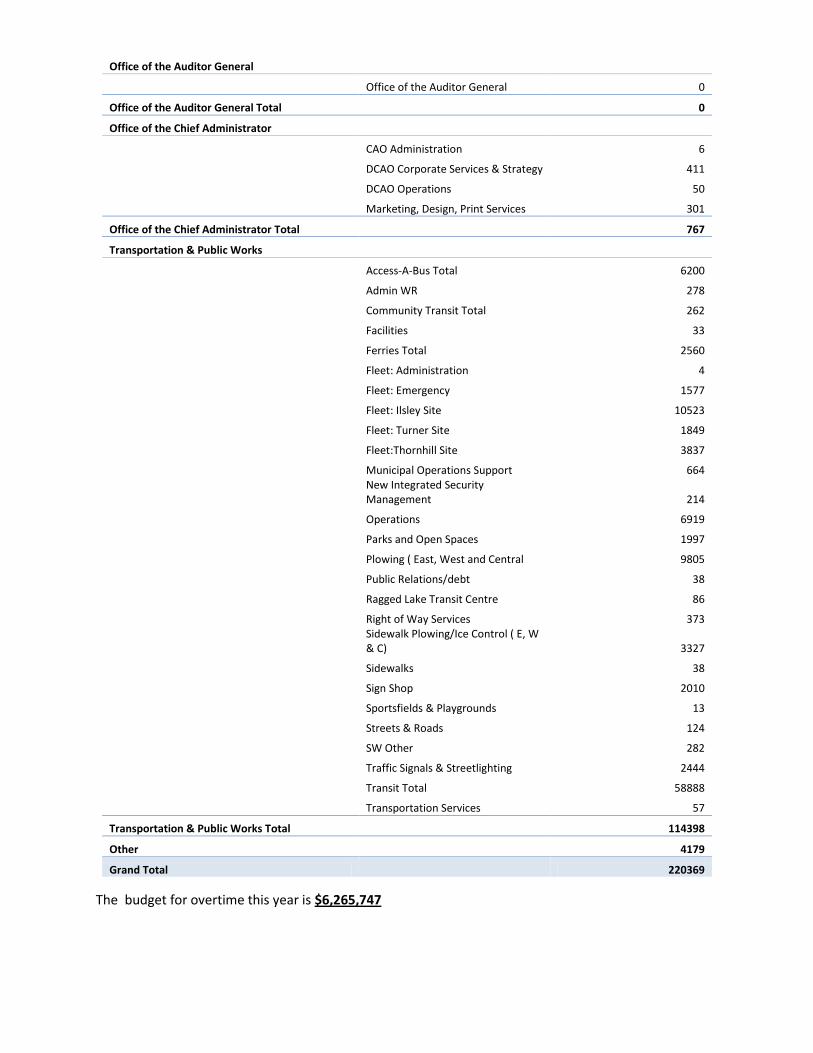
Office of the Auditor General
Office of the Auditor General 0
Office of the Auditor General Total
0
Office of the Chief Administrator
CAO Administration 6
DCAO Corporate Services & Strategy 411
DCAO Operations 50
Marketing, Design, Print Services 301
Office of the Chief Administrator Total
767
Transportation & Public Works
Access-A-Bus Total 6200
Admin WR 278
Community Transit Total 262
Facilities 33
Ferries Total 2560
Fleet: Administration 4
Fleet: Emergency 1577
Fleet: Ilsley Site 10523
Fleet: Turner Site 1849
Fleet:Thornhill Site 3837
Municipal Operations Support 664
New Integrated Security Management 214
Operations 6919
Parks and Open Spaces 1997
Plowing ( East, West and Central 9805
Public Relations/debt 38
Ragged Lake Transit Centre 86
Right of Way Services 373
Sidewalk Plowing/Ice Control ( E, W & C) 3327
Sidewalks 38
Sign Shop 2010
Sportsfields & Playgrounds 13
Streets & Roads 124
SW Other 282
Traffic Signals & Streetlighting 2444
Transit Total 58888
Transportation Services 57
Transportation & Public Works Total
114398
Other
4179
Grand Total
220369
The budget for overtime this year is $6,265,747

It is expected that actual overtime expenditures will be above budget. Finance and Human Resources will be working with business units to develop mitigation strategies.
Question - 41 Consideration of reduced transit funding
Metro Transit’s current operating deficit is $1.6M. Current capital project budget is $22.6M with associated OCC of $3.6M and a desire to reduce the revenue budget by $1.2M. Next year we could have an operating revenue hit of almost 5 million dollars. We are currently researching impact to the current tax rate for this change. Transit expenditures could be reduced by $10 M by reducing/eliminating tier 1-5 transit services, summary below.
Annual Hours Annual Savings Service Reduction
Tier 1 3,153 $833,574 0.4%
Tier 2 17,458 $1,366,956 2.3%
Tier 3 19,935 $1,560,909 2.6%
Tier 4 55,688 $4,360,355 7.3%
Tier 5 26,986 $2,112,978 3.5%
Total 123,220 $10,234,771 16.1%
Question 42 Increase efforts to manage consumption of commodity and utility costs (energy, diesel, gasoline). Asphalt consumption would need its own review on consumption management. TROW - The LED traffic signal project is almost completed which will reduce electricity costs by
approximately 86%. Also, we are in the process of installing 2100 LED street light which will reduce our
electricity costs as well.
Corporate Fleet is currently working on the following energy reduction programs
For Transit the Engineered Machine Products (EMP) project that replaces the traditional hydraulic drive
cooling fan with an electrically driven version that has been tested in our buses to increase fuel mileage
by 10%. We are currently working on expanding the program to 8 additional units
For the rest of Corporate Fleet we are working with the vehicle Right Sizing Filter, Life cycle Costing and
SUV justification process when procuring any small vehicles
We also incorporate a fuel use criteria where ever possible when we purchase heavy vehicles like dump
trucks, snow plows, and buses.
Corporate Fleet created the HRM anti Idling policy and has created Fleet shop specific rules for all
mechanics and Fleet staff to follow
Question 43 Move to permit parking in strategic locations whether linked to ecoMobility or not – see
slide 34
Parking fees are most applicable in areas of highest parking demand and those areas are concentrated
on the Halifax peninsula. Accordingly, HRM staff is currently working with Peninsula Community Council

to determine what potential measures can most easily be accommodated by the communities that will
host them. Once those determinations are made, proposals regarding parking controls in high demand
areas and potential revenue generation will be developed for the consideration of Regional Council.
Question – 44 Cost of external functions catered at City Hall. Can I get a breakdown of these, perhaps
by HRM event, New Year’s Levee, and non-hrm events? What would we save by eliminating non-
hrm?
The information required to analyze this could not be gathered within the permitted time frame. We will
continue to work on this and will circulate information at a later date.
Question – 45 Cost of promotional items purchased by HRM including Councillors Office and all
departments. How much could we save if we eliminate it all?
This is difficult to answer as we do not account for this as a separate cost element. Currently, items that
could be used as promotional items could be purchased on an HRM Purchasing Card, through a
purchase order, possibly requisitioned from stores, or purchased using personal funds then reimbursed
through a travel claim. A brief analysis regarding how to answer this question illustrates there is a need
for some guidelines and processes around purchase and distribution of promotional items. We require
more time to analyze this issue to determine if the volume of purchases going on warrants developing
guidelines and processes, and standardizing promotional items and attempting to negotiate better
pricing through bulk purchasing.
Question – 46 Staff Christmas parties – how much do these cost per department? We have an overall
Christmas party, duplication of a questionable expense.
Each business unit approaches staff Christmas parties and also Employee Recognition slightly differently.
Some business units do little seasonal celebration, some do pot-lucks, some organize events where
employees pay their own costs, some divisions may choose to use a portion of their Employee
Recognition budget to purchase a meal. Funds for employee recognition are budgeted in cost element
6938 – Rewarding Excellence. The total budget for 2010/11 is $221,327, and with $50,603 being spent
to date as of December 9, 2010. The total budget for Rewarding Excellence is 0.04% of HRM’s total
budget and is much less than recommended standards you would expect to see for an Employer of
Choice.
Question – 47 How much money did we spend/save by the smart care program?
Summary for 2009/10: 11,658 kilometers were driven using the vehicles. Smart Car Program Cost for 3 Vehicles (including capital amortization of vehicle purchase price over 5 years) is $16,150 per year - $5,650 R&M/Fuel, $10,500 capital If mileage was paid for all Km's driven (11,658 kms x $0.46) = $5,350 If Taxi's were used for all Km's driven (11,658 kms x $1.30) = $15,150

Question – 48 What is the total cost of our involvement in the UNSM. (including hosting conferences,
partial payments to external staff, attending conferences, etc.) Are we receiving value for this money?
An analysis on this topic was prepared in 2007 (attached). The 2010 costs would be moderately higher,
but likely have not increased by more than 1 – 2% per year. We can assign a staff person to work on
updating the analysis to 2010 if discontinuing involvement in UNSM is being considered and additional
information is required to support decision making.
Question - 49 Area rates – do they completely capture actual costs, including costs to administer?
Area rates currently do not capture costs to establish and administer them. This may be an opportunity
area, and we will explore it.
Question - 50 Consider area rates for services, ie. solid waste, policing. It has been suggested that area rates be considered for solid waste and/or policing. As the 2011 assessment roll has not arrived it is not possible to say what the area rates would be. In the case of Police Services, all of HRM has access to and benefits from Police Services so presumably there would be one common area rate for police and the general tax rate would be lowered. This could provide greater transparency in explaining police costs to the taxpayer. It would also provide the Police Commission with a greater understanding of the tax impact of the Police Budget. With Solid Waste, not all taxpayers receive solid waste service. For instance, larger apartment buildings, vacant land and commercial taxpayers do not get solid waste pick-up. An area rate might be applied only on those which receive the solid waste service. As with a Police area rate, the general tax rate would be lowered and, presumably, there would be greater transparency in providing the service.
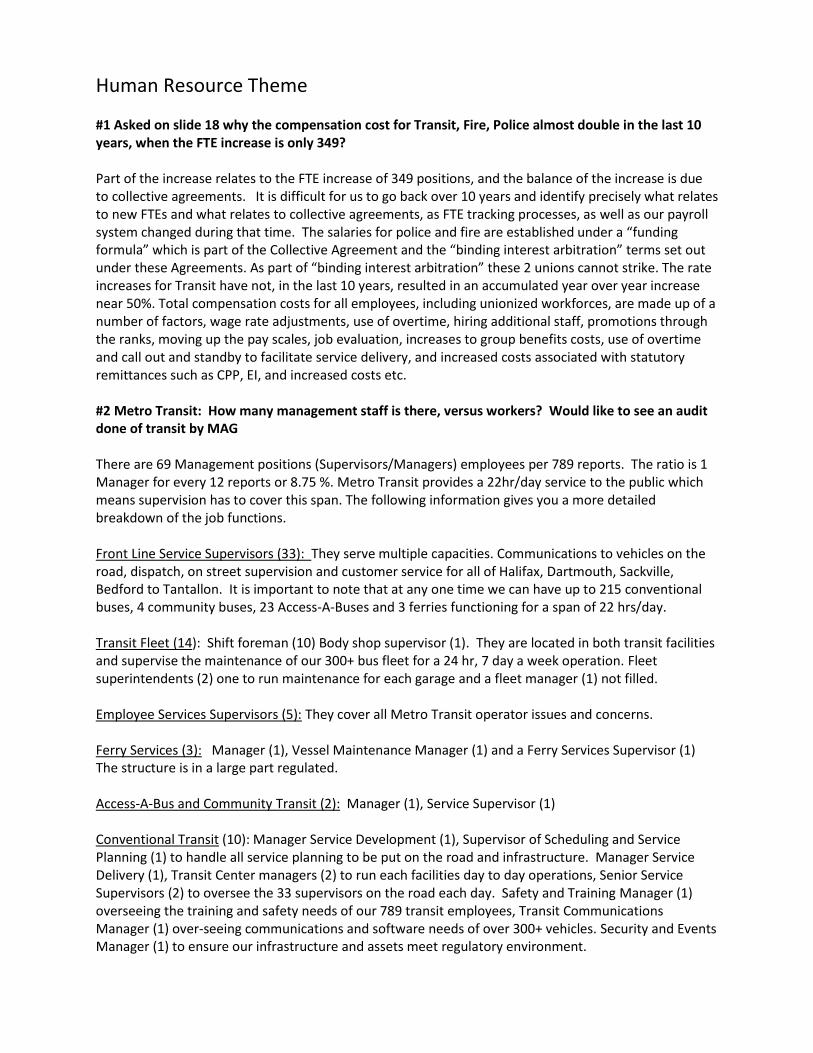
Human Resource Theme #1 Asked on slide 18 why the compensation cost for Transit, Fire, Police almost double in the last 10 years, when the FTE increase is only 349? Part of the increase relates to the FTE increase of 349 positions, and the balance of the increase is due to collective agreements. It is difficult for us to go back over 10 years and identify precisely what relates to new FTEs and what relates to collective agreements, as FTE tracking processes, as well as our payroll system changed during that time. The salaries for police and fire are established under a “funding formula” which is part of the Collective Agreement and the “binding interest arbitration” terms set out under these Agreements. As part of “binding interest arbitration” these 2 unions cannot strike. The rate increases for Transit have not, in the last 10 years, resulted in an accumulated year over year increase near 50%. Total compensation costs for all employees, including unionized workforces, are made up of a number of factors, wage rate adjustments, use of overtime, hiring additional staff, promotions through the ranks, moving up the pay scales, job evaluation, increases to group benefits costs, use of overtime and call out and standby to facilitate service delivery, and increased costs associated with statutory remittances such as CPP, EI, and increased costs etc. #2 Metro Transit: How many management staff is there, versus workers? Would like to see an audit done of transit by MAG There are 69 Management positions (Supervisors/Managers) employees per 789 reports. The ratio is 1 Manager for every 12 reports or 8.75 %. Metro Transit provides a 22hr/day service to the public which means supervision has to cover this span. The following information gives you a more detailed breakdown of the job functions. Front Line Service Supervisors (33): They serve multiple capacities. Communications to vehicles on the road, dispatch, on street supervision and customer service for all of Halifax, Dartmouth, Sackville, Bedford to Tantallon. It is important to note that at any one time we can have up to 215 conventional buses, 4 community buses, 23 Access-A-Buses and 3 ferries functioning for a span of 22 hrs/day. Transit Fleet (14): Shift foreman (10) Body shop supervisor (1). They are located in both transit facilities and supervise the maintenance of our 300+ bus fleet for a 24 hr, 7 day a week operation. Fleet superintendents (2) one to run maintenance for each garage and a fleet manager (1) not filled. Employee Services Supervisors (5): They cover all Metro Transit operator issues and concerns. Ferry Services (3): Manager (1), Vessel Maintenance Manager (1) and a Ferry Services Supervisor (1) The structure is in a large part regulated. Access-A-Bus and Community Transit (2): Manager (1), Service Supervisor (1) Conventional Transit (10): Manager Service Development (1), Supervisor of Scheduling and Service Planning (1) to handle all service planning to be put on the road and infrastructure. Manager Service Delivery (1), Transit Center managers (2) to run each facilities day to day operations, Senior Service Supervisors (2) to oversee the 33 supervisors on the road each day. Safety and Training Manager (1) overseeing the training and safety needs of our 789 transit employees, Transit Communications Manager (1) over-seeing communications and software needs of over 300+ vehicles. Security and Events Manager (1) to ensure our infrastructure and assets meet regulatory environment.

Manager of Marketing and Communications (1): for our almost 900,000 service hours General Manager (1): to manage all aspects of Metro Transit #3 A request for the number of management positions in relation to non management staff There are 309 Management positions (Supervisors and Managers). As of Nov. 15, HRM has 4589 staff for a ratio of 1 Manager for every 15 reports or 6.83 %. This includes part-time, casual, and volunteer fire fighters. According to the Conference Board of Canada, the number of direct reports per manager affects the level of employee engagement/productivity. While there is no empirically determined optimal size for the manager/staff ratio, the chart noted below identifies the span of management control by respondent organizations to their Study. Span of Management Control by Organization Size Number of Senior
Executives Ratio of Second-Level Executives to Senior-Level Executives
Ratio of Employees to Second-Level Executives
n Mean Median n Mean Median n Mean Median
Overall
112
7
7
88
8
4
91
124
66
100–499 employees 31 6 6 23 4 2 25 28 16
500–999 employees 18 6 6 13 5 2 14 66 64
1,000–3,999 employees 32 7 7 27 8 5 27 96 72
4,000–9,999 employees 29 8 7 17 11 4 17 263 195
10,000 or more employees
8 9 9 8 16 10 8 324 316
HRM 3 9 507 Source: The Conference Board of Canada. #4 The number of overtime hours including information on whether split shifting be considered.

The following table reflects recorded/paid overtime and is largely representative of the terms outlined in HRM’s collective agreements. There is a small portion (4.8%) attributed to non-union staff who qualify for overtime; these positions are administrative and front line supervisory level.
BUSINESS UNIT Total FTEs Total OT Hours to December 6, 2010
Transportation & Public Works 1361 117215.24
Regional Police 960 56054
Fire & Emergency Services 485 29519
Finance 199 7765.3
Business Planning & Information Management 155 3629.7
Community Development 241 2708.1
Infrastructure and Asset Management 107 2441.6
CAO 70 767.25
Human Resources Services 48 154
Legal Services 26 6.5
Office of the Auditor General 5 0
In addition to paid overtime, there is a significant amount of additional time given to the organization by non-union staff beyond 35 hours per week. For example, the average number of hours worked at the senior manager and director level is 60 hours per week. #5 Overtime - the total amount overall and per business unit. Some of my specific comments included: are planning staff and other staff that are required to attend evening council meetings and/or public meetings paid overtime? And, if so can we have split shifts or staggered hours, or time in lieu instead of overtime. There is flexibility within the NSUPE bargaining unit (that would cover Planning staff) to change employee's working hours to accommodate evening meetings. We have negotiated language to allow us to change an employee's hours so that they come in to work later in the day and work straight through to the evening, with no overtime premium unless the work goes beyond 9:00 pm. Community Development has experimented with shifting work hours on the day of evening meetings. It has proven ineffective in dealing with public enquiries and preparation for the evening event. It is important that staff have as much time in the office as possible the day of a public meeting or public hearing, as it normal to receive a significant amount of correspondence which must be reviewed and analysed prior to the event so staff can properly advise Council and the community.
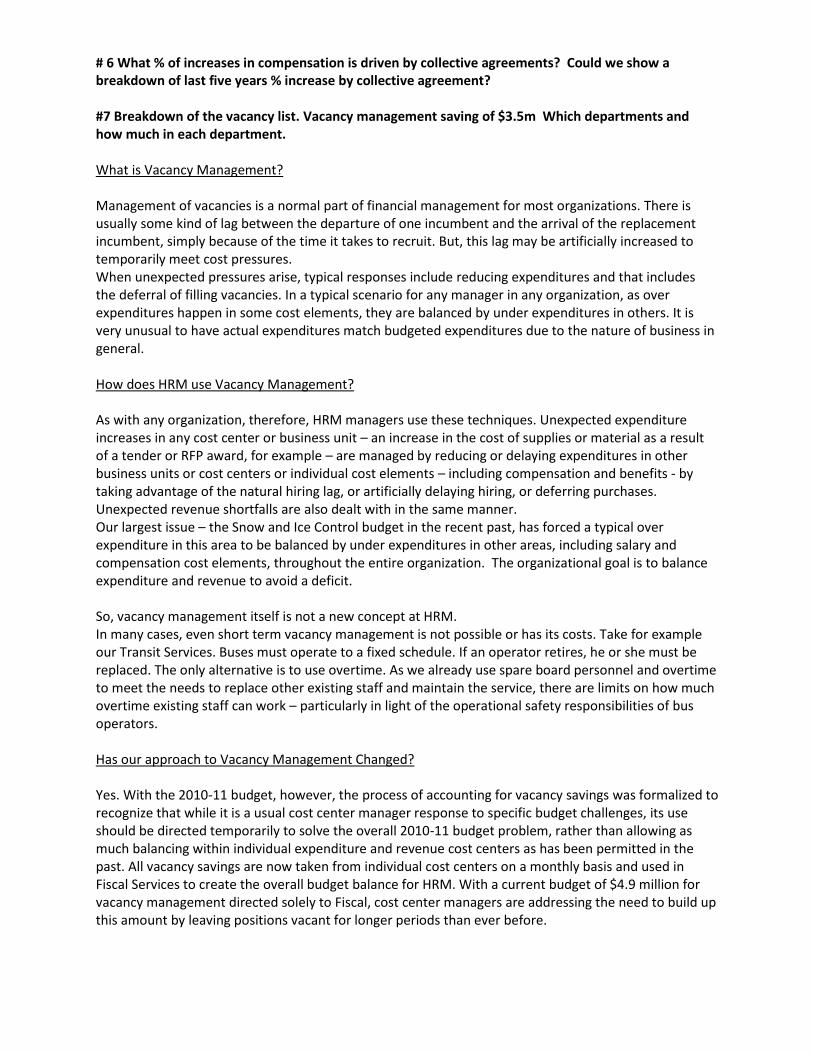
# 6 What % of increases in compensation is driven by collective agreements? Could we show a breakdown of last five years % increase by collective agreement? #7 Breakdown of the vacancy list. Vacancy management saving of $3.5m Which departments and how much in each department. What is Vacancy Management? Management of vacancies is a normal part of financial management for most organizations. There is usually some kind of lag between the departure of one incumbent and the arrival of the replacement incumbent, simply because of the time it takes to recruit. But, this lag may be artificially increased to temporarily meet cost pressures. When unexpected pressures arise, typical responses include reducing expenditures and that includes the deferral of filling vacancies. In a typical scenario for any manager in any organization, as over expenditures happen in some cost elements, they are balanced by under expenditures in others. It is very unusual to have actual expenditures match budgeted expenditures due to the nature of business in general. How does HRM use Vacancy Management? As with any organization, therefore, HRM managers use these techniques. Unexpected expenditure increases in any cost center or business unit – an increase in the cost of supplies or material as a result of a tender or RFP award, for example – are managed by reducing or delaying expenditures in other business units or cost centers or individual cost elements – including compensation and benefits - by taking advantage of the natural hiring lag, or artificially delaying hiring, or deferring purchases. Unexpected revenue shortfalls are also dealt with in the same manner. Our largest issue – the Snow and Ice Control budget in the recent past, has forced a typical over expenditure in this area to be balanced by under expenditures in other areas, including salary and compensation cost elements, throughout the entire organization. The organizational goal is to balance expenditure and revenue to avoid a deficit. So, vacancy management itself is not a new concept at HRM. In many cases, even short term vacancy management is not possible or has its costs. Take for example our Transit Services. Buses must operate to a fixed schedule. If an operator retires, he or she must be replaced. The only alternative is to use overtime. As we already use spare board personnel and overtime to meet the needs to replace other existing staff and maintain the service, there are limits on how much overtime existing staff can work – particularly in light of the operational safety responsibilities of bus operators. Has our approach to Vacancy Management Changed? Yes. With the 2010-11 budget, however, the process of accounting for vacancy savings was formalized to recognize that while it is a usual cost center manager response to specific budget challenges, its use should be directed temporarily to solve the overall 2010-11 budget problem, rather than allowing as much balancing within individual expenditure and revenue cost centers as has been permitted in the past. All vacancy savings are now taken from individual cost centers on a monthly basis and used in Fiscal Services to create the overall budget balance for HRM. With a current budget of $4.9 million for vacancy management directed solely to Fiscal, cost center managers are addressing the need to build up this amount by leaving positions vacant for longer periods than ever before.
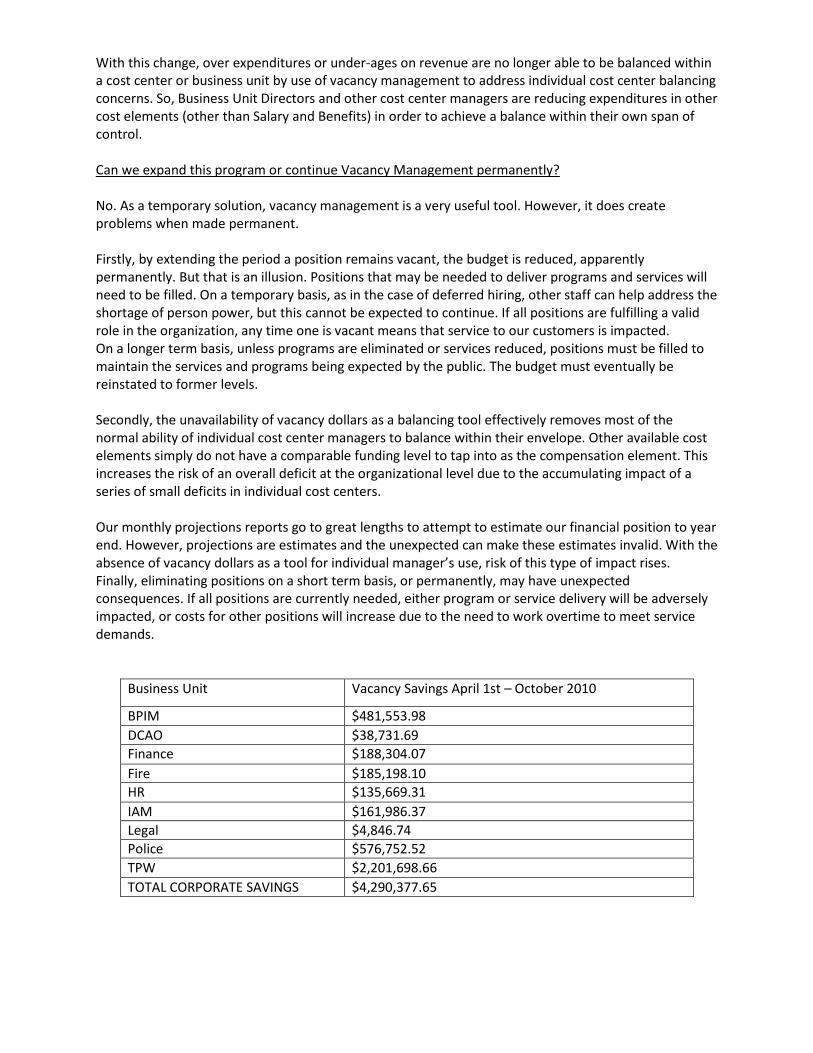
With this change, over expenditures or under-ages on revenue are no longer able to be balanced within a cost center or business unit by use of vacancy management to address individual cost center balancing concerns. So, Business Unit Directors and other cost center managers are reducing expenditures in other cost elements (other than Salary and Benefits) in order to achieve a balance within their own span of control. Can we expand this program or continue Vacancy Management permanently? No. As a temporary solution, vacancy management is a very useful tool. However, it does create problems when made permanent. Firstly, by extending the period a position remains vacant, the budget is reduced, apparently permanently. But that is an illusion. Positions that may be needed to deliver programs and services will need to be filled. On a temporary basis, as in the case of deferred hiring, other staff can help address the shortage of person power, but this cannot be expected to continue. If all positions are fulfilling a valid role in the organization, any time one is vacant means that service to our customers is impacted. On a longer term basis, unless programs are eliminated or services reduced, positions must be filled to maintain the services and programs being expected by the public. The budget must eventually be reinstated to former levels. Secondly, the unavailability of vacancy dollars as a balancing tool effectively removes most of the normal ability of individual cost center managers to balance within their envelope. Other available cost elements simply do not have a comparable funding level to tap into as the compensation element. This increases the risk of an overall deficit at the organizational level due to the accumulating impact of a series of small deficits in individual cost centers. Our monthly projections reports go to great lengths to attempt to estimate our financial position to year end. However, projections are estimates and the unexpected can make these estimates invalid. With the absence of vacancy dollars as a tool for individual manager’s use, risk of this type of impact rises. Finally, eliminating positions on a short term basis, or permanently, may have unexpected consequences. If all positions are currently needed, either program or service delivery will be adversely impacted, or costs for other positions will increase due to the need to work overtime to meet service demands.
Business Unit Vacancy Savings April 1st – October 2010
BPIM $481,553.98
DCAO $38,731.69
Finance $188,304.07
Fire $185,198.10
HR $135,669.31
IAM $161,986.37
Legal $4,846.74
Police $576,752.52
TPW $2,201,698.66
TOTAL CORPORATE SAVINGS $4,290,377.65
#8 A) Since compensation/benefits are main drivers, I would like more information on vacancy management. Vacancy Management uses a justification process that was initiated by the CAO in June 2010 to assist the Executive Management Team (EMT) with prioritizing filling vacancies. Directors and Managers determine whether a position absolutely needs to be filled right away and answers the following questions for EMT:
Is there approved funding through Finance?
How long has the position been vacant?
What is the overall purpose and objective of this position (why does it exist)?
Please explain the impact of not filling this vacancy as it relates to the Council Focus Areas. Which Council Focus Area may be impacted?
If this vacancy is not filled, how would service delivery be impacted?
Have you considered other ways the services associated with this vacant position could be done?
How many positions of the same classification as this vacancy do you have in your work group?
Time frame for filling the position?
Have you considered alternate time frames for filling this vacancy? EMT reviews the answers and advices the business unit whether the position is approved for posting. B) Are there opportunities to incorporate this with the current succession plan? To answer this question, definitions may be helpful to ensure all readers have the same understanding: Succession Planning: A systematic approach to ensure leadership continuity for all key positions by developing pools of leadership talent from within the organization. Succession Planning focuses on leadership development, leadership positions and positions that are difficult to fill. Replacement Planning: Replacement planning takes a narrow approach to filling vacancies by identifying specific back up candidates to fill a position. Attrition: Attrition is the normal reduction of the work force due to resignations, retirements, sickness or death. Savings through vacancy management could be used to fund overstaffing of key positions and leadership development, both of which are critical to the success of the organization’s succession planning model. C) Are there opportunities to reduce personnel without a negative impact on productivity? Vacancy Management asks Directors and Managers to explain the impact of not filling vacancies as they relate to Council Focus Areas. Positions that are not critical to Council Focus Areas may be left vacant, thus creating a savings. Further analysis will need to occur to determine the impact of workforce reductions on productivity. D) Are some business units overstaffed while others are understaffed?
Service Review is ongoing and this question will be answered as each identified service is reviewed. There is no indication to show that any business units are overstaffed. Each Director would need to undertake an operational review to answer this question. E) Are there opportunities to retrain? Over 80% of employees are unionized with the terms and conditions of their employment outlined in their respective collective agreements. There is no wording in any of the collective agreements regarding retraining in the event of lay-off. The following language does exist and pertains to specific circumstances: ATU & NSUPE (identical language)- Technological Change The Employer will make efforts to retain employees whose jobs are eliminated by the change. Where the Employer determines that it is feasible, the Employer will provide training to qualify displaced employees for other positions which are available. CUPE- 5.08 All participants in the Winter Works Operation shall be given appropriate training, retraining and an opportunity to upgrade qualifications and fully prepare for Winter Works Operation work. Training criteria shall be as per the Winter Works Operations Committee Terms of Reference. CUPE DTA protocol- 9 In considering the feasibility of accommodation options, the Employer may consider modification of duties, shifts, equipment, and/or retraining of the employee, to the extent that such do not cause the Employer undue hardship. Where modifications are implemented by the Employer, these are made on a without prejudice and individual basis. If a non-union position is eliminated, the organization may consider retraining for those employees who may require skill enhancement to meet the qualifications of future vacancies. #9 Staff increased by 404 in the last six years. Was there that much more work created over the same time period? The justification for any new position is done through a business case and the creation of any new positions must be approved by EMT. The majority of these new positions were created in Police, Fire and Transit.

#10 Wants a breakdown of how many people are eligible to retire, and when. Vacancy Management including how many retirees over the next couple of years as well as a breakdown of numbers and the areas affected by retirees; a breakdown of position vacancies to Council; and is there a mentorship program in place
ELIGIBLE FOR UNREDUCED RETIREMENT BY MARCH 31, 2011
Non-Union Union (CUPE, NSUPE, ATU) IAFF (Fire) MAPP (Police) Total
Staff 137 285 60 60 542
Business Unit
Total Eligible for unreduced as at March 31, 2011
Non-Union
Union (CUPE, NSUPE, ATU)
IAFF (Fire)
MAPP (Police)
Percentage of all BU FTEs
Legal 3 3 0 0 0 12.0%
CAO 13 10 3 0 0 21.0%
IAM 24 5 19 0 0 22.0%
TPW 250 47 203 0 0 19.5%
CD 28 13 15 0 0 11.6%
BPIM 17 7 10 0 0 10.1%
Fire 79 18 1 60 0 16.0%
Police 84 15 9 0 60 10.9%
Finance 34 9 25 0 0 16.7%
HR 10 10 0 0 0 20.8%
542 137 285 60 60 15.9%
Additional Unreduced Retirement Eligible Staff Per Year
2011-12 2012-13 2013-14 2014-15
Union (CUPE, NSUPE, ATU) 53 66 58 46
Non-Union 29 32 20 27
MAPP (Police) 11 12 12 14
IAFF (Fire) 11 10 23 27
Total 104 120 113 114
Yes, there is a mentorship program in place as well as a Succession Planning model, which also encompasses a Talent Review Committee which is led by the CAO and the Director of Human Resources.
#11 A base salary comparison of say 5 departments to the private sector- real estate, planner (senior), engineer, public works manager, (compared to a comparable private sector) and legal (5 years experience as an example)Referred to email re: positions with starting salaries higher than market. Asked if we could pick 10 positions and compare them to the private sector. We should likely do something more broad. HRM starting salaries.... are they out of line with other organizations? Are we striving to be Employer with the highest salaries? The research to provide this information to Council is being undertaken and the results will be provided to Council at a later date as there was not enough time to complete the work for inclusion into this report. As background information and in advance of providing the comparative data, HRM’s compensation philosophy is to establish salary structures at the 50th percentile (P50) of the comparison data for public sector organizations. This means that 50% of the organizations in the comparator group will pay more than HRM and 50% of the organizations in the comparator group will pay less. This ensures that HRM is neither the highest payer in the market nor the lowest. This is a standard market position for most public sector organizations. With some exceptions noted earlier (see question 49) HRM does not generally compare each of our jobs to the outside market. Instead, we establish salary structures which create job hierarchies based on the relative value of jobs in the structure. Relative value can be determined based around seniority (e.g. in Police and Fire) or through the use of Job Evaluation systems (NSUPE and Non-Union) to compare jobs and establish a job hierarchy. After the internal job hierarchy has been established “benchmark” jobs are selected and compared to the external comparator market to determine an appropriate salary level. Once the benchmark’s salaries are set, salary can then be established for the other jobs based on the previously established hierarchy (e.g. jobs than are lower than the benchmark in the hierarchy will be paid less, jobs that are higher will be paid more). For Police and Fire only one benchmark is used (1st Class Constable and Firefighter 1), but for NSUPE and non-union jobs multiple benchmarks at various levels in the hierarchy are selected. Establishing multiple benchmarks and gathering appropriate external market data for them is a lengthy and labour intensive effort and, as a result, HRM only checks its jobs against the external market periodically (2-4 years depending on the group, length of agreements, and market conditions). #12Please provide a breakdown on the new FTEs in transit, police and fire – which department is getting the new FTEs and where are they be deployed? There are no new FTE's for Police or Fire in 2010/11. Metro Transit has added 53 FTE’s in 2010/11. The breakdown is as follows: (6) ATU Access A Bus (AAB) Operators – Burnside Transit Centre (BTC), (1) ATU AAB Scheduler – BTC, (18) ATU Conventional Operators – BTC & Ragged Lake Transit Centre (RLTC ), (1) NSUPE Financial Assistant – BTC, (1) Fleet Services Shift Foreman – RLTC, (1) Fleet Services Quality Analyst – RLTC, (4) ATU Mechanics – RLTC (1) Mobile Service Supervisor – BTC, (1) NSUPE Planning Technician – BTC, (1) NSUPE Transit Systems Support – BTC , (1) TPW Facilities – (6) ATU AAB, -external provider could no longer maintain service delivery contract, therefore service was brought back in house (2) Transit Centre Manager, BTC and RLTC, (1) Safety and Training Manager,(2) Senior Service Supervisor, BTC and RLTC, (5) Service Supervisor - RLTC, (1) Senior Trainer- BTC, (1) Supervisor, Accessible Transit - BTC #13 The number of union negotiations that are coming forward over the next two years.

Fire (IAFF) re-opener negotiations are continuing - these are every 2 years
The Police (MAPP) is under re-opener now and may continue to 2011 – reopeners are every 2 years.
NSUPE (inside workers) Agreement expires in 2011
ATU Agreement expires in 2011
CUPE 108 Agreement (outside workers) expires in 2012
CUPE 4814 Agreement (crossing guards) expires in 2013. #14 Consider exploring online training versus other training where possible. HRM offers a number of online training programs at the present time and is researching further opportunities based on cost of delivery and learning effectiveness. #15 The amount of overtime for supervisors per business unit. Is there another way to conduct business to avoid overtime completely or at least reduce to Supervisors who are paid more? Example- allegations of Supervisors being called in to close up fire stations when an employee who is there working could do it. Only front-line Manager/Supervisory positions (A3 and M1) are eligible for over time (OT). All overtime is driven by operational requirements and must be pre-approved by Managers. With respect to the close up of fire stations - they run as a 24 hour operation. Rural stations are not occupied with volunteers 24/7, but there is no formal closing procedure. Unionized supervisors are not called in for closing of stations and any potential overtime is paid according to Collective Agreement provisions. #16 Previously I requested a staffing analysis, looking at our upper management structure. Do we need this number of managers, and if so, are they in the appropriate business unit? Do we need this size of executive management team? This idea was put forward as a suggestion previously, and was reviewed by the former CAO. It was determined that the existing structure works well in terms of the reporting span of control and is effective in terms of the breadth of oversight responsibilities. The Senior Management structure in HRM has been flattened in recent years by a reduction in the number of Business Units and, when compared to benchmark cities, it was determined that the current senior and executive management structure in HRM is appropriate. This may be a question you wish to advance to the new CAO.
#17 The participation rate of EDO’s and total number of employees and total number of days. Do we know how the edo's affect the workload of others? Is there a policy for edo participation within a department? Currently, there are 224 employees participating in the Earned Day Off (EDO) program. There is no accumulated data that refers to how the participation rate impacts the work of others; however, the premise of the program is for others not to be impacted negatively. Managers are responsible for managing their unit to ensure operational requirements are being met. Yes, there is a guideline for EDO participation along with a contract that both the employee and manager sign. Also, some collective agreements have articles that refer to flexible working options. The final decision is that of the Manager and is based on operational requirements. Participation in the EDO program is privilege and not a right. #18 Do we have a policy for the number of staff attending conferences, such as AMA? Similar to FCM, can a certain number go each year instead of everyone? When people do attend conferences do they provide a report back to their colleagues to share the information? There is no formal policy as to how many people can attend a conference; the decision is based on operational requirements, performance planning and budget. Each BU manages their own training function, and it is strongly encouraged for employees to share their learning with their colleagues. #19 New business units have been created - have they resulted in more staff, and if so at what cost? Example: Infrastructure and Asset Management, Corporate Communications, etc. Is there a measurement of success? External and Corporate Affairs is a division of the CAO Business Unit which was created in 2008 with the purpose of realigning a group of pre-existing staff members under one umbrella to better support corporate outcomes. The External and Corporate Affairs (ECA) includes graphic design, print shop, marketing and communications, and public affairs. There are a total of 22 marketing and communications positions within ECA. Of these positions, thirteen support the full service printing centre and graphic design function, six primarily support marketing, and three directly support public affairs. The two Senior Communications Advisors that now report through the Manager of Public Affairs are positions that were formerly included in the marketing group. There have been no FTE increases to this division. The Infrastructure and Asset Management Business Unit was created in 2007 which also realigned a group of pre-existing staff members under one umbrella to better support corporate outcomes. At its inception there were no new FTE's created. Fluctuations in staff resources have occurred since that time, such as a larger SEMO office, and reflect the organizations response to Council Focus areas and project work. The Business Unit has not, to this point, created a metrics to measure effectiveness. However, the delivery of the stimulus funds work, an unprecedented increase in capital funding in addition to the regular slate of work could be taken as a measure of success. #20 Do we pay overtime to staff to work on floats, etc. at community events. Can some of this work be done by community volunteers? If unionized staff are working at any event that Community Development - Community Relations & Cultural Affairs staff coordinate, including floats and parades the provisions of the respective collective agreements are followed regarding overtime provisions. This may also include other Business Unit staff such as TPW who may be involved in the set-up of a stage, delivery of a float, provision of fencing,

barricades etc. Community volunteers currently make a tremendous contribution, to events and will continue to be utilized to reduce costs. #21Is it true that if someone is in Acting position, when someone else takes position and Acting person reverts back to original position, that person's salary does not revert back accordingly Employees who temporarily accept an acting assignment may receive an increase in salary for the duration of the assignment. Once the assignment ends, the salary reverts to the amount it would have been prior to the acting assignment.

Process and Service Theme
Question 1 - Is the Dec 13/14th meeting going to be in-house?
Yes, in Council Chambers in a COW format.
Question – 2 We need to be clear of the format for the 13th & 14th.
Subject to Council’s acceptance, the format now is to obtain Council direction on budget preparation for
the next two fiscal years. This, as a continuation of the Nov. 23rd COW and will be done in a COW format
consisting of a staff presentation of responses to the questions submitted and debate on the direction
sought.
Assuming it is Council’s direction to explore service reductions for 2012/13, following the COW session,
a workshop style process has been designed to determine those service areas to explore for reduction
opportunities.
Question 3 - Council Focus Areas vs. CAO Focus Areas, do they work together?
Question 4 - I would like to see a balance of how we grow the municipality between a visionary
process and a management process. I do believe this is the role of the CAO. It is ultimately the CAO
who takes the vision of Council (Focus Areas) and provides the management (Fiscal
Responsibility/Employer of Choice) to make it become reality
Community expectations are described in the Corporate Planning Framework as Community Outcomes
or “goals”. These are aspirational outcomes that should be representative of what the broader
community wants. The Objectives within each Outcome are more tangible, things the organization will
try to achieve or help to facilitate achievement. Not all Objectives will be resourced equally or at the
same time due to the limited resources available. Council Focus Areas (CFA’s) are those service areas
(priorities) where Council wants additional emphasis, priority, and resources applied in order to advance
desired community outcomes.
The CFA’s establish which Objectives are most important to apply resources and once that is done the
organization builds plans which will align resource with objectives.
The EMT (Administrative Priorities) support the achievement of CFA’s since the EMT Priorities are
generally those areas that enable the organization to deliver services to the community, primarily “back
office” service areas. Success in the EMT Priorities enables the organization to be successful in delivering
all services, including those within the CFA’s.
Question 5– We could cut back on "Communications" positions. Why do we have so many people doing "Communications" throughout the organization, rather than one designated office? There is one designated office that coordinates corporate communications in HRM. The External and Corporate Affairs (ECA) division of the CAO Business Unit includes graphic design, printing and postage services, marketing and communications, and public affairs. ECA provides a wide range of communications and marketing expertise to staff and Council. Many of the programs and services provided by the nine core HRM Business Units require some level of external and internal

communication support. As well, there are several corporate initiatives and a variety of media and public issues which require marketing and communications to ensure relevant and consistent messaging. In addition, Council has identified Communications and Governance as one of its Focus Areas. There are a total of 22 marketing and communications positions within ECA. Of these positions, thirteen support the full service printing centre and graphic design function, six primarily support marketing, and three directly support public affairs. Two positions have been added to this group since 2005 - one graphic designer and an administrative support assistant. The two Senior Communications Advisors that now report through the Manager of Public Affairs are existing positions that were formerly included in the marketing group. Aside from the positions in External and Corporate Affairs, there are also specialized positions in Infrastructure and Asset Management, Fire, Police, and Transit which help to address the high volume of communications activity generated in those areas. These positions work closely with External and Corporate Affairs on corporate initiatives and issues management when required. Question 6 - Corporate planning framework and its relation to communities' expectations, as well as a
plan to make the community aware of costs.
Community expectations are expressed in many ways. Community Visioning is a structured process that engages a community in an exercise to determine what the community wants into the future. This visioning exercise is done in such a way that the participants are aware that they are not developing a concrete plan, so there are no specific costs associated with their vision. Costs for investment in communities are not known until specific plans are made and fully evaluated. Question 7 – Destination Halifax/GHP. When will a report come back on that? Any savings?
The report on the economic development governance review, which includes Destination Halifax, Trade Centre Ltd., and the Greater Halifax Partnership, will be completed after the Economic Strategy review is finalized. The Economic Strategy renewal and recommendation to Council is expected to be completed by the end of the 2010/11 fiscal year. The results of the economic development governance review will follow early in 2011/12. Any potential savings as a result of the review will not be known until that time. Question 8 – Why is analysis required around merging Mayor's Office and Councillors Support Office?
Any change in service delivery requires analysis, particularly if the change is being proposed in order to reduce staffing levels. Making a change without detailed analysis could result in reduced levels of service, as it would be difficult to ascertain the impact of reduced staffing levels. While there are some similarities in terms of service to the public, the work undertaken by the Mayors’ office is different from that undertaken by the Councillors’ office. The Mayor and his staff are heavily involved in issues of protocol and intergovernmental relations, and the Mayor attends a wide array of public and private functions which require more specialized support. The focus of staff in the Councillors’ office is largely on supporting Councillors in their role representing a particular district. This includes addressing resident concerns, collecting information from staff and preparing communications. District issues are often similar in nature from one district to the next, which allows staff to transition easily from supporting one Councillor to another.

In any consideration of staffing levels within the two offices, Council would need to consider in detail the unique job requirements within each office. This is particularly important given that the results of the upcoming Boundary review will have an impact on both offices. Question 9. What functionality or services can be outsourced possibly? Simply stated, essentially any municipal service can be outsourced depending on HRM’s collective will to
commit adequate resources to conduct the required analysis and to accept all associated risks as
generally outlined below.
HRM staff continually review and assess new ways, including outsourcing and insourcing, to achieve
better value for every taxpayer dollar spent. HRM services most commonly contracted to date have
been those of a repetitive nature which draw on relatively unskilled or semi-skilled labour (e.g. solid
waste collection, grass cutting, snow plowing to name but a few) or highly specialized services such as
architectural, engineering, legal and information technology. It should be noted that HRM staff have
also successfully insourced several services/functions that have generated savings for taxpayers. There
are no universal guidelines or norms as to what municipal services should or should not be contracted;
however, HRM staff feel that the outsourcing/insourcing of more operational and support
services/functions should be explored further.
Outsourcing (also known as Contracting Out or Alternative Service Delivery (ASD)) in the Public Sector
can be complicated. Challenges posed by time-consuming procurement processes, union pressure,
labour relations legislation, changing leadership, shifting political agendas, fear of loss of
control/accountability, and uncertain budgetary support can generate status-quo inertia and must be
overcome. The biggest constraint to further contracting out, as encountered during the early stages of
HRM’s Service Review process, appears to be the lack of resources/expertise to adequately analyze and
evaluate the merits and risks of contracting. Given the significant challenges and risks associated with
outsourcing and the fact that these initiatives can and do fail, best practice literature stresses that both
political and executive management involvement/leadership is required to ensure success. To that end,
it is staff’s intention to look for resource opportunities within the current budget envelope to strengthen
Service Review resources/expertise and return to Council with a proposed framework to evaluate
specific alternate service delivery (ASD) opportunities.
Question 10. Investigate outsourcing Human Resources, Payroll, and Information Technology As outlined in the previous question, it is staff’s intention to look for resource opportunities within the
current budget envelope to strengthen Service Review resources/expertise and return to Council with a
proposed framework to evaluate specific alternate service delivery (ASD) opportunities. Human
Resource and Information Technology services/functions will be considered for the initial mandate
sought from Council.
It should be noted that several Information Technology services/functions are already outsourced such
as technical support services for Halifax.ca, application support for specific applications, escrow services
for at-risk code, network security analysis, support for non-standard devices, parking ticket payment
system, management of parts for Wide Area Network, etc.. Staff have recently insourced HRM’s
computer provisioning process generating approximate savings of $700K/year.
It should also be noted that some Human Resources services/functions are already outsourced such
as…..need Cathi input.
Question 11. Are there services contracted out that we should look at taking in-house? Staff regularly evaluate contracted service performance and assess whether sustainable cost savings
and/or performance targets can be better achieved through the use of internal resources. There are a
number of situations throughout HRM, some of which are discussed above, where insourcing has
resulted in cost savings/performance improvement. As discussed above, it is recommended that HRM’s
Service Review resources be strengthened to accelerate and enhance the analyses currently performed
by staff.
Question 12. Savings by having the Library use HRM’s HR, finance, IT services. This opportunity is currently being explored under the Library Service Review process authorized by
Council. Staff are aiming to have the Review recommendations incorporated into the 2011/12 Budget
and Business Plan for Council’s consideration in April 2011.
Question 13. Rationalization of Fleet to include various business units and trades. This opportunity is currently being explored under the Fleet Service Review process authorized by
Council. Staff are aiming to have the Review recommendations incorporated into the 2011/12 Budget
and Business Plan for Council’s consideration in April 2011.
Question 14 - Slide 37 – what is meant by light fleet – what is not included here and why? Light fleet refers to all light vehicles and excludes emergency response vehicles with lights as well as heavy trucks and machinery. The scope of the Service Review was limited to light vehicles because the heavy vehicles and equipment and emergency vehicles serve specific purposes and should more logically be reviewed as part of those individual services. For example, under the Winter Works Service Review, heavy equipment employed in this program will also be examined. Question 15. Are we exploring all opportunities to “work smarter not harder” (invest in systems/processes/workforce development)? Can we work “smarter and harder”? Consideration to be given to train staff with time management and budgeting. Staff are committed to continuous improvement. Considerable investments are being made daily
toward improving our business processes and leveraging technology. Workforce development is key to
organizational success and is achieved through a variety of methods. Training is a significant element of
workforce development and HRM maintains a substantial catalogue and calendar of training
opportunities that can be found at
http://insiderhrm/BusinessUnits/HumanResources/Documents/Employee.pdf. Specific to budgeting
and time management, the following related courses are offered:
a. How Municipal Government Works - An Orientation (Jack Novack)

b. Introduction to Municipal Finance (Jack Novack)
Includes: . Overview of the expenditure and revenue structure of local government . Taxation and assessment . Role of the internal and external auditors . Fund accounting . The capital budget . The budget as a planning instrument . The legal aspects of financial management . Business planning . The Municipal financial condition . Issues in Municipal Finance
c. Introduction to Financial Policy (Jack Novack) Includes: . HRM financial policies . Decision-making models . Public finance theory and practice . User fees, area rates and the general rate . Equity in financial decision making . Assessing alternative revenue sources . Performance indicators . Alternative service delivery . Provincial-municipal relations . Pricing municipal services
d. Time and Priority Management (includes how technology fits into time management)
There are also a number of courses offered external to HRM in these subject areas and these would be leveraged as the personal situation dictates.
Question 16. Perhaps Regional Council could be provided with a reality check with money matters
more often than is presently done. Consider how this could be achieved.
Staff fully agree with this observation and that is why staff are engaging Council with the annual Budget
and Business Plan consultations in November as opposed to waiting until February as per past years. In
addition to the annual Budget and Business Planning process, Finance staff present quarterly financial
statements to Council as well as a presentation of the year end audited financial statements in the Fall
(typically). Pending final approval of the Terms of Reference for the new Finance and Audit sub-
committee of Council, staff look forward to working closely with members of the sub-committee to
achieve a better mutual understanding of HRM’s financial matters.
Question - 17 As an alternative to the open house sessions would like to go back to having business
units present their budgets.
In 2006/07 Council adopted the Open House Process to provide individual Councillors with an informal,
one on one opportunity to ask detailed questions of clarity around the budget and business plans. This
was done in an effort to keep council’s collective budget discussion at a high level, avoiding the need for
individual business unit questions at a granular level that could have been answered by staff prior to the
debate.
Every year staff undertakes a survey of Council to determine lessons learned form the previous budget
and business planning process. It was apparent from last year’s survey that the schedule was of greatest
concern. Councillor’s generally felt that they were rushed and didn’t have sufficient time to gather all of
the information they needed. Last year’s schedule was significantly impacted by Council’s desire to
complete budget deliberations prior to the FCM Conference.
The program staff is proposing this year is as follows (subject to Council approval):
Date Element Location
Tuesday, April 5 Table Corporate Plan and Budget Council
Wednesday, April 6 – Monday, April 11 Detailed Review (6 days) n/a
Open House
Tuesday, April 12
Capital Projects Budget Councilor’s Lounge
Fiscal Elements (Reserves, Rates, etc) Trophy Room
BU Operating Budgets Halifax Hall
Wednesday, April 13 Q&A’s compiled n/a
Friday, April 15 Q&A responses in Council Package n/a
Tuesday, April 19 Budget Debate Begins Council
Note: Business Unit Presentations have not be part of the program for the past 3 years, but can be re-
introduced should Council desire. Staff intend to engage Council on this matter on December 13th & 14th.
Question 18. What opportunities exist for back-office sharing? HRM follows a “shared services” model and therefore the majority of HRM business units fully share
back-office resources such as Finance, Legal, HR, Records Management, Facilities Management and
Information Technology. HRM support services also maintain a significant number of Service Level
Agreements that govern sharing with our various Agencies, Boards, and Commissions.
Staff regularly look for ways to further extend the sharing of these back-office resources. For example, the current Library Service Review is specifically focused on increased sharing of support services. While there remains several smaller sharing opportunities that will be explored within HRM, larger opportunities should be explored external to HRM with organizations like the Province and the various utilities such as NS Power, Aliant, etc.. The most significant barrier to this approach appears to be a collective willingness to be dependent on one another and share risk. Some informal discussions have commenced on this front and are expected to continue as fiscal pressures continue to mount. Question – 19 Park Patrol - what were the impacts of eliminating that one position? No positions were eliminated in Park Patrol through the 2010 budget process. Due to the Vacancy Management Program the funds were not available to continue contract security guards for Parks Patrol

in 2010/11 as in previous years. The impact of this is reduced park patrols, however there has been no recorded increase in vandalism or other incidents in the parks.
Question - 20 Expressed worry for the relationship with the Arts Community if we do anything with
Public Art funding.
Yes and no. The success with HRM’s public art program to date has been mainly due to our focus on
temporary projects, performances and installations (ie. Nocturne Festival, Hopscotch Festival, Damsel
Day (Dartmouth), The Commons Project (Halifax), The Sea Level Rise Project (Halifax and Dartmouth
Waterfronts), Barrington Street Projection (Afghani Market), Miscellaneous Marching Band (HRM wide),
Traffic Boxes, Outdoor Mural Projects, etc.) This has been funded through cultural affairs operating
budget and the Cultural development Reserve.
With respect to the proposed cut before Council, these refer to expenditures on permanent works of
public art such as the Fallen Peace Officers Memorial (Grand Parade) and the North is Freedom piece
(North Branch Library). These initiatives represent an important aspect of neighbourhood and
community self-identification, and support to local artists, and should be encouraged.
However, the Public Art Policy provides additional means to fund permanent works in the absence of a
set capital budget. Specifically, the opportunities include the construction of new public municipal
facilities, private developments and parkland redevelopment. Rather than viewing these as restrictive
funding mechanisms, staff sees this as an ideal opportunity to better integrate permanent public
artworks within the larger planning processes for major construction projects, parkland developments,
streetscaping projects, etc. The new Halifax Central Library public art project is a great example of this
type of collaboration.
Staff will be working over the next several months to amend the Public Art Policy to ensure the capital
planning program integrates and includes a budget for permanent public art, in the absence of a
separate capital budget approved by Council.
Question – 21 I am getting a lot of calls about street cleaning services – some people are saying that
they do not get weekly service now so why should this be expected? How important is the street
cleaning service to the storm water system – is it needed to move debris that will reduce our costs
downstream? Is there any potential to improve the street cleaning process and save funds? How
much?
Staff agree there are areas for improvement with this service. There is currently an internal operational review underway which will be completed Jan/Feb 2011. Staff will advise council of the results once the review is complete.
Question – 22 How does winter works affect summer works in terms of staff commitment and hours?
Municipal Operations staff resources support both summer operations and winter works. Summer
season ( April 15 - Nov.15) Winter works Nov.15 - April 15. The service is further supported by
community partnerships, and contracted services.

A total of 196 CUPE staff are involved directly in the winter works program.
6 CUPE staff are identified as operationally exempt meaning they are assigned tasks that are non
snow related as these tasks are carried out during snow operations. ie. service truck, parks
assignments.
8 CUPE staff are medically exempt from winter works snow assignments working along with
operationally exempt staff
Total number of full time non union and management staff is 47
Total number of seasonal/ student is 85 ( summer months)
MOPS ramps up with seasonal/ students in summer to deliver related programs and allow senior staff
time to use vacation entitlements.
In winter students are laid off. A base number of assignments are carried to deliver the snow program,
and ramp up with contracted services when base staff cannot respond to a snow event. HRM staff are
first responders. When not engaged in snow control activities, these staff engage in tier 2 and 3 duties
such as but not limited to street and parks maintenance activities.
A two shift approach is employed with rotational teams to allow a base number of staff to engage in
night shift activities. Reducing overtime costs, and supporting maximum work delivery by day. When a
snow event is expected the night shift teams report from day duties to night duties. This results in
maximum efficiencies and controls costs by reducing potential for overtime costs.
A number of seasonal staff are brought on during the winter works season to backfill the lost resources
caused by medical and operational exemption.
A balance of contracted resources and HRM resources are applied with the greatest flexibility as can be
achieved depending on the appropriate response required to a snow event.
Question - 23 Identify which service reductions would yield the most significant dollars.
The highest cost savings would be realized if reductions were made in those services with the highest
costs, unfortunately those are often the services that are most important to the community, such as
emergency services, transit, public works, etc. Identification of service areas to explore for reduction
should be done through a collaborative prioritization process where the services with the least
significant impact are considered for reduction.
Question - 24 Please provide a schedule for all reviews being done – whether they are service reviews
or audits by the Auditor General and anticipated dates of when they will be completed (Publication
review, fleet, economic development governance, facility review – all the ones mentioned in the
attachment to Nov 23 staff report under the title Expenditure Reduction Opportunities). Please link
this to the other major planning exercises we are undertaking such as the regional plan review and
the new economic plan – trying to understand when we will have information on other efficiencies
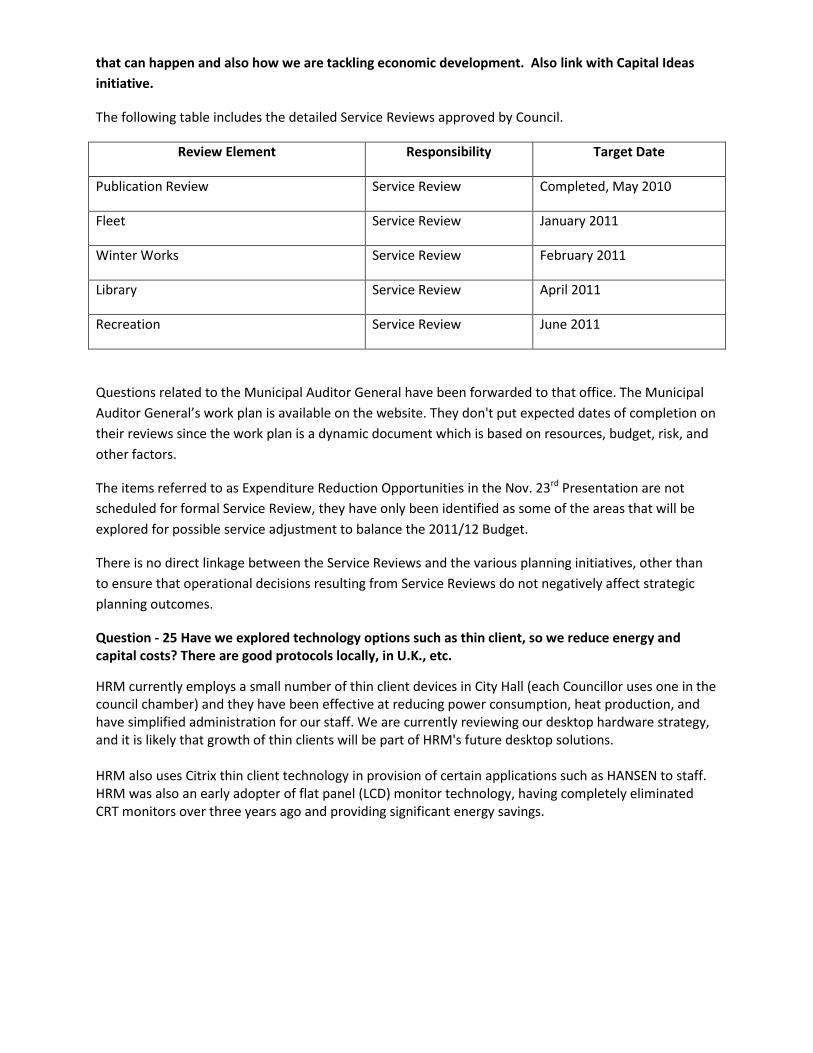
that can happen and also how we are tackling economic development. Also link with Capital Ideas
initiative.
The following table includes the detailed Service Reviews approved by Council.
Review Element Responsibility Target Date
Publication Review Service Review Completed, May 2010
Fleet Service Review January 2011
Winter Works Service Review February 2011
Library Service Review April 2011
Recreation Service Review June 2011
Questions related to the Municipal Auditor General have been forwarded to that office. The Municipal
Auditor General’s work plan is available on the website. They don't put expected dates of completion on
their reviews since the work plan is a dynamic document which is based on resources, budget, risk, and
other factors.
The items referred to as Expenditure Reduction Opportunities in the Nov. 23rd Presentation are not
scheduled for formal Service Review, they have only been identified as some of the areas that will be
explored for possible service adjustment to balance the 2011/12 Budget.
There is no direct linkage between the Service Reviews and the various planning initiatives, other than
to ensure that operational decisions resulting from Service Reviews do not negatively affect strategic
planning outcomes.
Question - 25 Have we explored technology options such as thin client, so we reduce energy and capital costs? There are good protocols locally, in U.K., etc.
HRM currently employs a small number of thin client devices in City Hall (each Councillor uses one in the council chamber) and they have been effective at reducing power consumption, heat production, and have simplified administration for our staff. We are currently reviewing our desktop hardware strategy, and it is likely that growth of thin clients will be part of HRM's future desktop solutions. HRM also uses Citrix thin client technology in provision of certain applications such as HANSEN to staff. HRM was also an early adopter of flat panel (LCD) monitor technology, having completely eliminated CRT monitors over three years ago and providing significant energy savings.

Asset Theme
Question - 1 What is the status of the Bloomfield plan?
Staff have completed a market analysis in consultation with the development community and
representatives of the cultural community. Significant feedback has been received with regard to
ensuring the content of the RFP will achieve Councils stated objectives. Staff will be presenting the
results of this stage of the project to Community Council in early 2011 with the intent of completing and
releasing the RFP in spring of 2011.
Question - 2. A list of upcoming capital works projects
Year 2 of the 5- year Capital Plan is currently being reviewed and will be tabled as 2011/2012 Capital
Budget. The plan as previously approved by Council can be viewed at:
http://www.halifax.ca/budget/documents/2010-11CAPITALBOOKFINAL.pdf .
The following table indicates the project category, project name and the allocation of funds by year as
reflected in the 5-year plan. It should be noted that the plan is currently under review and
recommendations for changes due to financial circumstances may be forthcoming for Council’s
consideration as part of the budget review process.
Project Asset
Category Project Name 2010 2011 2012 2013 2014
Grand Total
Buildings
Accessibility - HRM Facilities 150,000 200,000 200,000 200,000 200,000 950,000
Alderney Gate Recapitalization(Bundle)
310,000 295,000 323,000 350,000 350,000 1,628,000
All Buildings Program (Bundle) 610,000
610,000
Architecture - Exterior (Category 2)
85,000 50,000 50,000 100,000 100,000 385,000
Architecture - Interior (Category 5)
1,050,000 400,000 450,000 500,000 500,000 2,900,000
Beaverbank Community Centre 4,000,000 500,000
4,500,000
Bedford 4-pad Arena 18,333,000
18,333,000
Canada Games Centre 4,000,000 500,000
4,500,000
Centennial Pool Upgrades 2,700,000
2,700,000
Central Library 10,000,000 22,000,000 21,000,000
53,000,000
Consulting - Buildings (Category 0)
87,000 250,000 60,000 250,000 250,000 897,000
East Dartmouth Fire Station
500,000 4,000,000 4,500,000
Electrical (Category 7) 165,000 650,000 650,000 650,000 650,000 2,765,000
Energy Efficiency Projects 513,000 500,000 500,000 500,000 500,000 2,513,000
Fire Station Land Acquisition
735,000
735,000
Fuel Depot Upgrades
400,000 400,000 400,000 400,000 1,600,000
Halifax City Hall Stone Restoration
1,333,333 2,000,000 2,000,000
5,333,333
Herring Cove Fire Station 2,700,000
2,700,000
HRM Heritage Buildings Upgrades (Bundle)
300,000
300,000
Hubley Fire Station 2,750,000
2,750,000

Major Facilities-Upgrades (Bundle)
2,101,000 3,258,000 1,500,000 6,500,000 6,500,000 19,859,000
Mechanical (Category 6) 400,000 860,000 1,185,000 1,000,000 1,000,000 4,445,000
Metropark Upgrades 60,000 60,000
120,000
New Bedford West Fire Station
3,500,000 1,500,000
5,000,000
North Preston Community Centre Expansion
1,000,000
1,000,000
Porter's Lake Community Centre 2,144,000 1,056,000
3,200,000
Roof (Category 3) 660,000 505,000 535,000 1,200,000 700,000 3,600,000
Site Work (Category 1) 325,000 1,040,000 60,000 200,000 200,000 1,825,000
Strategic Community Facility Planning
50,000 3,200,000 1,500,000 500,000 500,000 5,750,000
Structural (Category 4) 70,000 200,000 125,000 200,000 200,000 795,000
Three Harbour Fire Station
1,000,000
1,000,000
Buildings Total
54,896,333 39,659,000 35,038,000 14,550,000 16,050,000 160,193,333
Business Tools
Asset Management
425,000 600,000 350,000
1,375,000
Automatic Vehicle Location Equipment
200,000
200,000
Corporate Customer Database 60,000 102,000
162,000
Corporate Document/Record Management
200,000 212,500 250,000 250,000
912,500
Desktop Software Upgrade 230,000 230,000 230,000
690,000
Fibre Optics Network 300,000
300,000
Future Business Tools
270,000 750,000 1,350,000 2,370,000
GIS Infrastructure Upgrade 100,000 125,000 150,000 150,000 150,000 675,000
HRM Security Management-Security Cards
165,000
165,000
InfoTech Infrastructure Recapitalization
387,000 500,000 500,000 500,000 1,887,000
Non Inventoried Asset Management
200,000 331,500
531,500
SAPHR Project 300,000 200,000
500,000
Streets and Services Permits 150,000
150,000
Trunk Mobile Radios - TMR
4,500,000
4,500,000
Business Tools Total
1,705,000 6,713,000 2,000,000 2,000,000 2,000,000 14,418,000
Community & Property
Development
Center plans/Design (Visioning)
115,000 200,000 300,000 300,000 915,000
Civic Events and Infrastructure 50,000 50,000 50,000 50,000 50,000 250,000
Cogswell Design and Administration
100,000
100,000
Cultural Facilities 50,000 50,000 50,000 50,000 50,000 250,000
Downtown Streetscapes 1,000,000 7,500,000 3,600,000 2,100,000
14,200,000
HRM Public Art 250,000 200,000 200,000 200,000 200,000 1,050,000
Monuments and Commemoration
100,000 100,000 100,000 100,000 100,000 500,000
Regional Plan 5 year review
400,000 150,000
550,000
Shubenacadie Canal Comm/Canal Greenway
584,000 500,000 420,000
1,504,000
Special Places and People 150,000 50,000 50,000 50,000 50,000 350,000
Streetscaping in center hubs/corridors
483,000 1,000,000 1,000,000 1,000,000 1,000,000 4,483,000
Watershed Environmental Studies
125,000 400,000 250,000 250,000 250,000 1,275,000

Community & Property
Development Total
2,892,000 10,365,000 6,070,000 4,100,000 2,000,000 25,427,000
District Activity Funds
District 1 Capital Funds 65,000 65,000 65,000 65,000 65,000 325,000
District 10 Capital Funds 65,000 65,000 65,000 65,000 65,000 325,000
District 11 Capital Funds 65,000 65,000 65,000 65,000 65,000 325,000
District 12 Capital Funds 65,000 65,000 65,000 65,000 65,000 325,000
District 13 Capital Funds 65,000 65,000 65,000 65,000 65,000 325,000
District 14 Capital Funds 65,000 65,000 65,000 65,000 65,000 325,000
District 15 Capital Funds 65,000 65,000 65,000 65,000 65,000 325,000
District 16 Capital Funds 65,000 65,000 65,000 65,000 65,000 325,000
District 17 Capital Funds 65,000 65,000 65,000 65,000 65,000 325,000
District 18 Capital Funds 65,000 65,000 65,000 65,000 65,000 325,000
District 19 Capital Funds 65,000 65,000 65,000 65,000 65,000 325,000
District 2 Capital Funds 65,000 65,000 65,000 65,000 65,000 325,000
District 20 Capital Funds 65,000 65,000 65,000 65,000 65,000 325,000
District 21 Capital Funds 65,000 65,000 65,000 65,000 65,000 325,000
District 22 Capital Funds 65,000 65,000 65,000 65,000 65,000 325,000
District 23 Capital Funds 65,000 65,000 65,000 65,000 65,000 325,000
District 3 Capital Funds 65,000 65,000 65,000 65,000 65,000 325,000
District 4 Capital Funds 65,000 65,000 65,000 65,000 65,000 325,000
District 5 Capital Funds 65,000 65,000 65,000 65,000 65,000 325,000
District 6 Capital Funds 65,000 65,000 65,000 65,000 65,000 325,000
District 7 Capital Funds 65,000 65,000 65,000 65,000 65,000 325,000
District 8 Capital Funds 65,000 65,000 65,000 65,000 65,000 325,000
District 9 Capital Funds 65,000 65,000 65,000 65,000 65,000 325,000
District Activity Funds Total
1,495,000 1,495,000 1,495,000 1,495,000 1,495,000 7,475,000
Equipment & Fleet
Emission Reduction - Public Transit Buses
36,000 50,000
86,000
EMO Emergency Situational Trailer
450,000
450,000
Fire Apparatus Replacement 1,922,200 2,360,000 4,000,000 3,378,000 3,200,000 14,860,200
Fire Services Water Supply
400,000 400,000 400,000 400,000 1,600,000
Fire Utility Replacement 500,000 300,000 300,000 300,000 300,000 1,700,000
Fleet Vehicle Replacement 1,310,000 2,200,000 4,000,000 3,378,000 3,000,000 13,888,000
Identification Unit - Police Services
100,000
100,000
Opticom Signalization System 80,000 80,000 80,000 80,000 80,000 400,000
Police Marked Cars 1,575,000 1,311,000 2,150,000 2,150,000 1,800,000 8,986,000
Police Negotiations Unit
125,000
125,000
Replacement Ice Resurfacers
100,000 100,000 100,000 300,000
Salt Inventory Control 50,000
50,000
Self Contained Breathing Apparatus Replacement
2,400,000 2,400,000
4,800,000
Vehicle Weigh Scales
110,000
110,000
Welding Shop - Thornhill Drive 450,000
450,000
Equipment & Fleet Total
8,323,200 9,101,000 11,815,000 9,786,000 8,880,000 47,905,200
Industrial Parks Aerotech Repositioning & Dvlmnt
1,000,000
2,000,000
3,000,000
Bayers Lake Infill & Ragged Lk Dvlpmnt
10,000,000 6,000,000 6,000,000 6,000,000 28,000,000

Burnside & City of Lakes Development
3,000,000 10,000,000 15,000,000 15,000,000 10,000,000 53,000,000
Development Consulting 50,000 50,000 50,000 50,000 50,000 250,000
North Dartmouth Trunk Sewer 4,000,000
4,000,000
Park sign renewal & Maintenance
50,000 50,000 50,000 50,000 50,000 250,000
Washmill Lake Court/102 Underpass/Regency Park Dr
8,500,000
8,500,000
Industrial Parks Total
15,600,000 21,100,000 21,100,000 23,100,000 16,100,000 97,000,000
Metro Transit
200 Ilsley Avenue -Safety Upgrades
340,000
340,000
Access-A-Bus Expansion 550,000 900,000 900,000 900,000
3,250,000
Access-A-Bus Replacement 70,000 543,000 797,000 520,000 450,000 2,380,000
Biennial Ferry Refit 580,000 500,000 520,000 520,000 520,000 2,640,000
Bus Stop Accessibility
125,000 125,000 125,000 125,000 500,000
Conventional Bus Expansion 7,129,000 4,000,000 8,425,000 5,075,000 4,500,000 29,129,000
Conventional Bus Replacement 3,200,000 3,700,000 1,350,000 2,700,000 4,500,000 15,450,000
Ferry Terminal Pontoon Protection(Bndl)
700,000
700,000
FFE Ragged Lake Transit Facility 600,000
600,000
MetroLink 1,479,300 8,400,000
9,879,300
Mid Life Bus Rebuild 655,000 655,000 655,000 655,000 655,000 3,275,000
New Conventional Ferry 2,000,000 4,500,000 4,500,000
11,000,000
Ragged Lake Transit Centre
800,000 5,140,000 5,940,000
Rural Community Transit - 2,656,000 1,450,000 4,970,000 1,500,000 10,576,000
Rural Transit Plan
325,000 325,000 325,000
975,000
Service Vehicle Replacement 60,000 60,000 60,000 60,000 60,000 300,000
Shelters Replacement/Expansion
105,000 105,000 105,000 105,000 420,000
Transit Facilities Upgrades(Bundle)
400,000 425,000 450,000 450,000 450,000 2,175,000
Transit Security 400,000 425,000 450,000 450,000 450,000 2,175,000
Transit Software 500,000 200,000 200,000 200,000 140,000 1,240,000
Transit Strategy
350,000
350,000
Transit System Accessibility 105,000
105,000
Transit Terminals Upgrade & Expansion
4,805,000
3,131,000 3,688,000 1,373,000 12,997,000
Vehicle Tracking & Communication Equipment
Replacement 65,000
60,000 60,000 60,000 245,000
Metro Transit Total
23,638,300 27,519,000 23,503,000 21,953,000 20,028,000 116,641,300
Parks and Playgrounds
Artificial Fields
100,000 1,400,000 600,000 600,000 2,700,000
Athletic Field/Park Equip (Bundle) 50,000 85,000 85,000 85,000 85,000 390,000
Ball Field Upgrades (Bundle) 70,000 178,000 250,000 200,000 250,000 948,000
Cemetery Upgrades (Bulk) 30,000 50,000 50,000 50,000 50,000 230,000
Chester Spur Line - ISF 1,000,000
1,000,000
Horticultural Renovations 30,000 50,000 50,000 50,000 50,000 230,000
Indoor Soccer/Field Sport Facility 1,900,000
1,900,000
Lawn Bowling Facilities (Bundle)
20,000 50,000 50,000 50,000 170,000
Mainland Common Development
100,000 100,000 50,000
250,000
New Parks & Playgrounds (Bundle)
325,000 300,000 215,000 400,000 450,000 1,690,000
New Sports Court Development(Bundle)
100,000 100,000 100,000 100,000 400,000

New Street Trees Program (Bundle)
125,000 225,000 250,000 250,000 275,000 1,125,000
Outdoor/SprayPools&Fountains(Bundle)
480,000 50,000 50,000 50,000 75,000 705,000
Park Land Acquisition 440,000 500,000 500,000 500,000 500,000 2,440,000
Parks Upgrades (Bundle) 259,000 475,000 500,000 515,000 565,000 2,314,000
Pathways-Park, HRM Wide (Bundle)
50,000 135,000 125,000 125,000 150,000 585,000
Playground Upgrds&Replacemnts(Bundle)
485,000 400,000 400,000 400,000 450,000 2,135,000
Point Pleasant Park Upgrades 1,333,333 300,000 400,000 400,000 475,000 2,908,333
Portland Hills Trail - RInC 600,000
600,000
Public Gardens Upgrades 900,000 100,000 100,000 100,000 150,000 1,350,000
Regional Park Washroom Facility's(Bundle)
250,000 200,000
200,000 200,000 850,000
Regional Trails Acquisition 200,000
200,000
Regional Trails Active Transportation
- 822,000 850,000 850,000 850,000 3,372,000
Regional Trails: Maintenance 70,000 100,000 100,000 100,000 125,000 495,000
Regional Trails-Active Transport-Gas Tax
200,000
200,000
Skateboarding/Bike Facilities (Bundle)
100,000 100,000 100,000 100,000 400,000
Sports Court Upgrades (Bundle) 500,000 300,000 300,000 400,000 450,000 1,950,000
Sports Field Upgrades (Bundle) 50,000 175,000 200,000 200,000 250,000 875,000
Street Tree Replacement Program
125,000 185,000 175,000 175,000 200,000 860,000
Track and Field Upgrades (Bundle)
25,000 550,000 50,000 550,000 50,000 1,225,000
Parks and Playgrounds
Total
9,497,333 5,600,000 6,400,000 6,500,000 6,500,000 34,497,333
Roads & Streets
Bridges
1,109,000 1,295,000 2,000,000 2,500,000 6,904,000
Curb Renewals 560,000 680,000 1,500,000 2,000,000 2,000,000 6,740,000
Ernst Mill Bridge - ISF 1,570,000
1,570,000
Gravel Roads & Street Drainage Maintenance-Ops
130,000 160,000 205,000 215,000 215,000 925,000
New Paving Streets - Core Area 1,032,000 1,275,000 1,500,000 1,500,000 1,500,000 6,807,000
New Paving Subdivision St's outside core
2,500,000 2,500,000 2,500,000 2,500,000 2,500,000 12,500,000
Other Road Related Works
600,000 2,000,000 2,000,000 2,000,000 6,600,000
Paving Renewal Program 3,284,000 3,753,000 4,500,000 5,500,000 6,500,000 23,537,000
Resurfacing 10,390,000 9,405,000 13,000,000 13,700,000 14,900,000 61,395,000
Street Planer Patching-Var Locations
1,050,000 1,275,000 1,500,000 1,500,000 2,000,000 7,325,000
Roads & Streets Total
20,516,000 20,757,000 28,000,000 30,915,000 34,115,000 134,303,000
Sidewalks, Curbs & Gutters
New Sidewalks 1,750,000 2,125,000 2,500,000 4,000,000 5,000,000 15,375,000
Sidewalk Renewals 1,495,000 1,900,000 2,275,000 3,000,000 5,000,000 13,670,000
Sidewalks, Curbs &
Gutters Total
3,245,000 4,025,000 4,775,000 7,000,000 10,000,000 29,045,000
Solid Waste
Additional Green Carts for New Residents
300,000 435,000 735,000 735,000 735,000 2,940,000
Burner Installation Hwy101 Landfill
30,000
30,000
Cell 6 Construction - Otter Lake
16,600,000
16,600,000
Dredging of Siltation Pond 08/09
180,000
180,000
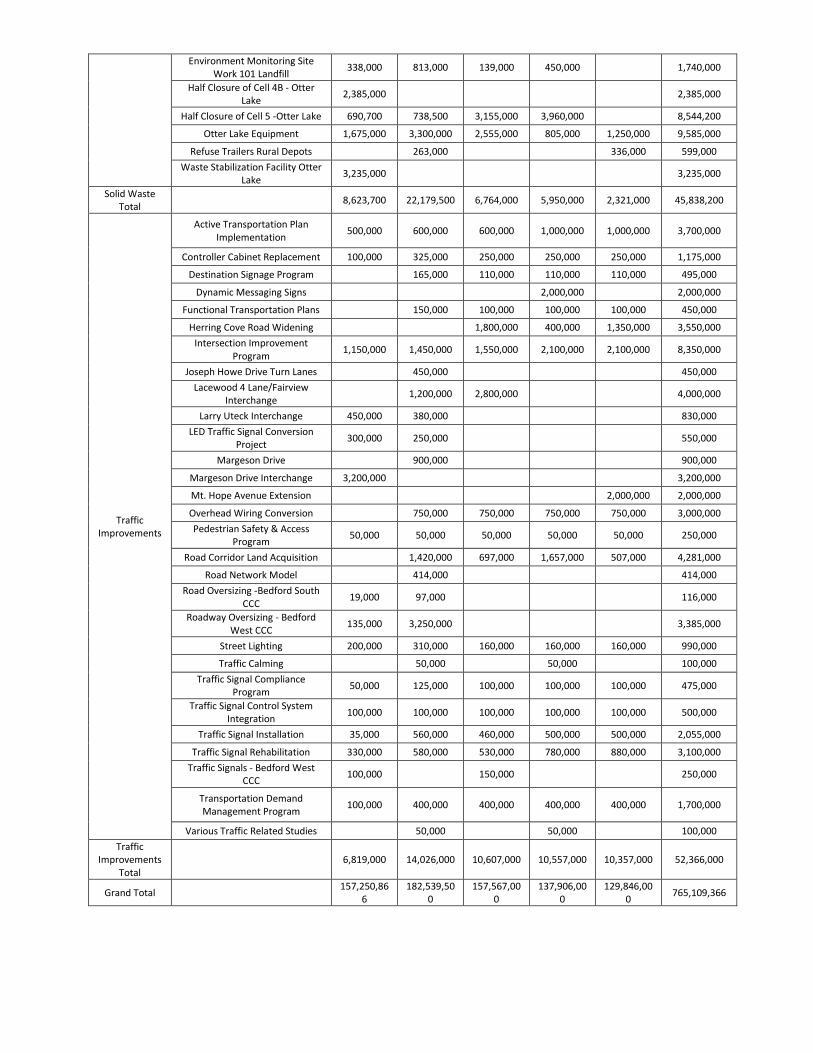
Environment Monitoring Site Work 101 Landfill
338,000 813,000 139,000 450,000
1,740,000
Half Closure of Cell 4B - Otter Lake
2,385,000
2,385,000
Half Closure of Cell 5 -Otter Lake 690,700 738,500 3,155,000 3,960,000
8,544,200
Otter Lake Equipment 1,675,000 3,300,000 2,555,000 805,000 1,250,000 9,585,000
Refuse Trailers Rural Depots
263,000
336,000 599,000
Waste Stabilization Facility Otter Lake
3,235,000
3,235,000
Solid Waste Total
8,623,700 22,179,500 6,764,000 5,950,000 2,321,000 45,838,200
Traffic Improvements
Active Transportation Plan Implementation
500,000 600,000 600,000 1,000,000 1,000,000 3,700,000
Controller Cabinet Replacement 100,000 325,000 250,000 250,000 250,000 1,175,000
Destination Signage Program
165,000 110,000 110,000 110,000 495,000
Dynamic Messaging Signs
2,000,000
2,000,000
Functional Transportation Plans
150,000 100,000 100,000 100,000 450,000
Herring Cove Road Widening
1,800,000 400,000 1,350,000 3,550,000
Intersection Improvement Program
1,150,000 1,450,000 1,550,000 2,100,000 2,100,000 8,350,000
Joseph Howe Drive Turn Lanes
450,000
450,000
Lacewood 4 Lane/Fairview Interchange
1,200,000 2,800,000
4,000,000
Larry Uteck Interchange 450,000 380,000
830,000
LED Traffic Signal Conversion Project
300,000 250,000
550,000
Margeson Drive
900,000
900,000
Margeson Drive Interchange 3,200,000
3,200,000
Mt. Hope Avenue Extension
2,000,000 2,000,000
Overhead Wiring Conversion
750,000 750,000 750,000 750,000 3,000,000
Pedestrian Safety & Access Program
50,000 50,000 50,000 50,000 50,000 250,000
Road Corridor Land Acquisition
1,420,000 697,000 1,657,000 507,000 4,281,000
Road Network Model
414,000
414,000
Road Oversizing -Bedford South CCC
19,000 97,000
116,000
Roadway Oversizing - Bedford West CCC
135,000 3,250,000
3,385,000
Street Lighting 200,000 310,000 160,000 160,000 160,000 990,000
Traffic Calming
50,000
50,000
100,000
Traffic Signal Compliance Program
50,000 125,000 100,000 100,000 100,000 475,000
Traffic Signal Control System Integration
100,000 100,000 100,000 100,000 100,000 500,000
Traffic Signal Installation 35,000 560,000 460,000 500,000 500,000 2,055,000
Traffic Signal Rehabilitation 330,000 580,000 530,000 780,000 880,000 3,100,000
Traffic Signals - Bedford West CCC
100,000
150,000
250,000
Transportation Demand Management Program
100,000 400,000 400,000 400,000 400,000 1,700,000
Various Traffic Related Studies
50,000
50,000
100,000
Traffic Improvements
Total
6,819,000 14,026,000 10,607,000 10,557,000 10,357,000 52,366,000
Grand Total
157,250,866
182,539,500
157,567,000
137,906,000
129,846,000
765,109,366

Question - 3. The status of building renovations relating to cost cutting, i.e. energy efficient lighting,
lower heat.
Question - 5. What are we doing to make building renovations more sustainable? IE lights that turn
off when no one is there, energy efficiency?
Facility Development has had a staff resource, Energy Auditor, for approximately 5 years on staff with a
responsibility to execute Energy Efficiency Projects in co-ordination with Facility Operations. The work
this resource has put out was summarily detailed in the December 2009 report on Energy Efficiency
Projects to Regional Council
(http://www.halifax.ca/environment/documents/EUGSPortionofCouncilSwedenPresentation120809.pdf)
where it was demonstrated that in spending approximately $6.5 million dollars to date on EE Projects,
that we are achieving a close to 20% ROI. These numbers would be approximately updated to $8 million
dollars in projects to date with about $2 million dollars in savings.
The projects have been slightly altered during the delivery of the recent injection of Infrastructure
Capital, which resulted in the delivery of Canada Games Centre, Prospect Community Centre, a couple
fire stations, a 4 pad arena and Recapitalization for Canada Games. As a result of the recent injection of
'big" projects - Facility Development staff have focused on the energy efficiency opportunities in those
projects while continuing to complete the EcoTrust projects. By mid-2011, the big money projects will
be complete and staff will revert to the smaller recapitalization opportunities. Quite simply, staff
capacity has been maximized on these big projects.
Fortunately, in addition to the large projects executed in the past couple years, EUGS and staff set up an
Energy Efficiency Reserve (piggybank) where much of the operating savings has been put to a reserve
which will enable funding of continual energy efficiency projects to the tune of approximately $1 million
per year. This piggybank enables staff to seize recapitalization opportunities and leverage other funding
to deliver energy efficiency or renewable projects that maximize the dollar savings for the taxpayer.
Question - 4. A list of HRM-owned facilities be provided to Council including how many facilities have
had replacement costs determined - Phil Townsend
A list of HRM owned facilities is attached below. In 2007, Risk and Insurance Services began a program
of completing formal building appraisals on municipally owned property in order to establish
replacement costs for insurance purposes.
Detailed building appraisals have been completed on the following 20 buildings. They include the
Dartmouth Sportsplex, Cole Harbour Place, Lake Echo Lion’s Club, Halifax Regional Police Services
Headquarters, Old City Hall (both replacement cost and reproduction cost was established for this
particular building), Mill Cove Sewage Treatment Plant, Turner Drive Depot, Fire Station #8, Spring
Garden Road Public Library, Metro Transit Facility, Captain William Spry Centre, St. Margaret’s Bay
Arena, Lake Major Water Treatment Plant, Eric Spicer Building, Former City of Dartmouth City Hall,
Acadia School, Fire Station #13, Lake Echo Fire Volunteer Fire Department, Khyber Building (both

replacement cost and reproduction cost was established for this particular building) plus the Cowie Hill,
Parks and Ground Depot.
Building / Facility Address (Building
Classification)
Bedford Teachery Heritage #596 9 SPRING ST Arts Culture And
Heritage
Evergreen House Park - Alexander James 26 NEWCASTLE ST Arts Culture And
Heritage
Khyber Building 1588 BARRINGTON ST Arts Culture And
Heritage
McPhee House Building 1 22404 HIGHWAY 7 Arts Culture And
Heritage
McPhee House Building 2 22404 HIGHWAY 7 Arts Culture And
Heritage
Musquodoboit Valley Bicentennial Theatre & Cultural
Centre
12390 HIGHWAY 224 Arts Culture And
Heritage
Quaker House Museum 57 OCHTERLONEY ST Arts Culture And
Heritage
Scott Manor -Fort Sackville Manor House Heritage
#595
15 FORT SACKVILLE RD Arts Culture And
Heritage
Shubie Canal Visitors Centre 140 ALDERNEY DR Arts Culture And
Heritage
Camp hill Cemetery 1546 CARLTON ST Cemetery
Fairview Cemetery 3720 WINDSOR ST Cemetery
Fairview Cemetery 3720 WINDSOR ST Cemetery
Mount Herman Cemetery 139 VICTORIA RD Cemetery
4 Pad Arena 61 GARY MARTIN DR Community And
Recreation
Abenaki Aquatic Canoe Club 22A SWANTON DR Community And
Recreation
Adventure Earth Centre 68 PARKHILL RD Community And
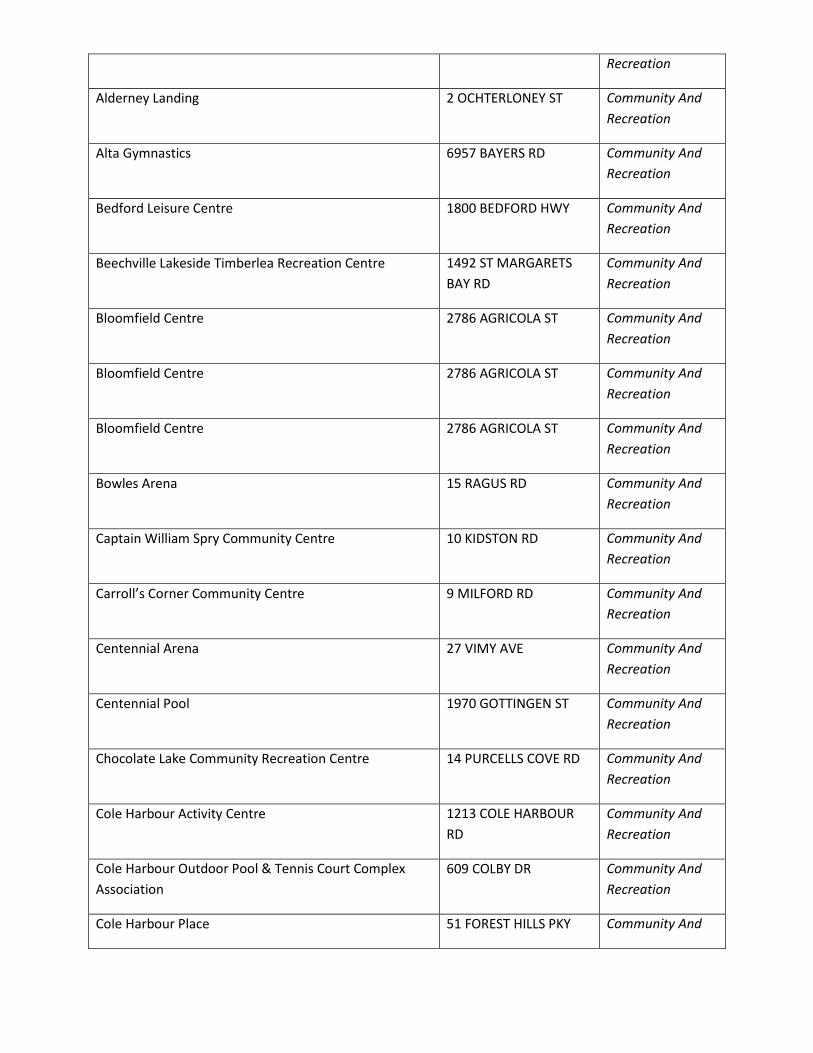
Recreation
Alderney Landing 2 OCHTERLONEY ST Community And
Recreation
Alta Gymnastics 6957 BAYERS RD Community And
Recreation
Bedford Leisure Centre 1800 BEDFORD HWY Community And
Recreation
Beechville Lakeside Timberlea Recreation Centre 1492 ST MARGARETS
BAY RD
Community And
Recreation
Bloomfield Centre 2786 AGRICOLA ST Community And
Recreation
Bloomfield Centre 2786 AGRICOLA ST Community And
Recreation
Bloomfield Centre 2786 AGRICOLA ST Community And
Recreation
Bowles Arena 15 RAGUS RD Community And
Recreation
Captain William Spry Community Centre 10 KIDSTON RD Community And
Recreation
Carroll’s Corner Community Centre 9 MILFORD RD Community And
Recreation
Centennial Arena 27 VIMY AVE Community And
Recreation
Centennial Pool 1970 GOTTINGEN ST Community And
Recreation
Chocolate Lake Community Recreation Centre 14 PURCELLS COVE RD Community And
Recreation
Cole Harbour Activity Centre 1213 COLE HARBOUR
RD
Community And
Recreation
Cole Harbour Outdoor Pool & Tennis Court Complex
Association
609 COLBY DR Community And
Recreation
Cole Harbour Place 51 FOREST HILLS PKY Community And

Recreation
Dartmouth North Community Centre 134 PINECREST DR Community And
Recreation
Dartmouth Sportsplex 110 WYSE RD Community And
Recreation
Devonshire Arena 3395 DEVONSHIRE AVE Community And
Recreation
Dr. Gerald J. Lebrun Memorial Centre 36 HOLLAND AVE Community And
Recreation
East Dartmouth Community Centre 50 CALEDONIA RD Community And
Recreation
East Preston Recreation Centre 24 BROOKS DR Community And
Recreation
Eastern Shore Community Centre 67 PARK RD Community And
Recreation
Findlay Community Centre 26 ELLIOT ST Community And
Recreation
Forum Bingo 6205 ALMON ST Community And
Recreation
Forum Multi-Purpose Centre 6210 YOUNG ST Community And
Recreation
George Dixon Community Recreation Centre 2502 BRUNSWICK ST Community And
Recreation
Gerald B. Gray Arena 10 MONIQUE AVE Community And
Recreation
Halifax Civic Centre 2953 WINDSOR ST Community And
Recreation
Halifax Forum 2901 WINDSOR ST Community And
Recreation
Halifax Metro Centre 5284 DUKE ST Community And
Recreation
Harrietsfield/Williamswood Community Centre 1138 OLD SAMBRO RD Community And

Recreation
Hubbards Recreation Centre 9856 ST MARGARETS
BAY RD
Community And
Recreation
Isleville Community Centre 3460 ISLEVILLE ST Community And
Recreation
Kinap Canoe Club 181 GREENOUGH DR Community And
Recreation
Lake Echo Community Centre 3168 HIGHWAY 7 Community And
Recreation
Larry O’Connell Centre 6691 FOURTH ST Community And
Recreation
Lawrencetown Community Centre 3657 LAWRENCETOWN
RD
Community And
Recreation
Moser River Community Hall 28975 HIGHWAY 7 Community And
Recreation
Needham Community Recreation Centre 3372 DEVONSHIRE AVE Community And
Recreation
North Preston Community Centre 44 SIMMONDS RD Community And
Recreation
North Star Rowing Club 24 BOATHOUSE LANE Community And
Recreation
North Woodside Community Centre 230 PLEASANT ST Community And
Recreation
Northcliffe Recreation Centre 111 CLAYTON PARK DR Community And
Recreation
Oakwood House 20 BOATHOUSE LANE Community And
Recreation
Porters Lake Community Centre 4693 HIGHWAY 7 Community And
Recreation
Prospect Road Community Centre 2141 PROSPECT RD Community And
Recreation
Riverline Community Centre 80 GRONO RD Community And

Recreation
Rockingham Community Centre 199 BEDFORD HWY Community And
Recreation
Sackville Heights Community Centre 45 CONNOLLY RD Community And
Recreation
Sackville Sports Stadium 409 GLENDALE DR Community And
Recreation
Samuel R Balcom Community Centre 25718 HIGHWAY 7 Community And
Recreation
Scots Pond Rehab Camp 82 COBBLESTONE LANE Community And
Recreation
Sheet Harbour Lions Community Centre 183 POOL RD Community And
Recreation
South Woodside Community Centre And School 5 EVERETTE ST Community And
Recreation
Spencer House 5594 MORRIS ST Community And
Recreation
Springfield Lake Recreation Centre 266 LAKEVIEW AVE Community And
Recreation
Spryfield Lions Arena 111 DRYSDALE RD Community And
Recreation
St Andrews Community Recreation Centre 6955 BAYERS RD Community And
Recreation
St Margaret’s Centre 12 WESTWOOD BLVD Community And
Recreation
St Mary's Boat Club 1641 FAIRFIELD RD Community And
Recreation
St. Therese Community Centre 17 CONROD RD Community And
Recreation
The Commons Pavilion 5816 COGSWELL ST Community And
Recreation
Upper Hammonds Plains Community Centre 711 POCKWOCK RD Community And

Recreation
Upper Sackville Recreation Facility 2476 SACKVILLE DR Community And
Recreation
Wallace Lucas Community Centre 596 LUCASVILLE RD Community And
Recreation
Wanderers Grounds - Bengal Lancers 1690 BELL RD Community And
Recreation
Wanderers Grounds - Bengal Lancers Arena 1690 BELL RD Community And
Recreation
Wanderers Grounds Lawn Bowling Club House 5759 SACKVILLE ST Community And
Recreation
Acadia School/Sackville Public Library 636 SACKVILLE DR Corporate
Administration
Alderney Gate 40 ALDERNEY DR Corporate
Administration
Halifax City Hall 1841 ARGYLE ST Corporate
Administration
Halifax Regional School Board Offices 90 ALDERNEY DR Corporate
Administration
Oakmount Drive Administrative Building 171 OAKMOUNT DR Corporate
Administration
Otter Lake Scale House Administration Building 600 OTTER LAKE DR Corporate
Administration
Power House 1606 BELL RD Corporate
Administration
Richmond Family Court (Lease To Province) 3380 DEVONSHIRE AVE Corporate
Administration
Wanderers Grounds Parks Depot 1680 BELL RD Corporate
Administration
Gordon R Snow Community Centre And Fire Station #45 1359 FALL RIVER RD Fire Services
Station #10 Sackville Fire Department 1156 SACKVILLE DR Fire Services

Station #11 Sackville Fire Department 479 PATTON RD Fire Services
Station #12 Highfield Park Fire Department 45 HIGHFIELD PARK DR Fire Services
Station #13 Dartmouth King Street Fire Department 86 KING ST Fire Services
Station #14 Dartmouth Fire Department 1 SECOND ST Fire Services
Station #15 Dartmouth Fire Department 331 PLEASANT ST Fire Services
Station #16 Eastern Passage/Cow Bay Volunteer Fire
Department
1807 CALDWELL RD Fire Services
Station #17 Cole Harbour Fire Department 1150 COLE HARBOUR
RD
Fire Services
Station #18 Westphal/Cole Harbour Fire Department 690 HIGHWAY 7 Fire Services
Station #19 East Lawrencetown Volunteer Fire
Department
2385 CROWELL RD Fire Services
Station #2 Halifax South End Fire Department 5988 UNIVERSITY AVE Fire Services
Station #20 Lawrencetown Volunteer Fire Department 2931 LAWRENCETOWN
RD
Fire Services
Station #21 Lake Echo Volunteer Fire Department 3035 HIGHWAY 7 Fire Services
Station #22 North Preston Fire Station 8 CAIN ST Fire Services
Station #23 Chezzetcook Fire Department 5543 HIGHWAY 7 Fire Services
Station #24 Musquodoboit Harbour Volunteer Fire
Department
32 RIVERSIDE AVE Fire Services
Station #25 Ostrea Lake - Pleasant Point Fire
Department
1765 OSTREA LAKE DR Fire Services
Station #26 Oyster Pond And Area Volunteer Fire
Department
51 OLD TRUNK RD Fire Services
Station #28 Sheet Harbour Volunteer Fire Department 22835 HIGHWAY 7 Fire Services
Station #29 Moser River And District Fire Department 28971 HIGHWAY 7 Fire Services
Station #3 Central Fire Department 5663 WEST ST Fire Services
Station #30 Tangier Fire Department 17559 HIGHWAY 7 Fire Services
Station #31 Tangier East Ship Harbour Fire Department 15750 HIGHWAY 7 Fire Services

Station #32 Mooseland Volunteer Fire Department 4032 MOOSELAND RD Fire Services
Station #33 Three Harbours Volunteer Fire Department 26291 HIGHWAY 7 Fire Services
Station #34 Mushaboom Volunteer Fire Department 22 POWERS RD Fire Services
Station #35 Cooks Brook And District Fire Department 39 CORBETT RD Fire Services
Station #36 Meaghers Grant Fire Hall 4413 HIGHWAY 357 Fire Services
Station #37 Meaghers Grant Fire Department 5802 HIGHWAY 357 Fire Services
Station #38 Middle Musquodoboit Volunteer Fire
Station
36 GLENMORE RD Fire Services
Station #39 Upper Musquodoboit Volunteer Fire
Department
14 HIGHWAY 336 Fire Services
Station #4 North End Fire Station 5830 DUFFUS ST Fire Services
Station #40 Dutch Settlement And Area Fire Department 808 HIGHWAY 227 Fire Services
Station #41 Waverley Fire Department 2433 HIGHWAY 2 Fire Services
Station #45 Lakeview Waverley Fall River Volunteer Fire
Station
3214 HIGHWAY 2 Fire Services
Station #47 Goff's Volunteer Fire Station 2040 OLD
GUYSBOROUGH RD
Fire Services
Station #48 Beaver Bank-Kinsac Fire Department 1583 BEAVER BANK RD Fire Services
Station #5 Bayers Road Fire Station / Ashburn Park 7090 BAYERS RD Fire Services
Station #50 Hammonds Plains Fire Department 2050 HAMMONDS
PLAINS RD
Fire Services
Station #51 Upper Hammonds Plains Volunteer Fire
Station
948 POCKWOCK RD Fire Services
Station #52 Prospect Road - Hatchet Lake 2101 PROSPECT RD Fire Services
Station #53 Prospect Road - Terence Bay Volunteer Fire
Station
80 SANDY COVE RD Fire Services
Station #54 Prospect Road - Shad Bay 3610 PROSPECT RD Fire Services
Station #55 Seabright and and District Volunteer Fire
Department
11229 PEGGYS COVE RD Fire Services
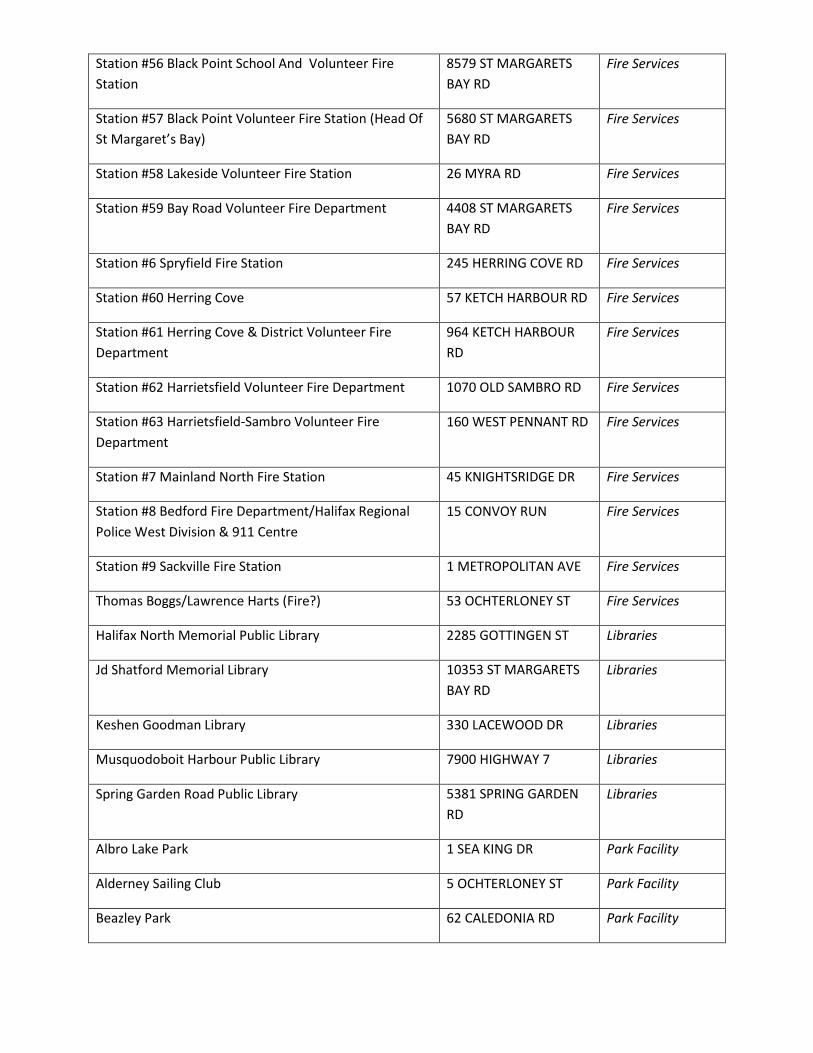
Station #56 Black Point School And Volunteer Fire
Station
8579 ST MARGARETS
BAY RD
Fire Services
Station #57 Black Point Volunteer Fire Station (Head Of
St Margaret’s Bay)
5680 ST MARGARETS
BAY RD
Fire Services
Station #58 Lakeside Volunteer Fire Station 26 MYRA RD Fire Services
Station #59 Bay Road Volunteer Fire Department 4408 ST MARGARETS
BAY RD
Fire Services
Station #6 Spryfield Fire Station 245 HERRING COVE RD Fire Services
Station #60 Herring Cove 57 KETCH HARBOUR RD Fire Services
Station #61 Herring Cove & District Volunteer Fire
Department
964 KETCH HARBOUR
RD
Fire Services
Station #62 Harrietsfield Volunteer Fire Department 1070 OLD SAMBRO RD Fire Services
Station #63 Harrietsfield-Sambro Volunteer Fire
Department
160 WEST PENNANT RD Fire Services
Station #7 Mainland North Fire Station 45 KNIGHTSRIDGE DR Fire Services
Station #8 Bedford Fire Department/Halifax Regional
Police West Division & 911 Centre
15 CONVOY RUN Fire Services
Station #9 Sackville Fire Station 1 METROPOLITAN AVE Fire Services
Thomas Boggs/Lawrence Harts (Fire?) 53 OCHTERLONEY ST Fire Services
Halifax North Memorial Public Library 2285 GOTTINGEN ST Libraries
Jd Shatford Memorial Library 10353 ST MARGARETS
BAY RD
Libraries
Keshen Goodman Library 330 LACEWOOD DR Libraries
Musquodoboit Harbour Public Library 7900 HIGHWAY 7 Libraries
Spring Garden Road Public Library 5381 SPRING GARDEN
RD
Libraries
Albro Lake Park 1 SEA KING DR Park Facility
Alderney Sailing Club 5 OCHTERLONEY ST Park Facility
Beazley Park 62 CALEDONIA RD Park Facility
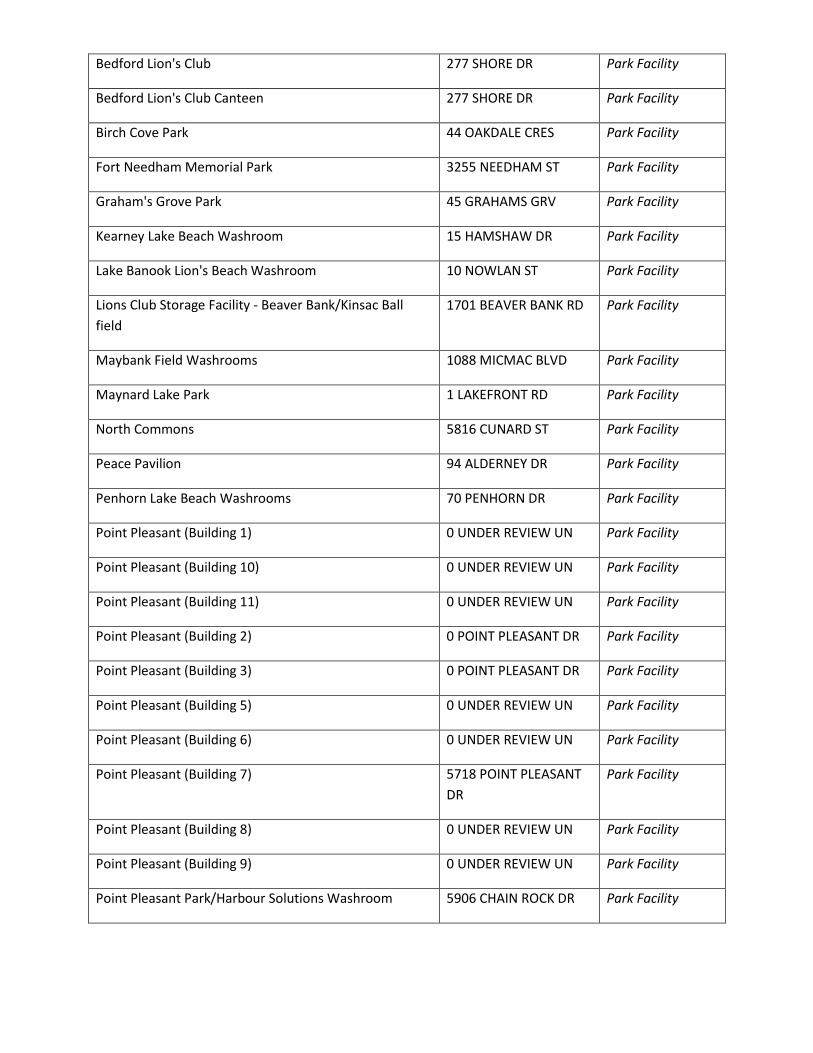
Bedford Lion's Club 277 SHORE DR Park Facility
Bedford Lion's Club Canteen 277 SHORE DR Park Facility
Birch Cove Park 44 OAKDALE CRES Park Facility
Fort Needham Memorial Park 3255 NEEDHAM ST Park Facility
Graham's Grove Park 45 GRAHAMS GRV Park Facility
Kearney Lake Beach Washroom 15 HAMSHAW DR Park Facility
Lake Banook Lion's Beach Washroom 10 NOWLAN ST Park Facility
Lions Club Storage Facility - Beaver Bank/Kinsac Ball
field
1701 BEAVER BANK RD Park Facility
Maybank Field Washrooms 1088 MICMAC BLVD Park Facility
Maynard Lake Park 1 LAKEFRONT RD Park Facility
North Commons 5816 CUNARD ST Park Facility
Peace Pavilion 94 ALDERNEY DR Park Facility
Penhorn Lake Beach Washrooms 70 PENHORN DR Park Facility
Point Pleasant (Building 1) 0 UNDER REVIEW UN Park Facility
Point Pleasant (Building 10) 0 UNDER REVIEW UN Park Facility
Point Pleasant (Building 11) 0 UNDER REVIEW UN Park Facility
Point Pleasant (Building 2) 0 POINT PLEASANT DR Park Facility
Point Pleasant (Building 3) 0 POINT PLEASANT DR Park Facility
Point Pleasant (Building 5) 0 UNDER REVIEW UN Park Facility
Point Pleasant (Building 6) 0 UNDER REVIEW UN Park Facility
Point Pleasant (Building 7) 5718 POINT PLEASANT
DR
Park Facility
Point Pleasant (Building 8) 0 UNDER REVIEW UN Park Facility
Point Pleasant (Building 9) 0 UNDER REVIEW UN Park Facility
Point Pleasant Park/Harbour Solutions Washroom 5906 CHAIN ROCK DR Park Facility

Point Pleasant canteen (Building 4) 0 POINT PLEASANT DR Park Facility
Public Gardens Heritage Building 5771 SPRING GARDEN
RD
Park Facility
Public Gardens Greenhouse - Polyhouse 5753 SACKVILLE ST Park Facility
Public Gardens Greenhouse #1 1606 BELL RD Park Facility
Public Gardens Greenhouse #2 5711 SACKVILLE ST Park Facility
Public Gardens Greenhouse #3 5711 SACKVILLE ST Park Facility
Public Gardens Greenhouse #5 5753 SACKVILLE ST Park Facility
Public Gardens Men's Washroom 5771 SPRING GARDEN
RD
Park Facility
Public Gardens Pond Treatment Plant 5755 SACKVILLE ST Park Facility
Public Gardens Women's Washroom 5771 SPRING GARDEN
RD
Park Facility
R.S. Allen Memorial (Canteen) 5688 ST MARGARETS
BAY RD
Park Facility
Sackville Lions Club 101 OLD BEAVER BANK
RD
Park Facility
Sackville Parks And Recreation 94 METROPOLITAN AVE Park Facility
Shubie Park Canteen Building 30 JOHN BRENTON DR Park Facility
Shubie Park Facility 8 GARSHAN RD Park Facility
Shubie Park Washroom 54 LOCKS RD Park Facility
Silver Hill Park 195 PRINCE ALBERT RD Park Facility
Wanderers Grounds - Header House 5711 SACKVILLE ST Park Facility
Wanderers Grounds Bubble 5711 SACKVILLE ST Park Facility
Wanderers Grounds Furnace Room Building 5711 SACKVILLE ST Park Facility
Wanderers Grounds Potting Shed 5711 SACKVILLE ST Park Facility
Wanderers Grounds Press Box 0 UNDER REVIEW UN Park Facility

Eric Spicer Municipal Building 21 MOUNT HOPE AVE Police
Halifax Regional Police 11 WINDMILL RD Police
Halifax Regional Police Headquarters 1975 GOTTINGEN ST Police
Northbrook Police Training Centre 2 CHAPMAN ST Police
Bayers Lake Business Park Salt Dome 230 HORSESHOE LAKE
DR
Public Works
Bayers Lake Recovery Facility 20 HORSESHOE LAKE DR Public Works
Cobequid Road Municipal Operations Facility 429 COBEQUID RD Public Works
HRM Parks And Grounds Depot 375 COWIE HILL RD Public Works
Jackson Rd Dartmouth 26 26 JACKSON RD Public Works
Lakecrest Carpentry Shop 46 LAKECREST DR Public Works
Macintosh Street Maintenance Services 3790 MACKINTOSH ST Public Works
Macintosh Street Public Works (Building 1) 3825 MACKINTOSH ST Public Works
Macintosh Street Public Works (Building 2) 6331 BAYNE ST Public Works
Macintosh Street Public Works (Building 3) 6350 AFRICVILLE RD Public Works
Macintosh Street Public Works (Building 4) 3801 MACKINTOSH ST Public Works
Macintosh Street Public Works (Building 5) 6331 BAYNE ST Public Works
Oakmount Drive HRM Garage Depot 171 OAKMOUNT DR Public Works
Oakmount Drive Salt Dome 160 OAKMOUNT DR Public Works
Otter Lake Maintenance Garage 600 OTTER LAKE DR Public Works
Turner Drive Depot 11 TURNER DR Public Works
Turner Drive Depot (Storage?) 15 TURNER DR Public Works
Bridge Terminal 112 WYSE RD Transit Facility
Dartmouth Ferry Terminal 88 ALDERNEY DR Transit Facility
Halifax Ferry Terminal 5077 GEORGE ST Transit Facility
Ilsley Transit Facility 200 ILSLEY AVE Transit Facility

Maitland Street Metro Parkade 2143 MAITLAND ST Transit Facility
Metro Park Parkade 1554 HOLLIS ST Transit Facility
Mumford Road Bus Terminal 7000 MUMFORD RD Transit Facility
Musquodoboit Valley School Bus Garage 11974 HIGHWAY 224 Transit Facility
Portland Hills Transit Facility 866 PORTLAND ST Transit Facility
Ragged Lake Transit Centre 110 GRASSY LAKE DR Transit Facility
Ragged Lake Transit Service Centre 80 GRASSY LAKE DR Transit Facility
Sackville Metro Link 7 WALKER AVE Transit Facility
Thornhill Transit Facility 150 THORNHILL DR Transit Facility
Waverley Road Fire Garage 196 WAVERLEY RD Transit Facility
Woodside Ferry Terminal 9 ATLANTIC ST Transit Facility
Barrington St Halifax 2444 2444 BARRINGTON ST Transition
Bayers Road 6838 6838 BAYERS RD Transition
Bayers Road 6850 6850 BAYERS RD Transition
Black Point School And Fire Station (Transition) 37 GILBERT LANE Transition
Boy Scouts Of Canada 2041 HAMMONDS
PLAINS RD
Transition
Cherry Brook Community Centre 220 LAKE LOON RD Transition
Cunard Street Children's Centre 5557 CUNARD ST Transition
Dingle Residential 30 DINGLE RD Transition
Dry Canteen 5753 SACKVILLE ST Transition
Enviro-Care 1300 ST MARGARETS
BAY RD
Transition
Fall River Recreation Centre 3182 HIGHWAY 2 Transition
Fall River West School 1018 FALL RIVER RD Transition
Fire House Youth Centre 1247 BEDFORD HWY Transition
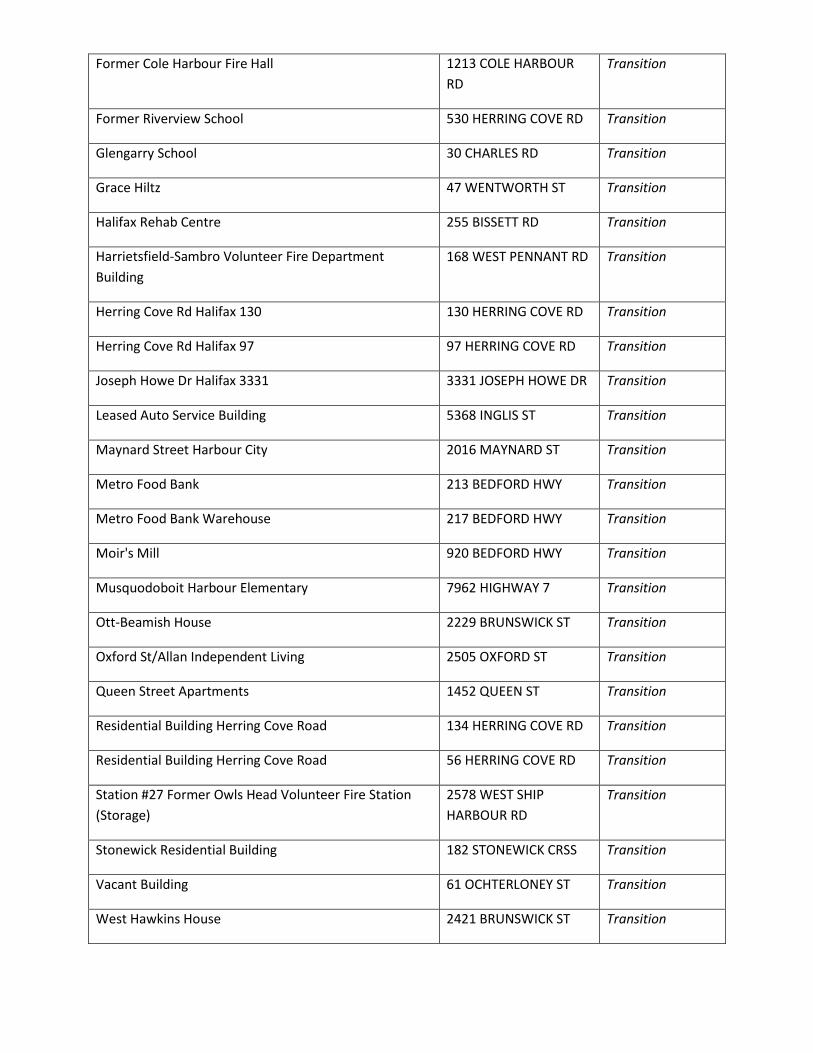
Former Cole Harbour Fire Hall 1213 COLE HARBOUR
RD
Transition
Former Riverview School 530 HERRING COVE RD Transition
Glengarry School 30 CHARLES RD Transition
Grace Hiltz 47 WENTWORTH ST Transition
Halifax Rehab Centre 255 BISSETT RD Transition
Harrietsfield-Sambro Volunteer Fire Department
Building
168 WEST PENNANT RD Transition
Herring Cove Rd Halifax 130 130 HERRING COVE RD Transition
Herring Cove Rd Halifax 97 97 HERRING COVE RD Transition
Joseph Howe Dr Halifax 3331 3331 JOSEPH HOWE DR Transition
Leased Auto Service Building 5368 INGLIS ST Transition
Maynard Street Harbour City 2016 MAYNARD ST Transition
Metro Food Bank 213 BEDFORD HWY Transition
Metro Food Bank Warehouse 217 BEDFORD HWY Transition
Moir's Mill 920 BEDFORD HWY Transition
Musquodoboit Harbour Elementary 7962 HIGHWAY 7 Transition
Ott-Beamish House 2229 BRUNSWICK ST Transition
Oxford St/Allan Independent Living 2505 OXFORD ST Transition
Queen Street Apartments 1452 QUEEN ST Transition
Residential Building Herring Cove Road 134 HERRING COVE RD Transition
Residential Building Herring Cove Road 56 HERRING COVE RD Transition
Station #27 Former Owls Head Volunteer Fire Station
(Storage)
2578 WEST SHIP
HARBOUR RD
Transition
Stonewick Residential Building 182 STONEWICK CRSS Transition
Vacant Building 61 OCHTERLONEY ST Transition
West Hawkins House 2421 BRUNSWICK ST Transition

Edgewood Workshop 6699 BAYERS RD
Garbage Collection Depot 6250 BAYNE ST Waste Facility
Otter Lake Waste Processing & Disposal Facility 600 OTTER LAKE DR Waste Facility
Pinehaven Lift Station 4 PINEHAVEN DR Waste Facility
Sackville Dr Sackville Landfill Site 50 LEACHATE PLANT RD Waste Facility
Sheet Harbour Transfer Station 21611 HIGHWAY 7 Waste Facility
Question 6. Land Holdings- detailed list please - 259.7 million- why only 3 transactions in last quarter?
The reference to the number of transactions is with respect to a recent report that is produced
quarterly, dealing with the status of "in camera" motions only and is not indicative of the value or
number of transactions to date.
There are a significant volume of general transactions managed through the delegated authority of the
CAO, provided they meet specific criteria. The CAO approval thresholds, approved by Council, are
disposals up to $150K and acquisitions up to $200K.
Business Park lots are sold at per square foot unit prices pre-approved by Council each time a capital
build or construction phase is approved by Council.
To date surplus property revenues are projected at $2M for 2010/11 and $3M for 2011/12. The latter
does not include the timing of opportunities such as Bloomfield, Northcliffe, Spring Garden area lands
etc.
Business Parks sales for projected 2010/11 are $5-6M which is up over last year. An information
summary of all closed transactions is reported to Council annually.
HRM’s detailed land holdings list contains over 9000 separate listings. The list can be significantly
shortened by eliminating all land used for road and pedestrian rights of way but the resultant shorter list
still contains over 2750 separate listings. The following table breaks down that shorter list by land asset
type and indicates the number of parcels in each category. Should more detail be required, the more
extensive listings are available through Infrastructure and Asset Management.
BUSINESS PARK 81
CEMETERY 6
DRAINAGE 171
IN TRANSITION 52
LAND ASSOCIATED WITH A BUILDING 140
LAND ASSOCIATED WITH UTILITIES 114
PARKS / OPEN SPACE 1672

SOLID WASTE 4
VACANT / MISC 487
WATER LOT 27