bses rajdhani power ltd....bses rajdhani power ltd. brpl profile. bypl bses caters to 2/3rd of delhi...
TRANSCRIPT
BSES Rajdhani Power Ltd.
BSES Rajdhani Power Ltd.
BSES is a JV of Reliance Infrastructure (51%) and Govt. of Delhi (49%)
BSES Rajdhani Power Ltd.
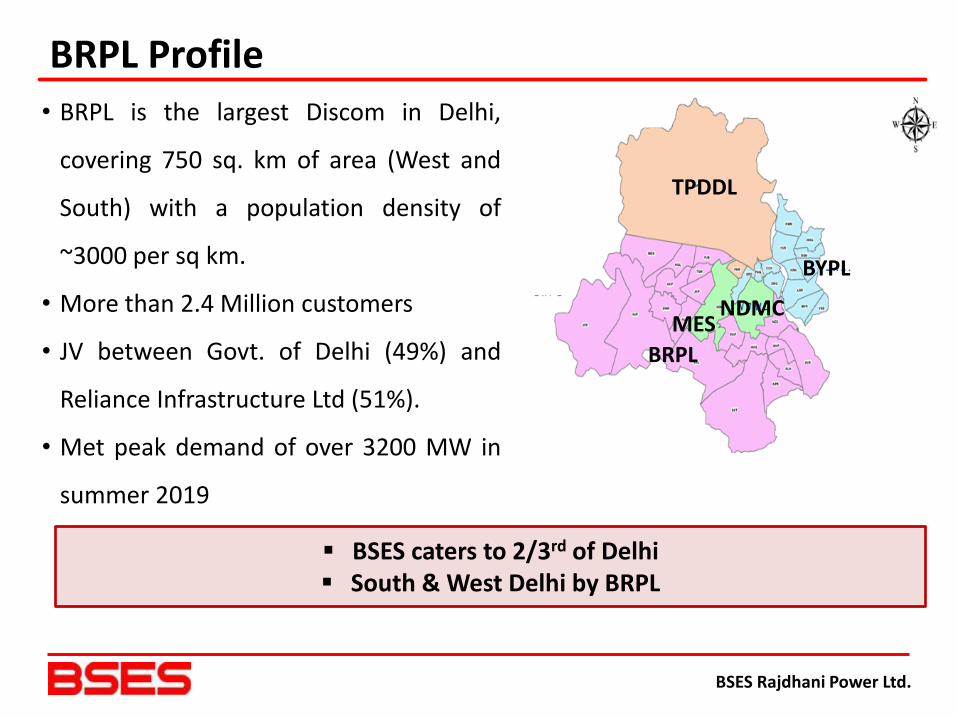
BRPL Profile
BSES caters to 2/3rd of Delhi South & West Delhi by BRPL
• BRPL is the largest Discom in Delhi,
covering 750 sq. km of area (West and
South) with a population density of
~3000 per sq km.
• More than 2.4 Million customers
• JV between Govt. of Delhi (49%) and
Reliance Infrastructure Ltd (51%).
• Met peak demand of over 3200 MW in
summer 2019
TPDDL
BRPL
BYPL
NDMC MES
BSES Rajdhani Power Ltd.
BSES Rajdhani Power Ltd.
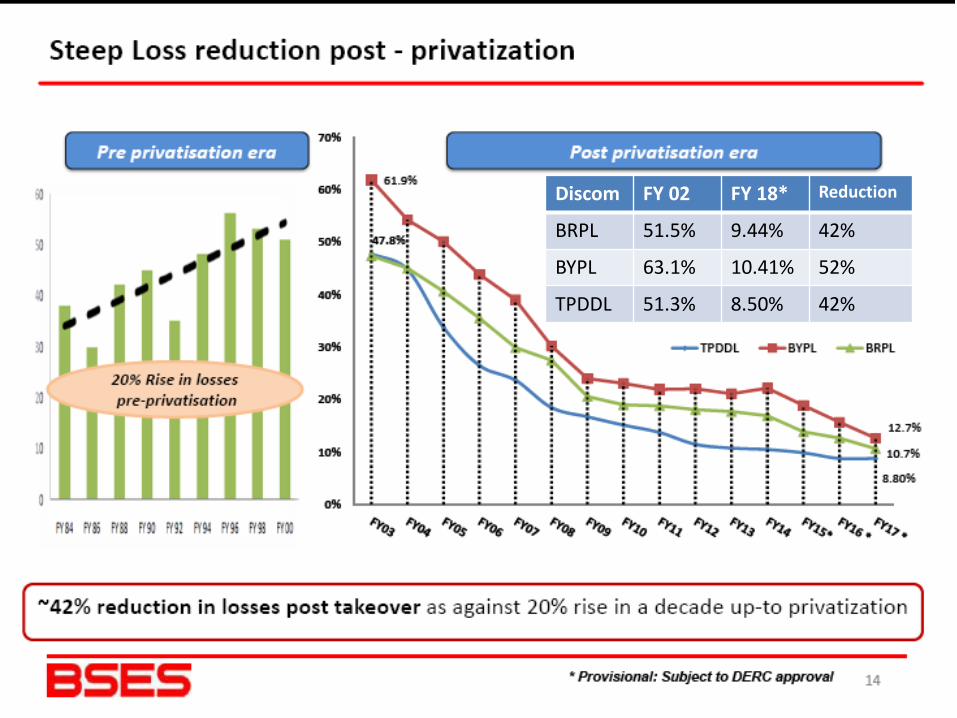
BSES Rajdhani Power Ltd.
Discom FY 02 FY 18* Reduction
BRPL 51.5% 9.44% 42%
BYPL 63.1% 10.41% 52%
TPDDL 51.3% 8.50% 42%
BSES Rajdhani Power Ltd.
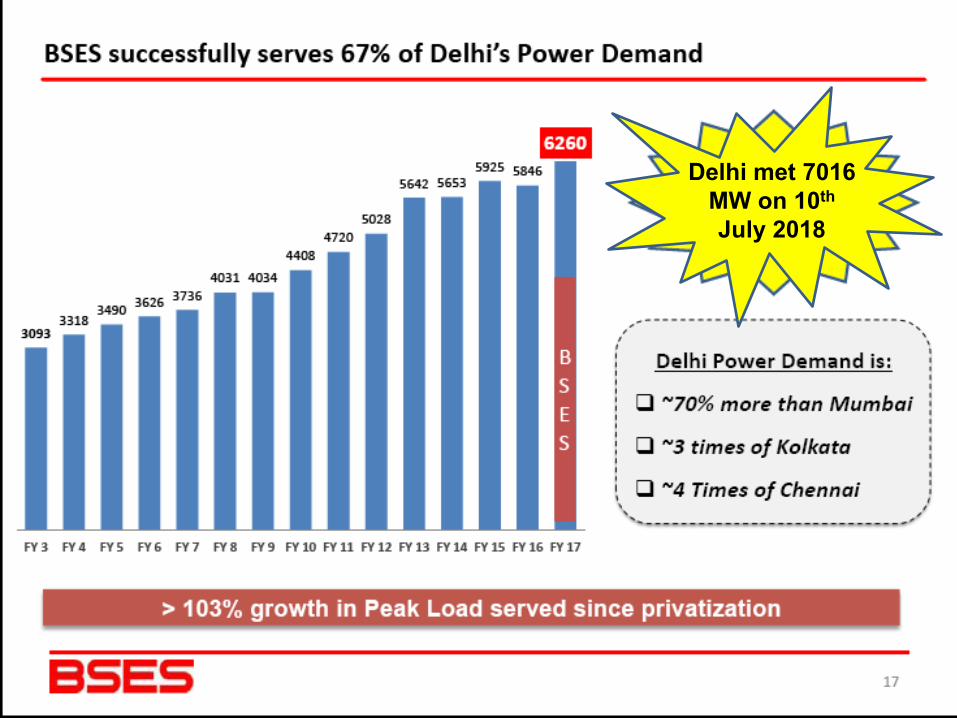
BSES Rajdhani Power Ltd.
Delhi met 7016
MW on 10th July 2018
BSES Rajdhani Power Ltd.
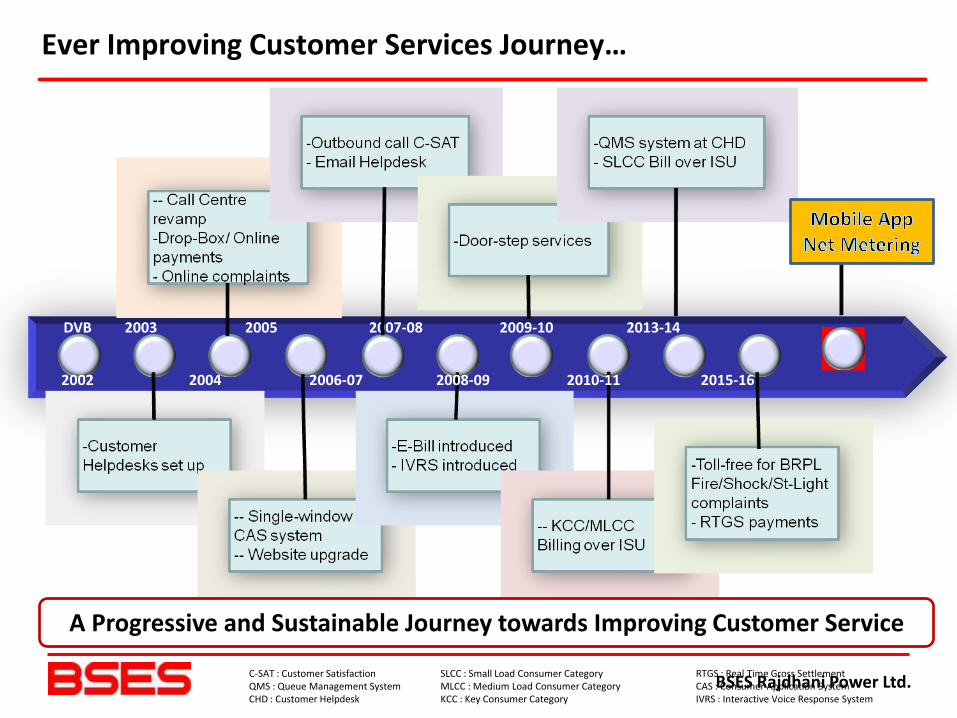
Ever Improving Customer Services Journey…
2002 2004 2006-07 2008-09 2010-11 2015-16
DVB 2003 2005 2007-08 2009-10 2013-14
A Progressive and Sustainable Journey towards Improving Customer Service
C-SAT : Customer Satisfaction QMS : Queue Management System CHD : Customer Helpdesk
SLCC : Small Load Consumer Category MLCC : Medium Load Consumer Category KCC : Key Consumer Category
RTGS : Real Time Gross Settlement CAS : Consumer Application System IVRS : Interactive Voice Response System
BSES Rajdhani Power Ltd.
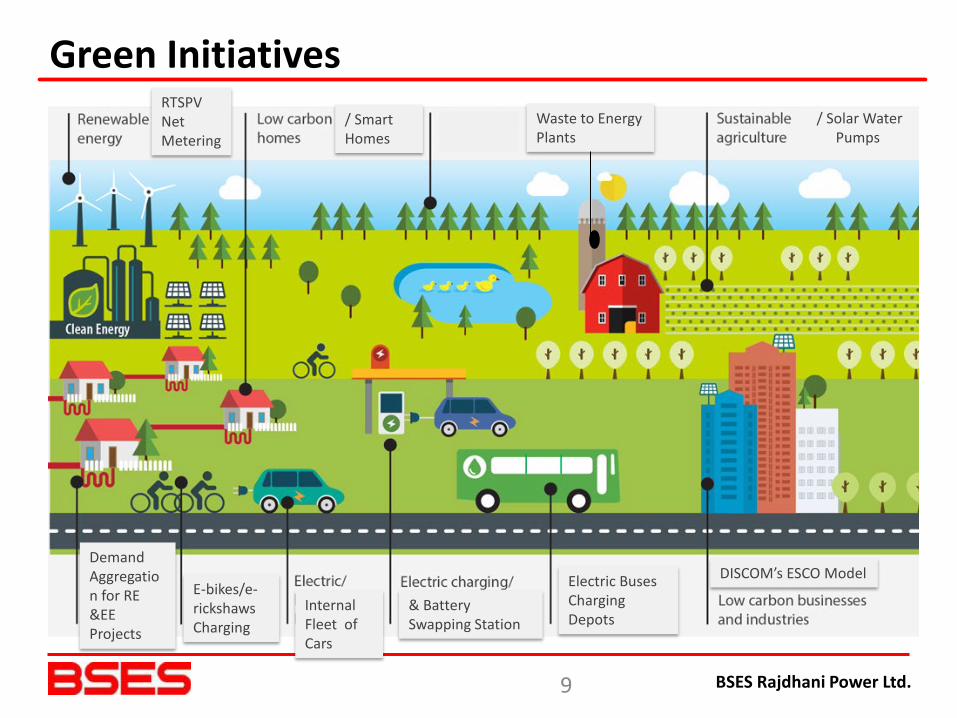
/ Solar Water Pumps
Internal Fleet of Cars
E-bikes/e-rickshaws Charging
Electric Buses Charging Depots
DISCOM’s ESCO Model
/ Smart Homes
Demand Aggregation for RE &EE Projects
RTSPV Net Metering
& Battery Swapping Station
Waste to Energy Plants
Green Initiatives
9
BSES Rajdhani Power Ltd.
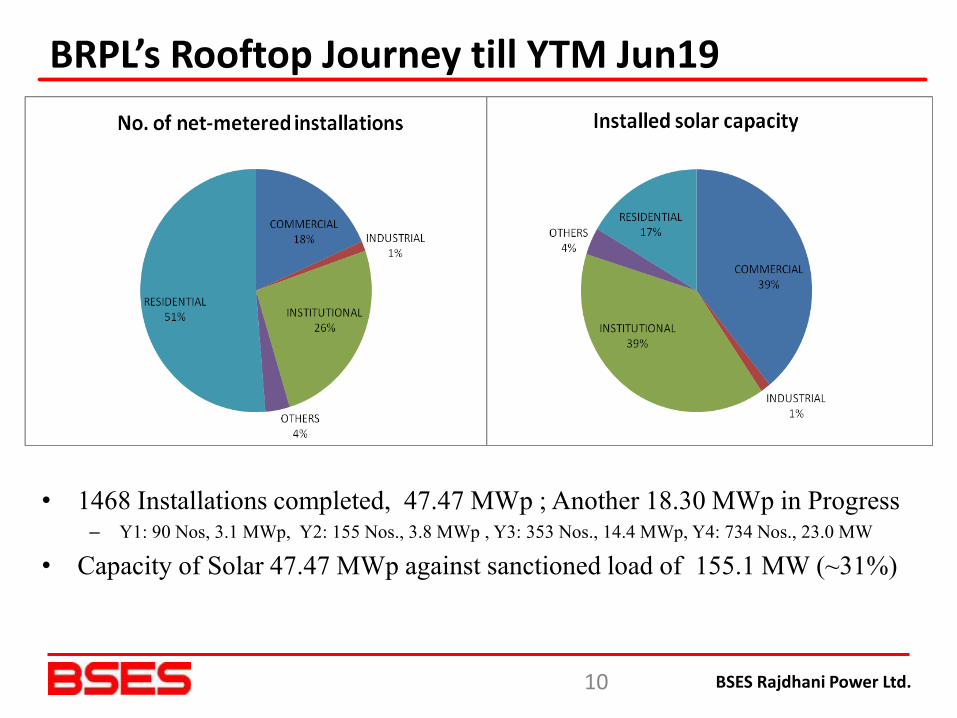
BRPL’s Rooftop Journey till YTM Jun19
• 1468 Installations completed, 47.47 MWp ; Another 18.30 MWp in Progress – Y1: 90 Nos, 3.1 MWp, Y2: 155 Nos., 3.8 MWp , Y3: 353 Nos., 14.4 MWp, Y4: 734 Nos., 23.0 MW
• Capacity of Solar 47.47 MWp against sanctioned load of 155.1 MW (~31%)
10
BSES Rajdhani Power Ltd.
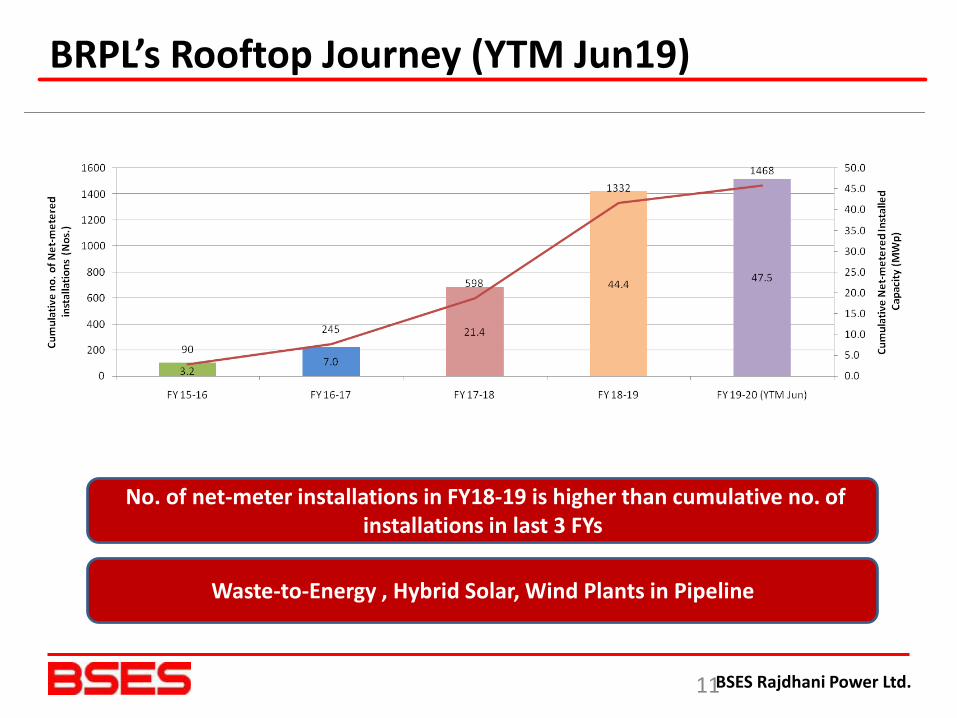
BRPL’s Rooftop Journey (YTM Jun19)
11
No. of net-meter installations in FY18-19 is higher than cumulative no. of installations in last 3 FYs
Waste-to-Energy , Hybrid Solar, Wind Plants in Pipeline
BSES Rajdhani Power Ltd.
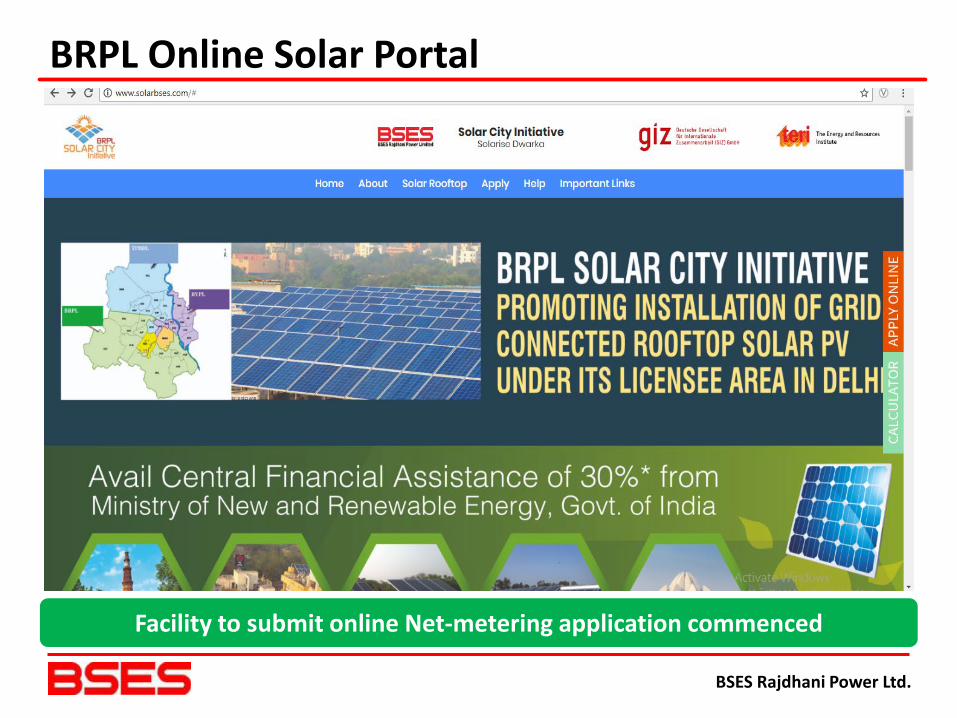
BRPL Online Solar Portal
Facility to submit online Net-metering application commenced
BSES Rajdhani Power Ltd.
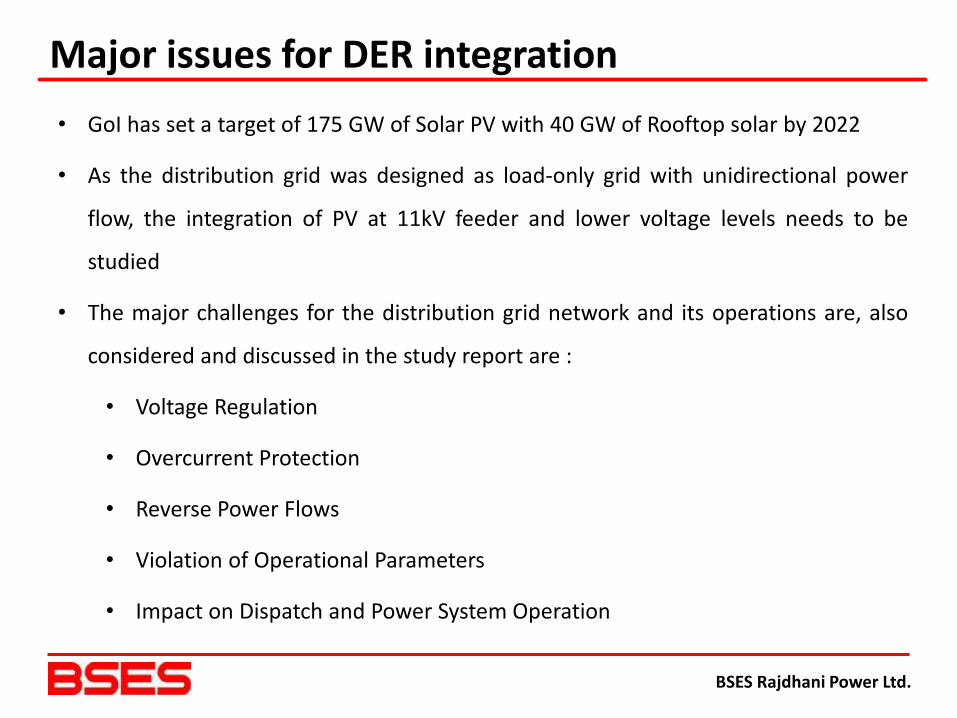
Major issues for DER integration • GoI has set a target of 175 GW of Solar PV with 40 GW of Rooftop solar by 2022
• As the distribution grid was designed as load-only grid with unidirectional power
flow, the integration of PV at 11kV feeder and lower voltage levels needs to be
studied
• The major challenges for the distribution grid network and its operations are, also
considered and discussed in the study report are :
• Voltage Regulation
• Overcurrent Protection
• Reverse Power Flows
• Violation of Operational Parameters
• Impact on Dispatch and Power System Operation
BSES Rajdhani Power Ltd.
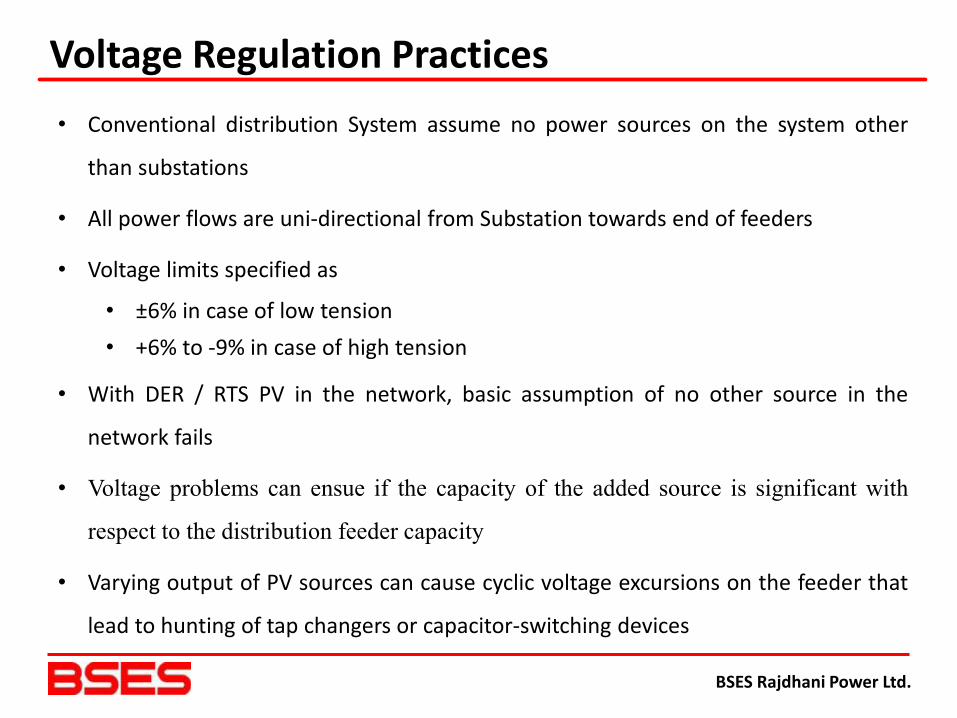
Voltage Regulation Practices • Conventional distribution System assume no power sources on the system other
than substations
• All power flows are uni-directional from Substation towards end of feeders
• Voltage limits specified as
• ±6% in case of low tension • +6% to -9% in case of high tension
• With DER / RTS PV in the network, basic assumption of no other source in the
network fails
• Voltage problems can ensue if the capacity of the added source is significant with
respect to the distribution feeder capacity
• Varying output of PV sources can cause cyclic voltage excursions on the feeder that
lead to hunting of tap changers or capacitor-switching devices
BSES Rajdhani Power Ltd.
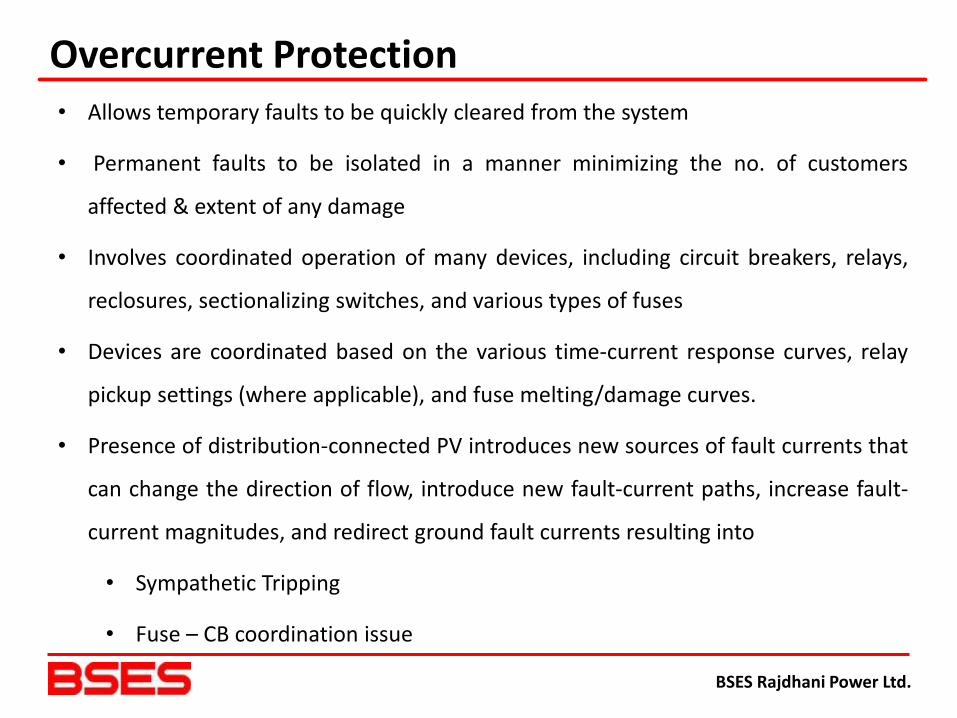
Overcurrent Protection • Allows temporary faults to be quickly cleared from the system
• Permanent faults to be isolated in a manner minimizing the no. of customers
affected & extent of any damage
• Involves coordinated operation of many devices, including circuit breakers, relays,
reclosures, sectionalizing switches, and various types of fuses
• Devices are coordinated based on the various time-current response curves, relay
pickup settings (where applicable), and fuse melting/damage curves.
• Presence of distribution-connected PV introduces new sources of fault currents that
can change the direction of flow, introduce new fault-current paths, increase fault-
current magnitudes, and redirect ground fault currents resulting into
• Sympathetic Tripping
• Fuse – CB coordination issue
BSES Rajdhani Power Ltd.
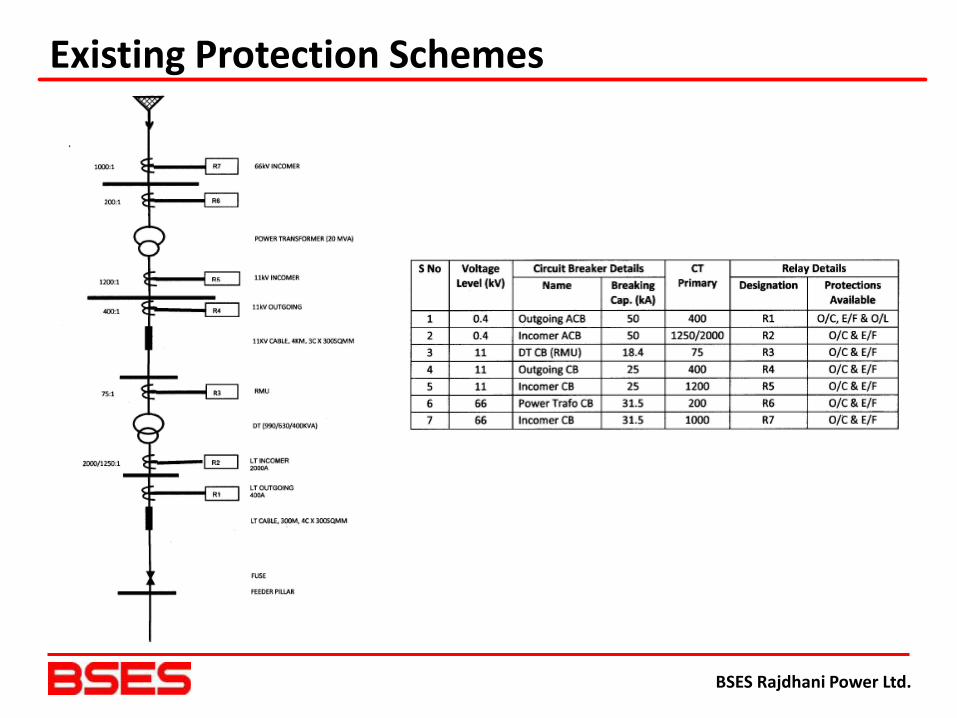
Existing Protection Schemes

BSES Rajdhani Power Ltd.
Reverse Power Flow • Maximum reverse power flow into the grid can be allowed based on two
parameters: • Feeder/grid asset thermal capacity • Over-voltage at the point of interconnection
• Following formula is used to calculate the maximum reverse power flow on a feeder:
• Maximum phase current in a feeder has been calculated using the following formula:
BSES Rajdhani Power Ltd.
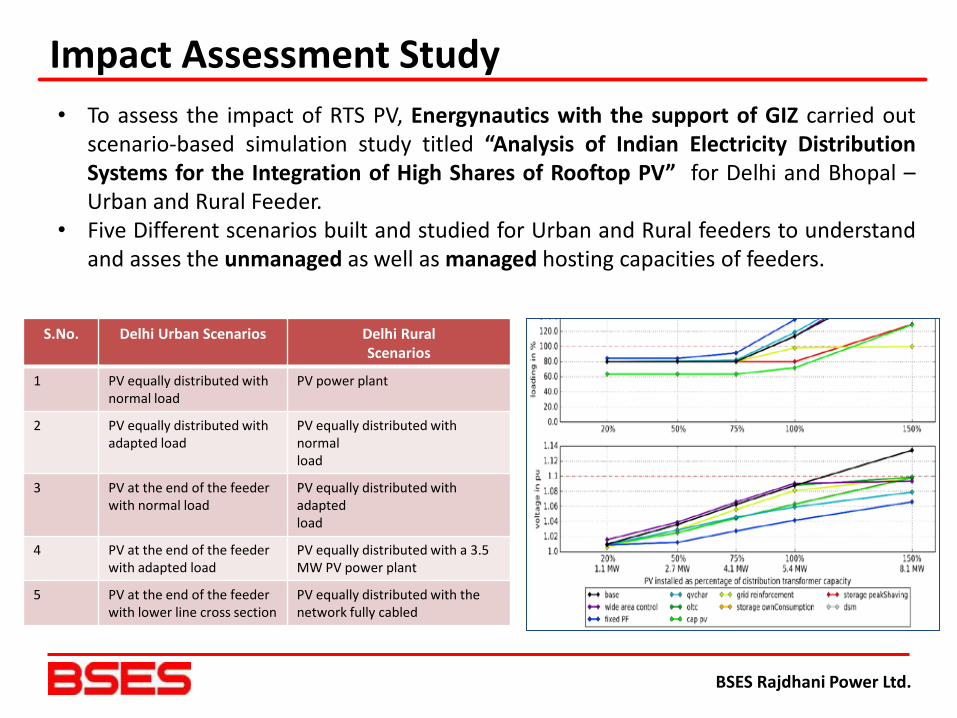
Impact Assessment Study • To assess the impact of RTS PV, Energynautics with the support of GIZ carried out
scenario-based simulation study titled “Analysis of Indian Electricity Distribution Systems for the Integration of High Shares of Rooftop PV” for Delhi and Bhopal – Urban and Rural Feeder.
• Five Different scenarios built and studied for Urban and Rural feeders to understand and asses the unmanaged as well as managed hosting capacities of feeders.
S.No. Delhi Urban Scenarios Delhi Rural Scenarios
1 PV equally distributed with normal load
PV power plant
2 PV equally distributed with adapted load
PV equally distributed with normal load
3 PV at the end of the feeder with normal load
PV equally distributed with adapted load
4 PV at the end of the feeder with adapted load
PV equally distributed with a 3.5 MW PV power plant
5 PV at the end of the feeder with lower line cross section
PV equally distributed with the network fully cabled
BSES Rajdhani Power Ltd.
Key Findings 1. PV penetration levels of 75 % of distribution transformer capacity and higher can
be implemented without having to undertake any measures to contain voltage problems or overloading.
2. At very high penetration level (close to 100%), it could be observed that Active Power Management Strategies of either capping PV inverter capacity or the use of peak shaving storage performed best in resolving both voltage and loading issues.
3. Automatic voltage control by tap changing transformers at 132/33, 220/66 or 220/33 kV should be implemented in all distribution grids regardless of PV development. For lower voltage levels (66/11 or 33/11 kV level), this strategy is very beneficial, but not strictly required if the voltage control above is adequate.
4. Voltage problems in the distribution grid, caused by both load (under voltage) and PV (overvoltage) can be efficiently eliminated by the use of a wide area voltage measurement and control method i.e. measuring the voltage at multiple points in the grid and operating the voltage control by transformers accordingly.
5. The distribution grid codes need to be updated to require voltage control capability.
BSES Rajdhani Power Ltd.
Forum of Regulators study • Safe limit for network penetration by solar PV should be on over-current (thermal
capacity) for symmetrically distributed solar photovoltaic systems, when permitted PV capacity (AC nominal power of inverter) is not more than the sanctioned load/contract demand.
• If solar PV penetration capacity is more than the sanctioned load/contract
demand, aggregate or single PV power plant capacity (AC nominal power of inverter) that can be connected to the network has to be decided on a case by case basis, based on the loading of the respective DT and the feeder length, considering over-voltage at PCC as the deciding factor.
• If solar PV penetration capacity is not more than the sanctioned load/contract
demand, aggregate PV power plant capacity (AC nominal power of inverter) that can be connected to a network can be up to 100% of DT capacity, even under worst case scenario(s), i.e. with 0% running load, considering feeder’s thermal capacity as the deciding factor.
BSES Rajdhani Power Ltd.
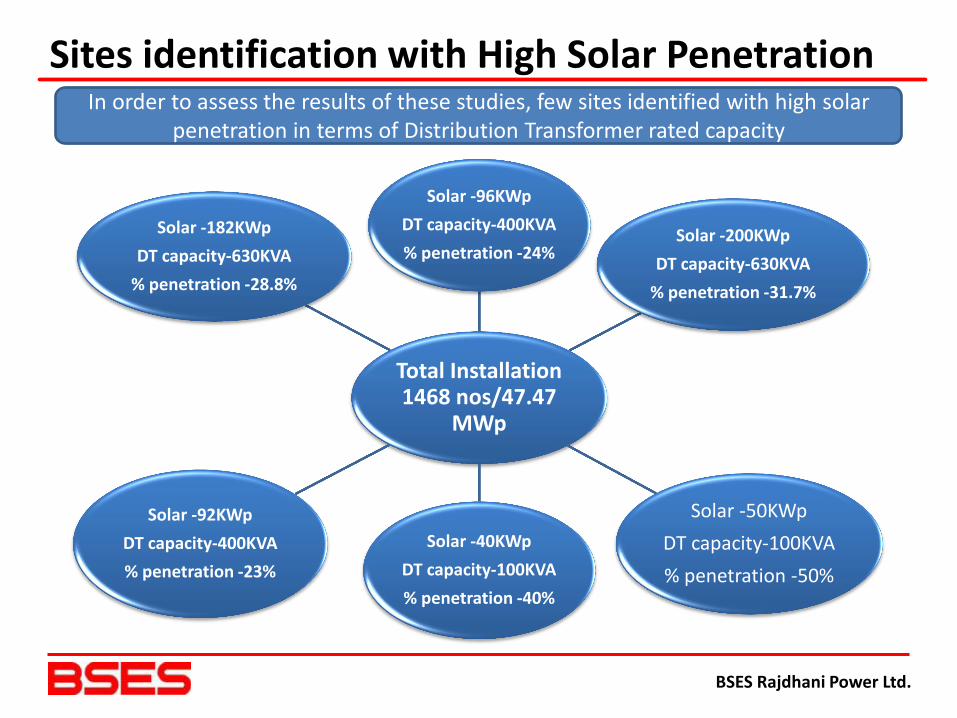
Sites identification with High Solar Penetration
Total Installation 1468 nos/47.47
MWp
Solar -96KWp DT capacity-400KVA % penetration -24%
Solar -200KWp DT capacity-630KVA
% penetration -31.7%
Solar -50KWp DT capacity-100KVA % penetration -50%
Solar -40KWp DT capacity-100KVA % penetration -40%
Solar -92KWp DT capacity-400KVA % penetration -23%
Solar -182KWp DT capacity-630KVA
% penetration -28.8%
In order to assess the results of these studies, few sites identified with high solar penetration in terms of Distribution Transformer rated capacity
BSES Rajdhani Power Ltd.
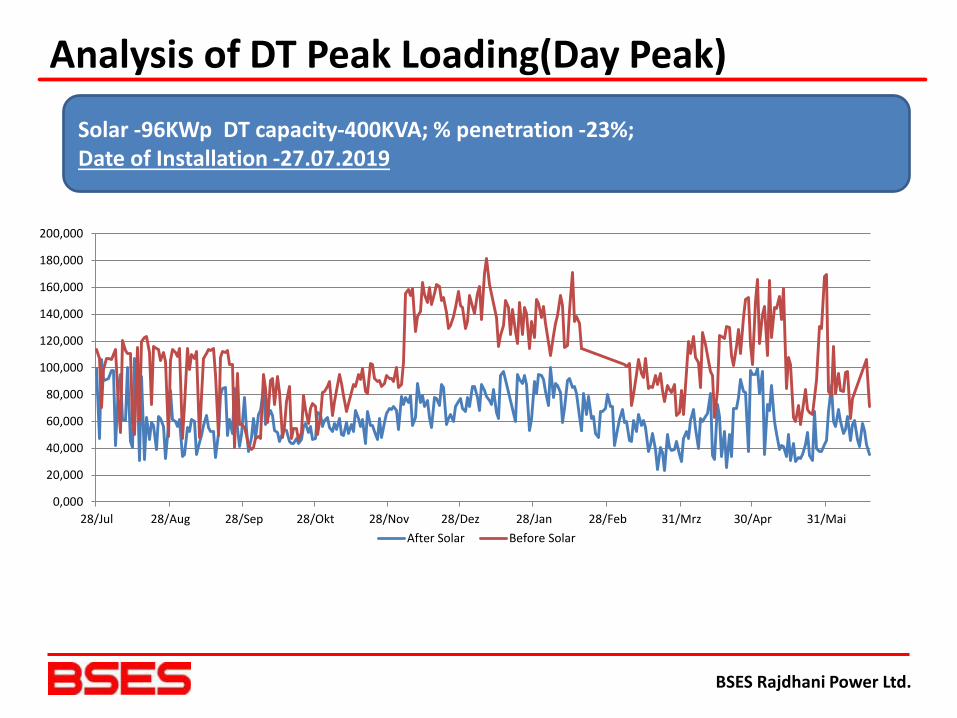
Analysis of DT Peak Loading(Day Peak)
0,000
20,000
40,000
60,000
80,000
100,000
120,000
140,000
160,000
180,000
200,000
28/Jul 28/Aug 28/Sep 28/Okt 28/Nov 28/Dez 28/Jan 28/Feb 31/Mrz 30/Apr 31/MaiAfter Solar Before Solar
Solar -96KWp DT capacity-400KVA; % penetration -23%; Date of Installation -27.07.2019
BSES Rajdhani Power Ltd.
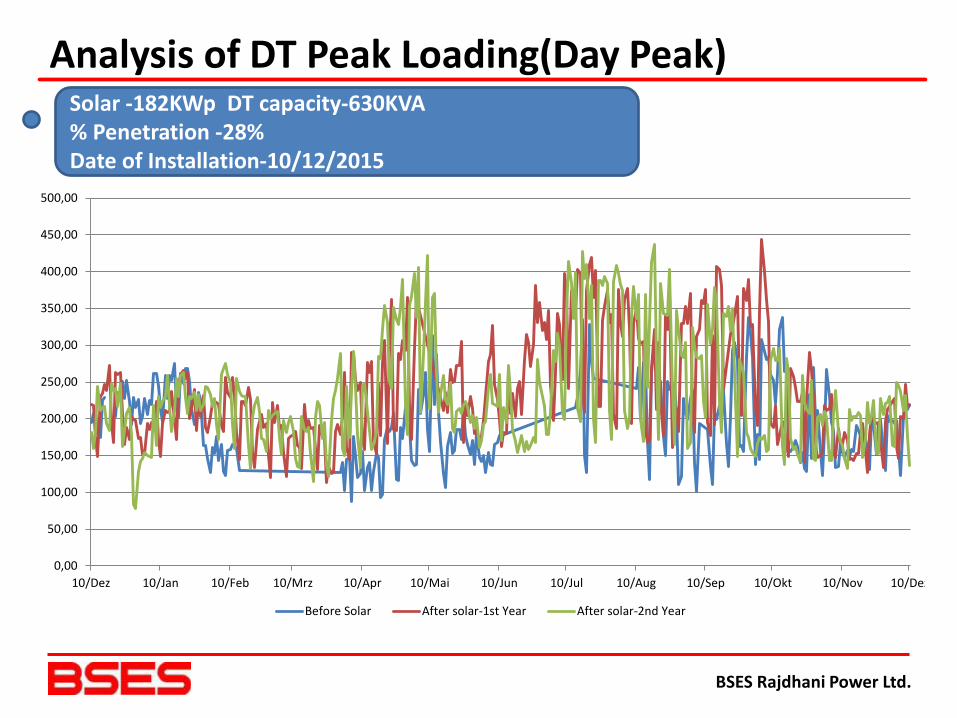
Solar -182KWp DT capacity-630KVA % Penetration -28% Date of Installation-10/12/2015
0,00
50,00
100,00
150,00
200,00
250,00
300,00
350,00
400,00
450,00
500,00
10/Dez 10/Jan 10/Feb 10/Mrz 10/Apr 10/Mai 10/Jun 10/Jul 10/Aug 10/Sep 10/Okt 10/Nov 10/Dez
Before Solar After solar-1st Year After solar-2nd Year
Analysis of DT Peak Loading(Day Peak)
BSES Rajdhani Power Ltd.
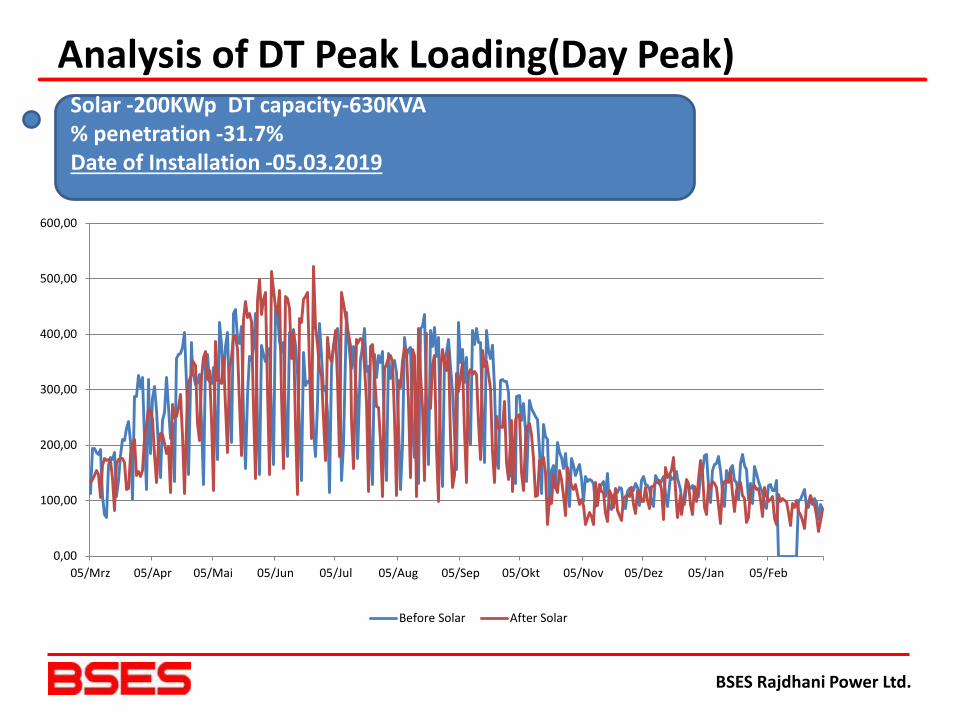
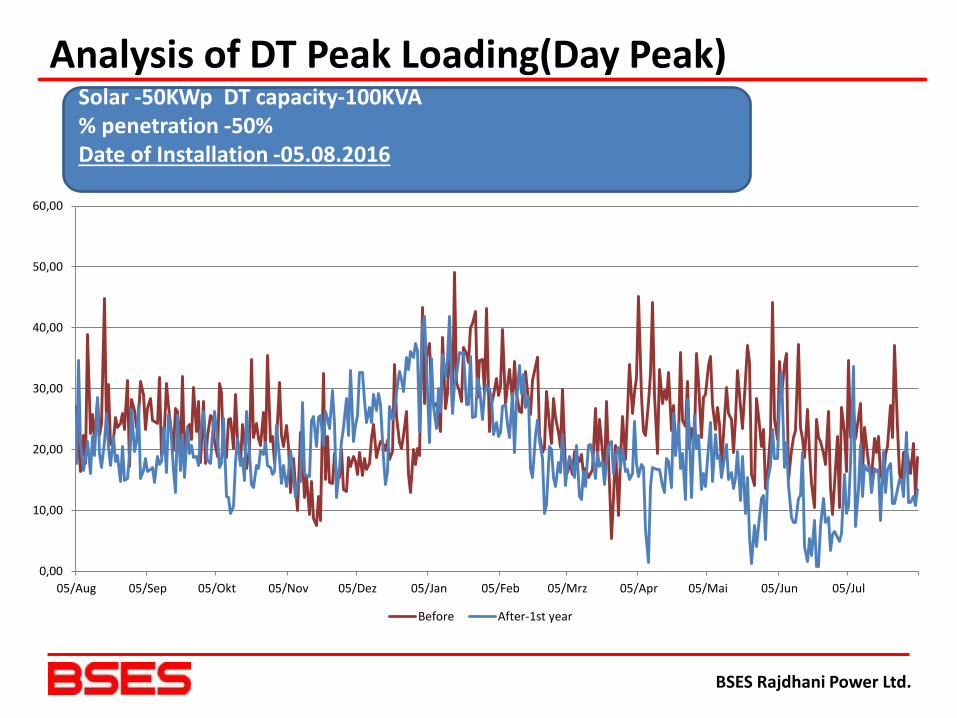
Analysis of DT Peak Loading(Day Peak)
0,00
100,00
200,00
300,00
400,00
500,00
600,00
05/Mrz 05/Apr 05/Mai 05/Jun 05/Jul 05/Aug 05/Sep 05/Okt 05/Nov 05/Dez 05/Jan 05/Feb
Before Solar After Solar
Solar -200KWp DT capacity-630KVA % penetration -31.7% Date of Installation -05.03.2019
BSES Rajdhani Power Ltd.
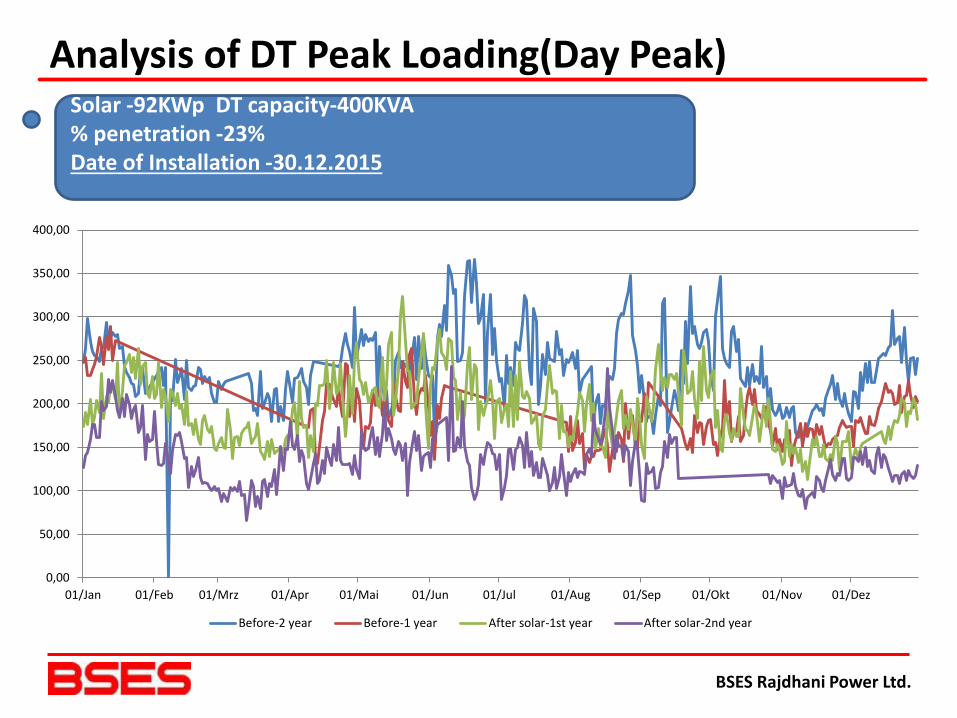
Analysis of DT Peak Loading(Day Peak)
0,00
50,00
100,00
150,00
200,00
250,00
300,00
350,00
400,00
01/Jan 01/Feb 01/Mrz 01/Apr 01/Mai 01/Jun 01/Jul 01/Aug 01/Sep 01/Okt 01/Nov 01/Dez
Before-2 year Before-1 year After solar-1st year After solar-2nd year
Solar -92KWp DT capacity-400KVA % penetration -23% Date of Installation -30.12.2015
BSES Rajdhani Power Ltd.
Analysis of DT Peak Loading(Day Peak)
0,00
10,00
20,00
30,00
40,00
50,00
60,00
05/Aug 05/Sep 05/Okt 05/Nov 05/Dez 05/Jan 05/Feb 05/Mrz 05/Apr 05/Mai 05/Jun 05/Jul
Before After-1st year
Solar -50KWp DT capacity-100KVA % penetration -50% Date of Installation -05.08.2016
BSES Rajdhani Power Ltd.
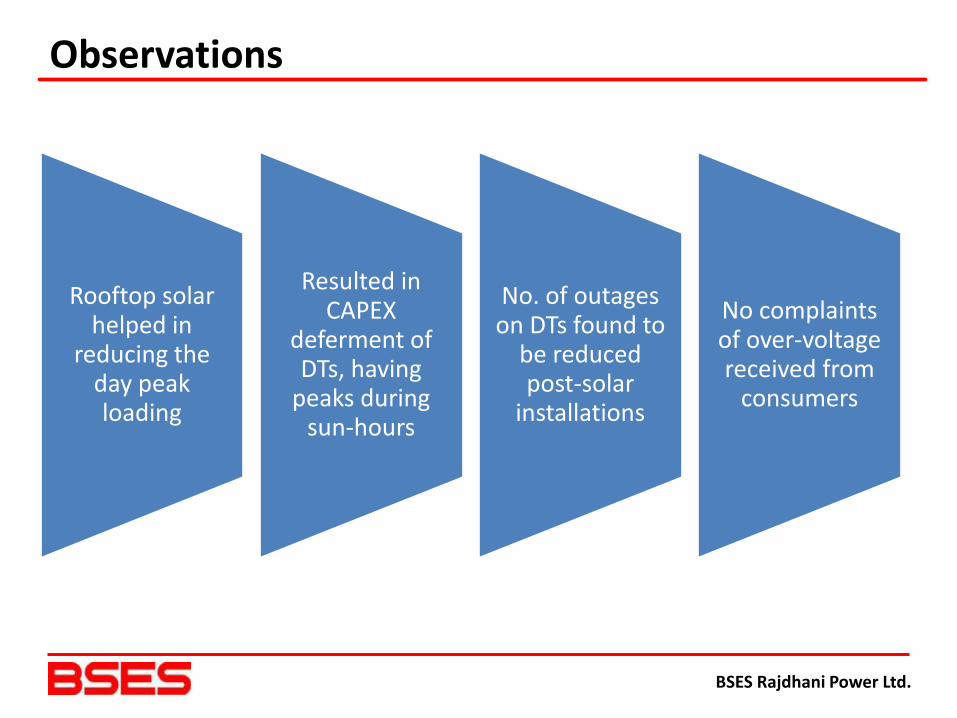
Observations
Rooftop solar helped in
reducing the day peak loading
Resulted in CAPEX
deferment of DTs, having
peaks during sun-hours
No. of outages on DTs found to
be reduced post-solar
installations
No complaints of over-voltage received from
consumers
BSES Rajdhani Power Ltd.
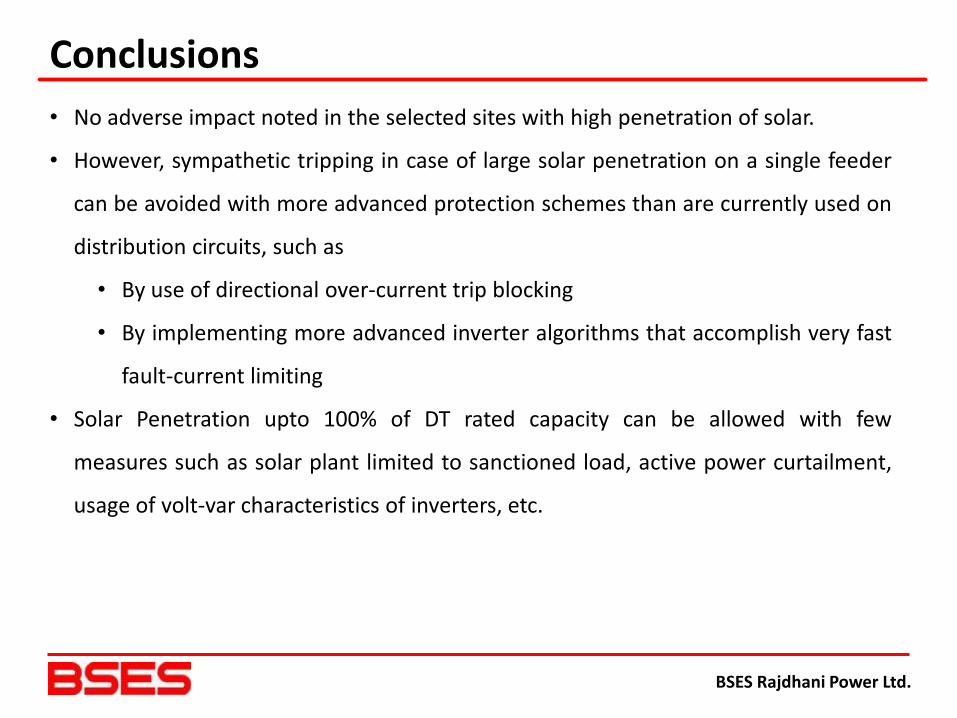
Conclusions • No adverse impact noted in the selected sites with high penetration of solar.
• However, sympathetic tripping in case of large solar penetration on a single feeder
can be avoided with more advanced protection schemes than are currently used on
distribution circuits, such as
• By use of directional over-current trip blocking
• By implementing more advanced inverter algorithms that accomplish very fast
fault-current limiting
• Solar Penetration upto 100% of DT rated capacity can be allowed with few
measures such as solar plant limited to sanctioned load, active power curtailment,
usage of volt-var characteristics of inverters, etc.

BSES Rajdhani Power Ltd.
Thank You