bsef 2013 invest/crimea aleksey_golubovich
TRANSCRIPT

UKRAINE – EU INTEGRATION: NEW DRIVER OF ECONOMIC GROWTH(by Global Vision Advisory Services and One Baltic Group)
October 2013

2
Ukraine-EU Association Agreement economic consequences in brief
Ukraine and the EU are going to ratify an Association Agreement. The consequences of this step for Ukrainian economy will be the following:
Positive influence on Financial Account and domestic Lending
► To intensify capital inflows Ukraine needs deep, but quick reforms in banking sector and financial markets liberalization (esp. for European banks).
Longer-term positive effect on Foreign Direct Investments
► To attract strategic investors Ukraine needs to reform the court system to restore investors trust to the Courts and to local authorities. Investor’s protection is the key issue to rise foreign capital at rapid pace and repeat the success of Poland in early 1990s.
Negative impact on Ukraine’s Trade Balance in the first 1-3 years after ratification (depending of the Russian trade policy)
►To minimize trade balance deterioration Ukraine needs currency devaluation, improvements in standards of goods quality and detailed plan for integration with the EU.

3
Higher risks of Ukraine’s economy are mainly overstated
There are a lot of speculations in press regarding higher risks of Ukrainian economy these days. But the fears are predominantly overstated:
Sovereign default
► Association Agreement with the EU will significantly raise chances for Ukraine’s government to receive stabilization loans from IMF and re-open external capital markets for Ukrainian debtors.
Currency devaluation
► Current exchange rate policy (peg to US dollar) is unjustified by economic reasons. Hryvnia devaluation will be positive for Ukrainian economy due to trade balance improvement and increase of Ukrainian producers competitiveness.
Collapse of trade with Russia
► Recent Russia-Ukraine trade relations worsening is caused by political, not economic reasons. So the full-scale trade war is not very likely and won’t last for long even if it begins.
4
Association Agreement with the EU will reopen external capital markets for Ukrainian banks and unfreeze domestic banking lending
Association Agreement with the EU will create the necessary condition for Ukraine to receive significant ($15-25 bn for several years) stabilization loans from IMF and EU financial institutions.
Stabilization loans will restore investors confidence in Ukraine’s government as well as in Ukrainian banking system credibility and reopen external capital markets for Ukrainian borrowers in private sector.
Association Agreement with the EU will also encourage European financial institutions to invest in Ukrainian branches and to buy local banks. It’s the only way to ease lending terms for local borrowers.
Lower capital costs and easier lending terms are needed to increase capital inflows from the EU to Ukraine (primarily in form of loans). That will improve Ukraine’s Balance of Payments, unfreeze domestic banking lending and become the main driver of economic growth in the forthcoming years.
5
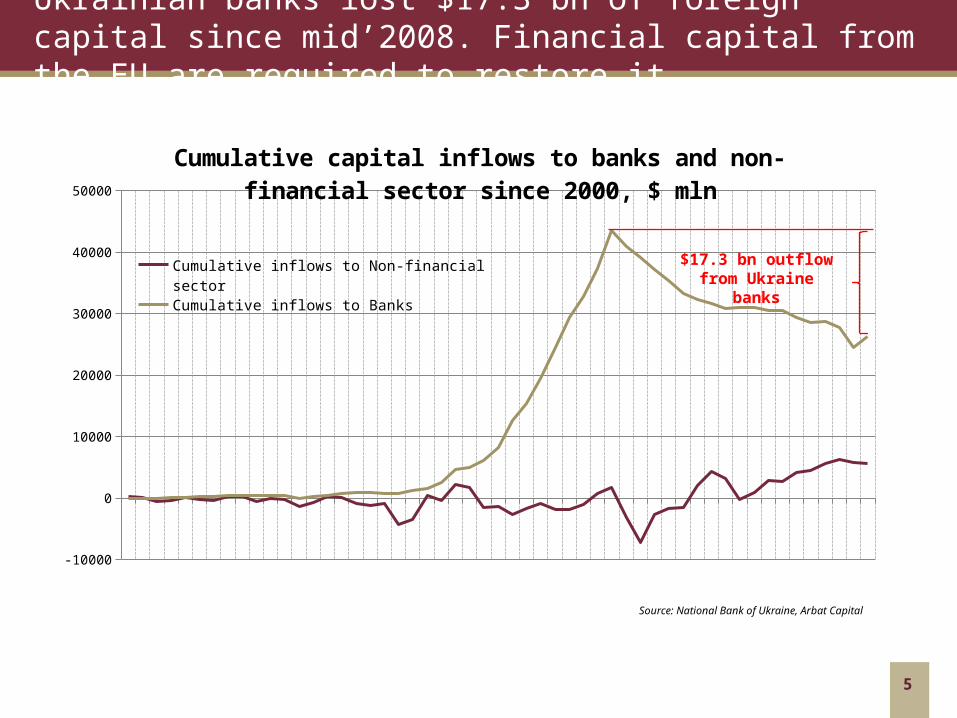
Ukrainian banks lost $17.3 bn of foreign capital since mid’2008. Financial capital from the EU are required to restore it.
Source: National Bank of Ukraine, Arbat Capital
2000
-Q1
2000
-Q3
2001
-Q1
2001
-Q3
2002
-Q1
2002
-Q3
2003
-Q1
2003
-Q3
2004
-Q1
2004
-Q3
2005
-Q1
2005
-Q3
2006
-Q1
2006
-Q3
2007
-Q1
2007
-Q3
2008
-Q1
2008
-Q3
2009
-Q1
2009
-Q3
2010
-Q1
2010
-Q3
2011
-Q1
2011
-Q3
2012
-Q1
2012
-Q3
2013
-Q1
-10000
0
10000
20000
30000
40000
50000
Cumulative capital inflows to banks and non-financial sector since 2000, $ mln
Cumulative inflows to Non-financial sector
Cumulative inflows to Banks
$17.3 bn outflow from Ukraine banks

6
After 2008 Ukrainian banks lost their ability of healthy credit expansion
Source: National Bank of Ukraine, Arbat Capital
Jan-06 Jul-06 Jan-07 Jul-07 Jan-08 Jul-08 Jan-09 Jul-09 Jan-10 Jul-10 Jan-11 Jul-11 Jan-12 Jul-12 Jan-13 Jul-13
0
20000
40000
60000
80000
100000
120000
140000
-40
-20
0
20
40
60
80
100Ukraine domestic banking lending, $ mln
Households
Non-financial corporations
Financial corporations
Government
Banking lending 12-months growth rate, % (r.h.s.)
Pre-crisis rapid expansion 70-80% p.a.
Post-crisis "new normal" 0-10% p.a.

7
Ukraine’s economic growth became very sensitive to capital flows. Lack of funding in 2011-2013 is the main reason of today’s crisis.
Source: National Bank of Ukraine, Arbat Capital
-8000
-6000
-4000
-2000
0
2000
4000
6000
8000
-25
-20
-15
-10
-5
0
5
10
15
20Ukraine capital inflows/outflows, $ mln
Non-financial sector
Banks
Government
Real GDP growth, % yoy (r.h.s.)

8
Association Agreement with the EU will increase foreign direct investments to Ukraine, but mostly in longer-term
More than 40% of current foreign direct investments to Ukraine are made by Ukrainian investors through European entities (mainly Cyprus)
Weak macroeconomic picture, poor legal system, severe corruption and rumors about forthcoming state default are main obstacles that withhold foreign investors from investing to Ukraine
Association Agreement with the EU can improve only economic aspects of Ukraine’s investment climate, that is not enough. Further reforms are required to strengthen investors confidence and boost foreign direct investments
Nevertheless, closer Ukraine and the EU economic integration after Agreement ratification should result in modest foreign capital inflows from main Ukraine’s trade partners (Italy, Germany, Poland)

9
Foreign direct investments grew almost tenfold over last ten years. 2011-2013 stagnation is a result of weak banks and lack of confidence.
Source: State statistics services of Ukraine, Arbat Capital
2002
-Q4
2003
-Q1
2003
-Q2
2003
-Q3
2003
-Q4
2004
-Q1
2004
-Q2
2004
-Q3
2004
-Q4
2005
-Q1
2005
-Q2
2005
-Q3
2005
-Q4
2006
-Q1
2006
-Q2
2006
-Q3
2006
-Q4
2007
-Q1
2007
-Q2
2007
-Q3
2007
-Q4
2008
-Q1
2008
-Q2
2008
-Q3
2008
-Q4
2009
-Q1
2009
-Q2
2009
-Q3
2009
-Q4
2010
-Q1
2010
-Q2
2010
-Q3
2010
-Q4
2011
-Q1
2011
-Q2
2011
-Q3
2011
-Q4
2012
-Q1
2012
-Q2
2012
-Q3
2012
-Q4
2013
-Q1
0
10
20
30
40
50
60
Foreign direct investments to Ukraine in 2002-2013
Foreign Direct Investments, mln. USD

10
Cyprus, Germany and Netherlands are accounted for 2/3 of total Foreign Direct Investments from the EU to Ukraine
Source: State statistics services of Ukraine, Arbat Capital
40.2%
14.7%
12.0%
7.9%
6.0%
4.1%3.7%
2.4%2.1%
1.6%
1.3%
1.1%2.9%
Main EU contributors of foreign direct investments to Ukraine*
Cyprus
Germany
Netherlands
Austria
United Kingdom
France
Sweden
Italy
Poland
Hungary
Luxembourg
Greece
Other EU states
* % of total foreign direct investments from EU to Ukraine

11
Financial services, real estate, trade and production of metals consumed nearly 70% of cumulated FDI from the EU to Ukraine
Source: State statistics services of Ukraine, Arbat Capital
29.6%
16.1%
13.9%
10.1%
5.7%
4.8%
3.6%
3.4%
2.6%
2.1%
1.8%
1.7%1.6% 3.0%
Industrial structure of foreign direct investments from the EU to Ukraine*
Financial
Real estate
Production of metals and metal products
Trade
Transport and communication
Food industry
Chemical industry
Production and distribution of electricity, gas and water
Mining
Production of other mineral products
Engineering
Construction
Agriculture
Others
* % of total foreign direct investments from EU to Ukraine

12
Nearly 70% of total FDI to Ukraine are made only in three regions:City of Kyiv, Dnipropetrovsk oblast and Donetsk oblast
Source: State statistics services of Ukraine, Arbat Capital
47.7%
15.9%
5.9%
4.0%
3.4%3.0%
3.0%2.7%
2.0%1.9%10.6%
Regional structure of foreign direct investments from the EU to Ukraine*
City of Kyiv
Dnipropetrovsk oblast
Donetsk oblast
Kharkiv oblast
Kyiv oblast
Lviv oblast
Odesa oblast
Autonomous Republic of Crimea
Zaporizhya oblast
Poltava oblast
Other regions
* % of total foreign direct investments from EU to Ukraine

13
Association Agreement with the EU may have negative impact on Ukraine’s trade balance. What is the right strategy to minimize it?
Association Agreement with the EU means no import tariffs for Ukrainian manufactured goods (including metals) and higher quotes for Ukrainian agriculture products in Europe that will boost Ukraine-EU export
The same time the Agreement implies no import tariffs for EU manufactured goods in Ukraine that will result in Ukraine-EU import rise and hurt seriously domestic producers in a number of industries
The positive effect of the Agreement for Ukraine’s trade balance is at risk, as export increase will be negated by import growth
Moreover, conventions with the EU carries significant risk of trade relations with Russia worsening, while CIS is a #1 export market for Ukrainian producers
WINNING STRATEGY: To motivate moving of production facilities to Ukraine from the EU countries and Russia.

14
However Ukraine’s trade balance deterioration won’t be terrible, esp. if Ukraine has a plan of devaluation
Russia will decrease import of Ukrainian agricultural products and foodstuff, but not very significantly. In case of economic stagnation in Russia, the population will boost demand for relatively cheap Ukrainian food products. So a new trade agreement between Russia and Ukraine is a matter of time.
Russia will continue to import machines & equipments from Ukraine due to well-established processing chains (e.g. aircraft or nuclear power industry). This will keep roughly $7 bn of Ukrainian export to Russia unchanged.
Coming 2014 year will be a real challenge for Ukraine as GDP will decline and Ukrainian Hryvnia will be devalued with high probability to defend local producers and local markets.

15
Europe is accounted for 25-30% of Ukraine export and 30-40% of Ukraine import. Russia takes 35-40% and 40-45% respectively.
Source: State statistics services of Ukraine, Arbat Capital
2003 2004 2005 2006 2007 2008 2009 2010 2011 2012 Jan-Jun'13
100
80
60
40
20
0
20
40
60
80
100
34.1 37.8 36.9 34.1 32.2 35.0 40.2 36.6 34.8 37.9 36.5
26.2 26.2 31.3 33.0 37.8 35.633.9 36.4 38.3 36.8 35.9
39.7 36.0 31.8 32.9 30.0 29.5 25.9 26.9 27.0 25.3 27.6
Ukraine goods export / import structure
Europe CIS Other regions
EX
PO
RT
, %
2003 2004 2005 2006 2007 2008 2009 2010 2011 2012 Jan-Jun'13
100
80
60
40
20
0
20
40
60
80
100
14.5 14.2 17.8 17.9 19.8 25.1 20.9 23.1 22.2 26.8 28.9
50.0 51.3 47.1 44.8 42.239.2 43.3 44.0 45.0 40.7 34.0
35.5 34.5 35.1 37.3 38.0 35.6 35.7 32.9 32.8 32.5 37.2IMP
OR
T,
%

16
Ukraine exports to the EU two main groups of goods: 1) base metals & mineral raw materials and 2) agricultural products & foodstuffs
Source: State Statistics Service of Ukraine, Arbat Capital
16.2%
15.2%
10.5%
9.9%6.7%5.8%
5.1%
3.9%
3.4%
3.4%3.3%
3.3%
13.5%
Geographical pattern of Ukraine's export to the EUItalyPolandHungaryGermanySpainNetherlandsCzech RepublicFranceRomaniaBulgariaAustriaUnited KingdomOther EU states
27.9%
19.3%
13.7%
11.1%
9.6%
6.0%4.7%
4.0%2.5%1.4%
Commodity pattern of Ukraine's export to the EU
Base metals and metal productsAgricultural productsMineral raw materialsMachines & EquipmentsFoodstuffsChemicalsLight industry productsWood & paper productsOther industrial productsTransport vehicles
Source: State Statistics Service of Ukraine, Arbat Capital

17
Ukraine imports from the EU mostly engineering products (machines, equipments, transport vehicles) and chemicals products
Source: State Statistics Service of Ukraine, Arbat Capital
25.8%
14.6%
7.7%7.2%5.1%
4.2%3.9%
3.7%
3.4%
3.2%2.9%
2.7%2.5%
13.0%
Main EU importers of Ukraine's goodsGermanyPolandItalyFranceHungaryUnited KingdomNetherlandsCzech RepublicSwitzerlandSpainLithuaniaAustriaRomaniaOther EU states
26.3%
19.6%
11.0%
8.3%
8.1%
6.8%
5.8%5.6%
5.4% 3.2%
Commodity pattern of Ukraine's import from the EU
Chemicals
Machines & Equipments
Transport vehicles
Agricultural products
Mineral raw materials
Other industrial products
Base metals and metal products
Wood & paper products
Foodstuffs
Light industry products
Source: State Statistics Service of Ukraine, Arbat Capital

18
Contacts
One Baltic Group Limited
Global Vision Advisory Services Ltd
GVAS, Room 207Mortlake Business Centre20 Mortlake High StreetLondonSW14 8JNUK