brm-final report income’s effect on expenditure
TRANSCRIPT

Income’s Effect On Expenditure
By
Essam Imtiaz Ibrahim
Hina Iqbal
Abdullah Ali
Sarwat Fatima
Abdul Wahab
Indus University - ST-2D, Block-17, Gulshan-e-Iqbal Karachi, Pakistan
25/5/2015

INDEX
INTRODUCTION: 1.1 Overview
1.2 Problem Statement
1.3 Outline of the Study
LITERATURE REVIEW:
2.1 ARTICLE 1
2.2 ARTICLE 2
RESEARCH METHOD:
3.1 Method of Data Collection
3.2 Research sample data size
APPENDIX: 50 OBSERVATIONS
RESULTS:
4.1 Descriptive Statistics
4.2 Correlations
4.3 Model Summary
4.5 Coefficients
CONCLUSION

ABTRACT:
The study examined the income and expenditure of population. Data were collected from 50
people with different ethnicity, race, and sex using purposive and simple linear regression test.
To determine if income has effect on expenditure, this article presents findings on the
relationship between household income and expenditure using regression analysis. It looks at
how whether the income has any effect on expenditure or not.

INTRODUCTION
1.1 Overview:
Income is Money that an individual or business receives in exchange for providing a good
or service or through investing capital. Income is consumed to fuel day-to-day expenditure. In
businesses, Expenditure is Payment of cash or cash-equivalent for goods or services, or a charge
against available funds in settlement of an obligation as evidenced by an invoice, receipt,
voucher, or other such document.
The independent variable is income and dependable variable is expenditure. Economists study
consumer spending and see how income affects expenditure. Economist says that even if the
household income goes to zero, consumption doesn’t. Consumers draw on future income or
savings to support the household when there is no income. This is autonomous consumption, not
dependent on the income level. If consumers have extra dollars, they spend part of that income as
well. When disposable income rises, consumption increases. Consumption may exceed
disposable income for low-income individuals. Consumption increases with increased income &
decreases with decrease income. Many researcher have emphasized on income as not more stable
data then of expenditure as expenditure are more reliable because income can easily fluctuate
time to time for many reasons and can’t be reliable for long-term. Anyways the effect on
expenditure is definite as many researchers have discussed. Here in this research we have also
discussed on does different level of income have effect on expenditure or not.
1.2 Problem Statement:
The objective of this study is to examine does income affects the expenditure overall or not.
1.3 Outline of the Study:
First topics of the research focuses on giving basic view of the research and provides information
on the overview on research on income and expenditure then existing work by various
researchers and past empirical studies is discussed. Then research provides details regarding
practically carrying out of the research and described data collection & analysis procedures &
gives details regarding the results of the research, finally the conclusion o

LITERATURE REVIEW
2.1
Imputation is a procedure used by the researcher where incomplete data is substituted by random
or standardized data in order to conclude research with wider range. In this study the use of
Imputation help forecasts income for household that did not gave complete information on their
income. This article focuses how income imputation affects analysis of the Consumer
expenditure data. Before imputation researchers had to be limit their research to only complete
data provided by the subjects. Now by using imputation that data can also be included in which
were incomplete. Shows the result of data before and after imputation and their comparison.
(Jonathan D. Fisher November 2006)
Before 2004 data imputation was not implied. The data section of the article describes the
relevant factors of the Consumer Expenditure. Data includes factor such as consumer unit that
includes the member of a household who own and maintain major expenditure. (housing ,food,
other living expense). In each consumer unit, one individual is entitled as reference person, who
is the person who owns or rent the house. Data are collected from consumer units and the
individuals within these consumer units five times over a 13-month period. The Consumer
Expenditure has 18 income variables dependable variable of which 6 variables are collected for
each person in the consumer unit: wages and salaries, self-employment income Social Security
benefits, railroad retirement benefits, and Supplemental Security Income benefits. The remaining
12 variables are collected for the consumer unit as a whole: pension income, interest income,
dividend income, royalty income, unemployment benefits, workers’ compensation benefits, child
support other income. (Jonathan D. Fisher November 2006)
The independent variables include demographic characteristics of the consumer unit where
a person belong, area, race, language etc. and a variable that equals the quarterly expenditure
outlays for the consumer unit. The imputation section provides an overview of the imputation
procedure and how it interacts with expenditures. In this article 44% of consumer unit were
reported to have provided at least one incomplete data. Bureau of Labor Statistics imputes
income using multiple imputation method. (Jonathan D. Fisher November 2006)

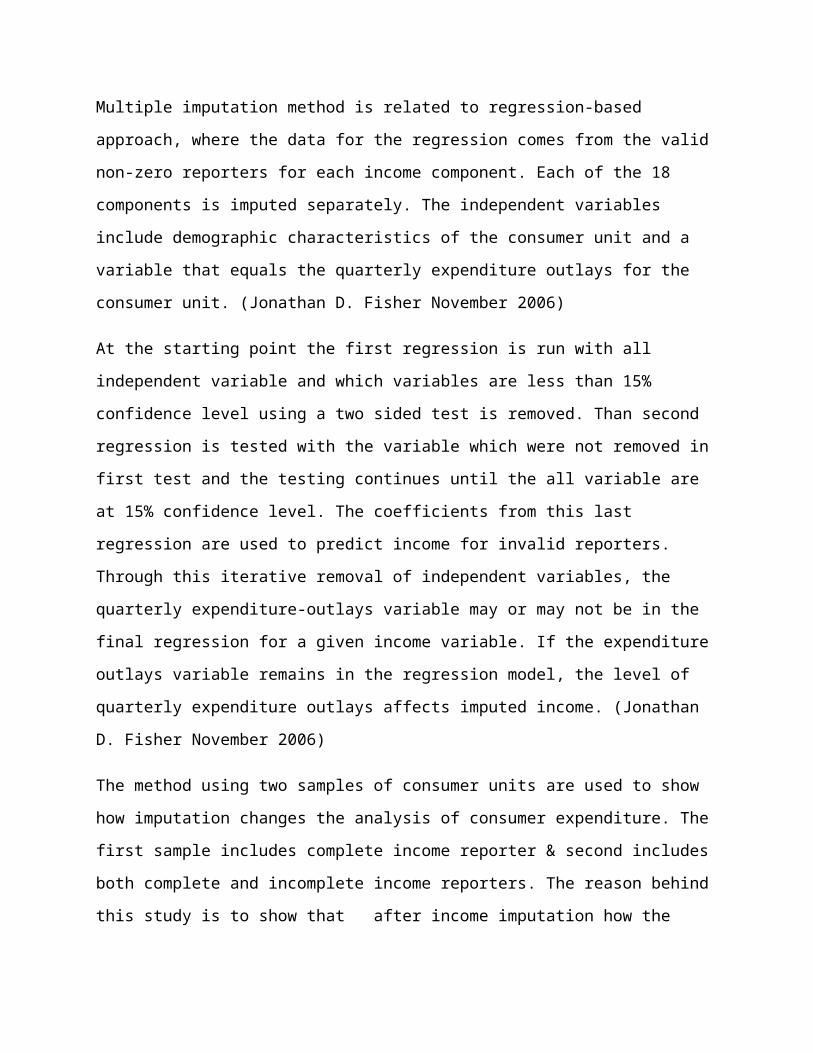
Multiple imputation method is related to regression-based approach, where the data for the
regression comes from the valid non-zero reporters for each income component. Each of the 18
components is imputed separately. The independent variables include demographic
characteristics of the consumer unit and a variable that equals the quarterly expenditure outlays
for the consumer unit. (Jonathan D. Fisher November 2006)
At the starting point the first regression is run with all independent variable and which variables
are less than 15% confidence level using a two sided test is removed. Than second regression is
tested with the variable which were not removed in first test and the testing continues until the all
variable are at 15% confidence level. The coefficients from this last regression are used to
predict income for invalid reporters. Through this iterative removal of independent variables, the
quarterly expenditure-outlays variable may or may not be in the final regression for a given
income variable. If the expenditure outlays variable remains in the regression model, the level of
quarterly expenditure outlays affects imputed income. (Jonathan D. Fisher November 2006)
The method using two samples of consumer units are used to show how imputation changes the
analysis of consumer expenditure. The first sample includes complete income reporter & second
includes both complete and incomplete income reporters. The reason behind this study is to show
that after income imputation how the inclusion of incomplete reporters might affect the
conclusions about the distribution and consumer expenditure. The research starts by comparison
of distribution of consumption expenditure for the two samples by presenting the percentiles, the
Gene coefficient, and the poverty rate for each. Now for the poverty rate the amount of consumer
expenditure is compared with the official poverty level. Then, consumption expenditures are
used in an Engel curve regression to further test the sensitivity of results from the two samples.
For comparing distribution again analysis of two samples are compared all consumer units and
complete income reporter. (Jonathan D. Fisher November 2006)
There were some differences in the data. Like when comparing demographic characteristics &
race for complete income reporters, incomplete income reporters, and all consumer units,
Incomplete income reporters are less likely than complete reporters to be under age 35 and over
age 65.11. (Jonathan D. Fisher November 2006)

There were clear differences in race with incomplete reporters more likely to be black and less
likely to be white. Now comparison is done for consumer expenditure data and it shows that
consumption expenditure are higher for complete reporter. Incomplete reporters are more likely
to be in the lower half of the consumption expenditures distribution. The researcher prefer to
compare complete reporter and all consumer unit as incomplete sample are very less while
adding large group of incomplete reporter would create visible difference in distribution between
complete reporters and all consumer units. The percent of consumer units with consumption
expenditures below the official U.S. poverty threshold. (Jonathan D. Fisher November 2006)
The study shows that complete reporters had consumption expenditures below the poverty
threshold, while all consumer units were consumption expenditure poor. Moreover; this
difference persists when the sample is split by family type and race. For time series analysis the
income imputation could affect the difference between the poverty rates of two samples affecting
the overall conclusion. (Jonathan D. Fisher November 2006)
A researcher who creates time series of poverty rate might use complete income reporters before
2004 and all consumer units in 2004.The poverty rate for complete reporters equals 10.6% in
2003 and 10.9% in 2004. If all consumer units are used for 2004, then the poverty rate equals
11.9%. Thus, depending on which sample is used in 2004, the poverty rate increased by either
0.3% point or 1.3% points from 2003 to 2004, a large difference that should be taken into
account in analysis. For regression analysis the data are analyzed in a regression framework
&Engel curves. The coefficients match expectations for complete income reporters and all
consumer units; the linear term on consumption expenditures is negative, while the quadratic
term is positive, statistically significant. Next, the sample is restricted to those households that
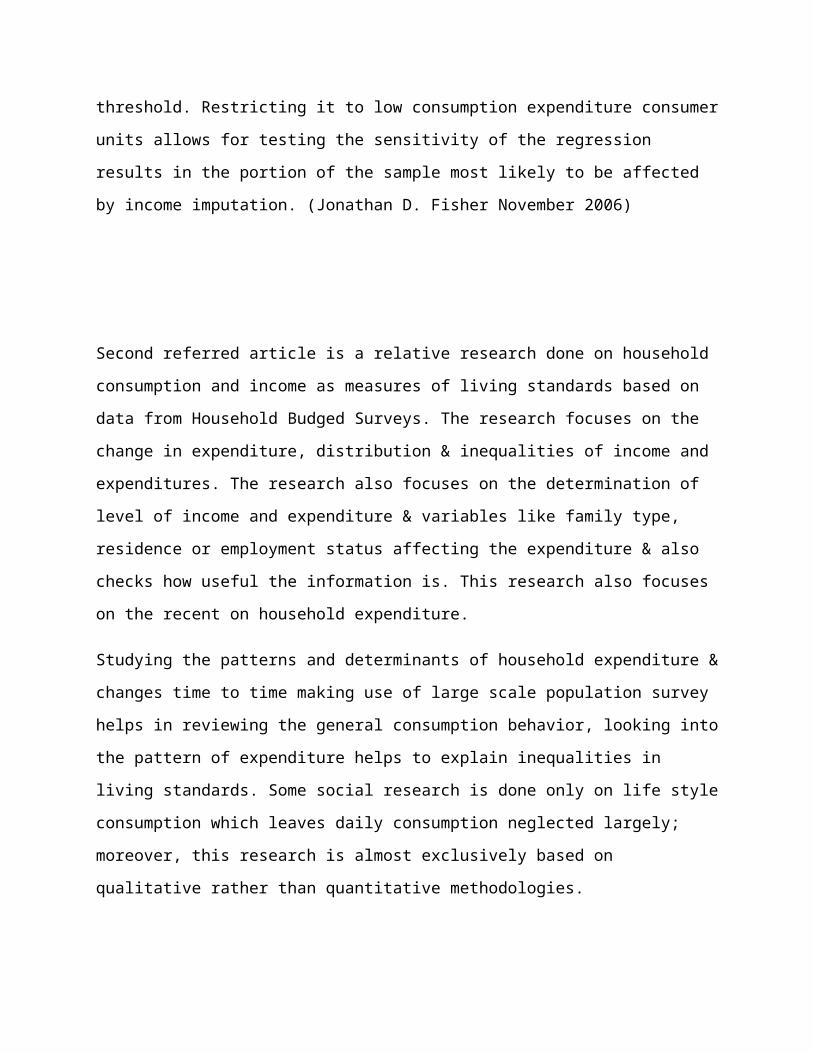
have consumption expenditures below the official poverty threshold. Restricting it to low
consumption expenditure consumer units allows for testing the sensitivity of the regression
results in the portion of the sample most likely to be affected by income imputation. (Jonathan D.
Fisher November 2006)
Second referred article is a relative research done on household consumption and income as
measures of living standards based on data from Household Budged Surveys. The research
focuses on the change in expenditure, distribution & inequalities of income and expenditures.
The research also focuses on the determination of level of income and expenditure & variables
like family type, residence or employment status affecting the expenditure & also checks how
useful the information is. This research also focuses on the recent on household expenditure.
Studying the patterns and determinants of household expenditure & changes time to time making
use of large scale population survey helps in reviewing the general consumption behavior,
looking into the pattern of expenditure helps to explain inequalities in living standards. Some
social research is done only on life style consumption which leaves daily consumption neglected
largely; moreover, this research is almost exclusively based on qualitative rather than
quantitative methodologies.
In researcher point of view on whether incomes, expenditures or consumption are better
indicators of welfare or well-being is of major interest. Referring to permanent income
hypothesis (Friedman 1957) that household expenditure are more reliable than current income as
there can be any sudden changes in current situation causing fluctuation and debt. Also referring
to (Brewer, Goodman,Leicester 2006:2) that expenditure are more reliable to show long-term
income and it is considered to be a much more reliable measure of economic well-being &
relative inequalities rather than a turbulent change in income, Expenditure is not of same level as
consumption and this may be a even better indicator of well-being. Among them is the
possibility of consumption without expenditures example for consumption without expenditures
is the case of households consuming housing after having payed off mortgages. As the fact is
that expenditure doesn’t reflect the total consumption of household but is still a better alternative
than income as it is more stable.
International research on expenditure pattern is very less in number there can be few references
Eurostat’s had presented a report on the classes of goods and services for which private
households in the EU Member States spend their financial resources (European Communities
2002; Puente 2005).

Another strand of research is focused on the relationship household income and expenditure and
distribution and inequalities of income and expenditure. Research is also answering questions
like is there any big differences in distribution and inequality in income and expenditure through
the use of respective analyses of incomes or expenditures as level of living indicators. Respective
topic has been addressed under the title like “Trends in Economic Inequality in the United States:
Income versus Expenditures versus Material Wellbeing”(Mayer, Jencks 1993); “United States
Inequality through the Prisms of Income and Consumption” (Johnson, Smeeding , Torrey 2004),
“Using expenditures to measure the standard of living in the United States: does it make a
difference?” (Johnson 2004). But one of the best and most reliable book in this field of research
is research is Daniel Slesnick’s (2001) book on living standards and their distribution in the
United States. This books study reveals differences between the distributions of income and
expenditures, which may result in different conclusion of trends in the inequality of living
standards. Other research have concerns over overspending that households’ total expenditures
may and actually do at least for certain periods of time exceed their net household incomes &
whether the observed result is accurate or not because of error in measurement of household
income and/or expenditures. What conditions sets population to overspending. A very recent
paper on “Overspending – Who, Why, and How” (Charles, Li,Schoeni 2006) presents first
instructive empirical evidence for the United States, but due to differences in spending behavior
it is certainly questionable whether the results will hold true for European countries as well.

RESEARCH METHOD
3.1 Method of Data Collection:
Required data was collected from people of different ethnicity, sex, age randomly after
interviewing there income expenditure were recorded as data, 50 data were collected.
3.2 Research sample data size:
We have collected almost 50 observations for this research. We have taken 37 observations form
Males and 13 observations from male Female of different ethnicity, sex, age.
3.3 Hypothesis:
H1=Significant impact of expenditure over income.
Ho=There is no significant impact of income on expenditure.
3.4 Variables:
A variable is a measureable characteristic that varies.
Independent variable is those that the researcher has control over. In our research income
independent variable.
Dependent variable shows the effect of manipulating. In our research expenditure is dependent
variable.
3.5 Methodology:
To carry out research we have use Linear Regression method to find out the relationship between
both dependent and independent variables by using SPSS software. We are finding out if income
effects on expenditure or not.
In simple linear regression, we predict scores on one variable from the scores on a second
variable. The variable we are predicting is called the criterion variable and is referred to as Y.
The variable we are basing our predictions on is called the predictor variable and is referred to as
X. When there is only one predictor variable, the prediction method is called simple regression.

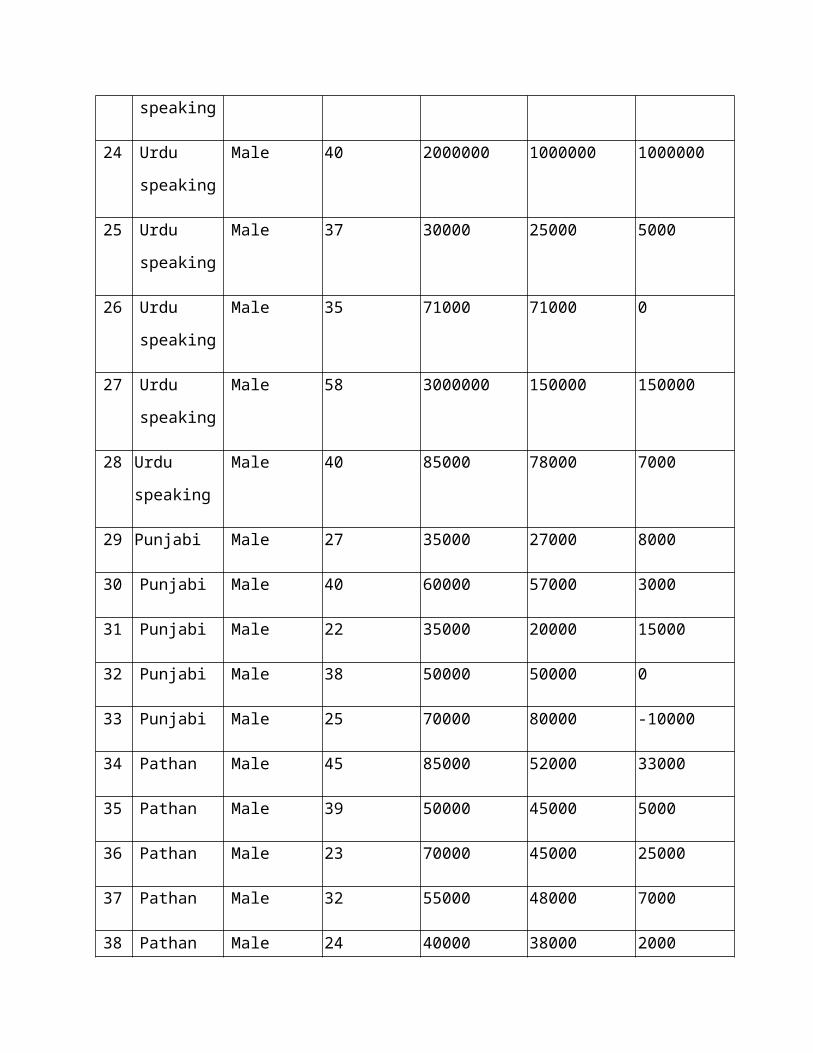
APPENDIXNo. Ethnicity Gender Age Total Income Total
Expenditure
Saving
1 Sindhi Female 28 40000 30000 10000
2 Sindhi Female 21 50000 35000 15000
3 Sindhi Female 35 250000 190000 60000
4 Sindhi Female 21 8000 4000 4000
5 Urdu
speaking
Female 38 44000 35000 9000
6 Urdu
speaking
Female 24 25000 12000 13000
7 Urdu
speaking
Female 21 5000 2000 3000
8 Pathan Female 40 50000 25000 25000
9 Punjabi Female 20 4000 2000 2000
10 Punjabi Female 40 90000 45000 45000
11 Punjabi Female 27 35000 32000 3000
12 Urdu
speaking
Female 21 200000 150000 50000
13 Urdu
speaking
Female 23 21000 17000 4000
14 Urdu
speaking
Male 23 60000 35000 25000

15 Urdu
speaking
Male 25 45000 40000 5000
16 Urdu
speaking
Male 25 30000 20000 10000
17 Urdu
speaking
Male 34 1000000 85000 15000
18 Urdu
speaking
Male 32 25000 33000 -8000
19 Urdu
speaking
Male 28 170000 60000 110000
20 Urdu
speaking
Male 35 40000 35000 5000
21 Urdu
speaking
Male 22 25000 20000 5000
22 Urdu
speaking
Male 19 40000 10000 30000
23 Urdu
speaking
Male 27 42000 40000 2000
24 Urdu
speaking
Male 40 2000000 1000000 1000000
25 Urdu
speaking
Male 37 30000 25000 5000
26 Urdu
speaking
Male 35 71000 71000 0

27 Urdu
speaking
Male 58 3000000 150000 150000
28 Urdu
speaking
Male 40 85000 78000 7000
29 Punjabi Male 27 35000 27000 8000
30 Punjabi Male 40 60000 57000 3000
31 Punjabi Male 22 35000 20000 15000
32 Punjabi Male 38 50000 50000 0
33 Punjabi Male 25 70000 80000 -10000
34 Pathan Male 45 85000 52000 33000
35 Pathan Male 39 50000 45000 5000
36 Pathan Male 23 70000 45000 25000
37 Pathan Male 32 55000 48000 7000
38 Pathan Male 24 40000 38000 2000
39 Sindhi Male 33 45000 41000 4000
40 Sindhi Male 25 35000 30000 5000
41 Sindhi Male 29 45000 40000 5000
42 Sindhi Male 29 50000 50000 0
43 Sindhi Male 42 70000 65000 5000
44 Sindhi Male 27 2000000 145000 1855000

45 Sindhi Male 29 120000 11500 108500
46 Sindhi Male 22 20000 10000 10000
47 Sindhi Male 21 50000 7000 43000
48 Sindhi Male 21 12000 14000 -2000
49 Sindhi Male 21 30000 10000 20000
50 Sindhi Male 27 42000 35000 7000
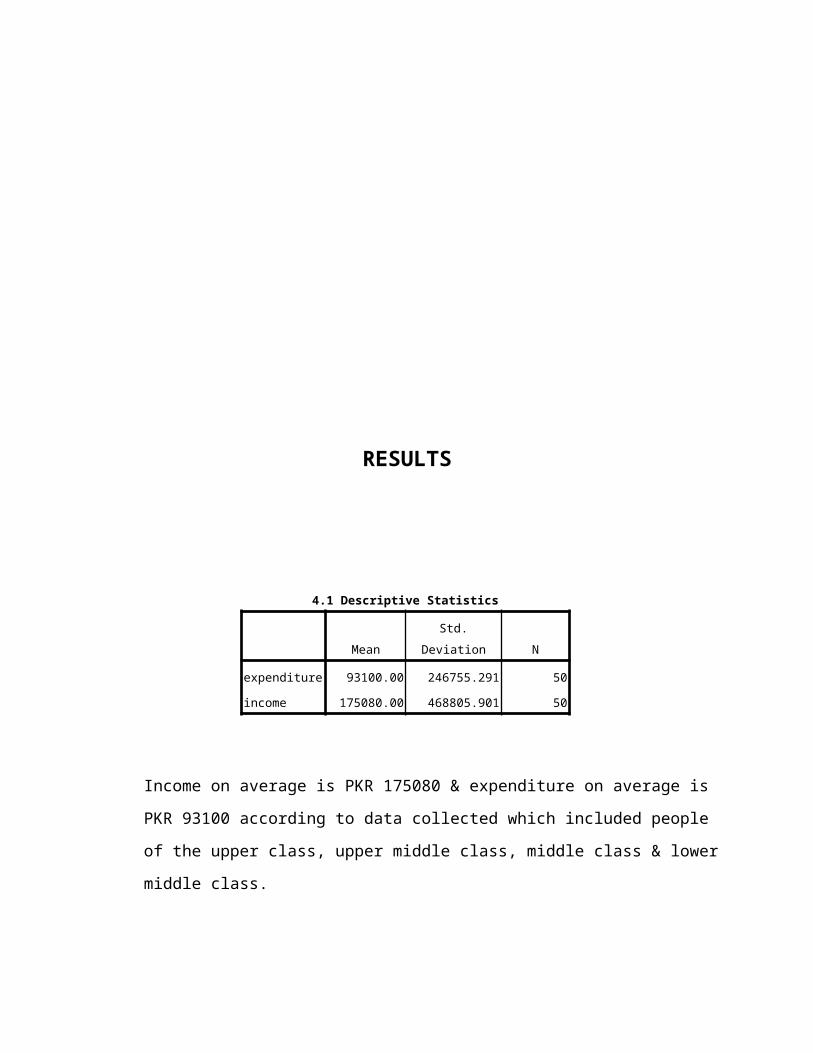
RESULTS

4.1 Descriptive Statistics
Mean Std. Deviation N
expenditure 93100.00 246755.291 50
income 175080.00 468805.901 50
Income on average is PKR 175080 & expenditure on average is PKR 93100 according to
data collected which included people of the upper class, upper middle class, middle class
& lower middle class.
4.2 Correlations
expenditure income
Pearson Correlation expenditure 1.000 .825
income .825 1.000
Sig. (1-tailed) expenditure . .000
income .000 .
N expenditure 50 50
income 50 50
Here correlation between income and independent variable has been checked. Income is
positively related to expenditure.

4.3 Model Summary
Model R R Square
Adjusted R
Square
Std. Error of the
Estimate
1 .825a .680 .673 141000.743
a. Predictors: (Constant), income
The model has adjusted R-squared of 0.673 that means approximately 67.3 %of the
variance in the dependent variable was accounted by the independent variable of this
research and 33.7 % of the variance remained unexplained.
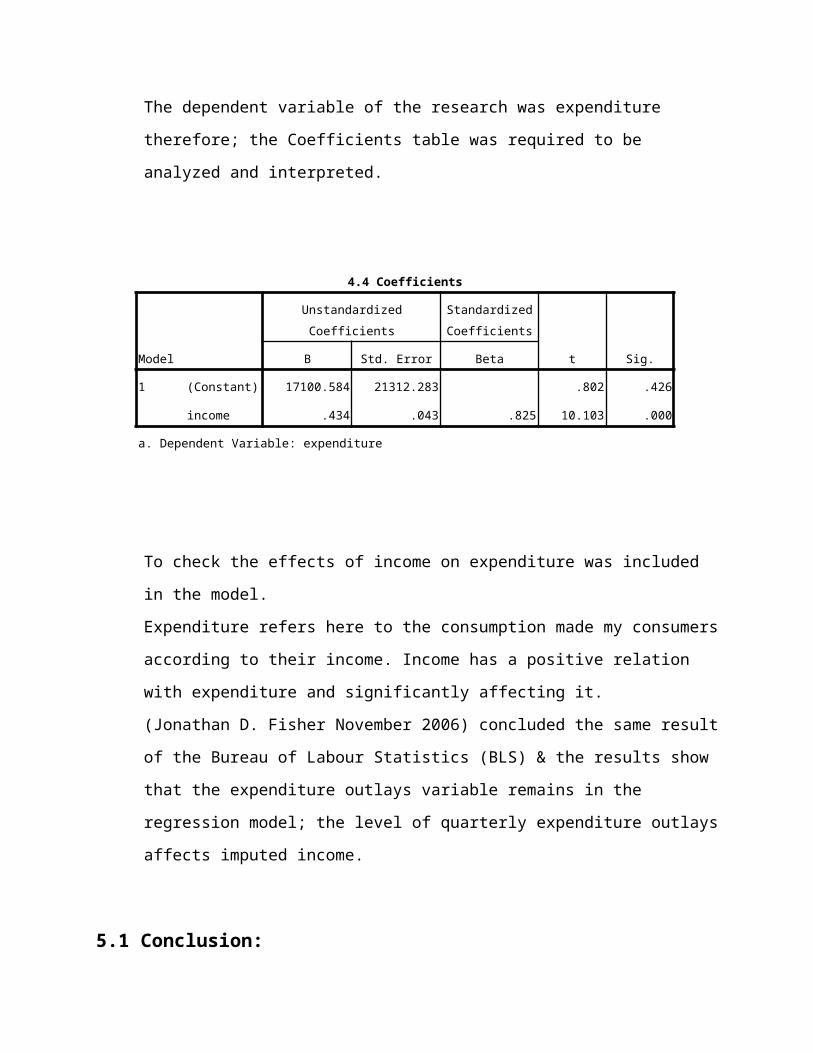
The dependent variable of the research was expenditure therefore; the Coefficients table
was required to be analyzed and interpreted.
4.4 Coefficients
Model
Unstandardized Coefficients
Standardized
Coefficients
t Sig.B Std. Error Beta
1 (Constant) 17100.584 21312.283 .802 .426
income .434 .043 .825 10.103 .000
a. Dependent Variable: expenditure
To check the effects of income on expenditure was included in the model.
Expenditure refers here to the consumption made my consumers according to their
income. Income has a positive relation with expenditure and significantly affecting it.
(Jonathan D. Fisher November 2006) concluded the same result of the Bureau of Labour
Statistics (BLS) & the results show that the expenditure outlays variable remains in the
regression model; the level of quarterly expenditure outlays affects imputed income.

5.1 Conclusion:
The main purpose of this study is to investigate the does income has any effect on expenditure.
The independent variable is income and dependable variable is expenditure. Economist suggests
even if the household income goes to zero, consumption doesn’t. Consumers draw on future
income or savings to support the household when there is no income. we have collected data
from 50 people randomly Questionnaires are utilized in the process of collecting data we
probably got answers of 50 observations in order to analyze if income has any effect on
expenditure or not. For this research we have used simple linear regression test where our
independent variable in income and dependent variable expenditure. After running the test we
came to a conclusion that there is significant impact of income over expenditure. Our null
hypothesis is rejected over here. It means that there income does have a significant effect on
expenditure.
REFERRENCES
Jonathan D. Fisher (Income imputation and the analysis of consumer expenditure data)
November 2006
Atkinson, Antony B. (1998): Poverty in Europe. Oxford, Blackwell.
Attanasio, Orasio P; Battistin, Erich (2004): What happened to consumption and Income
Inequality in the US and what can we learn from It? Presentation for Conference on “The Link
between Income and Consumption Inequality”. Madrid, March 26-27, 2004.
Attanasio, Orasio P; Battistin, Erich, Leicester, Andrew (2004): Inequality, Poverty and Their
Evolution in the U.S.: Consumption and Income Information in the Consumer Expenditure
Survey. Notes prepared for the National Poverty enter’s ASPE-Iniated Workshop on
Consumption among Low-Income Families. Washington, November 5, 2004.
Attanasio, Orasio P; Battistin, Erich, Leicester, Andrew (2006): From Micro to Macro, From
Poor to Rich: Consumption and Income in the UK and the US. Conference of the National
Poverty Center on “Consumption, Income, and the Well-Being of Families and Children”.
Washington, May 4-5, 2006.
Attanasio, Orazio; Berloffa, Gabriella; Blundell, Richard; Preston, Ian (2002): FromEarnings
Inequality to Consumption Inequality. The Economic Journal. Oxford / Malden, Royal Economic
Society 2002, C52-C59.
Battistin, Erich (2004): Errors in survey Reports of consumption Expenditures. London, Institute
for Fiscal Studies.
Blow, Laura (o.A.): Household consumption patterns. IFS Leverhulme Project.Blow, Laura;
Kalwij, Adriaan; Ruiz-Castillo, Javier (2004): Methological issues on the analysis of consumer
demand patterns over time and across countries. Dempatem Working paper no. 9.

Blow, Laura, Leicester, Andrew, Oldfield, Zoë (2004): Consumption Trends in the UK, 1975-
1999. London, Institute for Fiscal Studies, Working Paper Series.
Bögenhold, Dieter; Fachinger, Uwe (2000): The Social Embeddedness of Consumption –
Towards the Relationship of Income and Expenditures over Time in Germany.
ZESArbeitspapierNr. 6/00, Universität Bremen, Zentrum für Sozialpolitik.
Bonke, Jens; Browning, Martin (2006): Allocation of Expenditures within the Household: A
New Danish Survey. Copenhagen, Danish National Institute of Social Research, Research
Department of Social Policy and Welfare Services. Working Paper 16: 2006
Brewer, Mike; Goodman, Alissa; Leicester, Andrew (2006): Household spending in Britain.
What can it teach us about poverty? London, Institute for Fiscal Studies.
Charles, Kerwin; Danziger, Sheldon, Li, Geng, Schoeni, Bob (2006a): Studying Consumption
with the Panel Study of Income Dynamics: Comparisons with the Consumer Expenditure Survey
and an Application to the Intergenerational Transmission of Well-being. Conference of the
National Poverty Center on “Consumption, Income, and the Well-Being of Families and
Children”. Washington, May 4-5, 2006.
Charles, Kerwin; Danziger, Sheldon, Pounder, Laurie, Schoeni, Robert F. (2006b): Income,
Consumption, and Well-Being among Poor Elderly. Conference of the National Poverty Center
on “Consumption, Income, and the Well-Being of Families and Children”. Washington, May 4-
5, 2006.
Charles, Kerwin; Li, Geng, Schoeni, Bob (2006): Over-Spending: Who, How, and Why?
Conference of the National Poverty Center on “Consumption, Income, and the Well-Being of
Families and Children”. Washington, May 4-5, 2006.
Corrigan, Peter (1997): Theoretical Approaches to Consumption. In: P. Corrigan (Hrsg.), The
Sociology of Consumption. An Introduction. London, Sage Publications, S. 17-32.
Deaton, Angus S.; Ruiz-Castillo, Javier; Thomas, Duncan (1989): The Influence of Household
Composition on Household Expenditure Patterns: Theory and Spanish Evidence. Journal of
Political Economy, vol. 97, no. 1, S. 179-200.
Deelen, Marijke van; Schettkat, Ronald (2004): Household Demand Patterns in West Germany.
Dempatem working paper no. 5.
Dhawan-Biswal, Urvashi (2002): Consumption and Income Inequality: The Case of Atlantic
Canada from 1969-1996. Canadian Public Policy – Analyse De Politiques, Vol. XXVIII, No. 4,
S. 513-537.
Dufour, Ariane; Loisel, Jean-Pierre; Maincent, Emmanuelle; Pouquet, Laurent; Volatier, Jean-
Luc (1999): Les comportements des consommateur européens. Une analyse comparative portant
sur la France, l´Allemagne, la Grande-Bretagne et l´Italie. Cahier de Recherche No. 126. Paris.
European Communities (Hg.) (2002): Household final consumption expenditure in the European
Union. Data 1995-99. Luxembourg, Office for Official Publications of the European
Communities.
Eurostat (2003): Household Budget Surveys in the EU. Methodology and recommendations for
harmonisation. Luxembourg.Eurostat (2004): Household budget surveys in the Candidate
Countries.Methodological Analysis 2003. Luxembourg.
Fahey, Tony, Maître, Bertrand, Nolan, Brian (2004): Housing Expenditures and Income Poverty
in EUCountries, Journal of Social Policy, 33 (3), pp. 437-454.
Featherstone, M. (1987): Lifestyle and Consumer Culture, Culture and Society, 4, S. 55-70.
Featherstone, Mike (1991): Consumer culture and postmodernism. London, Newbury Park, New
Delhi, Sage Publications.Frick, Joachim R., Grabka, Markus M. (2000): Personelle
Einkommensverteilung und der Einfluß von Imputed Rent. DIW-Diskussionspapiere, Nr. 225.
Berlin.
Friedman, Milton (1957): A Theory of the Consumption Function. Princeton.Gardes, Francois,
Starzec, Christophe (2004): Household Demand Patterns in France 1980 – 1995. Dempatem
working paper no. 6.

Garner, T.I. and K. de Vos (1994): "Income sufficiency, expenditures and subjective poverty:
Results from the United States and the Netherlands". In: W. Eichhorn (ed.),
Models and Measurement of Welfare and Inequality, Berlin, Springer-Verlag, S. 33-66.Garner,
Thesia I.; Short, Kathleen (2006): Poverty in the U.S. Based on NAS Recommendations: Income
and Expenditures. Conference of the National Poverty Center on “Consumption, Income, and the
Well-Being of Families and Children”,Washington, May 4-5, 2006.
Goodman, Alissa; Oldfield, Zoë (2004): Permanent Differences? Income and Expenditure
Inequality in the 1990s and 2000s. London, Institute for Fiscal Studies.
Hagenaars, A.J.M., K. de Vos and M.A. Zaidi (1994): Poverty statistics in the late 1980s:
Research based on microdata. Eurostat publication, Theme 3, Series D, Luxembourg, Office for
Official Publications of the European Communities.
Hagenaars, A.J.M., K. de Vos and M.A. Zaidi (1998): Patterns of poverty in Europe. In: Jenkins,
S. P., A. Kapteyn and B. van Praag, eds., The Distribution of Welfare and Household
Production: International Perspectives, Aldi Hagenaars Memorial volume, Cambridge,
Cambridge University Press.
Halbwachs, Maurice (1912): La Classe ouvrière et les niveaux de vie: Recherches sur la
hiérarchie des besoins dans les sociétés industrielles contemporaines. Paris.
Herpin, Nicolas; Verger, Daniel (2000a): La consommation des Francais. Tome 1 : Alimentation,
habillement, logement. Paris, Éditions la Découverte.
Herpin, Nicolas; Verger, Daniel (2000b): La consommation des Francais. Tome 2 : Transports,
loisirs, santé. Paris, Éditions la Découverte.
Houthakker, H.S. (1957): An International Comparison of Household Expenditure Patterns,
Commemoration the Centenary of Engel´s Law. Econometrica, Volume 25, Issue 4, S. 532-551.
Hurd, Michael D., Rohwedder, Susann (2006): Economic Well-Being at Older Ages: Income and
Consumption-Based Poverty Measures in the HRS. NBER Working Paper No. 12680.
Jackson, Tim; Michaelis, Laurie (2003): Policies for Sustainable Consumption. A report to the
Sustainable Development Commission. May 20, 2003.
Johnson, David S.; Smeeding, Timothy M.; Torrey, Barbara N. (2004): United States Inequality
through the Prisms of Income and Consumption. Preliminary Draft # 3 for “The Conference on
the Link between Income and Consumption Inequality”.Madrid, March 26-27, 2004.
Johnson, David S. (2004): Using expenditures to measure the standard of living in the United
States: does it make a difference? In: Wolff, Edward N. (ed.) What Has Happened to the Quality
of Life in the Advanced Industrialized Nations?. Cheltenham / Northampton, Edward Elgar
Publishing, Inc., S. 27-47.
Johnson, David; Shipp, Stephanie (o. A.): Trends in Inequality Using Consumer Expenditures:
1960 to 1993. Washington.
Kalwij, Adriaan; Machin, Steve (2004): Changes in Household Demand Patterns: A Cross-
Country Comparison. Dempatem Working paper no. 8.
Kamanou, Gisele, Ward, Michael, Havinga, Ivo (2005): Statistical Issues In Measuring Poverty
From Non-Survey Sources. Draft of Chapter 5 of Handbook on Poverty Statistics: Concepts,
Methods and Policy Use. United Nations Statistics Division.
Noll, Heinz-Herbert, Weick, Stefan (2006a): Strukturen des privaten Verbrauchs in Deutschland
- Ungleichheiten und temporärer Wandel. In: K.-S. Rehberg (ed.), Soziale Ungleichheit und
kulturelle Unterschiede. Verhandlungen des 32.