briefing: vrs status update - july 2012 - virginia...
TRANSCRIPT

VRS Overview for the
Joint Legislative Audit
and Review Commission
July 9, 2012

2
Agenda
• Diana F. Cantor VRS Board Chairman
VRS Overview
• Ronald D. Schmitz, CIO
Investments
Overview
• Robert P. Schultze, Director Administration
Overview

Chairman’s
Remarks Diana Cantor
VRS Board Chair

4
Diana F. Cantor, Chairman
John M. Albertine, Ph.D., Vice Chairman
A. Marshall Acuff, Jr.
Edwin T. Burton III, Ph.D.
Robert L. Greene
Mitchell L. Nason
Colette Sheehy
Paul W. Timmreck
Raymond B. Wallace, Jr.
VRS Board Members

Investments Ronald D. Schmitz
Chief Investment Officer

CIO Transition/New Initiatives
New CIO on board as of November 2011
Transition going smoothly w/staff & Board of Trustees
No major new initiatives – portfolio is well structured given Board’s directive regarding risk/return
Continued investment into new Real Assets category
Continue to transition more assets to internal management
Fixed Income/Credit portfolios shifting slightly to higher liquidity/quality
DC Plans add Target Date Portfolios
Board has established an Investment Policy Committee
The committee will work with an outside consultant on asset/liability
There will be a robust discussion about risk tolerance
6

7
Total Fund Performance
Ending 3/31/12
VRS
(%)
Intermediate
Benchmark
(%)
Long-Term
Benchmark
(%)
1 Yr 4.0 3.2
3 Yr 15.5 15.5
5 Yr 2.1 2.1
10 Yr 6.2 5.8 5.1
15 Yr 7.2 6.8 6.6
20 Yr 8.3 8.0 8.2
Performance is annualized and net of fees

8
VRS Fiscal Year Returns
-25.0
-20.0
-15.0
-10.0
-5.0
0.0
5.0
10.0
15.0
20.0
25.0
1990
1991
1992
1993
1994
1995
1996
1997
1998
1999
2000
2001
2002
2003
2004
2005
2006
2007
2008
2009
2010
2011
2012
% R
etur
n
Investment Return Assumption
* FY 2012 Through 3/31

Asset Allocation:
March 2005 vs. March 2012
9
March 2005
$43.1 billion March 2012
$54.2 billion
Domestic Equity 47.5%
Non-U.S. Equity (Dev) 17.8%
Emerging Mkts 2.9%
Fixed Income 19.5%
Credit 2.8%
Public Real Estate 1.4%
Private Real Estate 2.5%
Private Equity 4.9%
Cash 0.7%
Domestic Equity21.5%
Non-U.S. Equity (Dev)17.3%
Emerging Mkts7.3%
Fixed Income19.6%
Emerging Mkt Debt2.7% Credit
9.9%Convertibles
4.5%
Public Real Assets1.1%
Private Real Assets6.5%
Private Equity8.8%
Cash0.8%

10
Cash Flow Projection
10
$0
$500
$1,000
$1,500
$2,000
$2,500
$3,000
$3,500
$4,000
FY
20
11
FY2
012
FY2
013
FY2
014
FY2
015
FY2
016
FY2
017
FY2
018
FY2
019
FY2
020
Cash Flow Projection - 10 Years (in millions) Net Cash Out Div. & Int. Distributions
Last Update: November, 2010

11
2011’s “Challenging Outlook”
Last year at this meeting Charles Grant made the
following observations:
Continued deleveraging in private sector, and eventually in
public sector
Potential for higher regulation and taxation
Government policy will be challenging: austerity versus stimulus
Headwinds to growth, especially in developed world
Moderate equity returns expected
11
12
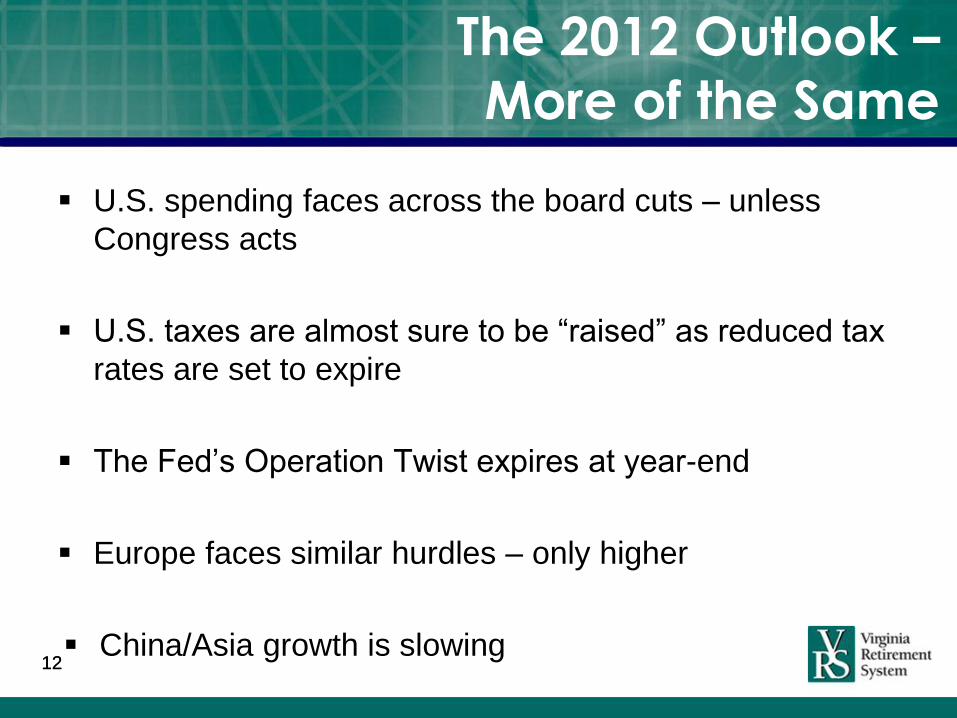
The 2012 Outlook –
More of the Same
U.S. spending faces across the board cuts – unless
Congress acts
U.S. taxes are almost sure to be “raised” as reduced tax
rates are set to expire
The Fed’s Operation Twist expires at year-end
Europe faces similar hurdles – only higher
China/Asia growth is slowing 12

2012 Outlook
Debt burden still high – deleveraging will continue
Developed world growth will be sub-par
Emerging world growth will be higher than developed
economies but lower than the recent past
It will take time to achieve balance
VRS is positioned for a moderate return environment
13

Administration Robert P. Schultze
Director

15
VRS Overview
VRS Overview
VRS is the 22nd largest public or private pension system in
the U.S.
There are more than 600,000 members, retirees and
beneficiaries.

VRS Total Membership
Teachers 146,859
Political Subdivisions 104,499
State Employees 78,980
State Police Officers’ Retirement System (SPORS) 1,892
Judicial Retirement System (JRS) 384
Virginia Law Officers’ Retirement System (VaLORS) 9,410
Total Active Members 342,024
Retirees/Beneficiaries 162,357
Inactive/Deferred Members 111,031
VRS Overall Impact 615,412
As of May 2012 16

17
50,000
70,000
90,000
110,000
130,000
150,000
170,000
1993 1994 1995 1996 1997 1998 1999 2000 2001 2002 2003 2004 2005 2006 2007 2008 2009 2010 2011 May2012
Tota
ls
Fiscal Year
State Teacher Localities
Active Members

18
0
10,000
20,000
30,000
40,000
50,000
60,000
70,000
80,000
1993 1994 1995 1996 1997 1998 1999 2000 2001 2002 2003 2004 2005 2006 2007 2008 2009 2010 2011 May2012
Tota
ls
Fiscal Year
State Teacher Localities
Retirees

19
July Retirements by Fiscal Year
3,251 2,944
3,026
2,996 3,686
3,415
3,619
3,560 3,355
3,622
5,368
4,073
4,151
1000
2000
3000
4000
5000
6000
2001 2002 2003 2004 2005 2006 2007 2008 2009 2010 2011 2012 2013
As of 6-26-2012

Benefit Comparison
State Teachers Local
Actives:
Average Age 48.0 45.2 46.1
Average Service 12.9 11.8 10.9
Average Salary $48,619 $47,363 $39,282
Retirees:
Avg. Age @ Retirement 62.2 61.1 61.7
Avg. Service @ Retirement 23.3 24.4 20.5
Avg. Benefit @ Retirement 39.6% 41.5% 35.0%
Avg. Annual Benefit $21,118 $24,359 $15,446
20
Information obtained from the June 30, 2011 Actuarial Valuation.

21
Funding VRS Benefits
66% of benefit costs funded by investment earnings
34% of benefit costs funded by employee/employer
contributions

22
Net Assets Available
for VRS Benefits
$0
$10
$20
$30
$40
$50
$60
1996 1998 2000 2002 2004 2006 2008 2010 2012
$22.2
$26.9
$31.7
$35.7
$40.8 $37.7
$34.4 $34.7
$40.0
$44.1
$48.7
$58.3
$55.1
$42.9
$47.7
$54.6 $52.4
As
se
ts i
n B
illi
on
s
Fiscal Year
Estimate as of 6-25-2012

23
Funded Status: State Employees
0%
20%
40%
60%
80%
100%
120%
1994 1998 2000 2002 2004 2006 2008 2010 2012 2014 2016
Assumptions: • FY 2012 investment return estimated at 2.0%. • All projected years’ investment return is 7.0% and 2.5% inflation rate.

24
Funded Status: Teachers
0%
20%
40%
60%
80%
100%
120%
1994 1998 2000 2002 2004 2006 2008 2010 2012 2014 2016
Assumptions: • FY 2012 investment return estimated at 2.0%. • All projected years’ investment return is 7.0% and 2.5% inflation rate.

Reasons for Decline
in Funded Status
Decline in funded status:
Two recessions since 2000, producing investment returns
below actuarial assumptions
More conservative estimates of long-term future investment
gains:
Pre-2005: 8.0%
2005 – 2009: 7.5%
2010 – Present: 7.0%
Long-term trend (since mid-90s) of funding contribution rates
below board certified rates; will likely continue through 2018-
2020 biennium
Pension reform will produce gradual improvement over
the next 20 years 25

Retirement Contribution Rates
Board
Certified 2013 & 2014
Fiscal Year
2012*
Rates
2013 & 2014
State 13.07% 3.21%
8.76%
Teachers 16.77% 6.33% 11.66%
SPORS 32.62% 11.09% 24.74%
VaLORS 19.52% 7.08% 14.80%
Judges 54.11% 32.13% 45.44%
Contribution rates do not include the 5% member contribution rate. * Fiscal year 2012 retirement system
contribution rates for state plans shown in the table above are blended rates. The blended rate was derived from
the state paying one rate for the first three quarters of the fiscal year and a higher rate for the last quarter. Fiscal
year 2012 retirement contribution rates for state plans for the two periods are as follows: 2.08% and 6.58% for
State; 7.73% and 21.16% for SPORS; 5.07% and 13.09% for VaLORS; and 28.65% and 42.58% for JRS. 26

Contribution Impact
Fiscal Year
2012
Fiscal Year
2013
General Fund Budget $16.3 billion
$17.3 billion
General Fund Allocation for Retirement:
State Employee VRS Contributions
Teacher VRS Contributions
Total:
$107.2 million
$166.2 million
$273.4 million
$233.7 million
$302.8 million
$536.5 million
Percent of General Fund Allocated
for VRS Pension Costs
1.67% 3.10%
Average Allocation Among States
(Boston College Center for Retirement
Research)
3.80% n/a
27
Impact of VRS Pension Contributions
on State Budget

VA Retirement System Liabilities
28
Plan 6/30/2011
(in billions)
State Employees
(includes SPORS, JRS, VaLORS)
$7.33
Teachers
$12.60
Local Political Subdivisions $4.02
Total
$23.95
Unfunded Liabilities by Plan

Upcoming GASB
Standards Change
GASB changing standards for pension liabilities:
New standards approved June 25, 2012
Standards are effective for actuarial valuations as of June 30,
2013 for VRS and as of June 30, 2014 for employers
Reported liabilities will increase due to a discount rate
that blends long-term investment assumption with
municipal bond rate
Unfunded liabilities of cost-sharing plans (school
teachers) must be apportioned among participating
employers
Standards will require mark to market (asset smoothing
no longer used) 29

Pension Reform
Initiatives

Pension Reform Efforts in VA
Year Reform Effort
2008 General Assembly requests JLARC Compensation Study
2010 General Assembly creates Plan 2 for members hired on or after July 1, 2010:
Normal retirement changed to Social Security normal retirement age
Unreduced benefits commencing at Rule of 90
Reduced retirement moved to age 60 with at least five years of service
Members required to pay 5 percent member contribution (Local Option)
COLA formula revised
Five-year AFC formula
2011 General Assembly enacted 5/5 program for Plan 1 state employees
State employee Plan 1 members pay 5% member contribution
Offset with 5% salary increase
JLARC updated study on pension reform
2012 General Assembly requires:
Local employees pay 5% member contribution, phased in by July 1, 2016, with
salary offset
Non-vested Plan 1 employees benefit structure change, January 1, 2013
A hybrid plan for all general state and local employees hired on or after
January 1, 2014
31

2012 General
Assembly
Summary

2012 Legislation
33
Bill
Number
Patron Description
SB 497 Watkins Requires members employed by local government or school boards to pay the 5% employee
contribution, effective July 1, 2012. All local employers authorized to phase in the 5%
contribution over a maximum of five years and must provide salary increases to offset these
mandatory contributions. All new hires must pay the full 5% employee contribution.
Employee Contributions Effective July 1, 2012
Employer Contributions Effective July 1, 2012
Appropriation Act
Item Number
Description
Item 468 (H) Provides that local governments and school divisions must select an employer contribution:
The rate certified by the VRS Board of Trustees for the 2012-2014 biennium; or
The alternate rate, which is the higher of the current rate certified by the VRS Board for FY
2011-2012 or 70 percent of the VRS Board-certified rate for 2012-2014.

2012 Legislation
HB 1130/SB 498 (Howell/Watkins)
34
Plan Feature Group Comment
60-month AFC General state employees, SPORS, VaLORS, JRS,
teachers and localities (including local hazardous
duty with enhanced benefits)
Applies to Plan 1 members who are not vested
as of 1/1/13. Already applies to Plan 2
members.
1.65% multiplier for
service after 1/1/13
General state employees, teachers, localities and
JRS (Does not apply to SPORS, VaLORS or local
hazardous duty with enhanced benefits)
Applies to Plan 1 members who are not vested
as of 1/1/13 and Plan 2 members.
Rule of 90 General state employees, teachers and localities
(Does not apply to SPORS, VaLORS or local
hazardous duty with enhanced benefits)
Applies to Plan 1 members who are not vested
as of 1/1/13. Already applies to Plan 2
members.
COLA General state employees, SPORS, VaLORS, JRS,
teachers and localities (including local hazardous
duty with enhanced benefits)
Employees (all Plan 1 and Plan 2 members)
within 5 years of eligibility for an unreduced
benefit as of 1/1/13 are grandfathered. No COLA
until member who retires with less than 20 years
of service has received an allowance for 1 full
calendar year after reaching unreduced
retirement age.
COLA General state employees, SPORS, VaLORS, JRS,
teachers and localities (including local hazardous
duty with enhanced benefits)
Applies to all Plan 2 members and Plan 1
members who are not vested as of 1/1/13. COLA
capped at 3% (first 2% of CPI-U plus one-half of
the next 2%, for a maximum total of 3%).
DB Plan Changes Effective January 1, 2013

2012 Legislation
HB 1130/SB 498 (Howell/Watkins)
35
Beginning January 1, 2014
Rates Board-certified rate fully funded by the 2018-2020 biennium. General Assembly
would no longer use its own economic assumptions

2012 Legislation
HB 1130/SB 498 (Howell/Watkins)
36
Launch of the Hybrid Plan January 1, 2014
Eligibility Those that participate in regular VRS (state employees, JRS, teachers and
local government employees) automatically enrolled in hybrid from date of hire
Public safety employees without hazardous duty coverage enrolled in hybrid
from the date of hire
One-time election window for current employees
ORP employees may elect the hybrid
Current ORP employees not eligible to participate in new hybrid
Public safety employees with hazardous duty coverage will not participate in
the plan, but retain current plan provisions (VaLORS, SPORS, local enhanced
hazardous duty coverage)
Disability Provides a new optional disability program for localities. The locality must choose
either to join the VRS-administered program or provide a disability program with
comparable coverage from another source

2012 Legislation
HB 1130/SB 498 (Howell/Watkins)
37
Launch of the Hybrid Plan January 1, 2014
Multiplier DB component has a 1.0% multiplier to produce a nearly 30% replacement rate
after 30 years of service
Contributions Employee contributions automatically increased every three years by one-half a
percentage point, unless the employee opts out or the employee is already at
the maximum contribution of 5% to the DC component
Employee contribution of 4% to the DB plan
Employer contributions to the DB plan based on actuarial valuations
Employer contributions to the DC component consist of mandatory 1% match,
plus a 1% match on first percent elected by the employee, plus a one-half
percent matching contribution on the next 3% elected by the employee. Total
contributions as much as 5% from employee and 3.5% from employer

Contributions in the Hybrid Plan
Employee Employer
DB Plan Contribution 4% Actuarially Determined
DC Plan Contributions:
Mandatory Contribution 1% 1%
Optional Contributions 1% 1%*
Optional Contributions 1%
.5%*
Optional Contributions 1%
.5%*
Optional Contributions 1% .5%*
Total Optional Contributions: 4%
2.5%
Total Maximum 9% 3.5% + Actuarial
38
* Indicates the employer required match if the employee elects to make optional contributions.

Legislative
Implementation

Implementation Planning
Legislative implementation planning has begun:
Implementing July 1, 2012 legislation
Project team has formed to implement the hybrid plan
Work has begun on the RFP for the implementation of the hybrid and DC Plan Anticipate issuing the RFP this summer or early fall
Select vendor by the end of the calendar year
Vendor will work in tandem with current vendor for one year
Pension reform will delay Phase 4 Modernization implementation to focus on legislative initiatives
40

Other Customer
Service Initiatives
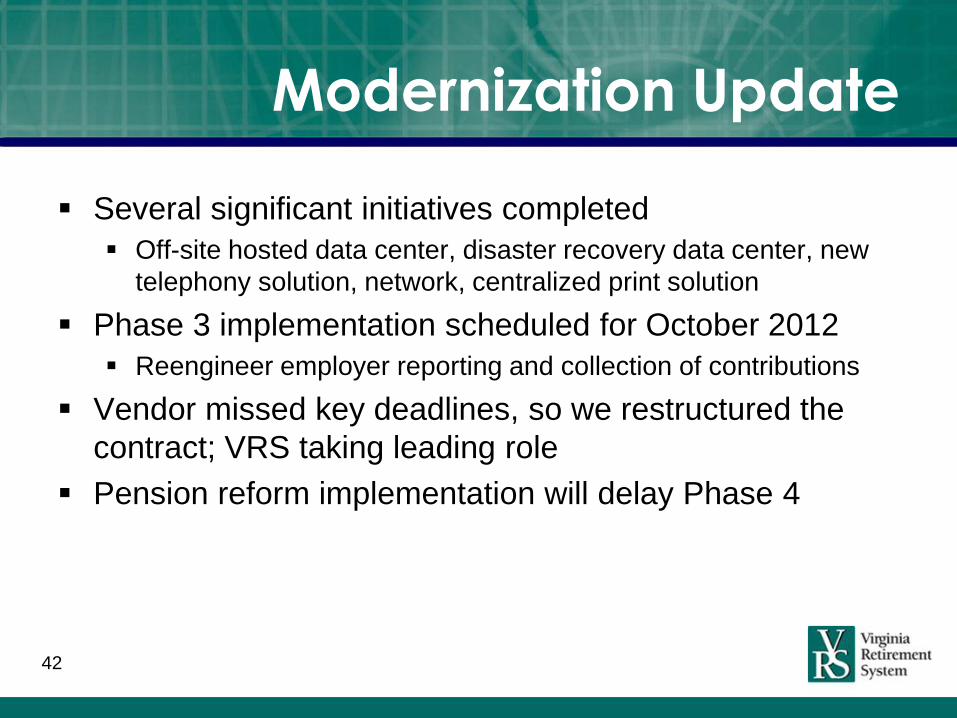
Modernization Update
Several significant initiatives completed
Off-site hosted data center, disaster recovery data center, new
telephony solution, network, centralized print solution
Phase 3 implementation scheduled for October 2012
Reengineer employer reporting and collection of contributions
Vendor missed key deadlines, so we restructured the
contract; VRS taking leading role
Pension reform implementation will delay Phase 4
42

Upcoming DC Plan Changes
DC Plans Lineup Changes:
Introducing Target Date Portfolios
Providing a path approach to make investing easier: Do-It-For-Me Path
Help-Me-Do-It Path
Do-It-Myself Path
Streamlining investment options
Implementing July 23
Changes will serve as a sound foundation for new hybrid plan
43

Thank you!