bridging the gap between the human and macaque connectome: a
TRANSCRIPT

Systems/Circuits
Bridging the Gap between the Human and MacaqueConnectome: A Quantitative Comparison of GlobalInterspecies Structure-Function Relationships and NetworkTopology
Oscar Miranda-Dominguez,1,5* Brian D. Mills,1* David Grayson,3 Andrew Woodall,4 Kathleen A. Grant,1,4
Christopher D. Kroenke,1,2,4 and Damien A. Fair1,2
1Department of Behavioral Neuroscience and 2Advanced Imaging Research Center, Oregon Health and Science University, Portland, Oregon 97239, 3Centerfor Neuroscience, University of California, Davis, California 95616, 4Division of Neuroscience, Oregon National Primate Research Center, Beaverton, Oregon97006, and 5Department of Biomedical Engineering, Tecnologico de Monterrey, Campus Monterrey, Nuevo Leon, Mexico 64849
Resting state functional connectivity MRI (rs-fcMRI) may provide a powerful and noninvasive “bridge” for comparing brain functionbetween patients and experimental animal models; however, the relationship between human and macaque rs-fcMRI remains poorlyunderstood. Here, using a novel surface deformation process for species comparisons in the same anatomical space (Van Essen, 2004,2005), we found high correspondence, but also unique hub topology, between human and macaque functional connectomes. The globalfunctional connectivity match between species was moderate to strong (r � 0.41) and increased when considering the top 15% strongestconnections (r � 0.54). Analysis of the match between functional connectivity and the underlying anatomical connectivity, derived froma previous retrograde tracer study done in macaques (Markov et al., 2012), showed impressive structure–function correspondence inboth the macaque and human. When examining the strongest structural connections, we found a 70 – 80% match between structural andfunctional connectivity matrices in both species. Finally, we compare species on two widely used metrics for studying hub topology:degree and betweenness centrality. The data showed topological agreement across the species, with nodes of the posterior cingulateshowing high degree and betweenness centrality. In contrast, nodes in medial frontal and parietal cortices were identified as having highdegree and betweenness in the human as opposed to the macaque. Our results provide: (1) a thorough examination and validation for asurface-based interspecies deformation process, (2) a strong theoretical foundation for making interspecies comparisons of rs-fcMRI,and (3) a unique look at topological distinctions between the species.
Key words: graph theory; macaque functional connectivity; network topology; resting state functional connectivity MRI; structurefunction relationships
IntroductionThe development of clinically relevant animal models of mentalillness will be crucial for the improvement and calibration ofvarious therapeutic interventions. However, measures of humanbrain circuitry and function are difficult to model in nonhu-
man species in part due to neuroanatomical, particularly cor-tical, development and expansion. The nonhuman primateprovides an excellent surrogate because key aspects of primateneuroanatomy have been extensively studied with sophisti-cated histological approaches. However, even with this bene-fit, it is not always clear that a given nonhuman primate modelis accurately reflecting the same human condition for which itwas designed. Ultimately, the translational potential of non-human primate models to examine human brain illness willbenefit greatly from “bridging” measurements of brain func-tion—measurements that can be obtained and compared di-rectly between species.
One potential “bridge” measurement of brain function is rest-ing state functional connectivity MRI (rs-fcMRI), a noninvasivetool that measures correlated spontaneous brain activity (Biswalet al., 1995). As opposed to task-based fMRI, which is difficult toadminister in many clinical populations and nonhuman pri-mates, rs-fcMRI is task free. This makes rs-fcMRI an attractive
Received Oct. 2, 2013; revised Feb. 21, 2014; accepted March 12, 2014.Author contributions: O.M.-D. and D.A.F. designed research; O.M.-D., B.M., D.G., and A.W. performed research;
K.A.G., C.D.K., and D.A.F. contributed unpublished reagents/analytic tools; O.M.-D. and B.M. analyzed data; B.M. andD.A.F. wrote the paper.
This work was supported by the National Institutes of Health (Grants R01 MH096773 and K99/R00 MH091238 toD.A.F.), McDonnell Foundation Collaborative Activity Award (220020256 to D.A.F., Site PI), Oregon Clinical andTranslational Institute (D.A.F.), Programa de Profesores en el Extranjero (Tecnologico de Monterrey) Grants 11092,AA109431, and AA13510 (to O.D.).
The authors declare no competing financial interests.*O.M.-D. and B.D.M. are co-first authors.Correspondence should be addressed to Damien Fair, PA-C, PhD, Behavioral Neuroscience Department, Oregon
Health and Science University, 3181 SW Sam Jackson Park Road L470, Portland, Oregon 97239. E-mail:[email protected].
DOI:10.1523/JNEUROSCI.4229-13.2014Copyright © 2014 the authors 0270-6474/14/345552-12$15.00/0
5552 • The Journal of Neuroscience, April 16, 2014 • 34(16):5552–5563

measure for translational research and may potentially provide adirectly comparable tool for bridging the gap between humanand macaque research. Indeed, qualitatively, macaque functionalconnectivity shows biologically plausible networks with at leastpartial resemblance to that of the human (Van Essen, 2005;Vincent et al., 2007; Margulies et al., 2009; Moeller et al., 2009;Vincent et al., 2010; Hutchison et al., 2011; Mantini et al., 2013;Sallet et al., 2013; Grayson et al., 2014a).
Although the promise of this approach is evident, there are anumber of important considerations that need to be addressed.Namely, the strength and location of similarities and differencesin interspecies connectivity is still an open question. Performingthese comparisons in normative conditions is therefore essentialfor future studies examining functional connectivity in typicaland disease models. Here, we use a surface-based interspeciesregistration technique described by Van Essen et al. (2004, 2005).This registration procedure allowed for direct comparisons to bemade between species among several areal atlases (see Materialsand Methods). Having comparable atlases in each species allowsfor both a visual (qualitative) and computational (quantitative)comparison between them. First, a seed-based analysis was usedto make qualitative interspecies comparisons of rs-fcMRI net-works. Next, the interspecies correspondence of whole-brainconnectomes was assessed. Next, functional connectivity in themacaque and human was validated by comparing it with theunderlying anatomical connectivity measured by retrograde trac-ers, the current gold standard in the field (Markov et al., 2012).Finally, interspecies comparisons were made on two widely usedmetrics of brain topology, node strength and betweenness cen-trality. This work provides a strong theoretical foundation formaking interspecies comparisons of rs-fcMRI and provides aunique look at the differences in network “hub” topology be-tween the species.
Materials and MethodsHuman subjects and demographics. The human group consisted of 26healthy subjects (26 � 4 years, 15 females). All procedures were approvedby the Institutional Review Board at Oregon Health and Science Univer-sity. Participants were recruited through advertisements in the commu-nity, such as posted flyers, online ads, and the Oregon Health and ScienceUniversity’s clinical trials website. Potential participants were screenedon the phone for initial eligibility. Exclusion criteria included a history ofneurological trauma, a head injury with loss of consciousness, a medicalcondition that could affect cognition, or current substance abuse. Partic-ipants were also excluded for having a current depressive or manic epi-
sode, a history of psychosis, bipolar disorder,learning disability, ADHD, current substanceaddiction, or for taking long-acting psychoac-tive medications. Informed consent was ob-tained for all participants.
Participants had to have normal use of bothhands, be right-handed, and have normal orcorrected-to-normal vision and normal hear-ing. Participants were also excluded if they hadany contraindications to undergoing an MRIscan, such as pregnancy, metal in the body, or ahistory of claustrophobia. Eligible participantswere then scheduled for an initial visit. At thisvisit, participants completed two semistruc-tured clinical interviews, three modules fromthe Kiddie Schedule for Affective Disordersand Schizophrenia (Biederman et al., 1992)and one from the Schedule for Affective Disor-ders and Schizophrenia (Endicott and Spitzer,1978) and the Structured Clinical Interview forDSM Disorders (First et al., 2012). Participants
were excluded if those interviews revealed any of the psychiatric exclu-sion criteria outlined in the preceding paragraph.
Participants also completed an intelligence test (Wechsler AbbreviatedScale of Intelligence [WASI]; Wechsler, 1999) and an achievement test(Wide Range Achievement Test [WRAT-4]; Wilkinson and Robertson,2006). These measures were used to assess IQ and to identify learningdisabilities. Participants were excluded if they had an estimated full-scaleIQ �85 or a suspected learning disability, as indicated by a difference of�1.5 SDs between cognitive functioning and achievement scores (asobtained in WASI and WRAT).
At their MRI visit, participants were screened for substance abuse witha urine toxicology screen administered at the beginning of the visit. Thetoxicology screen included tetrahydrocanabinol (THC), cocaine, opi-oids, amphetamine, and methamphetamine. Participants were excludedfrom completing the MRI scan if they tested positive for cocaine, opioids,amphetamines, or methamphetamines, but not if they tested positive forTHC.
Human MRI acquisition. All MRI scans were performed on a Siemens3T TIM-TRIO system. Structural images were obtained using a sagittalmagnetization-prepared rapid gradient echo (MP-RAGE) 3D T1-weighted sequence (TR � 9.7 ms, TE � 4 ms, flip angle � 12°, TI � 300ms, voxel size � 1.25 � 1 � 1 mm, slices � 128). Functional images wereobtained using a gradient-echo, echoplanar imaging (EPI) sequence sen-sitive to blood oxygen level-dependent (BOLD) contrast (TR � 2000 ms;TE � 30 ms; FOV � 240 mm 3; flip angle � 90°). Full brain coverage wasobtained with 33 contiguous, interleaved, 3.8 mm axial slices acquiredparallel to the plane transecting the anterior and posterior commissure.Steady-state magnetization was assumed after 4 frames (�8 s).
For the resting-state fMRI, participants completed either 2 scans con-sisting of 150 acquisitions (5 participants) or 1 scan of 600 acquisitions(22 participants). A longer scan was introduced to insure that sufficientvolumes would be retained for data analysis after removal of volumesidentified as having excessive movement.
Macaque subjects. The macaque group consisted of 11 male rhesusmonkeys (Macaca mulatta; age 5 � 0.4 years), which were chosen to haveno common parents or grandparents, from the pedigreed Oregon Na-tional Primate Research Center breeding colony. For �6 months beforeimaging, each monkey was individually housed in a stainless steel cagemeasuring 1.6 � 0.8 � 0.8 m (Allentown Caging) in a vivarium with 12 hlight/dark cycle (with lights on at 7:00 A.M.) that was maintained at 21 �1°C and 30 –50% humidity. Each animal had visual, auditory, and olfac-tory access to other monkeys in the vivarium and limited physical accessto a neighboring monkey. The monkeys were fed a diet of fresh fruit and1 g of banana-flavored pellets in quantities sufficient to maintain a pos-itive caloric intake.
All animal procedures were conducted in accordance with the Guide-lines of the Committee on the Care and Use of Laboratory Animal Resources(National Health Council, Department of Health, Education, and Wel-
Figure 1. a, Functional connectivity matrix using the Markov atlas in the group of human subjects. b, Anatomical connectivitymatrix derived from a recent retrograde tracer study (Markov et al., 2012). For ease of visual comparison, we rearranged the ROIorder for both matrices by community assignment. That is, community detection was run on the anatomical matrix using a methodby Bullmore and Sporns (2009). Visually, one can see similarities in the functional and structural matrices. The family of ROC curvesand regression analyses outlined in the Materials and Methods quantifies this relationship.
Miranda-Dominguez, Mills et al. • Bridging the Gap between the Human and Macaque Connectome J. Neurosci., April 16, 2014 • 34(16):5552–5563 • 5553

fare, ISBN 0-309-05377-3, revised 1996). Before their implementation,procedures were reviewed by the Institutional Animal Care and UseCommittee of the Oregon National Primate Research Center and were incompliance with all local, state, and national regulations pertaining to thehumane use of animal subjects.
Macaque MRI acquisition. Imaging was performed during a single ses-sion for each animal subject on a 3T Siemens Tim Trio scanner with a15-channel knee coil adapted for monkey head scanning. Subjects weresedated with an initial dose of ketamine (5 mg/kg), intubated, and main-tained with �1% isoflurane anesthesia for the duration of MRI proce-dures. Physiological monitoring throughout anesthesia included heartrate, respiration, and peripheral oxygen saturation. Data acquisition in-cluded four high-resolution T2-weighted structural images (TR � 3200ms, TE � 497 ms; 0.5 mm 2 in plane resolution, 1 mm slice thickness, 56slices, FOV � 128�128 mm), which were averaged to improve thesignal-to-noise ratio. A functional MRI scan lasting 30 min was thenbegun exactly 45 min after the time of ketamine administration (delayingthe beginning of the acquisition as necessary to maintain the time fromketamine induction across all animals), using a gradient echo EPI se-quence sensitive to BOLD contrast (TR � 2070 ms, TE � 25 ms, FA �90°, 1.5 mm 3 voxels, 32 slices with interleaved acquisition, FOV � 96 �96 mm). A field map scan was acquired (TR � 450 ms, TE � 5.19 ms/7.65ms, FA � 60°, 1.25 � 1.25 � 2 mm 3 voxels, 40 slices, FOV � 120 � 120mm) to correct for image distortion.
MRI general preprocessing. Human and macaque preprocessing werelargely similar, with a few exceptions. Standard preprocessing steps in-cluded slice-timing correction, correction for odd versus even slice in-tensity differences attributable to interleaved acquisition without gaps,rigid-body correction for head motion, and rigid-body coregistration ofthe fMRI volumes with the high-resolution T2-weighted structural im-age (T1-weighted image used in humans). Intensity normalization wasapplied to each run to a whole-brain mode value gradient of 1000. Alldata were also transformed using 12-paramater affine registration to
conform to a T2-weighted (or T1-weighted) atlas image. In the ma-caques, this atlas image was an average of 112 monkeys (http://brainmap.wisc.edu/monkey.html) in the widely used F99 space. In the humans,T1-weighted images were registered to the Talairach coordinate system.Atlas registration involved aligning each subject’s T1-weighted image toa custom atlas-transformed (Lancaster et al., 1995) target T1-weightedtemplate (711–2B) using a series of affine transforms (Michelon et al.,2003; Fox et al., 2005). The registration parameters obtained from eachstep allowed raw fMRI images to be transformed into atlas space, com-bining motion correction, field map unwarping (for macaques), andatlas transformation in one interpolation step.
Functional connectivity preprocessing. Functional connectivity prepro-cessing was largely identical for both groups. Several steps were also takento prepare the data for connectivity analyses (Fox et al., 2005). Thesesteps included spatial smoothing (6 mm full width at half maximumsmoothing for the human group and 3 mm full width at half maximumfor the macaque), regression of 24 motion parameters obtained by rigidbody head motion correction (Satterthwaite et al., 2013; Yan et al., 2013;Power et al., 2014), regression of nuisance signals (ventricular, whitematter, and whole-brain signal) and their first order derivatives, andtemporal band-pass filtering (0.009 Hz � f � 0.08 Hz). For macaques,ventricular and white matter masks were based on their correspondingregions in the INIA19 atlas (Rohlfing et al., 2012); human masks wereapplied as per Fox et al. (2005, 2009). Analyses were conducted with andwithout the regression of the global signal (i.e., whole-brain regression).As per Hallquist et al. (2013), the frequencies of nuisance regressors andfMRI data matched before nuisance regression, which was conductedbefore band-pass filtering. In addition, frame-by-frame spatial devia-tions of the acquisition time series were assessed using the temporalderivative of the time courses (i.e., frame displacement [FD]; Fair et al.,2012; Power et al., 2012). All analyses were conducted after the removalof frames with displacement FD � 0.2 mm.
Figure 2. Qualitative interspecies comparisons of motor connectivity. Motor cortex resting state networks in the human and the macaque. The red regions with arrows pointing to them are theright motor cortex seed region. Resting state time series in this seed region were correlated with time series in each remaining ROI. Correlation coefficients between this seed region and each otherROI are indicated by the color scale. Macaque connectivity is visualized on the human brain for comparison.
5554 • J. Neurosci., April 16, 2014 • 34(16):5552–5563 Miranda-Dominguez, Mills et al. • Bridging the Gap between the Human and Macaque Connectome

Human-macaque registration. Interspecies comparisons were made bysurface-based atlas registration, which uses a spherical, landmark-basedregistration algorithm (Van Essen, 2004, 2005; Van Essen and Dierker,2007). Landmarks for registration included a standard set of regions thatare likely to be homologous across species, including visual areas V1, V2,MT, and frontal eye fields; primary auditory cortex; and olfactory, gus-tatory, somatosensory, and primary motor cortex (Astafiev et al., 2003;Van Essen, 2004). Differences in overall cortical shape are minimized bymapping each cortical surface to a standard configuration (i.e., a sphere),and then each sphere is registered to one another constrained by this setof homologous landmarks. Deformation from macaque to human cortexresults in a large, nonuniform expansion of parietal, temporal, and fron-tal cortex and much less expansion in presumably conserved regionsbetween species (i.e., V1, motor cortex, etc.). Landmark-based registra-tion provides a powerful method for analyzing structural and functionalorganization between humans and macaques (Denys et al., 2004; Orbanet al., 2004; Van Essen, 2005; Van Essen and Dierker, 2007). Each corticalparcellation was deformed from the macaque to the human PALS atlasusing the deformation mapping provided by these procedures. Arealregion of interest (ROI) deformations were done as part of the freelyavailable CARET software package (http://brainvis.wustl.edu/wiki/index.php/Main_Page).
Four predefined cortical parcellations were used based on a set of brainareas delineated in previous work. These atlases included the FVE (Fel-leman and Van Essen, 1991), LVE (Lewis and Van Essen, 2000), Paxinos(Paxinos et al., 1999), and the Markov atlas (Markov et al., 2012). SurfaceROIs for each area were converted to volume using caret software (3 mmthickness in humans and 1.5 mm thickness in macaques).
Time series were computed for cortical ROIs in both species by aver-aging the signal intensity across all voxels within a given ROI at each timepoint. Cross-correlations were first computed between all cortical ROIpairs, yielding a correlation matrix of size N � N (where N is the number
of regions for a given parcellation) for each subject and for each parcel-lation. To combine correlation coefficients (r) across subjects, theSchmidt–Hunter method for meta-analyses of r values (i.e., averaged rvalues) was used because it is more conservative than comparable meth-ods (Field, 2001; Salvador et al., 2005; Dosenbach et al., 2007; Fair et al.,2007; Margulies et al., 2007). In the present study, only positive func-tional connections were considered.
Qualitative and quantitative human macaque comparisons. To comparefunctional connectivity patterns between species, qualitative compari-sons were made in regions with classically well defined connectivity pat-terns. The motor system was examined by selecting a seed region in theright primary motor cortex. The default mode network was also exam-ined by selecting a seed region in the ventral anterior cingulate cortex.Resting state connectivity time series in each of these seed regions werecorrelated with time series in all other regions. These data for each specieswas visualized on the human brain for comparison, with identicalthresholds based on connection density. This was chosen instead ofstrict r value threshold due to differences in the correlation distribu-tions in the species. All analyses were performed with and withoutwhole-brain regression.
A number of quantitative interspecies comparisons were also made.First, a global comparison of the similarity between human and ma-caque functional connectivity was made using simple linear regres-sion. Scatter plots and regression lines show the relationship betweenconnectivity matrices, where corresponding histograms represent thedistribution of correlations in both humans and macaques after Fish-er’s r to z transformation.
Next, we assessed the correspondence between functional connectivityand the underlying structural connectivity derived from a recent retro-grade tracer study done in macaques (Markov et al., 2012). This ap-proach compares human and macaque functional connectivity with themacaque anatomical connectivity matrix (for an example, see Fig. 1).
Figure 3. Qualitative interspecies comparisons of default mode connectivity. Functional connectivity is shown between a right anterior node of the default network, area 10 (shown in red), andthe rest of the cortex in the human and the macaque. Correlation coefficients between the seed region and each other ROI are indicated by the color scale. Macaque connectivity is visualized on thehuman brain for comparison.
Miranda-Dominguez, Mills et al. • Bridging the Gap between the Human and Macaque Connectome J. Neurosci., April 16, 2014 • 34(16):5552–5563 • 5555
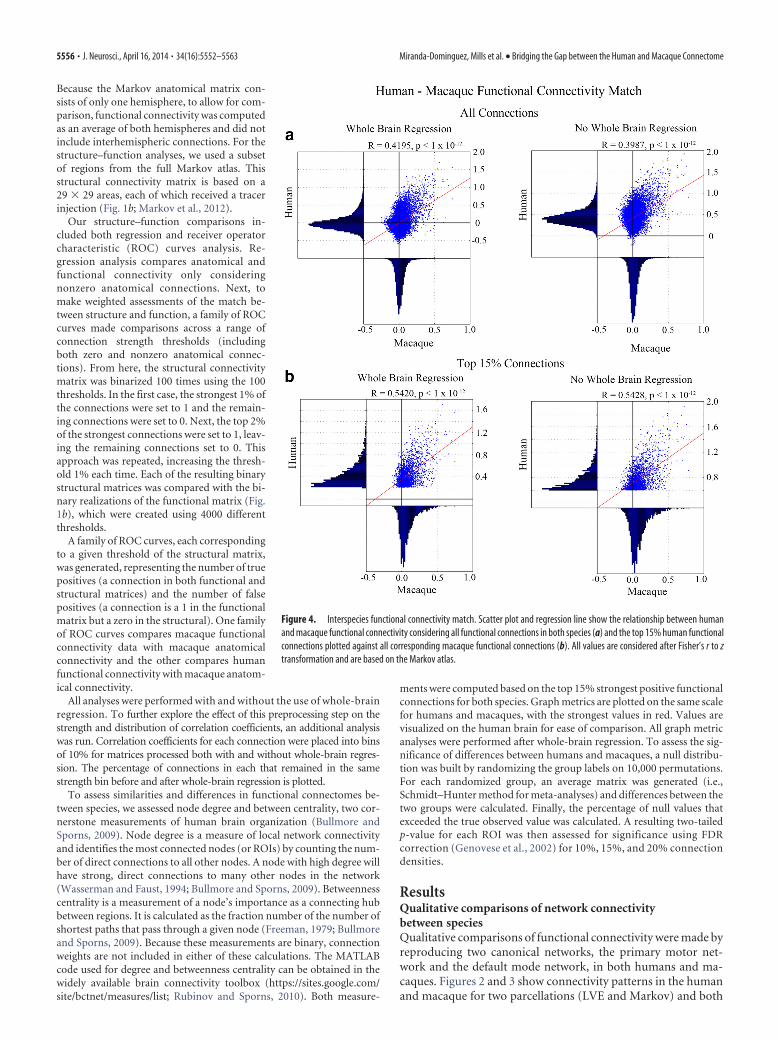
Because the Markov anatomical matrix con-sists of only one hemisphere, to allow for com-parison, functional connectivity was computedas an average of both hemispheres and did notinclude interhemispheric connections. For thestructure–function analyses, we used a subsetof regions from the full Markov atlas. Thisstructural connectivity matrix is based on a29 � 29 areas, each of which received a tracerinjection (Fig. 1b; Markov et al., 2012).
Our structure–function comparisons in-cluded both regression and receiver operatorcharacteristic (ROC) curves analysis. Re-gression analysis compares anatomical andfunctional connectivity only consideringnonzero anatomical connections. Next, tomake weighted assessments of the match be-tween structure and function, a family of ROCcurves made comparisons across a range ofconnection strength thresholds (includingboth zero and nonzero anatomical connec-tions). From here, the structural connectivitymatrix was binarized 100 times using the 100thresholds. In the first case, the strongest 1% ofthe connections were set to 1 and the remain-ing connections were set to 0. Next, the top 2%of the strongest connections were set to 1, leav-ing the remaining connections set to 0. Thisapproach was repeated, increasing the thresh-old 1% each time. Each of the resulting binarystructural matrices was compared with the bi-nary realizations of the functional matrix (Fig.1b), which were created using 4000 differentthresholds.
A family of ROC curves, each correspondingto a given threshold of the structural matrix,was generated, representing the number of truepositives (a connection in both functional andstructural matrices) and the number of falsepositives (a connection is a 1 in the functionalmatrix but a zero in the structural). One familyof ROC curves compares macaque functionalconnectivity data with macaque anatomicalconnectivity and the other compares humanfunctional connectivity with macaque anatom-ical connectivity.
All analyses were performed with and without the use of whole-brainregression. To further explore the effect of this preprocessing step on thestrength and distribution of correlation coefficients, an additional analysiswas run. Correlation coefficients for each connection were placed into binsof 10% for matrices processed both with and without whole-brain regres-sion. The percentage of connections in each that remained in the samestrength bin before and after whole-brain regression is plotted.
To assess similarities and differences in functional connectomes be-tween species, we assessed node degree and between centrality, two cor-nerstone measurements of human brain organization (Bullmore andSporns, 2009). Node degree is a measure of local network connectivityand identifies the most connected nodes (or ROIs) by counting the num-ber of direct connections to all other nodes. A node with high degree willhave strong, direct connections to many other nodes in the network(Wasserman and Faust, 1994; Bullmore and Sporns, 2009). Betweennesscentrality is a measurement of a node’s importance as a connecting hubbetween regions. It is calculated as the fraction number of the number ofshortest paths that pass through a given node (Freeman, 1979; Bullmoreand Sporns, 2009). Because these measurements are binary, connectionweights are not included in either of these calculations. The MATLABcode used for degree and betweenness centrality can be obtained in thewidely available brain connectivity toolbox (https://sites.google.com/site/bctnet/measures/list; Rubinov and Sporns, 2010). Both measure-
ments were computed based on the top 15% strongest positive functionalconnections for both species. Graph metrics are plotted on the same scalefor humans and macaques, with the strongest values in red. Values arevisualized on the human brain for ease of comparison. All graph metricanalyses were performed after whole-brain regression. To assess the sig-nificance of differences between humans and macaques, a null distribu-tion was built by randomizing the group labels on 10,000 permutations.For each randomized group, an average matrix was generated (i.e.,Schmidt–Hunter method for meta-analyses) and differences between thetwo groups were calculated. Finally, the percentage of null values thatexceeded the true observed value was calculated. A resulting two-tailedp-value for each ROI was then assessed for significance using FDRcorrection (Genovese et al., 2002) for 10%, 15%, and 20% connectiondensities.
ResultsQualitative comparisons of network connectivitybetween speciesQualitative comparisons of functional connectivity were made byreproducing two canonical networks, the primary motor net-work and the default mode network, in both humans and ma-caques. Figures 2 and 3 show connectivity patterns in the humanand macaque for two parcellations (LVE and Markov) and both
Figure 4. Interspecies functional connectivity match. Scatter plot and regression line show the relationship between humanand macaque functional connectivity considering all functional connections in both species (a) and the top 15% human functionalconnections plotted against all corresponding macaque functional connections (b). All values are considered after Fisher’s r to ztransformation and are based on the Markov atlas.
5556 • J. Neurosci., April 16, 2014 • 34(16):5552–5563 Miranda-Dominguez, Mills et al. • Bridging the Gap between the Human and Macaque Connectome
the macaque and human data are represented on a human surfaceatlas for comparability. Data are shown after whole-brain regres-sion. Qualitatively, there appear to be both highly similar andunique representations across the species. For example, motornetwork connectivity is comparable across both species and forboth parcellations. In this case, the degree of connectivity appearsto be significantly weaker in the macaque, which may be due toanesthesia. In the default system, the findings were a bit moremixed and depended in part on the parcellation used. Here, usingthe LVE parcellation, we see a default system that resembles whathas been identified in humans. However, connectivity does notextend to the entirety of the default system when using theMarkov parcellations. In contrast, human connectivity in the de-fault network is robust using each parcellation scheme.
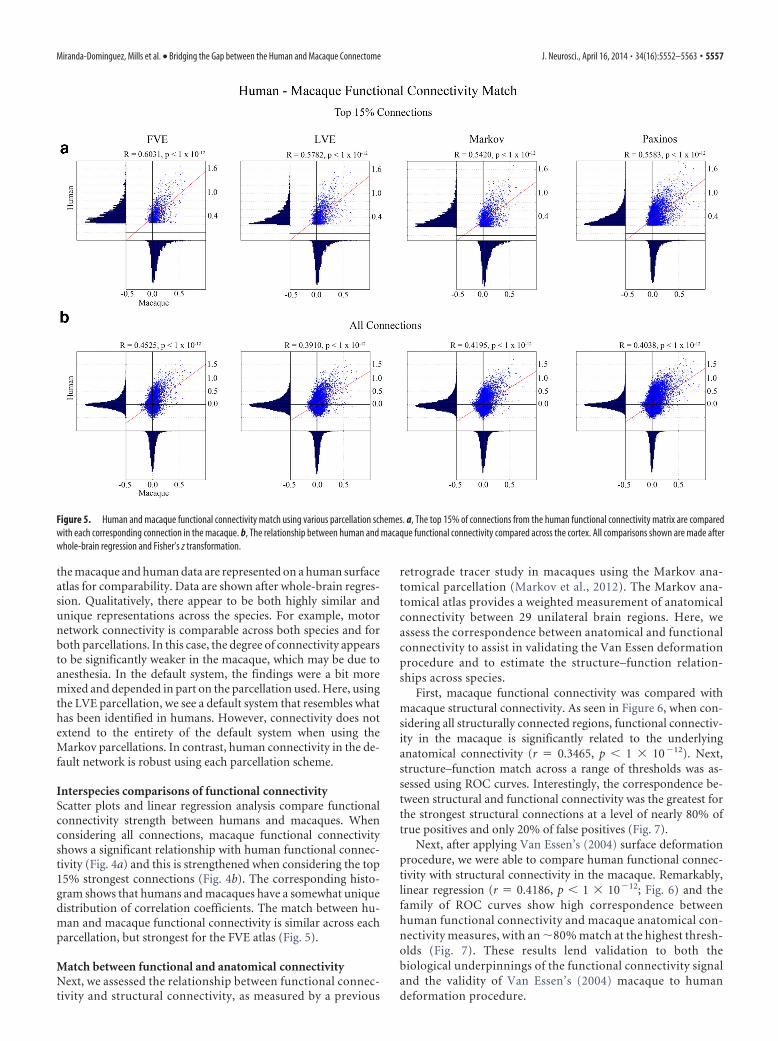
Interspecies comparisons of functional connectivityScatter plots and linear regression analysis compare functionalconnectivity strength between humans and macaques. Whenconsidering all connections, macaque functional connectivityshows a significant relationship with human functional connec-tivity (Fig. 4a) and this is strengthened when considering the top15% strongest connections (Fig. 4b). The corresponding histo-gram shows that humans and macaques have a somewhat uniquedistribution of correlation coefficients. The match between hu-man and macaque functional connectivity is similar across eachparcellation, but strongest for the FVE atlas (Fig. 5).
Match between functional and anatomical connectivityNext, we assessed the relationship between functional connec-tivity and structural connectivity, as measured by a previous
retrograde tracer study in macaques using the Markov ana-tomical parcellation (Markov et al., 2012). The Markov ana-tomical atlas provides a weighted measurement of anatomicalconnectivity between 29 unilateral brain regions. Here, weassess the correspondence between anatomical and functionalconnectivity to assist in validating the Van Essen deformationprocedure and to estimate the structure–function relation-ships across species.
First, macaque functional connectivity was compared withmacaque structural connectivity. As seen in Figure 6, when con-sidering all structurally connected regions, functional connectiv-ity in the macaque is significantly related to the underlyinganatomical connectivity (r � 0.3465, p � 1 � 10�12). Next,structure–function match across a range of thresholds was as-sessed using ROC curves. Interestingly, the correspondence be-tween structural and functional connectivity was the greatest forthe strongest structural connections at a level of nearly 80% oftrue positives and only 20% of false positives (Fig. 7).
Next, after applying Van Essen’s (2004) surface deformationprocedure, we were able to compare human functional connec-tivity with structural connectivity in the macaque. Remarkably,linear regression (r � 0.4186, p � 1 � 10�12; Fig. 6) and thefamily of ROC curves show high correspondence betweenhuman functional connectivity and macaque anatomical con-nectivity measures, with an �80% match at the highest thresh-olds (Fig. 7). These results lend validation to both thebiological underpinnings of the functional connectivity signaland the validity of Van Essen’s (2004) macaque to humandeformation procedure.
Figure 5. Human and macaque functional connectivity match using various parcellation schemes. a, The top 15% of connections from the human functional connectivity matrix are comparedwith each corresponding connection in the macaque. b, The relationship between human and macaque functional connectivity compared across the cortex. All comparisons shown are made afterwhole-brain regression and Fisher’s z transformation.
Miranda-Dominguez, Mills et al. • Bridging the Gap between the Human and Macaque Connectome J. Neurosci., April 16, 2014 • 34(16):5552–5563 • 5557

Effect of whole-brain regressionImportantly, all analyses, regressions, and ROC curves are pro-duced with and without whole-brain regression. Overall, usingthis preprocessing step improved many of the relationships ex-amined. Specifically, functional connectivity match between spe-cies was significantly stronger after whole-brain regressionregardless of the parcellation scheme (p � 0.001) when consid-ering all functional connections. When considering the top 15%of connections, only the Paxinos atlas showed a significant im-provement (p � 0.005). For the other atlases at this threshold,although structure–function correlation coefficients were stron-ger after whole-brain regression for both humans and macaques,the improvement was small and not significant. Further analysisshowed that changes in the identity of the strongest functionalconnections after whole-brain regression were minimal. That is,the top 10% strongest correlations before its use remainedbinned as a top 10% strongest connection after using whole-brain regression �80% of the time (Fig. 8). A similar phenome-non was observed for the very weakest connections.
Node degree and betweenness centrality comparisonNode degree measures the importance of a given node to theoverall network by assessing the number of regions to which agiven ROI is connected. In both human and macaque, node de-gree is high in the posterior cingulate and surrounding areas. Inhumans, the frontal cortex (includingarea 10) shows high node degree. Similarfindings are identified in the temporalcortices. When considering all connec-tions, visual comparison shows that hu-mans have a more distributed connectiontopology with regard to node degree,whereas, in macaques, connections arehighly concentrated in the posterior, mid-dle, and dorsal cingulate. These findingsare not dependent on connection density(Fig. 9). Although the degree distributionof both human and macaque appears scalefree in nature (as was described previouslyin humans; van den Heuvel et al., 2008),this phenomenon appears accentuated inthe macaque (Fig. 10d).
Betweenness centrality is computed asthe fraction of all shortest paths in a net-work that pass through a given node.Nodes with high values participate in alarge number of shortest paths. Between-ness centrality can be conceptualized asthe importance of an ROI as a connectinghub between regions. Both humans andmacaques have the strongest betweeen-ness centrality in the posterior cingulate(and surrounding regions). Human andmacaque betweenness centrality is simi-lar, although humans more strongly re-cruit the frontoparietal attention system(Fig. 10).
DiscussionThe present study compared rs-fcMRImeasurements between humans and macaques on a number oflevels. Using the Van Essen et al. (2004) surface-based defor-mation algorithm, macaque and human brains were examined
in the same atlas space, allowing for a direct comparison be-tween the species. Our comparisons revealed high correspon-dence in functional connectivity between the species andmarked similarity with regard to structure–function relation-
Figure 6. Match between functional and anatomical connectivity. Linear regression shows therelationship between functional and structural connectivity in regions that are anatomically con-nected. All values are Fisher’s z transformed; functional connectivity values were then log transformedwhere applicable. Comparisons are performed both with and without whole-brain regression (WBR).
Figure 7. Family of ROC curves showing the match between human and macaque functional connectivity to the anatomicalconnectivity measured in the macaque. Each line represents an individual ROC curve for a given threshold. The diagonal linerepresents what would be expected by chance. The greater the area under the curve, the greater the proportion of matchesbetween structural and functional matrices. Comparisons are performed both with and without whole-brain regression (WBR).The structure–function relationship is nonrandom, highest for the strongest structural connections, and slightly improved withwhole-brain regression.
5558 • J. Neurosci., April 16, 2014 • 34(16):5552–5563 Miranda-Dominguez, Mills et al. • Bridging the Gap between the Human and Macaque Connectome

ships. We also identified important similarities and differ-ences with regard to large-scale brain topology. The work alsohighlights some important caveats with regard to processingand atlas selection.
Comparison of human and macaque functional connectivityQualitatively, seed-based interspecies connectivity comparisonsare dependent on both the region selection and the atlas used. Asreported previously (Vincent et al., 2007; Hutchison et al., 2011),similar motor network connectivity was found in both humansand macaques. A comparison of default network connectivitybetween species also showed some similarities when placing aseed in an anterior node of the default system (region 10). How-ever, this finding was partly dependent on the chosen atlas, high-lighting the sensitivity of default identification to the parcellationscheme.
Sensitivity of findings to region selection is has been discussedpreviously (for a brief discussion, see Hagmann et al., 2012). Thedifferences here could be influenced by several factors. As can beobserved in Figure 4, the distributions of connectivity are uniqueacross both species, with positive r values in the macaque gener-ally weaker than those in the human. This phenomenon is poten-tially secondary to the sedation state in the macaque versus thehuman and thus could lead to decreased sensitivity to the detec-tion of this system. Similarly, it is also likely that some parcella-tions more accurately reflect the underlying areal demarcationsfor a given system. Along with increased noise in the macaque(potentially due to anesthesia or other acquisition or processingconsiderations), skewed areal boundaries for a given area wouldadd to a reduction in signal-to-noise in the macaque and poten-tially result in weaker network visualization. In the human, inwhom the connectivity signal is likely stronger due to the awakecondition, the noise induced by skewed areal boundaries poten-
Figure 8. Effect of whole-brain regression on strength and distribution of correlation coefficientsfor each human participant. Correlation coefficients strengths were rank ordered and placed into 10%bins. The number of connections that remained in the same bin before and after whole-brain regres-sionwerequantifiedandplottedatthetop.Approximately80%ofconnectionsremaininthetop10%(1–10% bin) after whole-brain regression. Importantly, similar correspondence is identified for thebottom bins.
Figure 9. Interspecies comparison of node degree. a, b, Node degree, or the number of functional connections each ROI has to all other regions, is visualized in both species. For all analyses, both human andmacaquematriceswerethresholdedtoincludeonlythetop15%ofthestrongestfunctionalconnections.Macaqueconnectivity isvisualizedonthehumanbrainandscalesareidenticalbetweenspecies,allowingfor direct comparison. Statistical comparison of human and macaque node degree are based on 10,000 permutations for 15% (c), 10% (e), and 20% (f ) connection density. Blue colors represent regions wheremacaques have higher node degree and red colors represent areas where humans have higher node degree than macaques ( p � 0.05, corrected). Notice that high degree nodes are clustered in the posteriorcingulate in the macaque, whereas in humans, connections are spread to other networks such as the frontoparietal system. d, Nodes have been reordered according to the number of connections to allow forcomparison of degree distributions. Highly connected hubs in the macaques are clustered in only a few select regions that also have a greater number of max connections than humans (i.e., more “scale free”).Conversely, humans show a more distributed pattern in which highly connected hubs are spread throughout the cortex (i.e., less “scale free”).
Miranda-Dominguez, Mills et al. • Bridging the Gap between the Human and Macaque Connectome J. Neurosci., April 16, 2014 • 34(16):5552–5563 • 5559

tially does not affect network patterns to the same extent. We alsonote the possibility that network differences between speciescould also arise from anesthesia affecting the overall networkstructure in the macaque (beyond simply reducing connectionstrength). A full characterization of the effects of anesthesia onnetwork topology is an important subject for future work.
Our quantitative interspecies comparison showed there was amodest relationship between global human and macaque con-nectivity across the cortex. However, it appears that the distribu-tions of connectivity values across the species are unique. Wenote that the extent of overlap between areal boundaries in thehuman and macaque is currently unknown and some of discrep-ancies may be influenced by such differences. Nonetheless, whenconsidering only the strongest comparisons, the match betweenhuman and macaque connectivity dramatically improves. There-fore, this initial moderate relationship appears to correspond to amismatch of low-probability connections and highlights the cor-respondence of highly probable functional connections betweenspecies.
Relationship between functional and anatomical connectivityWe found a moderate relationship between the anatomical con-nectivity matrix (Markov et al., 2012) and the correspondingfunctional connectivity in both species, which appeared to be
dependent on the strength of the anatomical connections. A fam-ily of ROC curves visualized and confirmed that the strongestunderlying anatomical connections show the most correspon-dence with the functional connectivity. Illustrating this point, atmost stringent thresholds, there is a �80% match between struc-tural and functional connectivity with only an �20% false-positive rate (Fig. 7). When considering all connections, thematch is reduced, but still well above the level predicted purely bychance. Importantly, this match is apparent when comparingboth human and macaque functional connectivity with the truemacaque anatomical connectivity. In fact, the correspondencebetween human functional connectivity and anatomical connec-tivity was found to be slightly better than for the macaque func-tional connectivity. This phenomenon may again be attributed tothe anesthesia in the macaques.
Although it has been shown that functional connectivity in-deed reflects underlying structural connectivity, to date, studieshave been limited. Such studies have used either indirect mea-sures of anatomical connectivity (i.e., diffusion tensor imaging),only a limited number of subregions, or a lack of a global, quan-titative comparison (Vincent et al., 2007; Hagmann et al., 2008;Greicius et al., 2009; van den Heuvel et al., 2009; Mars et al., 2011;Adachi et al., 2012; Shen et al., 2012). Our present study usesfindings from a retrograde viral tracers study and shows that,
Figure 10. Interspecies comparison of betweeness centrality. a, b, Betweenness centrality, or the fraction of shortest paths that pass through a given ROI, is visualized in humans and macaques. Both humanand macaque matrices were thresholded to include only the top 15% of the strongest functional connections. Macaque connectivity is visualized on the human brain and scales are identical between species,allowing for direct comparison. Statistical comparison of group differences in betweenness centrality based on 10,000 permutations for the 15% (c), 10% (d), and 20% (e) strongest functional connections. Bluecolorsrepresentareaswheremacaqueshavehigherbetweennesscentralityandredcolorsrepresentareaswherehumanshavestrongercentralitythanmacaques( p�0.05,corrected).Noticethathumanshavestronger centrality in frontoparietal regions, whereas macaque hubs are again centered preferentially in and around the posterior cingulate.
5560 • J. Neurosci., April 16, 2014 • 34(16):5552–5563 Miranda-Dominguez, Mills et al. • Bridging the Gap between the Human and Macaque Connectome
across the cortex, axonal wiring indeed contributes to correlatedfunctional activation.
The structure–function relationship was not perfect. It isknown that functional connectivity is not simply driven bymonosynaptic connections, as reflected in the tracer matrix, butalso polysynaptic connections (Vincent et al., 2007; Honey et al.,2009; Iyer et al., 2013), which likely reduce the correspondence.Furthermore, unlike structural connectivity, which is relativelystable from day to day, functional connectivity shows less stabilityand can be more easily reconfigured (Bullmore and Sporns,2009). Overall, the use of anatomical connectivity and the im-provement in cross-species comparisons lend a basic validationfor a structural neurobiological underpinning of the rs-fcMRIsignal.
Whole-brain regression improves interspecies functionalconnectivity matchThere is considerable disagreement on the appropriateness ofwhole-brain regression for resting-state processing (Fox et al.,2009; Murphy et al., 2009; Weissenbacher et al., 2009; Gotts et al.,2013).We found that interspecies correspondence in global func-tional connectivity was improved after regressing the global sig-nal. However, this effect was parcellation and thresholddependent. The minor improvements seen here, an observationconsistent with other reports (Fox et al., 2009; Keller et al., 2013),likely reflect the reduction in shared variance among regions dueto noise and a true global signal (Scholvinck et al., 2010). Impor-tantly, the rank order of the strongest connections does notovertly change whether one does or does not apply global regres-sion (Fig. 8). However, investigators may wish to examine theirdata with and without whole-brain regression to determinewhether a result is dependent on the processing decision.
Interspecies comparison of node degree andbetweenness centralityLast, we compared species on two widely used graph metrics forcharacterizing human brain topology: node degree and between-ness centrality. Consistent with previous studies, we found thathumans showed high node degree and betweenness centrality inthe posterior cingulate (Achard et al., 2006; Buckner et al., 2008;Hagmann et al., 2008). This suggests that the posterior cingulateis particularly important for integrating information across awide range of modalities and is also an efficient route for passinginformation between systems.
Interestingly, the posterior cingulate shows the highest nodedegree and betweenness centrality in the macaque— even higherthan in the human. In humans, the posterior cingulate, whilefocal, is not the only node with relatively high node degree andbetweenness centrality. Rather, these nodes are distributed infrontal-parietal systems, the anterior insula, and medial frontalareas. The degree distribution is also unique between species (Fig.9d). In the macaque, top nodes have a greater number of func-tional connections than do those in humans. This suggests a morescale-free and perhaps more vulnerable network structure to tar-geted attack in the macaque. In stroke patients, selective damageto network hubs with high node degree is associated with severecognitive deficits, in which damage to areas with fewer functionalconnections results in less severe deficits (Power et al., 2013). Anetwork with more distributed hubs, such as observed in thehumans, may reflect a more dynamic and resilient network struc-ture (Grayson et al., 2014b). However, testing the robustness ofour findings with alternative methods of defining hub architec-ture (van den Heuvel and Sporns, 2011; Hagmann et al., 2012;
Power et al., 2013; Grayson et al., 2014b) or assessing “connector”and “provincial” hub architecture (van den Heuvel and Sporns,2011; Power et al., 2013) between species is an important avenuefor future work.
Resting state MRI as tool for translational medicineThe present work represents an important step toward validatingrs-fcMRI as a viable translational research tool to be used innonhuman primates. Here, a baseline for comparing species isestablished, describing what can be expected at both the networkand global connectivity level. Furthermore, it can be inferred thathumans and macaques share a great deal of functional and ana-tomical connectivity. This is particularly true when consideringthe strongest functional connections that have the largeststrength of overlap with underlying anatomy (up to �80% inboth species). Such robust findings validate the biological basisfor the rs-fcMRI signal and the surface-based human and ma-caque atlas deformation and registration algorithm (Van Essen,2005). Further, we explore measurements of network organiza-tion that highlight potential regions of overlap, but also diver-gence, between species. Such information will help investigatorstarget specific functional homologies between species and estab-lish a solid basis for using rs-fcMRI as a bridge between humanand macaque research.
ReferencesAchard S, Salvador R, Whitcher B, Suckling J, Bullmore E (2006) A resilient,
low-frequency, small-world human brain functional network with highlyconnected association cortical hubs. J Neurosci 26:63–72. CrossRefMedline
Adachi Y, Osada T, Sporns O, Watanabe T, Matsui T, Miyamoto K, MiyashitaY (2012) Functional connectivity between anatomically unconnectedareas is shaped by collective network-level effects in the macaque cortex.Cereb Cortex 22:1586 –1592. CrossRef Medline
Astafiev SV, Shulman GL, Stanley CM, Snyder AZ, Van Essen DC, Corbetta M(2003) Functional organization of human intraparietal and frontal cor-tex for attending, looking, and pointing. J Neurosci 23:4689 – 4699.Medline
Biederman J, Faraone SV, Keenan K, Benjamin J, Krifcher B, Moore C,Sprich-Buckminster S, Ugaglia K, Jellinek MS, Steingard R (1992) Fur-ther evidence for family-genetic risk factors in attention deficit hyperac-tivity disorder: patterns of comorbidity in probands and relatives inpsychiatrically and pediatrically referred samples. Arch Gen Psychiatry49:728 –738. CrossRef Medline
Biswal B, Yetkin FZ, Haughton VM, Hyde JS (1995) Functional connectiv-ity in the motor cortex of resting human brain using echo-planar MRI.Magn Reson Med 34:537–541. CrossRef Medline
Buckner RL, Andrews-Hanna JR, Schacter DL (2008) The brain’s defaultnetwork: anatomy, function, and relevance to disease. Ann N Y Acad Sci1124:1–38. CrossRef Medline
Bullmore E, Sporns O (2009) Complex brain networks: graph theoreticalanalysis of structural and functional systems. Nat Rev Neurosci 10:186 –198. CrossRef Medline
Denys K, Vanduffel W, Fize D, Nelissen K, Sawamura H, Georgieva S, VogelsR, Van Essen D, Orban GA (2004) Visual activation in prefrontal cortexis stronger in monkeys than in humans. J Cogn Neurosci 16:1505–1516.CrossRef Medline
Dosenbach NU, Fair DA, Miezin FM, Cohen AL, Wenger KK, Dosenbach RA,Fox MD, Snyder AZ, Vincent JL, Raichle ME, Schlaggar BL, Petersen SE(2007) Distinct brain networks for adaptive and stable task control inhumans. Proc Natl Acad Sci U S A 104:11073–11078. CrossRef Medline
Endicott J, Spitzer RL (1978) A diagnostic interview: the Schedule for Affec-tive Disorders and Schizophrenia. Arch Gen Psychiatry 35:837– 844.CrossRef Medline
Fair DA, Nigg JT, Iyer S, Bathula D, Mills KL, Dosenbach NU, Schlaggar BL,Mennes M, Gutman D, Bangaru S, Buitelaar JK, Dickstein DP, Di MartinoA, Kennedy DN, Kelly C, Luna B, Schweitzer JB, Velanova K, Wang YF,Mostofsky S, et al. (2012) Distinct neural signatures detected for ADHD
Miranda-Dominguez, Mills et al. • Bridging the Gap between the Human and Macaque Connectome J. Neurosci., April 16, 2014 • 34(16):5552–5563 • 5561
subtypes after controlling for micro-movements in resting state func-tional connectivity MRI data. Front Syst Neurosci 6:80. CrossRef Medline
Fair DA, Dosenbach NU, Church JA, Cohen AL, Brahmbhatt S, Miezin FM,Barch DM, Raichle ME, Petersen SE, Schlaggar BL (2007) Developmentof distinct control networks through segregation and integration. ProcNatl Acad Sci U S A 104:13507–13512. CrossRef Medline
Felleman DJ, Van Essen DC (1991) Distributed hierarchical processing inthe primate cerebral cortex. Cereb Cortex 1:1– 47. CrossRef Medline
Field AP (2001) Meta-analysis of correlation coefficients: a Monte Carlocomparison of fixed- and random-effects methods. Psychol Methods6:161–180. CrossRef Medline
First MB, Spitzer RL, Gibbon M, Williams JB (2012) Structured ClinicalInterview for DSM-IV Axis I Disorders (SCID-I), Clinician Version, Ad-ministration Booklet. Arlington, VA: American Psychiatric Publications.
Fox MD, Snyder AZ, Vincent JL, Corbetta M, Van Essen DC, Raichle ME(2005) The human brain is intrinsically organized into dynamic, anticor-related functional networks. Proc Natl Acad Sci U S A 102:9673–9678.CrossRef Medline
Fox MD, Zhang D, Snyder AZ, Raichle ME (2009) The global signal andobserved anticorrelated resting state brain networks. J Neurophysiol 101:3270 –3283. CrossRef Medline
Freeman LC (1979) Centrality in social networks conceptual clarification.Social Networks 1:215–239.
Genovese CR, Lazar NA, Nichols T (2002) Thresholding of statistical mapsin functional neuroimaging using the false discovery rate. Neuroimage15:870 – 878. CrossRef Medline
Gotts SJ, Saad ZS, Jo HJ, Wallace GL, Cox RW, Martin A (2013) The perils ofglobal signal regression for group comparisons: a case study of autismspectrum disorders. Front Hum Neurosci 7.
Grayson DS, Kroenke CD, Neuringer M, Fair DA (2014a) Dietary omega-3fatty acids modulate large-scale systems organization in the rhesus ma-caque brain. J Neurosci 34:2065–2074. CrossRef Medline
Grayson DS, Ray S, Carpenter S, Iyer S, Dias TG, Stevens C, Nigg JT, Fair DA(2014b) Structural and functional rich club organization of the brain inchildren and adults. PLoS One 9:e88297. CrossRef Medline
Greicius MD, Supekar K, Menon V, Dougherty RF (2009) Resting-statefunctional connectivity reflects structural connectivity in the defaultmode network. Cereb Cortex 19:72–78. CrossRef Medline
Hagmann P, Cammoun L, Gigandet X, Meuli R, Honey CJ, Wedeen VJ,Sporns O (2008) Mapping the structural core of human cerebral cortex.PLoS Biol 6:e159. CrossRef Medline
Hagmann P, Grant PE, Fair DA (2012) MR connectomics: a conceptualframework for studying the developing brain. Front Syst Neurosci 6:43.CrossRef Medline
Hallquist MN, Hwang K, Luna B (2013) The nuisance of nuisance regres-sion: Spectral misspecification in a common approach to resting-statefMRI preprocessing reintroduces noise and obscures functional connec-tivity. Neuroimage 82C:208 –225. CrossRef Medline
Honey CJ, Sporns O, Cammoun L, Gigandet X, Thiran JP, Meuli R, HagmannP (2009) Predicting human resting-state functional connectivity fromstructural connectivity. Proc Natl Acad Sci U S A 106:2035–2040.CrossRef Medline
Hutchison RM, Leung LS, Mirsattari SM, Gati JS, Menon RS, Everling S(2011) Resting-state networks in the macaque at 7 T. Neuroimage 56:1546 –1555. CrossRef Medline
Iyer SP, Shafran I, Grayson D, Gates K, Nigg JT, Fair DA (2013) Inferringfunctional connectivity in MRI using Bayesian network structure learningwith a modified PC algorithm. Neuroimage 75:165–175. CrossRefMedline
Keller CJ, Bickel S, Honey CJ, Groppe DM, Entz L, Craddock RC, Lado FA,Kelly C, Milham M, Mehta AD (2013) Neurophysiological investigationof spontaneous correlated and anticorrelated fluctuations of the BOLDsignal. J Neurosci 33:6333– 6342. CrossRef Medline
Lancaster JL, Glass TG, Lankipalli BR, Downs H, Mayberg H, Fox PT (1995)A modality-independent approach to spatial normalization of tomo-graphic images of the human brain. Human Brain Mapping 3:209 –223.CrossRef
Lewis JW, Van Essen DC (2000) Corticocortical connections of visual, sen-sorimotor, and multimodal processing areas in the parietal lobe of themacaque monkey. J Comp Neurol 428:112–137. CrossRef Medline
Mantini D, Corbetta M, Romani GL, Orban GA, Vanduffel W (2013) Evo-
lutionarily novel functional networks in the human brain? J Neurosci33:3259 –3275. CrossRef Medline
Margulies DS, Kelly AM, Uddin LQ, Biswal BB, Castellanos FX, Milham MP(2007) Mapping the functional connectivity of anterior cingulate cortex.Neuroimage 37:579 –588. CrossRef Medline
Margulies DS, Vincent JL, Kelly C, Lohmann G, Uddin LQ, Biswal BB,Villringer A, Castellanos FX, Milham MP, Petrides M (2009) Precuneusshares intrinsic functional architecture in humans and monkeys. ProcNatl Acad Sci U S A 106:20069 –20074. CrossRef Medline
Markov NT, Ercsey-Ravasz MM, Ribeiro Gomes AR, Lamy C, Magrou L,Vezoli J, Misery P, Falchier A, Quilodran R, Gariel MA, Sallet J, GamanutR, Huissoud C, Clavagnier S, Giroud P, Sappey-Marinier D, Barone P,Dehay C, Toroczkai Z, Knoblauch K, et al. (2012) A weighted and di-rected interareal connectivity matrix for macaque cerebral cortex. CerebCortex 24:17–36. CrossRef Medline
Mars RB, Jbabdi S, Sallet J, O’Reilly JX, Croxson PL, Olivier E, Noonan MP,Bergmann C, Mitchell AS, Baxter MG, Behrens TE, Johansen-Berg H,Tomassini V, Miller KL, Rushworth MF (2011) Diffusion-weighted im-aging tractography-based parcellation of the human parietal cortex andcomparison with human and macaque resting-state functional connec-tivity. J Neurosci 31:4087– 4100. CrossRef Medline
Michelon P, Snyder AZ, Buckner RL, McAvoy M, Zacks JM (2003) Neuralcorrelates of incongruous visual information: an event-related fMRIstudy. Neuroimage 19:1612–1626. CrossRef Medline
Moeller S, Nallasamy N, Tsao DY, Freiwald WA (2009) Functional connec-tivity of the macaque brain across stimulus and arousal states. J Neurosci29:5897–5909. CrossRef Medline
Murphy K, Birn RM, Handwerker DA, Jones TB, Bandettini PA (2009) Theimpact of global signal regression on resting state correlations: are anti-correlated networks introduced? Neuroimage 44:893–905. CrossRefMedline
Orban GA, Van Essen D, Vanduffel W (2004) Comparative mapping ofhigher visual areas in monkeys and humans. Trends Cogn Sci 8:315–324.CrossRef Medline
Paxinos G, Huang XF, Toga AW (1999) The rhesus monkey brain in stereo-taxic coordinates 2000 ed. San Diego: Academic.
Power JD, Barnes KA, Snyder AZ, Schlaggar BL, Petersen SE (2012) Spuri-ous but systematic correlations in functional connectivity MRI networksarise from subject motion. Neuroimage 59:2142–2154. CrossRef Medline
Power JD, Schlaggar BL, Lessov-Schlaggar CN, Petersen SE (2013) Evidencefor hubs in human functional brain networks. Neuron 79:798 – 813.CrossRef Medline
Power JD, Mitra A, Laumann TO, Snyder AZ, Schlaggar BL, Petersen SE(2014) Methods to detect, characterize, and remove motion artifact inresting state fMRI. Neuroimage 84:320 –341. CrossRef Medline
Rohlfing T, Kroenke CD, Sullivan EV, Dubach MF, Bowden DM, Grant KA,Pfefferbaum A (2012) The INIA19 template and NeuroMaps atlas forprimate brain image parcellation and spatial normalization. Front Neu-roinform 6:27. CrossRef Medline
Rubinov M, Sporns O (2010) Complex network measures of brain connec-tivity: uses and interpretations. Neuroimage 52:1059 –1069. CrossRefMedline
Sallet J, Mars RB, Noonan MP, Neubert FX, Jbabdi S, O’Reilly JX, Filippini N,Thomas AG, Rushworth MF (2013) The organization of dorsal frontalcortex in humans and macaques. J Neurosci 33:12255–12274. CrossRefMedline
Salvador R, Suckling J, Coleman MR, Pickard JD, Menon D, Bullmore E(2005) Neurophysiological architecture of functional magnetic reso-nance images of human brain. Cereb Cortex 15:1332–1342. CrossRefMedline
Satterthwaite TD, Elliott MA, Gerraty RT, Ruparel K, Loughead J, CalkinsME, Eickhoff SB, Hakonarson H, Gur RC, Gur RE, Wolf DH (2013) Animproved framework for confound regression and filtering for control ofmotion artifact in the preprocessing of resting-state functional connectiv-ity data. Neuroimage 64:240 –256. CrossRef Medline
Scholvinck ML, Maier A, Ye FQ, Duyn JH, Leopold DA (2010) Neural basisof global resting-state fMRI activity. Proc Natl Acad Sci U S A 107:10238 –10243. CrossRef Medline
Shen K, Bezgin G, Hutchison RM, Gati JS, Menon RS, Everling S, McIntoshAR (2012) Information processing architecture of functionally definedclusters in the macaque cortex. J Neurosci 32:17465–17476. CrossRefMedline
5562 • J. Neurosci., April 16, 2014 • 34(16):5552–5563 Miranda-Dominguez, Mills et al. • Bridging the Gap between the Human and Macaque Connectome
van den Heuvel MP, Sporns O (2011) Rich-club organization of the humanconnectome. J Neurosci 31:15775–15786. CrossRef Medline
van den Heuvel MP, Stam CJ, Boersma M, Hulshoff Pol HE (2008) Small-world and scale-free organization of voxel-based resting-state functionalconnectivity in the human brain. Neuroimage 43:528 –539. CrossRefMedline
van den Heuvel MP, Mandl RC, Kahn RS, Hulshoff Pol HE (2009) Func-tionally linked resting-state networks reflect the underlying structuralconnectivity architecture of the human brain. Hum Brain Mapp 30:3127–3141. CrossRef Medline
Van Essen DC (2004) Surface-based approaches to spatial localization andregistration in primate cerebral cortex. Neuroimage 23:S97–S107.CrossRef Medline
Van Essen DC (2005) Surface-based comparisons of macaque and humancortical organization. In: From monkey brain to human brain (DehaeneS, Duhamel JR, Hauser MD, Rizzolatti G, eds.), pp 3–19. Cambridge, MA:MIT.
Van Essen DC, Dierker DL (2007) Surface-based and probabilistic atlases ofprimate cerebral cortex. Neuron 56:209 –225. CrossRef Medline
Vincent JL, Patel GH, Fox MD, Snyder AZ, Baker JT, Van Essen DC, Zempel
JM, Snyder LH, Corbetta M, Raichle ME (2007) Intrinsic functional ar-chitecture in the anesthetized monkey brain. Nature 447:83– 86. CrossRefMedline
Vincent JL, Kahn I, Van Essen DC, Buckner RL (2010) Functional connec-tivity of the macaque posterior parahippocampal cortex. J Neurophysiol103:793– 800. CrossRef Medline
Wasserman S, Faust K (1994) Social network analysis: methods and appli-cations. New York: Cambridge UP.
Wechsler D (1999) Wechsler abbreviated scale of intelligence, Ed 3. SanAntonio: The Psychological Corporation.
Weissenbacher A, Kasess C, Gerstl F, Lanzenberger R, Moser E, Windisch-berger C (2009) Correlations and anticorrelations in resting-state func-tional connectivity MRI: a quantitative comparison of preprocessingstrategies. Neuroimage 47:1408 –1416. CrossRef Medline
Wilkinson GS, Robertson G (2006) Wide Range Achievement Test(WRAT4). Lutz, FL: Psychological Assessment Resources.
Yan CG, Cheung B, Kelly C, Colcombe S, Craddock RC, Di Martino A, Li Q,Zuo XN, Castellanos FX, Milham MP (2013) A comprehensive assess-ment of regional variation in the impact of head micromovements onfunctional connectomics. Neuroimage 76:183–201. CrossRef Medline
Miranda-Dominguez, Mills et al. • Bridging the Gap between the Human and Macaque Connectome J. Neurosci., April 16, 2014 • 34(16):5552–5563 • 5563