bridge replacements on md 28 and md 450, frederick county
TRANSCRIPT
Bridge Replacements on MD
28 and MD 450, Frederick
County and Anne Arundel
County, Maryland
Final Report
June 2013

FOREWORD
The purpose of the Highways for LIFE (HfL) pilot program is to accelerate the use of
innovations that improve highway safety and quality while reducing congestion caused by
construction. LIFE is an acronym for Longer-lasting highway infrastructure using Innovations
to accomplish the Fast construction of Efficient and safe highways and bridges.
Specifically, HfL focuses on speeding up the widespread adoption of proven innovations in the
highway community. “Innovations” is an inclusive term used by HfL to encompass technologies,
materials, tools, equipment, procedures, specifications, methodologies, processes, and practices
used to finance, design, or construct highways. HfL is based on the recognition that innovations
are available that, if widely and rapidly implemented, would result in significant benefits to road
users and highway agencies.
Although innovations themselves are important, HfL is as much about changing the highway
community’s culture from one that considers innovation something that only adds to the
workload, delays projects, raises costs, or increases risk to one that sees it as an opportunity to
provide better highway transportation service. HfL is also an effort to change the way highway
community decision-makers and participants perceive their jobs and the service they provide.
The HfL pilot program, described in Safe, Accountable, Flexible, Efficient Transportation Equity
Act: A Legacy for Users (SAFETEA-LU) Section 1502, includes funding for demonstration
construction projects. By providing incentives for projects, HfL promotes improvements in
safety, construction-related congestion, and quality that can be achieved through the use of
performance goals and innovations. This report documents one such HfL demonstration project.
Additional information on the HfL program is at http://www.fhwa.dot.gov/hfl.
NOTICE
This document is disseminated under the sponsorship of the U.S. Department of Transportation
in the interest of information exchange. The U.S. Government assumes no liability for its
contents or use thereof. This report does not constitute a standard, specification, or regulation.
The U.S. Government does not endorse products or manufacturers. Trade and manufacturers’
names appear in this report only because they are considered essential to the object of the
document.

ii
Report No. Government Accession No Recipient’s Catalog No
Title and Subtitle
Bridge Replacements on MD 28 and MD 450, Frederick County
and Anne Arundel County, Maryland
5. Report Date
June 2013
6. Performing Organization Code
Authors
Jagannath Mallela, John Hausman, P.E., Paul Littleton, P.E., Jerry
Ullman, Ph.D., and Gary Hoffman, P.E., R.L.S.
Performing Organization Report
No.
Performing Organization Name and Address
Applied Research Associates, Inc.
100 Trade Centre Drive, Suite 200
Champaign, IL 61820
Work Unit No. (TRAIS) C6B
Contract or Grant No.
12. Sponsoring Agency Name and Address
Office of Infrastructure
Federal Highway Administration
1200 New Jersey Avenue, SE
Washington, DC 20590
Type of Report and Period
Covered
Draft Final Report
May 2007–August 2010
14. Sponsoring Agency Code
Supplementary Notes
Contracting Officers Technical Representatives: Byron Lord, Mary Huie
Abstract As part of a national initiative sponsored by the Federal Highway Administration under the Highways for LIFE
program, the Maryland State Highway Administration (MDSHA) was awarded a grant totaling 20 percent of the
total project construction cost (or $717,157), making this a 100 percent federally funded project. The grant was
awarded because the project was intended to demonstrate the use of proven, innovative technologies to deliver
two rural bridge replacement projects in an accelerated schedule so as not to impact school bus routes. This
report documents the MD 28 over Washington Run and MD 450 over Bacon Ridge Branch bridge projects, both
single span bridges carrying two-lane, two-way roadways.
This report summarizes the practices employed for these projects, including the use of prefabricated bridge
elements and structures (PBES), incentive contracting, and construction within full roadway closures and
detours. The use of these technologies decreased estimated construction time from 15 months for similar typical
bridge replacement projects to 3 months (only 2 months of roadway closure).
While the full roadway closures and subsequent detours significantly increased user delays and fuel consumption
on a daily basis, the drastically reduced construction time and great savings in MOT and construction phasing
resulted in a project savings of approximately $1.49 million (or approximately 32 percent of the total project
costs) of the MD 28 project alone. Because of the success of this project, MDSHA is applying lessons learned
and have already taken steps on other projects to further utilize PBES construction practices to save time and
money.
Key Words Highways for LIFE, Prefabricated Bridge Elements,
Schedule Incentive/Disincentive, Multiple Project Award,
Detour
Distribution Statement No restriction. This document is available to the public through
the Highways for LIFE website:
http://www.fhwa.dot.gov/hfl/
Security Classif.(of this report) Unclassified
Security Classif. (of this page) Unclassified
No. of Pages 44 Price
Form DOT F 1700.7 (8-72) Reproduction of completed page authorized

iii

iv
ACKNOWLEDGMENTS
The project team would like to acknowledge the invaluable insights and guidance of Federal
Highway Administration (FHWA) Highways for LIFE Team Leader Byron Lord and Program
Coordinators Mary Huie and Kathleen Bergeron, who served as the technical panel on this
demonstration project. Their vast knowledge and experience with the various aspects of
construction, technology deployment, and technology transfer helped immensely in developing
both the approach and the technical matter for this document. The team also is indebted to Dan
Sanayi of the DelMar FHWA Division Office as well as Maryland State Highway
Administration (MDSHA) Engineers Jeff Robert, Gerald Burgess and Nagendra Malik for their
assistance and coordination during this project. Finally, thanks are also due to Butch Lundgren
of Concrete General, Inc. for additional input and perspective on this demonstration project.

v
TABLE OF CONTENTS
INTRODUCTION ...........................................................................................................................7 Highways for LIFE Demonstration Projects........................................................................7
Project Solicitation, Evaluation, and Selection ....................................................................8 Report Scope and Organization .........................................................................................10 PROJECT OVERVIEW AND LESSONS LEARNED .................................................................10 Project Overview ...............................................................................................................10 Data Collection ..................................................................................................................11
Economic Analysis ............................................................................................................12 Lessons Learned.................................................................................................................12
Conclusions ........................................................................................................................13 PROJECT DETAILS .....................................................................................................................15 Background ........................................................................................................................15 Project Description.............................................................................................................16
DATA ACQUISITION AND ANALYSIS ...................................................................................26 Safety .................................................................................................................................26
Construction Congestion ....................................................................................................27 Quality................................................................................................................................30 User Satisfaction ................................................................................................................34
TECHNOLOGY TRANSFER .......................................................................................................37
ECONOMIC ANALYSIS .............................................................................................................40 Construction Time .............................................................................................................40 Construction Costs .............................................................................................................40
User Costs ..........................................................................................................................41 Cost Summary ....................................................................................................................43
LIST OF FIGURES
Figure 1. Locations of MD 28 bridge over Washington Run (left) and MD 450 bridge over
Bacon Ridge Branch (right). 15 Figure 2. Preexisting condition of MD 28 bridge over Washington Run (left) and MD 450 bridge
over Bacon Ridge Branch (right). 15 Figure 3. Flooding on pavement at east approach of MD 450 bridge. 16 Figure 4. Cover sheet of MDSHA Contract # AX4695180. 17
Figure 5. Notice of bridge closure at MD 28 over Washington Run. 18 Figure 6. Typical superstructure section and plan view of slab layout – MD 28 bridge. 19 Figure 7. Typical superstructure section and plan view of slab layout – MD 28 bridge. 20 Figure 8. Precasting of MD 28 bridge slabs. 21 Figure 9. Crane placement of Slab No. 4 at MD 28 project. 21
Figure 10. Alignment of elastomeric bearing pads for Slab No. 6 at MD 28 project. 22 Figure 11. Completion of slab placement at MD 28 project. 22 Figure 12. Preparation of post-tensioning on tie rod at MD 28 project. 23
Figure 13. Typical section detail, elevation, and notes for tie rods on MD 450 project. 23 Figure 14. Aerial view of shear key at end of beams.24 Figure 15. Shear key detail for MD 28 project. 24

vi
Figure 16. Slab detail at abutment for MD 28 project. 25 Figure 17. Detour route for MD 28 bridge project. 28 Figure 18. Detour route for MD 450 bridge project. 29 Figure 19. Previous condition of MD 28 bridge over Washington Run. 30
Figure 20. New condition of replaced MD 28 bridge over Washington Run. 30 Figure 21. OBSI dual probe system and the SRTT. 31 Figure 22. MD 28 mean A-weighted sound intensity one-third octave frequency spectra. 31 Figure 23. MD 450 mean A-weighted sound intensity one-third octave frequency spectra. 32 Figure 24. Laser profiler mounted behind the test vehicle. 33
Figure 25. MD 28 mean IRI values. 34 Figure 26. MD 450 mean IRI values. 34
Figure 27. Example of positive community response to MD 450 project. 36 Figure 28. Invitation to MD/SC/VA HfL demonstration project showcase. 37 Figure 29. Agenda for MD/SC/VA HfL demonstration project showcase. 37
vii
LIST OF TABLES
Table 1. Preconstruction crash data 26 Table 2. Post construction crash data. 26
Table 3. Pre and post construction crash rates. 27 Table 4. Summary of cost and duration per MOT alternative. 27 Table 5. Summary of travel time studies during construction. 29 Table 6. Preconstruction measured OBSI values for MD 28 and MD 450 bridges. 32 Table 7. Comparison of MD 28 bridge superstructure construction costs. 41
Table 8. Comparison of MD 28 structural and roadway construction costs. 41 Table 9. Comparison of MD 28 bridge delay and fuel consumption user costs. 42
ABBREVIATIONS AND SYMBOLS
AASHTO American Association of State Highway and Transportation Officials
ASTM American Society for Testing and Materials
dB(A) A-weighted decibels
DOT Department of transportation
EB Eastbound
FHWA Federal Highway Administration
HfL Highways for LIFE
HMA Hot-mix asphalt
Hz Hertz
IRI International Roughness Index
MD Maryland (as designation of state route)
MDSHA Maryland State Highway Administration
MOT Maintenance of traffic
OBSI On-board sound intensity
OSHA Occupational Safety and Health Administration
PBES Prefabricated bridge elements and systems
PCC Portland cement concrete
SAFETEA-LU Safe, Accountable, Flexible, Efficient Transportation Equity Act: A
Legacy for Users
SC South Carolina (as designation of state route)
SCC Self-consolidating concrete
SCDOT South Carolina Department of Transportation
SI Sound intensity
SRTT Standard reference test tire
VDOT Virginia Department of Transportation
WB Westbound
INTRODUCTION
HIGHWAYS FOR LIFE DEMONSTRATION PROJECTS

8
The Highways for LIFE (HfL) pilot program, the Federal Highway Administration’s (FHWA’s)
initiative to accelerate innovation in the highway community, provides incentive funding for
demonstration construction projects. Through these projects, the HfL program promotes and
documents improvements in safety, construction-related congestion, and quality that can be
achieved by setting performance goals and adopting innovations.
The HfL program—described in the Safe, Accountable, Flexible, Efficient Transportation Equity
Act: A Legacy for Users (SAFETEA-LU)—may provide incentives to a maximum of 15
demonstration projects a year. The funding amount may total up to 20 percent of the project cost,
but not more than $5 million. Also, the Federal share for a HfL project may be up to 100 percent,
thus waiving the typical State-match portion. At the State’s request, a combination of funding
and waived match may be applied to a project.
To be considered for HfL funding, a project must involve constructing, reconstructing, or
rehabilitating a route or connection on an eligible Federal-aid highway. It must use innovative
technologies, manufacturing processes, financing, or contracting methods that improve safety,
reduce construction congestion, and enhance quality and user satisfaction. To provide a target for
each of these areas, HfL has established demonstration project performance goals.
The performance goals emphasize the needs of highway users and reinforce the importance of
addressing safety, congestion, user satisfaction, and quality in every project. The goals define the
desired result while encouraging innovative solutions, raising the bar in highway transportation
service and safety. User-based performance goals also serve as a new business model for how
highway agencies can manage the highway project delivery process.
HfL project promotion involves showing the highway community and the public how
demonstration projects are designed and built and how they perform. Broadly promoting
successes encourages more widespread application of performance goals and innovations in the
future.
PROJECT SOLICITATION, EVALUATION, AND SELECTION
FHWA issued open solicitations for HfL project applications in fiscal years 2006, 2007, 2008,
and 2009. State highway agencies submitted applications through FHWA Divisions. The HfL
team reviewed each application for completeness and clarity, and contacted applicants to discuss
technical issues and obtain commitments on project issues. Documentation of these questions
and comments was sent to applicants, who responded in writing.
The project selection panel consisted of representatives of the FHWA offices of Infrastructure,
Safety and Operations; the Resource Center Construction and Project Management Team; the
Division offices; and the HfL team. After evaluating and rating the applications and
supplemental information, panel members convened to reach a consensus on the projects to
recommend for approval. The panel gave priority to projects that accomplish the following:
Address the HfL performance goals for safety, construction congestion, quality, and user
satisfaction.

9
Use innovative technologies, manufacturing processes, financing, contracting practices,
and performance measures that demonstrate substantial improvements in safety,
congestion, quality, and cost-effectiveness. An innovation must be one the applicant State
has never or rarely used, even if it is standard practice in other States.
Include innovations that will change administration of the State’s highway program to
more quickly build long-lasting, high-quality, cost-effective projects that improve safety
and reduce congestion.
Will be ready for construction within one year of approval of the project application. For
the HfL program, FHWA considers a project ready for construction when the FHWA
Division authorizes it.
Demonstrate the willingness of the applicant department of transportation (DOT) to
participate in technology transfer and information dissemination activities associated with
the project.
HfL Project Performance Goals
The HfL performance goals focus on the expressed needs and wants of highway users. They are
set at a level that represents the best of what the highway community can do, not just the average
of what has been done. States are encouraged to use all applicable goals on a project:
Safety
Work zone safety during construction—Work zone crash rate equal to or less than the
preconstruction rate at the project location.
Worker safety during construction—Incident rate for worker injuries of less than 4.0,
based on incidents reported via Occupational Safety and Health Administration
(OSHA) Form 300.
Facility safety after construction—Twenty percent reduction in fatalities and injuries
in 3-year average crash rates, using preconstruction rates as the baseline.
Construction Congestion
Faster construction—Fifty percent reduction in the time highway users are impacted,
compared to traditional methods.
Trip time during construction—Less than 10 percent increase in trip time compared to
the average preconstruction speed, using 100 percent sampling.
Queue length during construction—A moving queue length of less than 0.5 mile (mi)
(0.8 kilometer (km)) in a rural area or less than 1.5 mi (2.4 km) in an urban area (in
both cases at a travel speed 20 percent less than the posted speed).
Quality
Smoothness—International Roughness Index (IRI) measurement of less than 48
inches per mile.
Noise—Tire-pavement noise measurement of less than 96.0 A-weighted decibels
(dB(A)), using the onboard sound intensity (OBSI) test method.
User satisfaction—An assessment of how satisfied users are with the new facility
compared to its previous condition and with the approach used to minimize disruption
during construction. The goal is a measurement of 4-plus on a 7-point Likert scale.

10
REPORT SCOPE AND ORGANIZATION
This report documents the Maryland State Highway Administration (MDSHA) demonstration
project, which involved replacing and constructing two single-span bridges: MD 28 over
Washington Run, located in Frederick County, and MD 450 over Bacon Ridge Branch, located
in Anne Arundel County. The report presents project details relevant to the HfL program,
including the use of precast/prestressed bridge components, innovative contract award and
scheduling, and full roadway closures/detours used to accelerate construction and produce high
quality bridges in each project location. HfL performance metrics measurement, economic
analysis, and technology transfer activities that took place during the project and lessons learned
are also discussed.
PROJECT OVERVIEW AND LESSONS LEARNED
PROJECT OVERVIEW
This project included the quick and efficient construction of two replacement bridges, using
innovative techniques, including prefabricated bridge elements and systems (PBES) to provide
safer and more durable bridges than those replaced. Precast, prestressed Portland cement
concrete (PCC) slabs were fabricated at a plant off-site and shipped to the project sites, allowing
rapid construction of critical bridge elements and providing a high quality road surface, as well
as a diminished need for bridge maintenance throughout the structure life. In order to minimize
both project costs and variability in quality and process, these projects were advertised and
awarded in a single contract to one low bidder responsible for building both bridges in a
concurrent timeframe.
Each bridge construction was performed within full road closures to minimize inconveniences to
commuters and avoid work zone accidents due to traffic-pattern confusion. These closures
drastically diminished construction time compared to similar projects constructed within partial
roadway closures. The closures took place beginning shortly after the end of the 2007-2008
school year, so as not to impact school bus routes on the project roadways. Prompt completion
by the contractor was ensured by incentive/disincentive clauses for schedule performance.
The first bridge carries MD 28 over the Washington Run, near Point of Rocks, Maryland, along
the Potomac River in southern Frederick County. The original bridge was 78 years old and rated
as “structurally deficient and functionally obsolete”. The bridge supported a 25-ft. wide roadway
carrying approximately 11,000 vehicles per day.
The second bridge carries MD 450 over Bacon Ridge Branch, west of Annapolis, Maryland in
central Anne Arundel County. The original bridge was 82 years old and rated as “structurally
deficient and functionally obsolete”. The bridge supported a 24-ft. wide roadway carrying
approximately 8,000 vehicles per day. The MD 450 bridge was selected as a substitute project
for another bridge originally proposed on the HfL grant application as a result of follow-on
coordination with the community and resulting concerns by the local fire protection company
regarding response times affected by a full roadway closure.

11
DATA COLLECTION
Safety, construction congestion, and quality data were collected prior to and throughout
construction to demonstrate that the innovative approaches to this project can be used to achieve
the HfL performance goals in these areas. Unfortunately, user satisfaction data was not collected
as part of these efforts, as is discussed in a later section.
Safety – Motorist safety is ensured within the work zone by performing full roadway closures for
each project. This additionally provided the contractor with greater work area for material
storage and equipment operation during all work activities, minimizing the likelihood of work-
related accidents on the project site. With no worker injuries reported at either project site,
MDSHA exceeded the HfL goal (incident rate less than 4.0 based on the OSHA 300 rate).
The facility was expected to provide improved safety performance in the long term by
introducing safer, more durable bridge surfaces to replace those rated as structurally deficient,
and by minimizing the need for accessing the bridge for maintenance activities in the future.
Furthermore, the increase to the vertical profile for the MD 450 project also eliminated a
significant issue with flooding of the east approach roadway of the bridge, thus eliminating
significant safety hazards during periods of intense precipitation. The post construction crash
statistics indicate that the HfL goal of at least 20% reduction in fatalities and injuries was not
achieved. Compared with preconstruction crash rates, there was a 25 percent increase in post
construction injury rate; however, the property damage only crash rate fell by more than half its
preconstruction crash rate.
Construction Congestion – Full roadway closures to complete the project construction requires
detour routes for each project site to allow an alternative traffic pattern. Alternative traffic
pattern studies were performed for each project site by consultants for MDSHA.1, 2 Verification
of travel times was conducted during construction periods as part of the HfL evaluation of these
projects, with travel distances and times recorded and presented within this report.
Increased travel times experienced per vehicle along the detour routes during construction are
offset by the significant reduction of maintenance of traffic (MOT) duration and costs associated
with a full closure compared to the typical MDSHA activity, maintaining two-way traffic on a
single lane roadway using a temporary traffic signal. As reported by MDSHA consultants in the
referenced MOT alternative studies, a full closure would typically require an approximate 2-
month duration and $15,000 per site for MOT, compared to an approximate 15-month duration
and $100,000 per site. Furthermore, as stated previously, the full roadway closure improves both
safety and congestion within and adjacent to the project site by eliminating queues and
bottlenecks common in a one-lane MOT scenario.
1 “MD 28 over Washington Run: Maintenance of Traffic Alternatives Analysis”, Sabra, Wang & Associates,
Inc., April 2007.
2 “MD 450 over Bacon Ridge Branch: Maintenance of Traffic Alternatives Analysis”, Wallace, Montgomery &
Associates, LLP, December 2006.

12
Quality – By using precast PCC slabs, material quality issues and review of elements could
happen in advance of using or placing the elements at the project site. The HfL evaluation team
for this project visited the precasting plant and observed the fabrication of precast beams for the
MD 28 project.
Preconstruction ride quality was measured via two methods: pavement smoothness using IRI and
sound intensity using the OBSI technique. Mean values of A-weighted OBSI of 92.9 and 97.6
dB were observed on the preconstruction bridge decks for the MD 28 and MD 450 projects,
respectively. Average IRI values of 373 and 406 in/mi were measured on the MD 28 and MD
450 bridge decks prior to construction, respectively.
Due to the short project lengths (and subsequently short analysis and reporting intervals) of these
bridges, it was determined that post-construction surveys would not indicate the true magnitude
of improvement in surface ride quality. However, by replacing significantly distressed bridge
decks and approach pavements and removing expansion joints, both sound intensity and
pavement smoothness would be significantly improved by the construction efforts.
ECONOMIC ANALYSIS
The benefits and costs of this innovative project approach were compared with those of a project
of similar size and scope with a more traditional delivery approach. MDSHA provided the
comparative cost data available to analyze each economic component of the project between the
HfL innovative methods and traditional MDSHA practices.
The economic analysis revealed that MDSHA’s approach realized a cost savings of about $1.49
million or 32 percent over conventional construction practices.3 A significant amount of the cost
savings was from reduced safety costs due to working within a full roadway closure.
LESSONS LEARNED
Contract Administration proved to be challenging on this project since each project was located
in a different Maryland District. Maryland SHA’s construction projects are administered by
local district offices. The problem that resulted is that decisions made by one district did not
necessarily hold true for the other project in the other district. Because of this, the contractor
was required to treat these projects essentially as two independent projects from an
administrative stand point and this resulted in some duplication of effort. In addition, SHA’s
accounting system is geared to having one and only one district handling a project. Therefore,
one of the districts had to handle all financial aspects, which required much communication to
understand what was being done in the other district. In the future, SHA might have some
meeting prior to construction with the districts involved and assign one district to manage all
aspects of both projects. This will allow for consistency and eliminate duplication of efforts.
3 These costs were obtained from estimates prepared by MDSHA in planning and comparative analysis of the
project alternatives.

13
Ultimately, these projects and the utilization of PBES proved quite successful for MDSHA.
Many advantages were realized through the innovations identified within this HfL demonstration
project. Several lessons learned from the execution of this contract are summarized herein,
including both positive and negative outcomes and considering both the contractor’s and
agency’s perspectives.
MDSHA realized many benefits from the use of full roadway closures on these projects. From
the MDSHA project engineers’ perspective, this single aspect provided several major benefits
alone, including increased safety and decreased construction & curing time for major
construction. Looking to the future, and presuming that an economically-feasible detour path is
available, Jeff Robert of MDSHA had the following to say regarding full roadway closures:
“Anytime you can construct a project with a detour in place it is a
benefit. This creates a safer situation for construction workers and the
travelling public and allows the work to be done quicker.”
One of the biggest issues concerning successful completion of these projects by the contractor
was the drilling and driving of caissons and piles for the abutment construction. On MD 28, the
actual required drilling depth was approximately twice the estimated depth from preconstruction
soil investigations. This problem, discovered during the roadway closure, delayed the total
project schedule by approximately one month for extended drilling. On the MD 450 project, the
use of plumb piles did not provide adequate lateral stability during construction and backfill prior
to placement of the precast beams.
The MDSHA project engineers gave special consideration to pile placement for this project, and
currently some of these lessons have been applied to other projects throughout MD. For
instance, a similar project currently under construction is utilizing single lane closures at night to
do geotechnical investigation and drilling for caissons and piles in order to minimize the
potential for delays and “unforeseen” conditions that would further delay the project.
The MD 450 project illustrated the great care required when utilizing PBES construction
methods in forming and placing the elements. It was reported that even after tensioning, the
beam did not sit absolutely snug with each other , with total actual width of beam/slab placement
expanding by 3 to 4 inches beyond the designed width (sum of beam widths = 43 feet). This had
an impact on guardrail alignment.
The use of PBES for this project resulted in great savings of construction time, and MDSHA is
currently investigating the use of precast substructure elements to further minimize construction
time and traffic impacts. From the contractor’s perspective, however, the three-month total
project window has little room for improvement when considering minimum times for earthwork
preparation, material testing, and surface placement. MDSHA reports that these projects
performed within the HfL program served as effective stepping stones to better, more efficient
construction methods.
CONCLUSIONS

14
This project achieved a high level of quality and was brought to completion quickly and safely as
a direct result of innovative contracting and construction methods. The success of this project
will serve as a vehicle for MDSHA to expand the use of PBES in future bridge projects. Many
of the innovations employed were validated as a result of the many experiences gained through
this project and have been shown to be valuable tools for future MDSHA projects. Finally, the
project also provided MDSHA with valuable experience with administering bundled projects.
15
PROJECT DETAILS
BACKGROUND
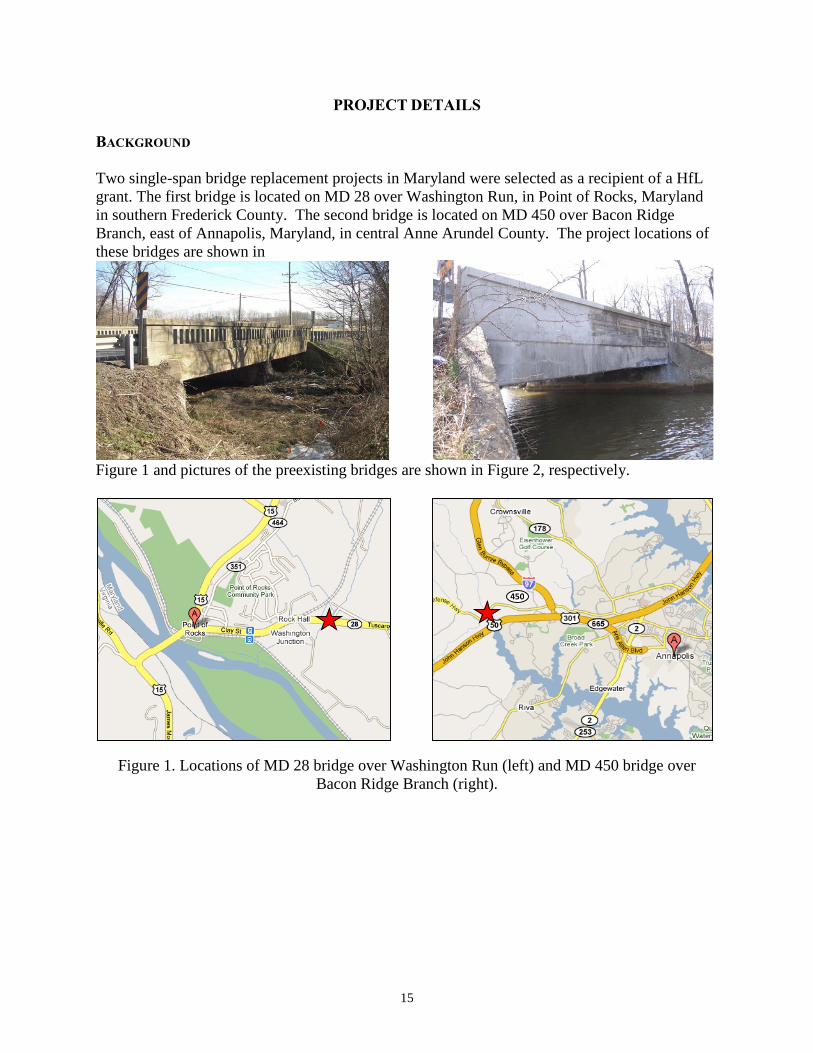
Two single-span bridge replacement projects in Maryland were selected as a recipient of a HfL
grant. The first bridge is located on MD 28 over Washington Run, in Point of Rocks, Maryland
in southern Frederick County. The second bridge is located on MD 450 over Bacon Ridge
Branch, east of Annapolis, Maryland, in central Anne Arundel County. The project locations of
these bridges are shown in
Figure 1 and pictures of the preexisting bridges are shown in Figure 2, respectively.
Figure 1. Locations of MD 28 bridge over Washington Run (left) and MD 450 bridge over
Bacon Ridge Branch (right).
450

16
Figure 2. Preexisting condition of MD 28 bridge over Washington Run (left) and MD 450 bridge
over Bacon Ridge Branch (right).
The original bridge on the MD 28 project was 78 years old and rated as “structurally deficient
and functionally obsolete”. The bridge was 37 feet long and 25 feet wide and carried
approximately 11,000 vehicles per day. The MD 28 limit of work represents an approximate
total roadway length of 0.1-mile, including approach and intersecting pavements.
The original bridge replaced on the MD 450 project was reported as 82 years old and
“structurally deficient and functionally obsolete”. The bridge was 36 feet long and 24 feet wide
and carried approximately 8,000 vehicles per day. The MD 450 limit of work was
approximately 0.3-miles in length, including approach and intersecting pavements. In addition
to the bridge replacement, it was desired that an elevated surface profile could help resolve an
existing flooding problem immediately east of the bridge, as illustrated in Figure 3.

17
Figure 3. Flooding on pavement at east approach of MD 450 bridge.
PROJECT DESCRIPTION
Each bridge was constructed as a single span bridge over a small stream, utilizing precast PCC
bridge elements for the superstructure. The substructure of each bridge was also removed and
replaced, utilizing cast-in-place integral abutments on piling. Additional construction elements
include the placement of a special mix PCC overlay over the precast slabs, upgrading approach
roadway barrier systems, and performing adjacent roadway tie-ins.
All construction for this effort at each project site was conducted under full roadway closure with
detoured traffic. The elements were fabricated at the Schuylkill Products, Inc. casting facility
located in Pottsville, PA. The contract was awarded to Concrete General, Inc. The following
subsections highlight the innovations features of this project.
Innovative Contracting
MDSHA adopted and enforced the following mission statement for this project: “Get In, Get Out
QUICK, Stay Out”. Several new or rarely used methods of achieving the greatest efficiency in
construction were employed for this effort. These methods are described within this section.
A single bundled contract was granted to one low bidder to perform both bridge projects.
MDSHA often bundles multiple projects in a single contract, but such contracts generally apply
for area-wide roadway maintenance contracts (i.e. crack sealing, patching, surface treatments)
and the multiple project sites are bounded within a single maintenance district. This project
marks the first time in MDSHA that multiple significant bridge construction projects are joined
as one and awarded to a single contractor. Figure 4 shows the cover sheet of a single set of
project plans for both bridges combined in MDSHA Contract No. AX4695180.

18
Figure 4. Cover sheet of MDSHA Contract # AX4695180.
Additional considerations come into play on administering this contract because the project sites
are in two different districts. Since MDSHA generally executes project management and
oversight at the district-level, certain trade-offs were realized throughout the contract
performance. For instance, while certain benefits (such as consistent quality control, project
coordination, and schedule performance) were realized by having a single contractor, the need
for two different teams to execute both on the agency side and the contractor side concurrently
raised some difficulties in contract management and project accounting.
The decision to perform this project under full roadway closure affords the opportunity to
exercise additional innovative contract methods and many benefits were realized throughout the
project as a result. As stated previously, safety in the work zone was greatly increased by the use
of full detours routing traffic away from the site, and the project duration was greatly reduced
from the typical duration of similar projects performed with temporary MOT. An aggressive
field completion schedule was established through use of an innovative incentive/disincentive
policy.
The contractor had a window for completion of both projects within 60 calendar days to receive
full incentive or within 75 calendar days prior to receiving a disincentive. This incentive
program ensured that the contractor would meet the aggressive schedule requirements so that all
work would be completed within the summer months and not impact school bus routes during

19
the school year. Figure 5 illustrates the signage posted to indicate full bridge/road closure to
begin “on or about 6/17/2008”, within 2 weeks of the end of the school year.
Figure 5. Notice of bridge closure at MD 28 over Washington Run.
Prefabricated Elements
The focus of this subsection is the innovative utilization of prefabricated bridge superstructure
elements, namely precast, prestressed PCC slabs and how they were used to expedite
construction, improve safety, and provide a high quality finished bridge. Similar elements have
been used rarely by MDSHA in past projects, but not as a generally available option for similar
projects, and past projects have not been performed within the same aggressive construction
schedule as achieved in these projects.
The MD 28 superstructure was constructed as ten 4’ x 41’ precast PCC beams, simply spanning
40 feet between abutments. The MD 450 superstructure was constructed as ten 4’ x 56’ and one
3’ x 56’ precast PCC beams. Transverse tie-rods for post-tensioning and grouted shear keys
between beams were used to provide strength and stability between the prefabricated elements.
Figure 6 illustrates the typical section and plan view for the MD 28 project, and Figure 7
illustrates the same for the MD 450 project.

20
Figure 6. Typical superstructure section and plan view of slab layout – MD 28 bridge.

21
Figure 7. Typical superstructure section and plan view of slab layout – MD 28 bridge.
The prestressed slabs were cast off-site in a controlled environment and then shipped to the site
via conventional semi-trailers. Extreme care was used to ensure proper placement and alignment
of tie-rod holes, curb rebar, anchor bolts, etc., such that all elements would fit properly and
securely in the field. Drilling, coring, or other corrections to placement errors in the field would
result in rejection of the slab by MDSHA. MDSHA further required that the contractor assemble
all slab units for each bridge at the casting plant prior to shipping slabs to the project sites in
order to ensure that there was no misalignment of the tie-rod holes. Any such misalignment
would result in rejection of the slab by MDSHA. Figure 8 illustrates precasting activities during
the fabrication of elements for the MD 28 project.

22
Figure 8. Precasting of MD 28 bridge slabs.
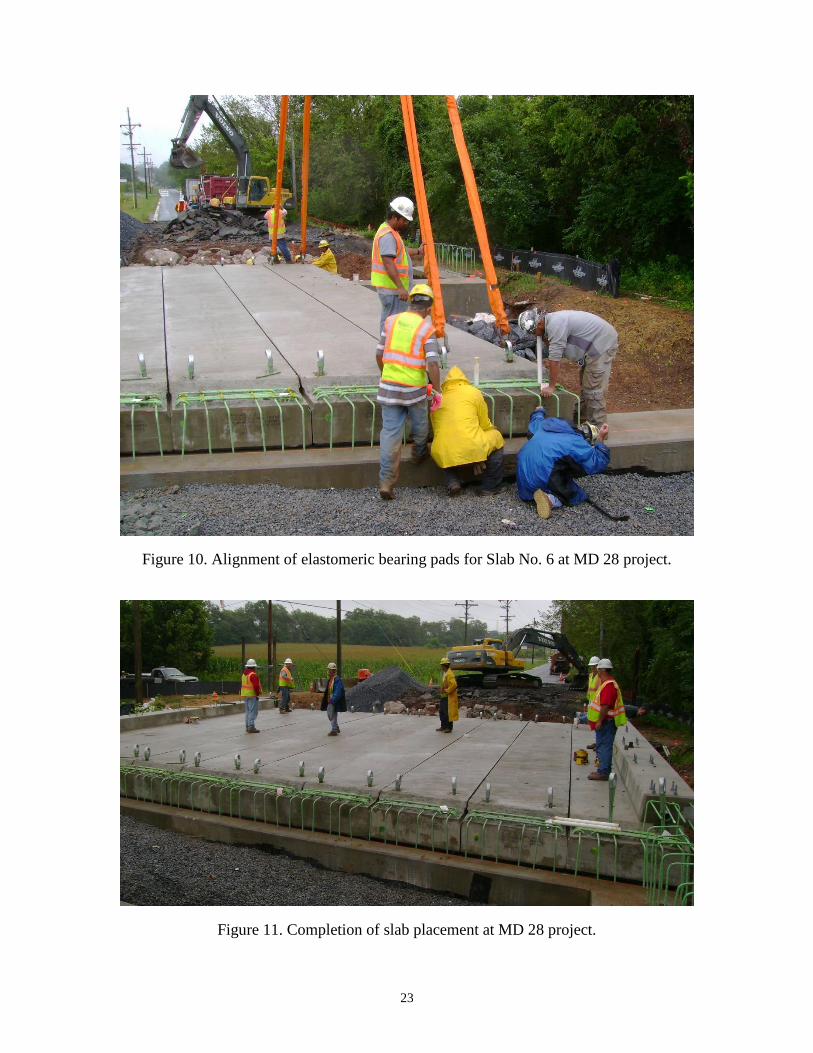
Following successful demonstration of assembly, the delivery of the precast slabs was simple for
these projects due to the full closure, causing no additional impact to traffic during the critical
stage of construction. Upon delivery to the project sites, the precast slabs were transferred by
crane from semi-trailer to the abutments and placed carefully for longitudinal and transverse
alignment. Figure 9 through Figure 11 illustrate the placement of precast slabs on the MD 28
project.
Figure 9. Crane placement of Slab No. 4 at MD 28 project.
23
Figure 10. Alignment of elastomeric bearing pads for Slab No. 6 at MD 28 project.
Figure 11. Completion of slab placement at MD 28 project.
24
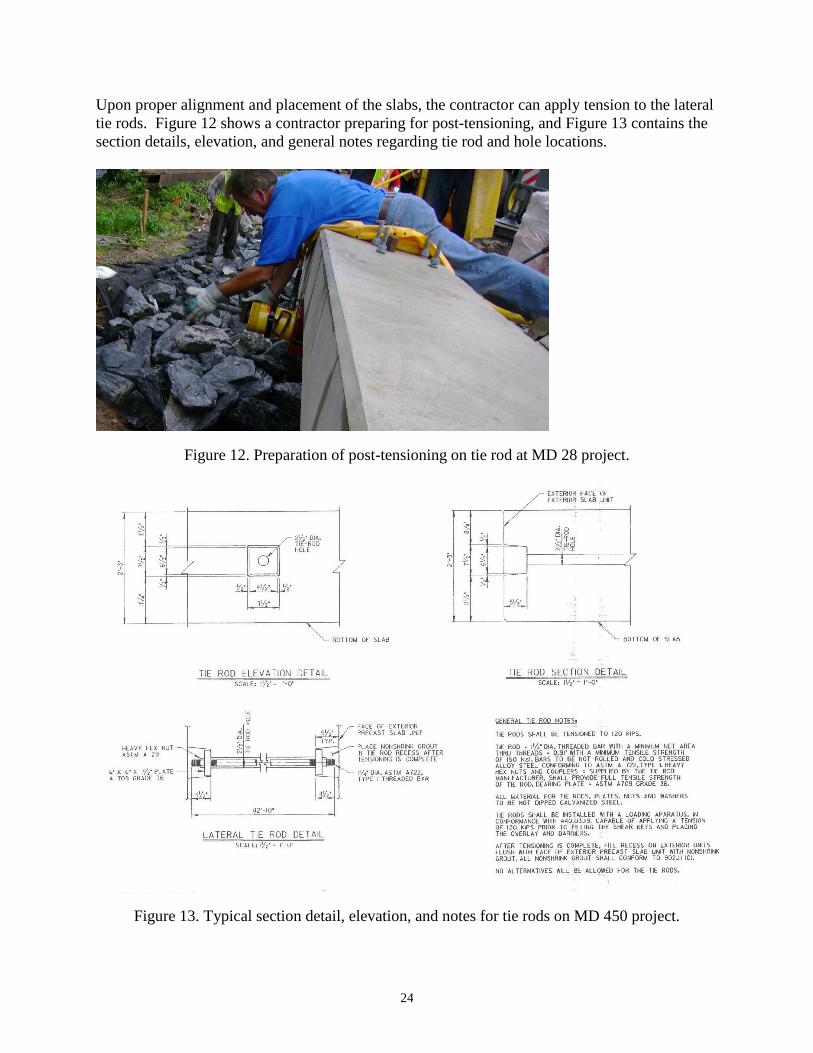
Upon proper alignment and placement of the slabs, the contractor can apply tension to the lateral
tie rods. Figure 12 shows a contractor preparing for post-tensioning, and Figure 13 contains the
section details, elevation, and general notes regarding tie rod and hole locations.
Figure 12. Preparation of post-tensioning on tie rod at MD 28 project.
Figure 13. Typical section detail, elevation, and notes for tie rods on MD 450 project.

25
Following the post-tensioning application, the remaining superstructure construction activities
directly related to the use of prefabricated slabs include grouting the shear keys, finalizing the
integral abutment, and pouring the finish surface. Figures Figure 14 and Figure 15 illustrate a
picture (at the beam end) and detail of the shear key between beams.
Figure 14. Aerial view of shear key at end of beams.
Figure 15. Shear key detail for MD 28 project.

26
Figure 16 details the connection of the precast beams at each abutment. Figure 10 had
previously shown the alignment of the elastomeric bearing pads with preformed holes in the
beams. At this stage, prior to completion of the superstructure, dowel holes are drilled through
the precast beam holes and into the abutment for connecting. Finally, the pour of the MDSHA
Mix No. 8 PCC overlay as the deck finish surface will also incorporate the pouring over beam-
end reinforcement as part of the integral abutment. The utilization of the integral abutment
allows for a smoother ride with no expansion joints as well as minimizing future bridge
maintenance needs. Approach pavement on either side of each bridge was resurfaced with a
standard hot-mix asphalt (HMA) surface lift.
Figure 16. Slab detail at abutment for MD 28 project.
27
DATA ACQUISITION AND ANALYSIS
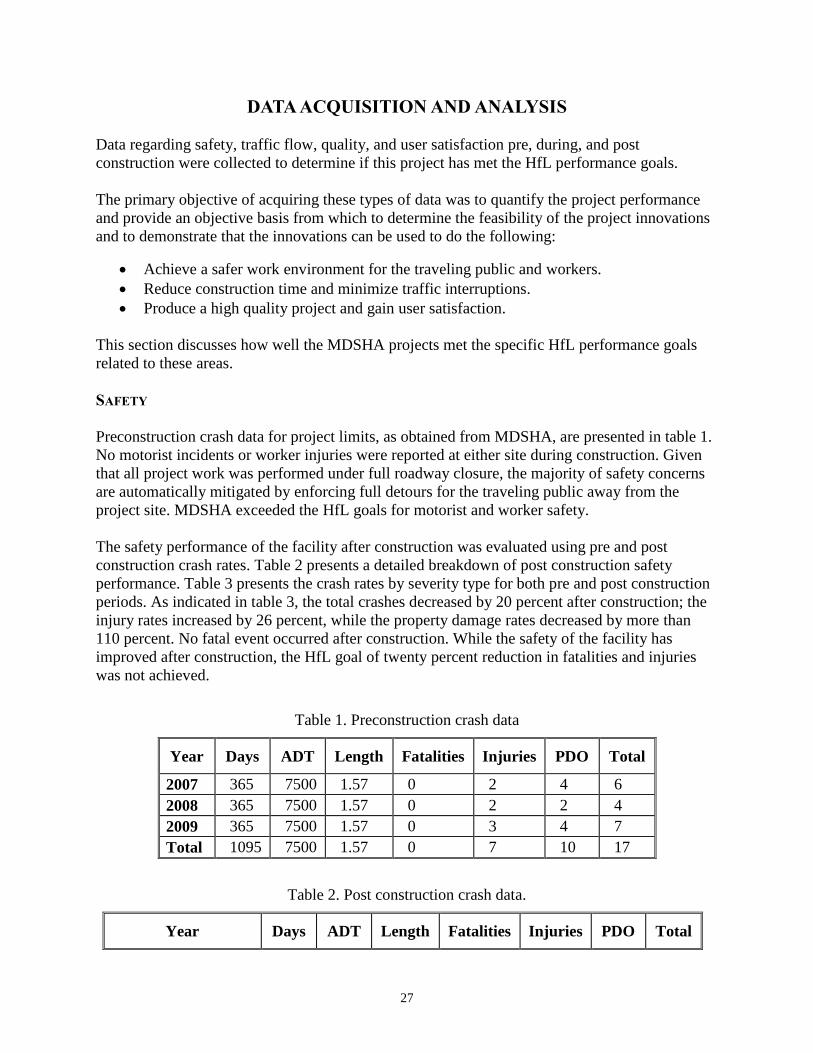
Data regarding safety, traffic flow, quality, and user satisfaction pre, during, and post
construction were collected to determine if this project has met the HfL performance goals.
The primary objective of acquiring these types of data was to quantify the project performance
and provide an objective basis from which to determine the feasibility of the project innovations
and to demonstrate that the innovations can be used to do the following:
Achieve a safer work environment for the traveling public and workers.
Reduce construction time and minimize traffic interruptions.
Produce a high quality project and gain user satisfaction.
This section discusses how well the MDSHA projects met the specific HfL performance goals
related to these areas.
SAFETY
Preconstruction crash data for project limits, as obtained from MDSHA, are presented in table 1.
No motorist incidents or worker injuries were reported at either site during construction. Given
that all project work was performed under full roadway closure, the majority of safety concerns
are automatically mitigated by enforcing full detours for the traveling public away from the
project site. MDSHA exceeded the HfL goals for motorist and worker safety.
The safety performance of the facility after construction was evaluated using pre and post
construction crash rates. Table 2 presents a detailed breakdown of post construction safety
performance. Table 3 presents the crash rates by severity type for both pre and post construction
periods. As indicated in table 3, the total crashes decreased by 20 percent after construction; the
injury rates increased by 26 percent, while the property damage rates decreased by more than
110 percent. No fatal event occurred after construction. While the safety of the facility has
improved after construction, the HfL goal of twenty percent reduction in fatalities and injuries
was not achieved.
Table 1. Preconstruction crash data
Year Days ADT Length Fatalities Injuries PDO Total
2007 365 7500 1.57 0 2 4 6
2008 365 7500 1.57 0 2 2 4
2009 365 7500 1.57 0 3 4 7
Total 1095 7500 1.57 0 7 10 17
Table 2. Post construction crash data.
Year Days ADT Length Fatalities Injuries PDO Total

28
2010 365 7581 0.4 0 1 0 1
2011 365 7442 0.4 0 1 0 1
2012 (Jan - June) 181 7516 0.4 0 0 1 1
Total 911 7513 0.4 0 2 1 3
Table 3. Pre and post construction crash rates.
Preconstruction Post construction Difference
Days of Coverage 1095 911
Average ADT 7500 7513
Section Length 1.57 0.4
Million Vehicle Miles Travelled 12.9 2.7
Total Crashes 1.32 1.10 -20.3%
Fatalities 0.00 0.00 -
Injuries 0.54 0.73 25.7%
PDO 0.78 0.37 -112.3%
CONSTRUCTION CONGESTION
Prior to advertisement of the project, MDSHA utilized consultants to perform a study and
prepare reports for each project site to analyze potential impact to traffic regarding MOT
alternatives, as referenced earlier. Each study considered three MOT alternatives as follows:
Alt. 1 – Full roadway closure with traffic detour for duration of construction
Alt. 2 – Temporary traffic signals to maintain one lane, two-way traffic during
construction
Alt. 3 – Three-phase construction using temporary bridge to maintain two lane, two-way
traffic at all times.
Table 4 summarizes typical cost and duration requirements for the various alternatives,
considering both the implementation of each MOT alternative and the required phases of project
construction relative to a specific MOT alternative, as reported for these projects.
The aforementioned MOT alternative analysis studies considered various inputs and measures
from a design and predicted traffic operational standpoint, including intersection capacity
analysis, predicted queue lengths and per vehicle delays.
Table 4. Summary of cost and duration per MOT alternative.
Maintenance of Traffic (MOT)
Alternative No. and Description
No. of
Bridge
Phases
MOT Implementation Approx. Project
Construction
Duration1,3 Cost1,2 Duration1,
2

29
1. Full Roadway Closure w/
Detour 1
$
15,000 2 days 2 months
2. One lane, two-way w/ Signals 2 $
100,000 2 weeks 15 months
3. Two lane w/ Temporary Bridge 3 $
185,000 3 weeks 24 months
Notes:
1. All costs and durations reported are approximate.
2. Data obtained from “Maintenance of Traffic Alternative Analysis: Replacement of Bridge No. 020720 on
MD 450 Over Bacon Ridge Branch”, Wallace, Montgomery & Associates, LLP, dated December 2006.
3. Data obtained from “MD 28 over Washington Run: Maintenance of Traffic Alternative Analysis”, Sabra,
Wang & Associates, Inc., dated April 2007.
Figures Figure 17 and Figure 18 demonstrate the detour routes utilized during the bridge
construction for MD 28 and MD 450 projects, respectively.
Figure 17. Detour route for MD 28 bridge project.

30
Figure 18. Detour route for MD 450 bridge project.
During construction, the HfL project team independently conducted travel time runs to assess the
impact of the full roadway closures on motorists for each of the two bridge projects. These
studies were conducted during the week of July 7, 2008 in normal daytime traffic patterns. The
studies consisted of multiple runs along the designated detour route in each direction, in which
incremental travel times were measured for each length of the route. From the measured times
obtained, an average and standard deviation of travel time as well as an associated average speed
were determined for each detour route. The results for these studies are summarized in Table 5
below.
Table 5. Summary of travel time studies during construction.
Detour Route
& Direction
Length/Δ
(miles)1 # of
Trips
Average Trip
Time/Δ (mm:ss)2 Std. Deviation of
Trip Time (sec)
Average Travel
Speed (mph)
MD 28, EB 12.1 / 8.3 10 15:43 / 10:42 65 46
MD 28, WB 12.1 / 8.3 9 16:31 / 11:33 76 44
MD 450, EB 11.5 / 7.0 5 22:10 / 3:54 52 43
MD 450, WB 12.2 / 7.7 5 18:36 / 9:03 26 49 Notes:
1. First measure is total detour length; Second measure is the difference between detour and original lengths.
2. First measure is total average trip time reported for full detour length; Second measure is the difference in
trip time between detour and original roadway.

31
QUALITY
This project primarily involved the replacement of two bridges that were approximately 80 years
old. The most significant measure of improvement of quality for these bridges is the visible
improvement in structural adequacy and improved maintainability. The Figures Figure 19 &
Figure 20 provide comparative illustrations of the before and after conditions of the MD 28
project.
Figure 19. Previous condition of MD 28 bridge over Washington Run.
Figure 20. New condition of replaced MD 28 bridge over Washington Run.
Sound Intensity Testing
Sound intensity (SI) measurements were made using the current accepted on-board sound
intensity (OBSI) technique AASHTO TP 76-08, which included dual vertical sound intensity
probes and an ASTM Standard Reference Test Tire (SRTT). Sound testing was done prior to
construction. A minimum of three runs were made in the right wheelpath of both directions with
two phase matched microphone probes simultaneously capturing noise data from the leading and
trailing tire/pavement contact areas. Figure 21 shows the dual probe instrumentation and the
tread pattern of the SRTT.

32
Figure 21. OBSI dual probe system and the SRTT.
The average of the front and rear SI values is computed over the full length of the bridge deck to
produce sound intensity values. Raw noise data were normalized for the ambient air temperature
and barometric pressure at the time of testing. The resulting mean sound intensity levels are A-
weighted to produce the noise-frequency spectra in 1/3 octave bands as shown in Figures Figure
22 and Figure 23 for the MD 28 and MD 450 projects, respectively. On board sound intensity
measurements were obtained from the bridges at the posted speed limit of 35 miles per hour (56
kilometers per hour) for the MD 28 project and 45 mph (72 km/h) for the MD 450 project.
Figure 22. MD 28 mean A-weighted sound intensity one-third octave frequency spectra.
315 400 500 630 800 1000 1250 1600 2000 2500 3150 4000
Pre-Rehab 70.1 75.0 79.5 82.9 87.6 86.2 83.8 83.3 80.3 76.6 72.7 68.9
65.0
70.0
75.0
80.0
85.0
90.0
Sou
nd
In
ten
sit
y,
dB
(A)
Frequency, Hz
33
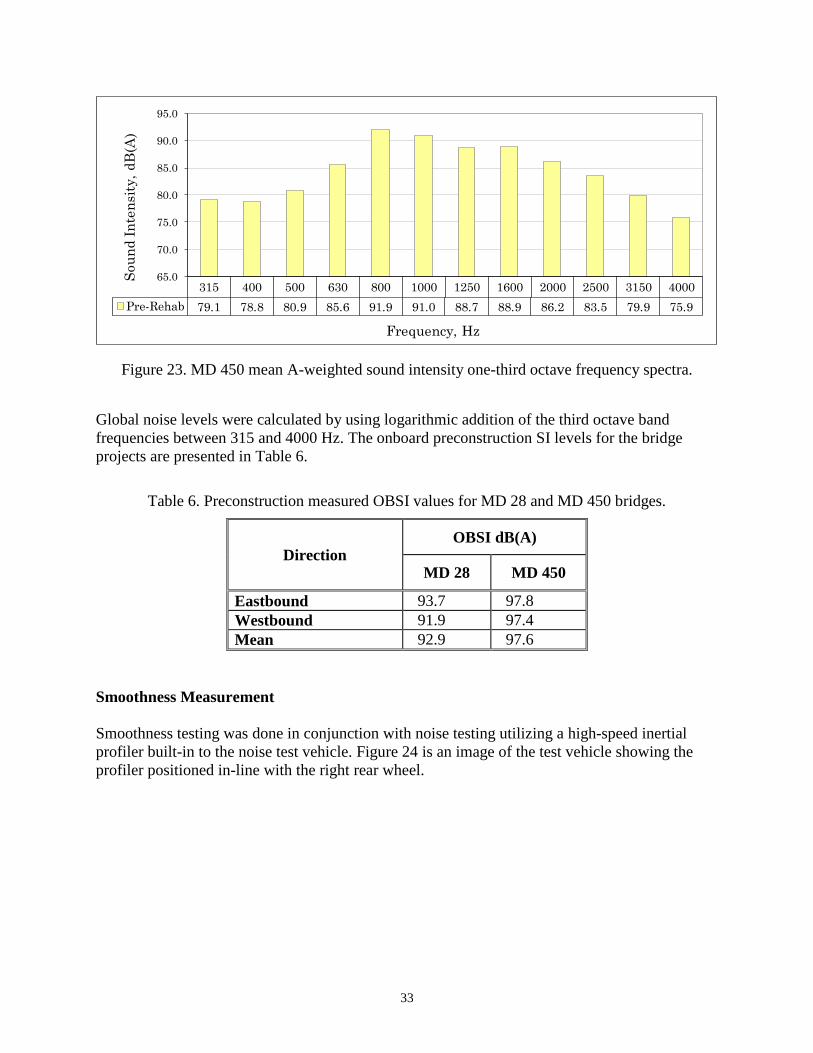
Figure 23. MD 450 mean A-weighted sound intensity one-third octave frequency spectra.
Global noise levels were calculated by using logarithmic addition of the third octave band
frequencies between 315 and 4000 Hz. The onboard preconstruction SI levels for the bridge
projects are presented in Table 6.
Table 6. Preconstruction measured OBSI values for MD 28 and MD 450 bridges.
Direction OBSI dB(A)
MD 28 MD 450
Eastbound 93.7 97.8
Westbound 91.9 97.4
Mean 92.9 97.6
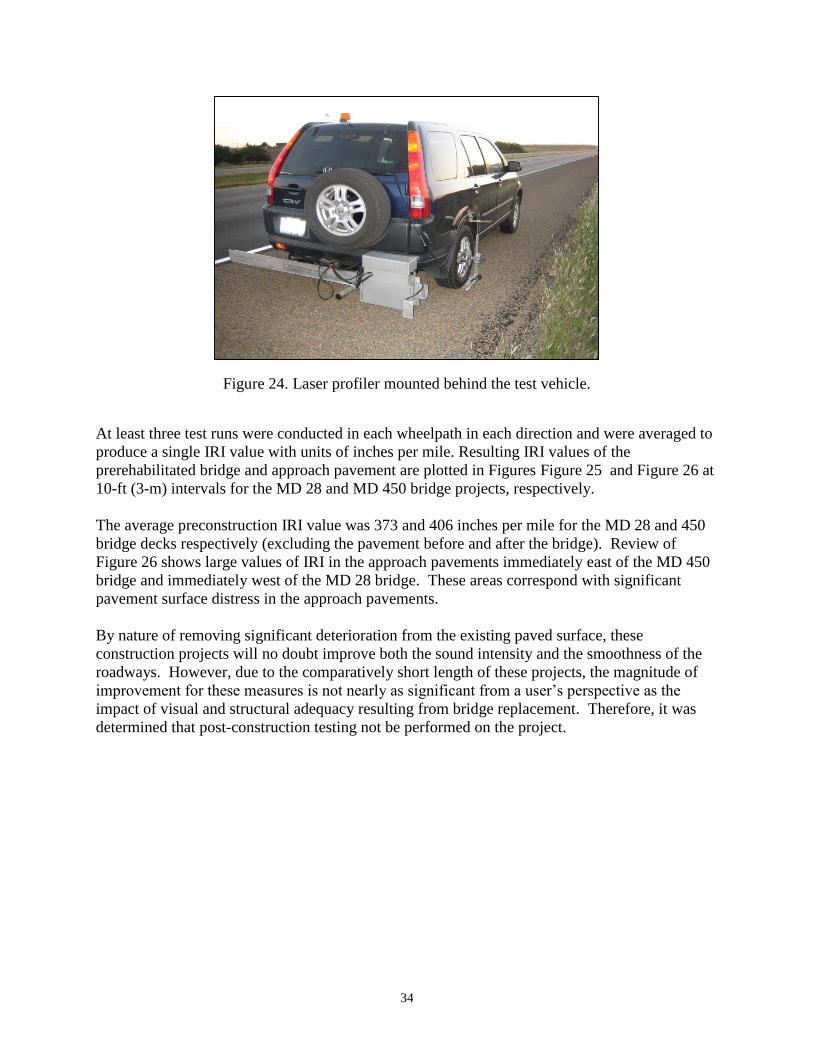
Smoothness Measurement
Smoothness testing was done in conjunction with noise testing utilizing a high-speed inertial
profiler built-in to the noise test vehicle. Figure 24 is an image of the test vehicle showing the
profiler positioned in-line with the right rear wheel.
315 400 500 630 800 1000 1250 1600 2000 2500 3150 4000
Pre-Rehab 79.1 78.8 80.9 85.6 91.9 91.0 88.7 88.9 86.2 83.5 79.9 75.9
65.0
70.0
75.0
80.0
85.0
90.0
95.0
Sou
nd
In
ten
sit
y,
dB
(A)
Frequency, Hz
34
Figure 24. Laser profiler mounted behind the test vehicle.
At least three test runs were conducted in each wheelpath in each direction and were averaged to
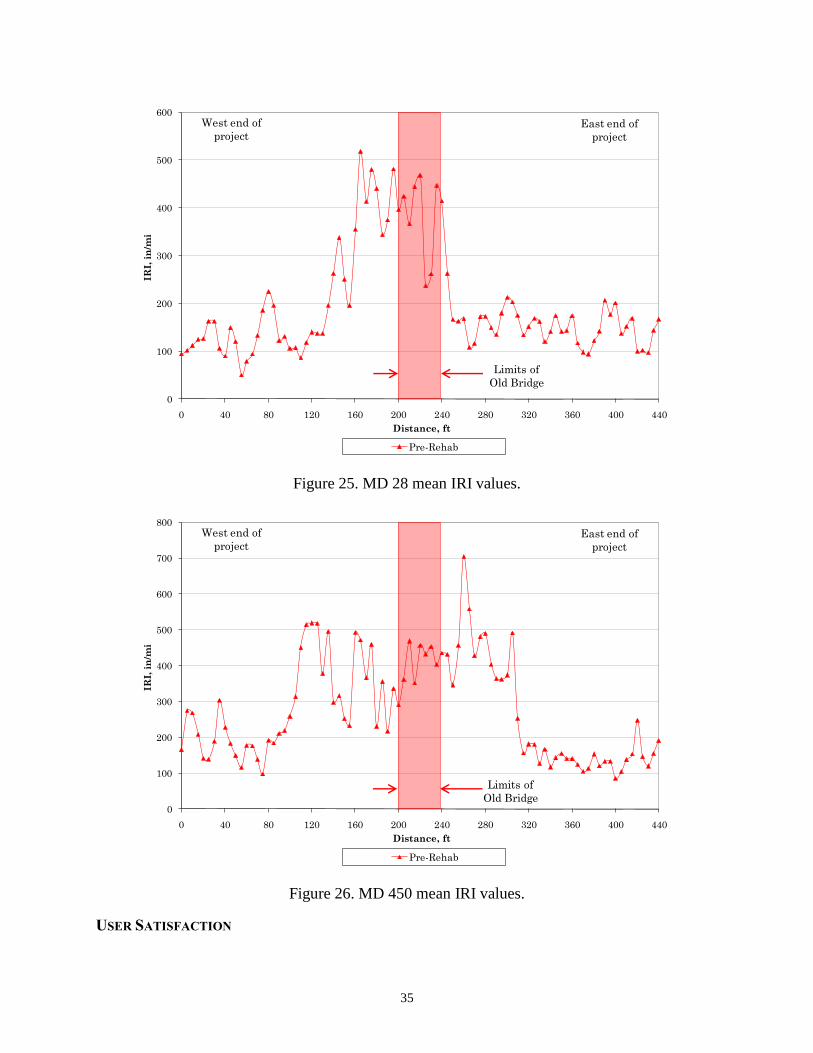
produce a single IRI value with units of inches per mile. Resulting IRI values of the
prerehabilitated bridge and approach pavement are plotted in Figures Figure 25 and Figure 26 at
10-ft (3-m) intervals for the MD 28 and MD 450 bridge projects, respectively.
The average preconstruction IRI value was 373 and 406 inches per mile for the MD 28 and 450
bridge decks respectively (excluding the pavement before and after the bridge). Review of
Figure 26 shows large values of IRI in the approach pavements immediately east of the MD 450
bridge and immediately west of the MD 28 bridge. These areas correspond with significant
pavement surface distress in the approach pavements.
By nature of removing significant deterioration from the existing paved surface, these
construction projects will no doubt improve both the sound intensity and the smoothness of the
roadways. However, due to the comparatively short length of these projects, the magnitude of
improvement for these measures is not nearly as significant from a user’s perspective as the
impact of visual and structural adequacy resulting from bridge replacement. Therefore, it was
determined that post-construction testing not be performed on the project.
35
Figure 25. MD 28 mean IRI values.
Figure 26. MD 450 mean IRI values.
USER SATISFACTION
0
100
200
300
400
500
600
0 40 80 120 160 200 240 280 320 360 400 440
IRI,
in
/mi
Distance, ft
Pre-Rehab
West end of
projectEast end of
project
Limits of
Old Bridge
0
100
200
300
400
500
600
700
800
0 40 80 120 160 200 240 280 320 360 400 440
IRI,
in
/mi
Distance, ft
Pre-Rehab
West end of
projectEast end of
project
Limits of
Old Bridge

36
As part of the community outreach efforts for these projects and in order to evaluate the
effectiveness of these projects in the eyes of the customer, MDSHA presented a two-stage
community relations plan to be performed in coordination with the HfL project goals. The first
effort was to focus on public meetings and informational project brochures to get the message
across to the community prior to execution of the project. This information was designed to
obtain public buy-in to the proposed bridge types, traffic/detour management, and project
schedule prior to advertisement of the project, while continuing to seek user input throughout
planning and construction as well.
Given a relatively short window of construction for these projects, MDSHA planned to execute
the second stage, user satisfaction surveys, entirely post construction. These surveys, in
coordination with HfL project goals, were to illustrate general user satisfaction via a performance
goal of 4+ on the Likert Scale regarding individual satisfaction of the new facility compared to
the condition of the old, and individual satisfaction of the project approach by minimizing
disruptions. Unfortunately, MDSHA has yet to perform post-construction user satisfaction
surveys in conjunction with the project work at either site.
However, both MDSHA project engineers and the MDSHA project coordinator reported a
general positive feedback from the community from initial communication and outreach plans
through construction to project completion. As an example, Figure 27 illustrates an unsolicited
letter received by MDSHA from a local business serving local residents in the area of the MD
450 project.

37
Figure 27. Example of positive community response to MD 450 project.
38
TECHNOLOGY TRANSFER
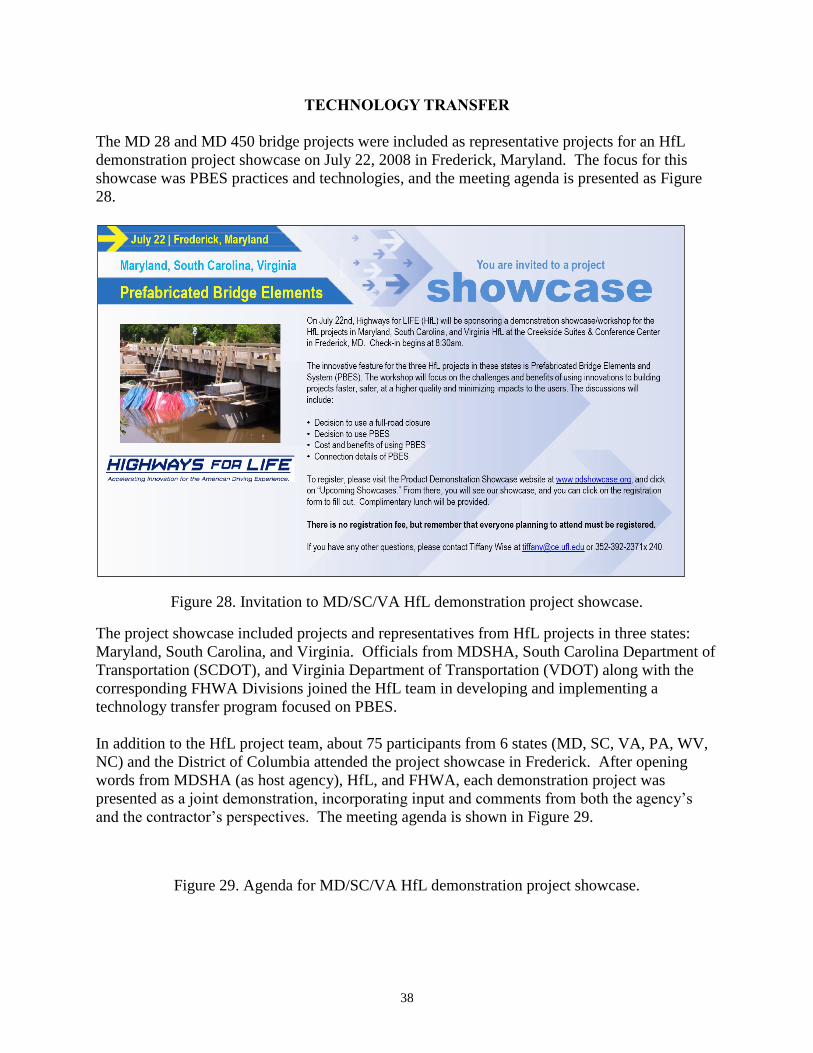
The MD 28 and MD 450 bridge projects were included as representative projects for an HfL
demonstration project showcase on July 22, 2008 in Frederick, Maryland. The focus for this
showcase was PBES practices and technologies, and the meeting agenda is presented as Figure
28.
Figure 28. Invitation to MD/SC/VA HfL demonstration project showcase.
The project showcase included projects and representatives from HfL projects in three states:
Maryland, South Carolina, and Virginia. Officials from MDSHA, South Carolina Department of
Transportation (SCDOT), and Virginia Department of Transportation (VDOT) along with the
corresponding FHWA Divisions joined the HfL team in developing and implementing a
technology transfer program focused on PBES.
In addition to the HfL project team, about 75 participants from 6 states (MD, SC, VA, PA, WV,
NC) and the District of Columbia attended the project showcase in Frederick. After opening
words from MDSHA (as host agency), HfL, and FHWA, each demonstration project was
presented as a joint demonstration, incorporating input and comments from both the agency’s
and the contractor’s perspectives. The meeting agenda is shown in Figure 29.
Figure 29. Agenda for MD/SC/VA HfL demonstration project showcase.

39
Doug Rose, Deputy Administrator of MDSHA, opened the workshop with a brief welcome
statement, followed by an overview of the HfL program by Nelson Castellanos, Delmar Division
Administrator of FHWA, summarizing the goals and intent of the showcase meeting as well as
the HfL program overall.
Vasant Mistry of FHWA gave a comprehensive presentation of the state of the industry for
PBES throughout the U.S. This presentation focused on the theme of accelerated bridge
construction and how these technologies have been utilized throughout the states, as well as
graphical depictions of using various PBES throughout construction staging. Finally, Mr. Mistry

40
discussed FHWA resources and initiatives available to promote the use of PBES, generally found
at www.fhwa.dot.gov/bridge/prefab.
Jeff Robert, Project Engineer & Coordinator for MDSHA, and Butch Lundgren of Concrete
General, Inc. delivered an overview presentation of the MD 28 and MD 450 projects. This
presentation covered the pre-design summary of the projects, including site photos, traffic impact
and MOT alternative studies, and comparative projects of similar scope. Mr. Robert and Mr.
Lundgren also presented the review and application of strategies to these projects within the HfL
program goals, primarily focused on public awareness and the utilization of PBES, from both the
agency and contractor perspectives.
Khossrow Babaei and Robert Price of VDOT presented the US 15/29 over Broad Run bridge
project. Special focus was given to the review and justification of multiple PBES construction
alternatives and the corresponding MOT alternatives given various construction staging options.
Additional discussion included details and photos of handling various construction issues (i.e.
high water, beam conflicts) and the extension of abutments and piers for bridge widening.
Bener Amado and Randy Cannon of SCDOT presented their project on SC 377 near
Williamsburg, South Carolina. Major focus areas of this presentation included innovative
contract bidding and incentive/disincentive clauses for schedule performance and the use of self-
consolidating concrete (SCC) in beam fabrication. This presentation also included significant
comments from the contractor’s perspective of all aspects of the project.
The project showcase was originally scheduled for this day in Frederick in hopes to coordinate
with the MD 28 project and make a site visit to the project location on the day that the precast
slabs were to be placed. However, unforeseen project delays were realized as a result of
inaccurate determination of bedrock depth for pile placement at the time of abutment
construction. Therefore, the project was behind schedule and the site visit was replaced on the
showcase agenda with a slideshow presentation of the project activities to date from Jerry
Burgess, the MD 28 Field Project Engineer for MDSHA.

41
ECONOMIC ANALYSIS
A key aspect of HfL demonstration projects is quantifying, as much as possible, the value of the
innovations deployed. This entails comparing the benefits and costs associated with the
innovative project delivery approach adopted on an HfL project with those from a more
traditional delivery approach on a project of similar size and scope. The latter type of project is
referred to as a baseline case and is an important component of the economic analysis. Common
bridge replacement projects of this type in Maryland are traditionally performed by maintaining
one lane of signalized two-way traffic. This scenario is regarded as the “baseline” for this study.
For this economic analysis, MDSHA provided all of the supporting cost figures. Unfortunately,
this contract has not yet closed and the as-built cost figures are not yet available for the project
due to contract management difficulties referenced earlier in the report. Therefore, many
assumptions and bases of comparison rely on a similar economic analysis study performed by
Sabra, Wang & Associates, Inc. included in the previously-referenced report, “MD 28 over
Washington Run: Maintenance of Traffic Alternatives Analysis”. Additional supporting data has
been obtained from MDSHA project engineers and is referenced accordingly.
CONSTRUCTION TIME
As shown in Table 4 previously, the typical project duration anticipated for a bridge replacement
project of this size is approximately 15 months. Actual construction time required for the MD 28
and MD 450 bridge projects were approximately 4 and 3 months, respectively. One month delay
in the MD 28 project was caused by significant underestimation of required pile depth, and
otherwise followed the 3 month schedule for planned construction activities. Therefore, the
practices and methods used on these projects reduced construction time by nearly a full year.
The most significant impact on construction time reduction is due to operating within a full
roadway closure. This allowed the contractor to perform all functions (i.e. material movement
and storage, MOT establishment, earthwork, construction) within a single phase of construction
and afforded greater freedom to operate by eliminating traffic through the work zone. Additional
reductions in construction time were possible through the use of prefabricated bridge elements
and incentive contracting, which were attributed to an additional 25% reduction in constructing
the superstructure (15 days vs. 20 days for the traditional method).
CONSTRUCTION COSTS
Since the contract has not closed, as-built construction costs are not yet available for either
project. However, MDSHA has provided comparative construction costs for analysis in a couple
of methods. Some of the data used in our economic analysis is based upon estimates originally
provided for planning and engineering purposes prior to the establishment of this project as an
HfL project, and has been revisited and consulted with MDSHA engineers prior to incorporation
in this report.
Table 7 differentiates construction costs for superstructure elements, based solely on the
difference between using prefabricated bridge elements (as-built) and using a traditional steel

42
beam bridge (baseline), illustrating a targeted cost savings of $16,000 in superstructure
construction costs as a result of utilizing prefabricated superstructure elements.
Table 7. Comparison of MD 28 bridge superstructure construction costs.
As-built Baseline
Prestressed Slab Bridge Costs Steel Beam Bridge Costs
Prestressed slabs $264,000 Structural steel $220,000
Superstructure concrete $84,000 Superstructure concrete (8”
desk) $115,000
Metal railing $32,000 Superstructure reinforcing
steel $24,000
Shear studs $5,000
Metal railing $32,000
Total Superstructure Costs $380,000 $396,000 Notes:
1. Information in this table presented by MDSHA at HfL Showcase presentation.
The MDSHA Office of Bridge Design provided comparative estimated construction costs for
various construction alternatives considered in the MD 28 MOT Alternatives Analysis study.
These numbers were used to capture the expected difference in total roadway and structural
construction costs based on the number of phases of construction dictated by MOT alternative.
Table 8 summarizes these comparative costs between the as-built and baseline MOT alternatives,
with the as-built scenario providing an expected cost savings of $310,000 over the baseline
scenario.
Table 8. Comparison of MD 28 structural and roadway construction costs.
MOT Alternative Total Structural &
Roadway Cost
Full closure with detour $1,240,000
One lane, two-way traffic (temporary signal) $1,550,000
Notes:
1. Information in this table is referenced directly from “MD 28 over Washington Run: Maintenance of
Traffic Alternative Analysis”, Sabra, Wang & Associates, Inc., dated April 2007.
It is assumed that the combined effect of cost savings for both utilizing prefabricated bridge
elements and constructing the bridge within a full roadway closure will result in a total cost
savings of roadway and bridge construction of approximately $326,000.
USER COSTS

43
The MD 28 MOT Alternatives Analysis study included a detailed economic analysis section,
with calculations and comparative analysis performed to quantify delay, fuel consumption, and
safety costs as user costs. This analysis was conducted on behalf of MDSHA and submitted for
consideration, based upon valid assumptions and analysis inputs (i.e. accident rates, unit costs)
deemed appropriate for the State of Maryland. Therefore, the user costs determined by Sabra,
Wang & Associates have been reviewed, summarized, and included in our analysis as follows.
Delay and Fuel Costs
Total delay and fuel costs for the traveling public were determined for the MD 28 project based
on the following assumptions:
Cost of user delay = $12.10 per hour
Cost of fuel = $2.75 per gallon
Detour volume per peak hour = 500 vehicles
(Peak hour volume / total daily volume) = 8%
Average fuel economy = 20 miles per gallon
5 workdays per week
Table 9 summarizes the delay and fuel cost calculations between the as-built and baseline
scenarios. As is expected in the case of a full detour, the as-built scenario more than doubles the
delay and user costs of the baseline scenario, increasing user costs by $475,650.
Table 9. Comparison of MD 28 bridge delay and fuel consumption user costs.
Item As-built Baseline
Individual Delay (hours per vehicle) 0.167 0.0167
Individual Delay Cost ($12.10 x individual delay) $2.02 $0.20
Peak Hour Delay Cost (500 veh. x ind. delay cost) $1,010 $100
Fuel Consumption (7.5 miles / 20 miles per gallon) 0.375 0
Individual Fuel Cost ($2.75 x fuel consumption) $1.03 $0.00
Peak Hour Fuel Cost (500 veh. x ind. fuel cost) $515 $0
Peak Hour Delay & Fuel Cost $1,525 $100
Daily Delay & Fuel Cost (peak hour delay & fuel cost / 8%) $19,063 $1,250
Total Days (Project Duration x [5 workdays / 7 days]) 46 321
Total Delay & Fuel Cost (daily delay & fuel cost x total days) $876,900 $401,250 Notes:
Information in this table is based upon data obtained from “MD 28 over Washington Run: Maintenance of
Traffic Alternative Analysis”, Sabra, Wang & Associates, Inc., dated April 2007. Calculations and rounding for
our analysis result in slightly different numbers than those shown in the referenced report.
Safety Costs
In their study, Sabra, Wang & Associates performed a comparative safety analysis between
methods, based on a one-mile project length on and adjacent to the MD 28 bridge, considering

44
the various MOT methods and the following analysis inputs based on MDSHA accident data
available for a two-lane, two-way, rural non-divided highway:
Project length = 1 mile
Average daily traffic = 6,000 vehicles per day
Average accident cost = $150,000
Average fixed-object statewide accident rate = 7.42 per million vehicle miles traveled
The standard rate of accidents for a typical section of highway with no construction work is
calculated as:
Rate = (7.42 x 6,000 veh/day x 1 mile x 30 days/month) / 1,000,000 = 1.33 per month.
It was presumed that the presence of a maintained work zone throughout the project site will
nearly double the incident rate, resulting in an expected additional one accident per month at a
minimum. Therefore, the determined safety cost for the baseline scenario is calculated as:
Baseline cost = (1 accident per month x $150,000 x 15 months) = $2,250,000
In the as-built scenario with a full roadway closure, there will be no accidents within the project
limits; however, the increase of detour traffic throughout the immediate area will have an
effective increase on accidents, particularly at intersections in the immediate area. Sabra, Wang
& Associates reported an expected increase in accident rates, based on MDSHA crash data, of 3
accidents per month for the detour route. Therefore, the determined safety cost for the as-built
scenario is calculated as:
As-built cost = (3 accidents per month x $150,000 x 2 months) = $900,000
The expected cost savings in safety user costs from employing the full roadway closure and
constructing the bridge utilizing PBES construction methodologies is the cost differential
between the baseline and as-built costs calculated above, or $1,350,000.
COST SUMMARY
Construction costs for the MD 28 project would have likely placed traditional delivery and
construction methods (baseline) at $326,000 more than the as-built case. Moreover, utilizing a
full roadway closure increase delay and fuel costs by $475,650, but realized in additional cost
savings of $1,350,000 in safety user costs. Sabra, Wang & Associates also reported a difference
in estimated work zone cost of $426,500 for the baseline scenario and $137,000 for the as-built
scenario, resulting in an additional planned cost savings of $289,500.
Therefore, the estimated total savings from using the innovative HfL project delivery approach
are approximately $1.49 million for the MD 28 project alone, with a baseline total cost of $4.63
million. It is expected that a detailed analysis with as-built data for the MD 450 project would
yield similar results. In other words, the innovative approach to these projects had an
approximate 32 percent cost benefit over traditional methods.