maryland food system profile ii frederick county, md
TRANSCRIPT

CLF January 2016
Frederick County, MD
DEMOGRAPHICS Frederick Maryland % of MD Total County Ranking
Population, 2010-2014 ACS Five-Year Estimatea 239,253 5,887,776 4.06% 8
% Population Change, 2000-2010b 19.5% 9.0% 3
Number of Households, 2010-2014 ACS Five-Year Estimatea 234,759 5,747,580 4.08% 8
Population Density (People / Square Mile), 2010b 353.50 594.77 10
% Non-Hispanic, 2010-2014 ACS Five-Year Estimatea 92.1% 91.2% 22
◼ % White Alone 76.5% 53.6% 13
◼ % Black or African American Alone 8.5% 29.0% 19
◼ % Asian Alone 4.2% 5.8% 4
% Hispanic (any race), 2010-2014 ACS Five-Year Estimatea 7.9% 8.8% 3
Median Household Income, 2010-2014 ACS Five-Year Estimatea $84,480 $74,149 9
Self-Sufficiency Standard (2 Adults, 2 School-Age Children), 2012c,1 $68,435 (U) 6
% Individuals Below 185% of Federal Poverty Level, 2010-2014 ACS Five-Year Estimate; Household of 4=$44,123)a,2
15.77% 20.74% 17
% Individuals Below 200% of Federal Poverty Level, 2010-2014 ACS Five-Year Estimate; Household of 4=$47,700)a,2
17.50% 22.80% 18
% Unemployment, 2010-2014 ACS Five-Year Estimatea 6.3% 8.0% 21
% Households without Vehicle, 2010-2014 ACS Five-Year Estimatea 5.0% 9.4% 16
Demographics
HEALTH STATISTICS Frederick Maryland % of MD Total County Ranking
Overall Mortality / 100,000 Population (Age-Adjusted), 2013d 669.6 708.3 21
Heart Disease Mortality / 100,000 Population (Age-Adjusted), 2013d 168.5 171.7 18
Diabetes Mortality / 100,000 Population (Age-Adjusted), 2013d 12.8 19.6 18
Rate of Obesity, 2012e 29.75% 28.30% 14
Rate of Diabetes, 2012e 9.32% 10.00% 14
Health Statistics
Maryland Food System Profile II
These county profiles present the data compiled by the Maryland Food System Map Project, at the Johns Hopkins Center for a Livable Future. They are intended to be used for education, research, policy development, and community organizing purposes. For more information go to: www.mdfoodsystemmap.org.

FOOD AVAILABILITY - FOOD ACCESS Frederick Maryland % of MD Total County Ranking
% Population Living in a USDA Food Desert, 2010h,7 2.24% 27.34% 21
% Population that is Food Insecure, 2013i,8 8.4% 12.8% 19
Average Cost of a Meal ($), 2013i,9 $2.94 (U) 14
FOOD AVAILABILITY - FOOD STORES AND RESTAURANTS Frederick Maryland % of MD Total County Ranking
Total Number of Food Stores, 2014f 108 3,784 2.85% 7
◼ Number of Supermarkets (Chains, Supercenters, and International)3 30 696 4.31% 8
◻ Supermarkets / 1,000 Population 0.13 0.12 12
◻ % Supermarkets (Number of Supermarkets / Total Food Stores) 27.78% 18.39% 6
◼ Number of Convenience Stores (Chains, Gas Stations, Drug Stores, and Dollar-Discount)4
53 1,700 3.12% 7
◼ Number of Small Grocery Stores ("Mom and Pop" Stores, Corner Stores)5 12 1,124 1.07% 13
◼ Number of Other Food Stores (Conventional Club, Military Commissaries, and Mixed Markets)6
4 63 6.35% 6
Number of Fast Food Chain Restaurants, 2013g 84 1,757 4.78% 6
◼ Fast Food Chain Restaurants / 1,000 Population 0.35 0.30 10
Food Availability
Food Stores by Type
Supermarkets
Convenience Stores
Small Grocery Stores
Other Food Stores
30
53
12
4
Food Stores by Type
2 FREDERICK COUNTY FOOD SYSTEMS PROFILE

FOOD AVAILABILITY - NUTRITION ASSISTANCE Frederick Maryland % of MD Total County Ranking
Average Number of Monthly SNAP Participants, 2014j 20,384 788,871 2.58% 9
% Population Participating in SNAP, 2015 State Fiscal yeark 8.4% 13.0% 20
% SNAP Participation Among Low-Income Residents, 2015 State Fiscal yeark 59.4% 65.9% 17
Number of SNAP Authorized Stores, 2014l 103 3,405 3.02% 7
◼ SNAP Authorized Stores / 1,000 population 0.43 0.58 21
Number of WIC Authorized Stores, 2015m 23 717 3.21% 8
Number of Pantry & Free Meal Sites, 2013g 12 1,069 1.12% 17
AGRICULTURE - GENERAL CHARACTERISTICS Frederick Maryland % of MD Total County Ranking
Total Number of Farms, 2012n 1308 12,256 10.67% 1
Acres of Land in Farms, 2012n 181,512 2,030,745 8.94% 1
% of Land in Farms, 2012n 43.00% 32.50% 7
Average Farm Size (Acres), 2012n 139 166 12
Acres of Cropland Harvested, 2012n 117,194 1,280,965 9.15% 2
Agriculture
AGRICULTURE - OPERATORS AND LABOR Frederick Maryland % of MD Total County Ranking
Average Age of Primary Farm Operator, 2012n 58.9 59.0 16
% Female Primary Operator, 2012n 18.20% 18.73% 12
Operators by Primary Occupation, 2012n
◼ % Farming 47.63% 48.92% 15
◼ % Other 52.37% 51.08% 9
Total Number of Hired Workers (Excludes Contract Labor), 2012n 1,362 14,705 9.26% 1
Total Number of Farms with Migrant Labor, 2012n 14 133 10.53% 2
FREDERICK COUNTY FOOD SYSTEMS PROFILE 3
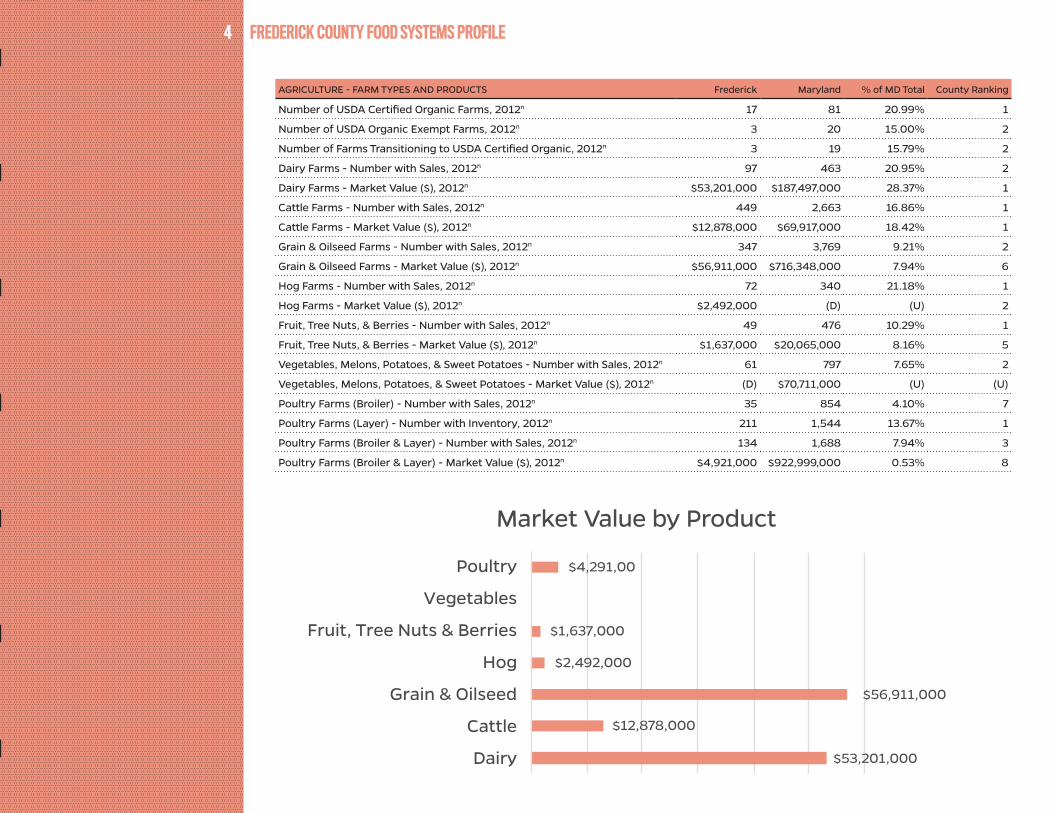
AGRICULTURE - FARM TYPES AND PRODUCTS Frederick Maryland % of MD Total County Ranking
Number of USDA Certified Organic Farms, 2012n 17 81 20.99% 1
Number of USDA Organic Exempt Farms, 2012n 3 20 15.00% 2
Number of Farms Transitioning to USDA Certified Organic, 2012n 3 19 15.79% 2
Dairy Farms - Number with Sales, 2012n 97 463 20.95% 2
Dairy Farms - Market Value ($), 2012n $53,201,000 $187,497,000 28.37% 1
Cattle Farms - Number with Sales, 2012n 449 2,663 16.86% 1
Cattle Farms - Market Value ($), 2012n $12,878,000 $69,917,000 18.42% 1
Grain & Oilseed Farms - Number with Sales, 2012n 347 3,769 9.21% 2
Grain & Oilseed Farms - Market Value ($), 2012n $56,911,000 $716,348,000 7.94% 6
Hog Farms - Number with Sales, 2012n 72 340 21.18% 1
Hog Farms - Market Value ($), 2012n $2,492,000 (D) (U) 2
Fruit, Tree Nuts, & Berries - Number with Sales, 2012n 49 476 10.29% 1
Fruit, Tree Nuts, & Berries - Market Value ($), 2012n $1,637,000 $20,065,000 8.16% 5
Vegetables, Melons, Potatoes, & Sweet Potatoes - Number with Sales, 2012n 61 797 7.65% 2
Vegetables, Melons, Potatoes, & Sweet Potatoes - Market Value ($), 2012n (D) $70,711,000 (U) (U)
Poultry Farms (Broiler) - Number with Sales, 2012n 35 854 4.10% 7
Poultry Farms (Layer) - Number with Inventory, 2012n 211 1,544 13.67% 1
Poultry Farms (Broiler & Layer) - Number with Sales, 2012n 134 1,688 7.94% 3
Poultry Farms (Broiler & Layer) - Market Value ($), 2012n $4,921,000 $922,999,000 0.53% 8
$53,201,000
$12,878,000
$56,911,000
$2,492,000
$1,637,000
$4,291,00
Dairy
Cattle
Grain & Oilseed
Hog
Fruit, Tree Nuts & Berries
Vegetables
Poultry
Market Value by Farm TypeMarket Value by Product
4 FREDERICK COUNTY FOOD SYSTEMS PROFILE

AGRICULTURE - LARGE-SCALE LIVESTOCK Frederick Maryland % of MD Total County Ranking
Number of Broiler Chicken CAFOs, 2015o,11* 0 486 0.00% 10
Number of Broiler Chicken MAFOs, 2015o,11* 0 23 0.00% 6
Number of Layer Hen CAFOs, 2015o,11* 0 5 0.00% 4
Number of Dairy Cattle CAFOs, 2015o,11* 6 16 37.50% 1
Number of Dairy Cattle MAFOs, 2015o,11* 0 1 0.00% 2
Number of Beef Cattle CAFOs, 2015o,11* 2 6 33.33% 1
Number of Hog CAFOs, 2015o,11* 0 1 0.00% 2
AGRICULTURE - ECONOMICS Frederick Maryland % of MD Total County Ranking
Number of Small Farms (Market Value <$50,000), 2012n 1,022 9,190 11.12% 1
Number of Mid-Sized Farms ($50,000 - $499,999), 2012n,10 213 1,851 11.51% 1
Number of Large Farms ($500,000 or more), 2012n 73 1,215 6.01% 7
Total Market Value of Agricultural Products Sold, 2012n $150,459,000 $2,271,397,000 6.62% 7
◼ Average Per Farm $115,030 $185,329 12
Net Cash Farm Income of Operations, 2012n $28,226,000 $477,002,000 9
◼ Average Per Farm $21,579 $38,920 13
Government Payouts - Total Federal Dollars, 2012n $3,060,000 $36,024,000 8.49% 4
◼ Average Per Farm Receiving Funds $6,970 $7,784 14
◼ Number of Farms Receiving Funds 439 4,628 9.49% 1
1,022
213
73
Farms by Size (by Market Value)
Small Farms
Mid-Sized Farms
Large Farms
Farms by Size (by Market Value)
FREDERICK COUNTY FOOD SYSTEMS PROFILE 5

PROCESSING AND DISTRIBUTION Frederick Maryland % of MD Total County Ranking
Total Number of Food Processing Facilities, 2015q,13* 29 623 4.65% 7
◼ Number of Facilities that Process Dairy 3 51 5.88% 6
◼ Number of Facilities that Process Seafood 1 168 0.60% 19
◼ Number of Facilities that Process Meat 16 145 11.03% 2
Animal Slaughter Facilities, 2015q,13* 12 69 17.39% 1
Food Distribution and Warehouses, 2015q,13* 30 521 5.76% 8
◼ Number of Distributors that Source Locally 6 65 9.23% 3
Processing and Distribution
AGRICULTURE - LOCAL FOOD Frederick Maryland % of MD Total County Ranking
Farm Products Sold Directly - Number of Farms, 2012n 167 1,276 13.09% 1
Farm Products Sold Directly - Market Value, 2012n $2,803,000 $28,038,000 10.00% 4
Number of Agritourism Operations, 2012n 23 307 7.49% 2
Average $ / Agritourism Operation, 2012n $18,783 $23,638 8
Number of Farmers Markets, 2015p 11 145 7.59% 5
Total Number of Farms Selling Locally, 2015q,12 126 1,178 10.70% 2
◼ Farms that are USDA Certified Organic 13 65 20.00% 1
◼ Farms that Sell at Farmers Markets 40 447 8.95% 3
◼ Farms that Sell Through Community Supported Agriculture 17 166 10.24% 3
◼ Dairy Farms that Sell Locally 7 92 7.61% 3
◼ Livestock & Poultry Farms that Sell Locally 82 578 14.19% 1
INSTITUTIONS Frederick Maryland % of MD Total County Ranking
Number of Hospitals, 2015r 1 63 1.59% 13
Number of Colleges/Universities, 2015s 3 56 5.36% 5
Number of Public K12 Schools, 2012-2013t 69 1,437 4.80% 7
Public K12: % Students Free and Reduced-Lunch Eligible, 2012-2013u 25.39% (U) 21
Public K12: Number Participating in Maryland Meals for Achievement, 2012-2013u 10 471 2.12% 12
Public K12: % Eligible Participating in Maryland Meals for Achievement, 2012-2013u 58.8% 55.6% 17
Public K12: Number of Breakfasts and Lunches Served Annually, 2012-2013v 3,016,549 89,013,961 3.39% 9
Institutions
6 FREDERICK COUNTY FOOD SYSTEMS PROFILE

ENVIRONMENT - BEST MANAGEMENT PRACTICES Frederick Maryland % of MD Total County Ranking
Cover Crops (Acres/Year), 2014y,14 32,939.40 418,590.30 7.87% 6
Nutrient Management on Pasture (Acres/Year), 2014y,14 10,115.00 59,438.30 17.02% 1
Soil Conservation and Water Quality Plans (Acres/Year), 2014y,14 72,976.00 914,065.90 7.98% 3
ENVIRONMENT - LAND PRESERVATION Frederick Maryland % of MD Total County Ranking
Maryland DNR and Conservation Easements, Total Acreage, 2013w 11,799.01 532,721.06 2.21% 12
MALPF Easements, Total Acreage, 2013w 18,686.00 299,946.00 6.23% 5
Maryland Environmental Trust Easements, Total Acreage, 2013w 8,228.94 129,693.13 6.34% 6
Maryland Rural Legacy Properties, Total Acreage, 2014x 4,518.07 81,796.03 5.52% 7
Maryland Rural Legacy Areas, Total Acreage, 2014x 66,418.04 902,580.62 7.36% 5
Environment
ENVIRONMENT - AIR AND WATER QUALITY Frederick Maryland % of MD Total County Ranking
Ammonia from Fertilizer Application (Tons), 2011z 288.94 2,827.17 10.22% 1
Ammonia from Livestock Waste (Tons), 2011z 1,451.91 19,886.77 7.30% 7
Airborne PM2.5
from Crop and Livestock Dust (Tons), 2011z,15 201.16 2,791.47 7.21% 7
% Population on Private Well, 2010aa 41.1% 18.5% 12
Total Number of Watersheds, 2012ab,16 6 123 4.88% 18
◼ Number in Good Health* 0 2 0.00% 4
◼ Number in Fair Health 1 59 1.69% 21
◼ Number in Poor Health 5 62 8.06% 6
0
1
5
Watershed Health
Good Health
Fair Health
Poor Health
Watershed Health
FREDERICK COUNTY FOOD SYSTEMS PROFILE 7

8 | Frederick County Food Systems Profile
The data sources for the Maryland Food System County Profiles are as follows: (a) The American Community Survey, 2010-2014 Five-Year Estimate(b) The United States Census, 2010 (c) Center for Women’s Welfare, 2012(d) Maryland Department of Health and Mental Hygiene, 2013(e) Maryland Behavioral Risk Factor Surveillance System, 2012(f) Center for a Livable Future’s Maryland Food System Map Project, 2014(g) Center for a Livable Future’s Maryland Food System Map Project, 2013(h) USDA Food Access Research Atlas, 2010(i) Feeding America, 2013(j) Maryland Hunger Solutions, 2014(k) Maryland Hunger Solutions, 2015(l) USDA Food and Nutrition Service SNAP Retailer Locator, 2014(m) Maryland Department of Health and Mental Hygiene, 2015(n) USDA National Agricultural Statistics Service, Census of Agriculture, 2012(o) Maryland Department of the Environment, 2015(p) The Maryland Farmers Market Association, 2015(q) Center for a Livable Future’s Maryland Food System Map Project, 2015(r) Maryland State Archives, 2015(s) Maryland Higher Education Commission, 2015(t) Maryland Public School System websites, 2013(u) Maryland Hunger Solutions, 2013(v) Maryland Department of Education, 2013(w) Maryland Department of Natural Resources, 2013(x) Maryland Department of Natural Resources, 2014(y) Maryland Department of Agriculture, 2014(z) United States Environmental Protection Agency, 2011(aa) United States Geological Survey, 2010(ab) Maryland Department of Natural Resources, 2012

9 | Frederick County Food Systems Profile
Footnotes1. The Self-Sufficiency Standard determines the amount of income required for working
families to meet basic needs at a minimally adequate level, taking into account family composition, ages of children, and geographic differences in costs. This does not include public subsidies or informal/private assistance.
2. Eligibility criterion for food and other federal supplement programs and benefits varies by household size, based on a percentage of the Federal Poverty Level.
3. “Supermarkets” are large-format grocery stores with all food departments present, in-cluding produce, meats, seafood, canned goods and packaged goods. Supermarkets are typically chain stores but may also be supercenters and international stores; these stores have annual sales of $2 million or more and have 3 or more cash registers.
4. The “Convenience Stores” category includes a variety of stores that sell food products, but food is not their main business. These stores include chain convenience stores, gas station convenience stores, pharmacies, and discount/dollar stores. They are typically chain operated.
5. “Small Grocery Stores,” sometimes called “mom & pop” stores or corner stores, are small format grocery stores that are typically independently owned and operated. They have annual sales of less than $2 million and have limited food departments.
6. The “Other Food Stores” category include Conventional Club stores (i.e. BJ’s), Military Commissaries, mixed markets, and public markets.
7. USDA Food Deserts are defined as low-income census tracts where residents are >0.5 miles (urban) or >10 miles (rural) from the nearest supermarket.
8. Feeding America’s Map the Meal Gap’s food insecurity rates are determined using data from the 2001-2013 Current Population Survey on individuals in food insecure house-holds; 2009-2013 American Community Survey five year estimates on median house-hold incomes, poverty rates, homeownership, and race and ethnic demographics; and 2013 American Community Survey one year estimates on unemployment rates.
9. The average dollar amount spent on food per week by food secure individuals is divided by 21 (3 meals per day x 7 days per week) weighted by the “cost-of-food index” to derive a localized estimate. Food expenditures for food secure individuals were used to ensure that the result best reflected the cost of an adequate diet.
10. Agriculture of the Middle (AOTM) encompasses a spectrum of farms and ranches that are declining because they are too small to be served well by commodity markets and too large to be served well by direct markets. Most farms are in the $50,000-$500,000 range of gross sales. See agofthemiddle.org for more information.
11. An Animal Feeding Operation (AFO) means a feedlot where: Non-aquatic animals are confined, fed, and maintained for at least 45 days in any 12-month period; and crops vegetation, forage growth, or post-harvest residues are not sustained in the normal growing season over any portion of the lot or facility. There are two types of AFOS: Confined Animal Feeding Operation and Maryland Animal Feeding Operation. Confined Animal Feeding Operations are medium or large AFO’s that discharge or “propose to discharge” manure, litter, or process wastewater. “Propose” to discharge means that your facility is designed, constructed, operated, or maintained, such that a discharge to
surface waters of the State WILL occur. Maryland Animal Feed Operations (MAFO) are large animal feeding operations that do not discharge or “propose to discharge” manure, litter, or process wastewater.
◼ Broiler Chickens AFO with dry manure ranges: medium = 37,500-124,999 birds/farm or <100,000 ft2, large = >125,000 birds/farm or ≥100,000 ft2.
◼ Layer Hen AFO ranges: medium = 25,000-81,999 animals/farm, large = 82,000 or more animals/farm.
◼ Dairy Cattle AFO ranges: medium = 200-699 animals/farm, large = 700+ animals/farm.
◼ Beef Cattle AFO ranges: medium = 300-999 animals/farm, large = 1000 or more animals/farm.
◼ Hog AFO ranges: 750 or more animals/farm, dependent on weight of animals.12. Farms that grow and sell food locally in some manner. The list is derived from online
research, last updated in summer 2015. The list is not entirely comprehensive, as not all local farms have information available on the Internet.
13. Food processing and distribution facility lists were derived from multiple federal, state and county level food permit lists. Categories of food processing facilities, slaughter facilities, and distribution and storage facilities are neither mutually exclusive nor an exhaustive list of every possible type of facility.
14. The Maryland Department of Agriculture collects data on Best Management Practices for conservation, 3 of which are listed, as part of an effort to restore the health of the Chesapeake Bay Watershed.
15. Data for crop and livestock dust emissions of Particulate Matter <2.5 microns (PM2.5).16. The number of watersheds comprises all watersheds present in the county, including
those that cross county borders.
Symbols(D) Data withheld to avoid disclosing data for individual farms (Census of Agriculture only)(U) Data unavailable *Many Maryland counties do not have any data or locations in this category, making the County Ranking for this category deceptively high for counties that have a value of 0. For example, there are only 4 dairy cow CAFOs in Maryland so any county with 0 CAFOs is tied for 5th place.

The Johns Hopkins Center for a Livable Future promotes research and develops and communicates information about the complex interrelationships among diet, food production, the environment and human health. We advocate for policies that protect health, the global environment and the ability to sustain life for future generations.
Image credit: “2006 09 19 - Annapolis - Sunset over State House” by Thisisbossi - Own work. Licensed under CC BY-SA 2.5 via Commons - https://commons.wikimedia.org/wiki/File:2006_09_19_-_Annapolis_-_Sunset_over_State_House.JPG#/media/File:2006_09_19_-_Annapolis_-_Sunset_over_State_House.JPG
CLF January 2016