brian k. chen, stanford university paul j. gertler, university of california at berkeley chun-yuh...
TRANSCRIPT

Brian K. Chen, Stanford UniversityPaul J. Gertler, University of California at BerkeleyChun-Yuh Yang, Kaohsiung Medical UniversityStanford University APARC Seminar SeriesMay 17, 2011

Medicare/Medicaid vulnerable to waste, abuse and fraud From active fraud to subtle abuses and waste
Moral hazard and the “fraudulent expert problem” Informational asymmetry, insurance, fee-for-service Self-referrals and overutilization
Role of legal restrictions in reducing waste Can prohibition against self-referrals reduce
overutilization? What is the impact of legally sanctioned “safe
harbor” exceptions?

Overutilization or Satisfaction of Unmet Demand? Definition of Overtreatment (McGuire 2000) Chou et al (2003), Hillman et al (1992), Mitchell and Sass (1995),
Gazelle et al (2007), Mitchell (2008), GAO-08-452 (2008)
Moral Hazard or Economies of Scope? Afendulis and Kessler (2007), Taylor (1995), Wolinsky (1993)
Critique of existing research “The studies finding high rates of self-referrals do not necessarily
establish that the additional services provided were unnecessary, only that they were in excess of services provided in the absence of self-referrals” – Barry Furrow
Contribution Closest to establish a causal link between self-referrals and
overutilization Demonstrates safe harbor provisions may void legal prohibition
against self-referrals and alter the organization of physician services

Dual role of diagnosing and dispensing
Conflict of interest evocative of Stark Law concerns Prohibition of referrals of Medicare/Medicaid patients for
designated health services to entities in which the physician has a financial interest, subject to certain exceptions
“Separating policy” implemented to curb perceived abuses in prescription drugs Policy rolled out on a geographical basis over time
Similar safe harbor provision exempts vertically integrated clinics “In office ancillary services” exception IOAS a subject of the June 2010 Medpac report to Congress

Reduction of prescriptions among clinics subject to the prohibition 2-4% decrease in the likelihood of prescription 10-30% decrease in drug expenditures Reduction in areas not likely to affect health outcomes Moral hazard increased in service not subject to
prohibition
Legal exceptions eviscerate the force of the prohibition Clinics with sufficient patient volume vertically integrate
to exploit “in office ancillary services” exception Prohibition remains effective against 17% clinics providing
care to 8% of patients Concessions swallowed any savings from reduction in
moral hazard

Taiwan: a wealthy nation with health indicators comparable to OECD countries
National health insurance modeled after Canadian system National Health Insurance Bureau (NHIB)
monopsonist purchaser of virtually all health services
Care delivered through a mixture of public and private providers
Fee-for-service according to a standard national formulary
Open system with no gate-keeping Excess supply of pharmacists to meet demand
created by the “separating policy”
Health Spending and Health Status Indicators in Selected OECD Countries and Taiwan, 2006
CountryPer capita GDP (US$ PPP)
Total health spending as percent of GDP
Total health spending per person (US$ PPP)
Life expectancy at birth (years)
Infant mortality rate (deaths per 1,000 live births)
Taiwan $26,700 6.20% $1,745 77.4 6.29
Japan $30,700 8.10% $2,581 81.3 3.24
South Korea $20,400 6.40% $1,467 77.0 6.16
Canada $32,900 10.00% $3,673 80.2 4.69
France $30,000 11.00% $3,420 79.7 4.21
Germany $29,800 10.60% $3,465 78.8 4.12
United Kingdom $30,900 8.20% $2,815 78.5 5.08
United States $42,000 15% $6,719 77.9 6.43
Source: CIA World Factbook (2006 for per capita GDP, life expectancy and infant mortality rates); WHO country health information (2006)

1 2I i i= +where
FOC Income Effect
Substitution Effect
Hypothesis 1: Policy will decrease prescription drugs
Hypothesis 2: Policy will increase diagnostic tests
( ),U U Y I=
( ) ( )1 1 1 2 2 2Y N m x i m x i= +⎡ ⎤⎣ ⎦
1 21 2
1 2
x x U Im m
i i U Y
∂ ∂ ∂ ∂= =−
∂ ∂ ∂ ∂

(1)
(2)
(1) – (2)
Hypothesis 3: Clinics with sufficient patient volume will vertically integrate (exploit the In-Office Ancillary Services Exception)
or
( ) ( )* *1 1 1 2 2 2
PhY N m x i m x i F⎡ ⎤= + −⎣ ⎦
( )2 2 2NoY N m x i′= ⎡ ⎤⎣ ⎦
( ) ( ) ( )* *1 1 1 2 2 2 2 2 2N m x i m x i m x i F⎡ ⎤′+ − >⎣ ⎦
( ) ( ) ( )* *1 1 1 2 2 2 2 2 2
FN
m x i m x i m x i>⎡ ⎤′+ −⎣ ⎦

Pre-Policy
AFFECTED SWITCHERS NOT AFFECTEDPost-Policy
Introduction context data & methodology results conclusion
CONTROL clinics are (1) similar clinics located in jurisdictions not YET subject to the policy or (2) integrated clinics in the same jurisdiction

National Health Insurance Research Institute Data 1-in-500 subsample of all outpatient visits, 1997-2000 Population data of all prescriptions filled at contracted
(independent) pharmacies Panel data of 1,000,000 randomly selected individuals,
1997-2000
Econometric specificationsPhysician fixed effects
Patient age, sex, 65 disease code
dummies
County, quarterly dummies
Post × treat

Clinics not integrated at baseline
Clinics integrated at baseline
Variable Mean Std. Dev. Mean Std. Dev.
A. Office Visits (Obs = 55,202) (Obs = 131,974)Prescription 0.98 0.15 0.98 0.14Drug expenditures 110.66 147.14 116.26 136.34Diagnostic tests 0.24 0.43 0.22 0.41Diagnostic expenditures 273.42 1,991.80 252.71 2,168.90Total payment to clinics 378.54 997.93 370.22 1,037.56Total payment to clinics and independent pharmacies 385.90 1,000.38 371.22 1,037.95Patient is female 0.57 0.50 0.55 0.50Patient age 33.20 23.22 28.80 23.26
B. Physician Characteristics (Obs = 2,525) (Obs = 3,451)Owner 0.89 0.31 0.72 0.45Physician is female 0.04 0.20 0.07 0.26Physician age 53.70 13.43 45.56 11.31
C. Clinic Characteristics‡ (Obs = 2,362) (Obs = 2,536)Monthly practice volume 1,196.02 1,011.21 2,374.21 1,698.52Monthly revenues (in 1000 NT$) 476.32 1,092.44 846.05 1,249.12

Do self-referrals lead to overutilization, and can prohibiting such practices reduce moral hazard?

(1) (2) (3) (4) (5)
DEPENDENT VARIABLES PrescriptionLog drug
expenditures†Diagnostic
tests
Diagnostic expenditures
(log)
Log discretionary expenditures
Panel A: Clinics not integrated (no pharmacist) at baseline
Treatment (= 1) -0.0230*** -0.109*** -0.0148*** 0.0733*** -0.0947***(0.00208) (0.00697) (0.00398) (0.0230) (0.00682)
Observations 371,215 352,858 371,215 81,117 352,862R-squared 0.15 0.24 0.11 0.18 0.13Number of physician IDs 5,182 5,005 5,182 3,569 5,005
Panel B: Clinics integrated (with pharmacist) at baseline
Treatment (= 1) 0.00156 -0.00320 -0.00383 0.00204 -0.00232(0.00121) (0.00335) (0.00338) (0.0216) (0.00438)
Observations 462,007 447,709 462,007 98,512 447,710R-squared 0.22 0.36 0.12 0.23 0.19Number of physician IDs 4,485 4,414 4,485 3,411 4,414

(1) (2) (3) (4) (5)
DEPENDENT VARIABLES PrescriptionLog drug
expenditures†Diagnostic
tests
Diagnostic expenditures
(log)
Log discretionary expenditures
Panel A: Sample of patients to whom clinics may continue to dispense drugs even without an onsite pharmacist
Treatment (= 1) -0.00194 -0.0122 -0.00907* -0.00129 -0.0132(0.00229) (0.00762) (0.00536) (0.0457) (0.00819)
Observations 79,937 70,661 79,937 14,292 79,191
Panel B: Clinics not integrated (without pharmacist) at baseline, controlling for time-varying within-jurisdiction effects
Treatment (= 1) -0.0170*** -0.0970*** -0.00384 0.0394* -0.0860***(0.00201) (0.00655) (0.00421) (0.0232) (0.00641)
Observations 836,471 803,301 836,471 180,593 803,682R-squared 0.19 0.30 0.12 0.21 0.16Number of physician IDs 8,994 8,774 8,994 6,658 8,775

(1) (2) (3) (4) (5)
VARIABLESPrescription
Log drug expenditures†
Diagnostic testsDiagnostic
expenditures (log)Log discretionary
expenditures quarter × treat × county 1 0.0167 0.239 0.149 -0.0284 0.186quarter × treat × county 2 -0.0790 -0.0162 -0.153 0.493 -0.477quarter × treat × county 3 -0.00136 -0.00800 0.0130 -0.0248 0.00139quarter × treat × county 4 0.000629 0.00459 0.00134 -0.0201 9.05e-05quarter × treat × county 5 -0.00258* 0.00530 -0.00272 -0.0138 -0.000516quarter × treat × county 6 1.75e-07 0.00122 -0.00293 -0.00789 -0.00119quarter × treat × county 7 -0.00139 0.0150 0.00682 0.00237 0.0154quarter × treat × county 8 0.000288 0.000110 0.00165 0.000197 -0.000671quarter × treat × county 9 -0.000235 -0.00227 0.000484 -0.0172 -0.00503quarter × treat × county 10 -0.00302* -0.0251 0.00833 0.0896* -0.00939quarter × treat × county 11 0.000904 -0.00348 -0.000391 -0.0182 -0.0105*quarter × treat × county 12 -0.000695 0.00173 -0.00325 0.0158 0.000774quarter × treat × county 13 5.49e-05 -0.000135 -0.00336 -0.0197 -0.00223quarter × treat × county 14 0.000789 0.00579 0.00849 -0.00546 0.00787quarter × treat × county 15 0.000806 -0.0231 0.0134 -0.0272 -0.0201quarter × treat × county 16 -0.00208 -0.00174 -0.00943 -0.0260 -0.0146quarter × treat × county 17 0 0.102 0 0 0quarter × treat × county 18 2.40e-05 0.00100 -0.00739* -0.00920 0.000110quarter × treat × county 19 0.000426 -0.00909* -0.00361 0.0215 -0.00578
Observations 265,070 257,341 265,070 60,492 257,376R-squared 0.29 0.32 0.12 0.23 0.15Number of physician IDs 6,678 6,619 6,678 4,190 6,620F statistic 1.00 1.52 1.29 0.84 1.22Prob > F 0.45 0.07 0.18 0.66 0.23

Most Frequent Primary Diagnosis Codes
RankDisease
Code Disease Name Frequency% of all
diagnoses Cumulative %1 A312 Acute upper respiratory infection 325,069 0.3328 0.33282 A311 Acute bronchitis 85,477 0.0875 0.42043 A233 Conjunctivitis 34,697 0.0355 0.45594 A310 Acute tonsillitis 30,727 0.0315 0.48735 A322 Influenza 28,923 0.0296 0.51706 A420 Carbuncles and furuncles/Cellulitis 22,649 0.0232 0.54017 A314 Chronic pharyngitis/rhinitis/sinusitis 21,288 0.0218 0.56198 A429 Other (epi)dermatological diseases 21,113 0.0216 0.58369 A346 Constipation/Irritable bowel syndrome 19,791 0.0203 0.6038
10 A349 Acute gastroenteritis/chronic pancreatitis 16,230 0.0166 0.620411 A434 Back pain 15,502 0.0159 0.636312 A239 Chalazion/Eye strain/Refractive error 14,570 0.0149 0.651213 A373 Vulvovaginitis 13,790 0.0141 0.665314 A229 Carpal tunnel syndrome/migraine 11,718 0.0120 0.677315 A375 Abnormal menstruation 11,642 0.0119 0.689316 A269 Hypertension 8,304 0.0085 0.697817 A016 Communicable gastric disease (unclear diagnosis) 8,207 0.0084 0.706218 4619 Acute sinitus 8,146 0.0083 0.714519 462 Acute pharyngitis 8,099 0.0083 0.722820 A323 Asthma/Chronic bronchitis/Emphysema 7,580 0.0078 0.730621 A439 Osteoporosis 7,211 0.0074 0.737922 A319 Acute corditis/Allergic rhinitis 6,870 0.0070 0.745023 A469 Malaise and fatigue (general symptoms) 6,723 0.0069 0.751924 A432 Joint pain 6,448 0.0066 0.758525 A464 Abdominal pain 6,206 0.0064 0.7648

Rank Drug therapeutic class PrescriptionsShare of
prescriptionsShare of drug expenditures
1 ANTACIDS AND ABSORBENTS COMPOSITE 440,370 11.012% 4.010%2 NONSTEROIDAL ANTI-INFLAMMATORY AGENTS 345,367 8.637% 8.065%3 ANTIHISTAMINE DRUGS 306,144 7.656% 2.831%4 MISCELLANEOUS ANALGESICS AND ANTIPYRETICS 297,417 7.437% 1.118%5 ANTITUSSIVES 225,606 5.642% 0.940%6 SYMPATHOMIMETIC OR ADRENERGIC AGENTS 206,871 5.173% 1.618%7 PENICILLINS 148,104 3.704% 2.275%8 CEPHALOSPORINS 130,149 3.255% 6.032%9 ANTITUSSIVES COMPOSITE 122,149 3.055% 1.464%
10 ANTIHISTAMINE DRUGS COMPOSITE 113,264 2.832% 0.556%11 COMMON COLD PREPARATIONS 105,913 2.649% 0.725%12 EXPECTORANTS 100,044 2.502% 1.197%13 ENZYMES 87,145 2.179% 1.274%14 ANTIEMETICS 84,597 2.116% 0.570%15 MUCOLYTIC AGENTS 72,712 1.818% 0.525%16 ANTIMUSCARINICS/ANTISPASMODICS 70,109 1.753% 0.817%17 ADRENALS 69,860 1.747% 0.416%18 BENZODIAZEPINES 56,623 1.416% 1.639%19 H2-BLOCKER 46,374 1.160% 1.395%20 ANTI-INFLAMMATORY AGENTS 42,955 1.074% 2.641%

(1) (2) (3)
DEPENDENT VARIABLES ER visits (for ARI†)Hospitalizations
(ARI/DM)Hospitalizations (pneumonia/AC)
Panel A: Patients with Acute Respiratory Infections, 30-day follow-up
Treatment (= 1) -0.000143 0.0000591 -0.0002165(0.000201) (0.000743) (0.000632)
1997 baseline adverse event rates 0.0001293 0.0031597 0.0024901
Observations 262,704 262,704 262,704R-squared 0.00 0.00 0.00Number of clinic IDs 5,700 5,700 5,700
Panel B: Patients with Diabetes Mellitus, 360-day follow-up
Treatment (= 1) 0.00003 -0.01490 -0.00001(0.00146) (0.0165) (0.0224)
1997 baseline adverse event rates 0.0007293 0.1002042 0.1390753
Observations 14,001 14,001 14,001R-squared 0.026 0.044 0.049Number of clinic IDs 2,151 2,151 2,151
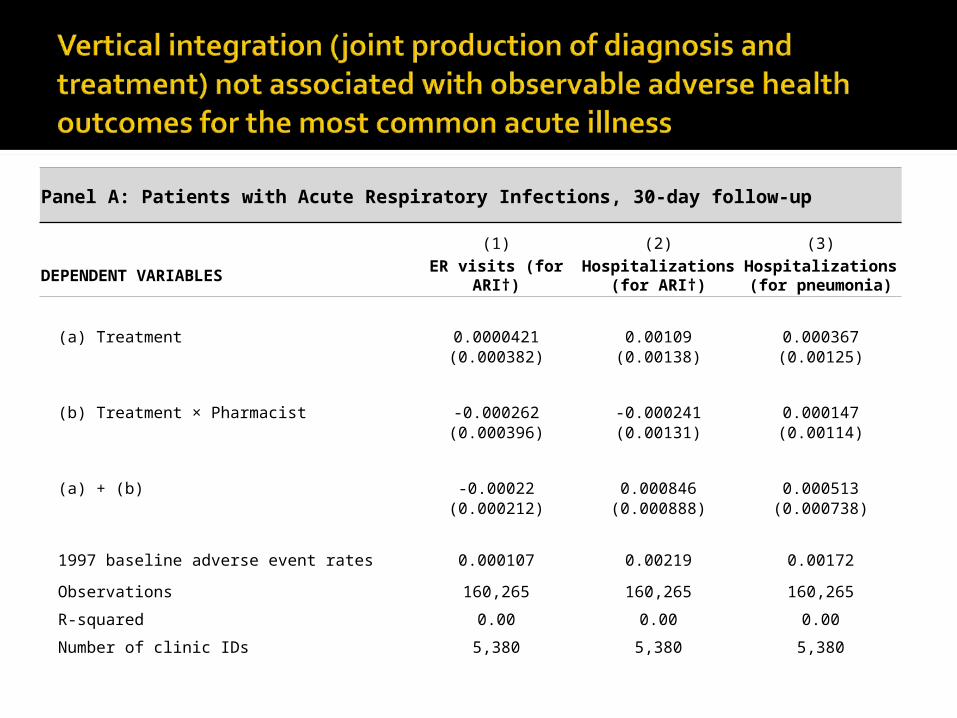
Panel A: Patients with Acute Respiratory Infections, 30-day follow-up
(1) (2) (3)
DEPENDENT VARIABLES ER visits (for ARI†)Hospitalizations (for
ARI†)Hospitalizations (for
pneumonia)
(a) Treatment 0.0000421 0.00109 0.000367(0.000382) (0.00138) (0.00125)
(b) Treatment × Pharmacist -0.000262 -0.000241 0.000147(0.000396) (0.00131) (0.00114)
(a) + (b) -0.00022 0.000846 0.000513(0.000212) (0.000888) (0.000738)
1997 baseline adverse event rates 0.000107 0.00219 0.00172
Observations 160,265 160,265 160,265
R-squared 0.00 0.00 0.00
Number of clinic IDs 5,380 5,380 5,380

Panel B: Patients with Diabetes Mellitus, 360-day follow-up
(1) (2) (3)
DEPENDENT VARIABLES ER visits (DM)Hospitalizations
(DM)Hospitalizations
(all cause)
(a) Treatment 0.000503 -0.00691 0.0109
(0.00158) (0.0234) (0.0302)
(b) Treatment × Pharmacist -0.000577 -0.00976 -0.0132
(0.00163) (0.0249) (0.0312)
(a) + (b) -0.0000735 -0.0167 -0.00237
(0.00159) (0.0180) (0.0242)
1997 baseline adverse event rates 0.000408 0.0988 0.16
Observations 14,001 14,001 14,001
R-squared 0.03 0.04 0.05
Number of clinic IDs 2,151 2,151 2,151
Does the “In Office Ancillary Services” Exception void the impact of the prohibition against self-referrals?

(1) (2) (3) (4) (5)
DEPENDENT VARIABLES PrescriptionLog drug
expenditures†Diagnostic
tests
Diagnostic expenditures
(log)
Log discretionary expenditures
Panel A: Clinics not integrated at baseline, after policy change, and after hiring a pharmacist
(a) Treatment -0.0510*** -0.265*** -0.0233*** 0.124*** -0.234***
(0.00388) (0.0138) (0.00579) (0.0323) (0.0128)
(b) Treatment × Pharmacist 0.0478*** 0.258*** 0.0145** -0.0867*** -0.234***
(0.00394) (0.0137) (0.00591) (0.0327) (0.0128)
(a) + (b) -0.00314* -0.00650 -0.00878** 0.0370 -0.00311(0.00175) (0.00495 ) (0.00419) (0.0242) (0.00546)
Observations 371,215 352,858 371,215 81,117 352,862
R-squared 0.16 0.25 0.11 0.18 0.14
Number of physician IDs 5,182 5,005 5,182 3,569 5,005

(1) (2) (3) (4) (5)
DEPENDENT VARIABLES PrescriptionLog drug
expenditures†Diagnostic
tests
Diagnostic expenditures
(log)
Log discretionary expenditures
Panel B: Clinics not integrated at baseline, after policy change, and after hiring a pharmacist, controlling for time-varying within-county effects
(a) Treatment -0.0475*** -0.265*** -0.00994* 0.106*** -0.233***
(0.00410) (0.0135) (0.00584) (0.0323) (0.0126)
(b) Treatment × Pharmacist 0.0487*** 0.262*** 0.00974* -0.107*** 0.228***
(0.00405) (0.0136) (0.00575) (0.0317) (0.0128)
(a) + (b) 0.00122 -0.00324 -0.000203 -0.000919 -0.00436(0.00163) (0.00495 ) (0.00449) (0.0245) (0.00541)
Observations 836,471 803,301 836,471 180,593 803,682
R-squared 0.19 0.30 0.12 0.21 0.17
Number of physician IDs 8,994 8,774 8,994 6,658 8,775

0 2,000
4,000
6,000
Lik
elih
ood
of H
iring
a
Ph
arm
acis
t
Ye
sNo
Likelihood of Vertical Integration Based on Pre-Policy Patient VolumeLogit Transformed Mean Adjusted Lowess Smooth
Pre-Policy Baseline Monthly Number of Office Visits
Instrument 1: D3500
Instrument 2: (1-D3500)×log(volume)


(1) (2) (3) (4)
VARIABLES Hired pharmacist Hired pharmacist Hired pharmacist Hired pharmacist
Treatment 0.660*** 0.0899**
(0.0110) (0.0434)Treatment × D25-50%tile 0.196***
(0.0212)Treatment × D50-75%tile 0.430***
(0.0211)Treatment × D75-99%tile 0.687***
(0.0200)Treatment × D3500 0.757***
(0.0452)Treatment × (1-D3500) × log(baseline volume) 0.187***
(0.00301)Treatment × log(baseline volume) 0.182***
(0.00321)
Observations 341,498 341,498 331,403 331,403R-squared 0.56 0.32 0.60 0.60Number of clinic IDs 3,916 3,916 3,595 3,595


(1) (2) (3) (4) (5)
DEP VARS (Column) PrescriptionLog drug
expendituresDiagnostic
tests
Diagnostic expenditures
(log)
Log discretionary expenditures
Fixed effects IV regressions(a) Treatment -0.0808*** -0.472*** -0.0310*** 0.156*** -0.412***
(0.00258) (0.00687) (0.00532) (0.0380) (0.00810)(b) Treatment × pharmacist 0.0993*** 0.600*** 0.0250*** -0.145** 0.524***
(0.00405) (0.0106) (0.00833) (0.0595) (0.0124)
(a) + (b) 0.0185*** 0.128*** -0.00594 0.0113 0.112***(0.00193 ) (0.00484) (0.00398) (0.0282) (0.00571)
Observations 353,595 337,797 353,595 76,284 337,801R-squared 0.16 0.23 0.11 0.18 0.10Number of physician ID 4,421 4,363 4,421 3,086 4,363
First-stage within regressions‡Treatment × D3500 1.200*** 1.170*** 1.200*** 1.250*** 1.170***
[185.11] [176.12] [185.11] [85.44] [176.14]Treatment × (1-D3500) × log(baseline volume) 0.310*** 0.304*** 0.310*** 0.317*** 0.304***
[185.53] [178.12] [185.53] [82.74] [178.15]F-statistic 118.95 112.74 118.95 38.24 112.75R-squared 0.62 0.63 0.62 0.63 0.63

(1) (2) (3) (4) (5)
DEP VARS (Column) PrescriptionLog drug
expendituresDiagnostic tests
Diagnostic expenditures
(log)
Log discretionary expenditures
Fixed effects IV regressions(a) Treatment -0.0828*** -0.503*** -0.0245*** 0.113*** -0.441***
(0.00255) (0.00676) (0.00579) (0.0431) (0.00826)(b) Treatment × pharmacist 0.102*** 0.620*** 0.0267*** -0.120* 0.543***
(0.00385) (0.0100) (0.00872) (0.0637) (0.0123)
(a) + (b) 0.0196*** 0.117*** 0.00226 -0.00706 0.102***(0.00164) (0.00413) (0.00372) (0.0264) (0.00505)
Observations 732,102 705,612 732,102 157,202 705,959R-squared 0.19 0.29 0.12 0.21 0.17Number of physician IDs 7,267 7,169 7,267 5,352 7,170
First-stage within regressions‡Treatment × D3500 1.151*** 1.120*** 1.151*** 1.225*** 1.119***
[259.34] [247.81] [259.34] [120.84] [247.61]
Treatment × (1-D3500) × log(baseline volume) 0.301*** 0.294*** 0.301*** 0.316*** 0.294***[265.31] [254.03] [265.31] [119.83] [253.95]
F-statistic 143.41 136.39 143.41 44.17 137.14R-squared 0.64 0.65 0.64 0.64 0.65

Self-Referrals and Overutilization Self-referrals can cause overutilization Prohibition against self-referrals can
reduce moral hazard (overutilization)
Role of Safe Harbor Exceptions Certain safe harbor exceptions eviscerate
the prohibition against self-referrals And may alter the organization of medical
services

External Validity Cross cultural differences Demanded vs. less demanded services Fee-for-service vs. capitated payments
Better examination of efficiency justifications Health outcome impact Adherence
Leakages and Physician-Pharmacist Collusions Gateway pharmacies

Elimination of certain DHS from IOAS exemption E.g., eliminate services with no efficiency justification
from vertical integration
More aligned payment incentives Payments designed to constrain growth Lower payments for self-referred services Bundled payments
Prior authorization High cost drugs
More stringent definition of integration Each member of the group to provide substantial
proportion of her services to the group

Defensive medicine under self-insurance
Strategic response to outpatient prescription drug copayment
Hospital ownership structure and competition
Law and innovation in health care ERISA preemption and medical
malpractice Comparative cost effectiveness