breaking the shackles: zombie firms, weak banks …
TRANSCRIPT

Unclassified ECO/WKP(2017)65 Organisation de Coopération et de Développement Économiques Organisation for Economic Co-operation and Development 16-Nov-2017
___________________________________________________________________________________________
_____________ English - Or. English ECONOMICS DEPARTMENT
BREAKING THE SHACKLES: ZOMBIE FIRMS, WEAK BANKS AND DEPRESSED
RESTRUCTURING IN EUROPE
ECONOMICS DEPARTMENT WORKING PAPERS No. 1433
By Dan Andrews and Filippos Petroulakis
OECD Working Papers should not be reported as representing the official views of the OECD or of its member
countries. The opinions expressed and arguments employed are those of the author(s).
Authorised for publication by Christian Kastrop, Director, Policy Studies Branch, Economics Department.
All Economics Department Working Papers are available at www.oecd.org/eco/workingpapers
JT03423079
This document, as well as any data and map included herein, are without prejudice to the status of or sovereignty over any territory, to the
delimitation of international frontiers and boundaries and to the name of any territory, city or area.
EC
O/W
KP
(2017)6
5
Un
classified
En
glish
- Or. E
ng
lish
ECO/WKP(2017)65
2
OECD Working Papers should not be reported as representing the official views of the OECD or of its member countries. The opinions expressed and arguments employed are those of the author(s).
Working Papers describe preliminary results or research in progress by the author(s) and are published to stimulate discussion on a broad range of issues on which the OECD works.
Comments on Working Papers are welcomed, and may be sent to OECD Economics Department, 2 rue André-Pascal, 75775 Paris Cedex 16, France, or by e-mail to [email protected].
All Economics Department Working Papers are available at www.oecd.org/eco/workingpapers.
This document and any map included herein are without prejudice to the status of or sovereignty over any territory, to the delimitation of international frontiers and boundaries and to the name of any territory, city or area.
The statistical data for Israel are supplied by and under the responsibility of the relevant Israeli authorities. The use of such data by the OECD is without prejudice to the status of the Golan Heights, East Jerusalem and Israeli settlements in the West Bank under the terms of international law.
© OECD (2017) _________________________________________________________________________________________ You can copy, download or print OECD content for your own use, and you can include excerpts from OECD publications, databases and multimedia products in your own documents, presentations, blogs, websites and teaching materials, provided that suitable acknowledgment of OECD as source and copyright owner is given. All requests for commercial use and translation rights should be submitted to [email protected]
______________________________________________________________________________________

ECO/WKP(2017)65
3
ABSTRACT/RÉSUMÉ
Breaking the Shackles: Zombie Firms, Weak Banks and Depressed Restructuring in Europe
This paper explores the connection between “zombie” firms (firms that would typically exit in a
competitive market) and bank health and the consequences for aggregate productivity in 11 European
countries. Controlling for cyclical effects, the results show that zombie firms are more likely to be
connected to weak banks, suggesting that the zombie firm problem in Europe may at least partly stem from
bank forbearance. The increasing survival of zombie firms congests markets and constrains the growth of
more productive firms, to the detriment of aggregate productivity growth. Our results suggest that around
one-third of the impact of zombie congestion on capital misallocation could be directly attributed to bank
health and additional analysis suggests that this may partly be due to reduced availability of credit to
healthy firms. Finally, improvements in bank health are more likely to be associated with a reduction in the
prevalence of zombie firms in countries where insolvency regimes do not unduly inhibit corporate
restructuring. Thus, leveraging the important complementarities between bank strengthening efforts and
insolvency regime reform would contribute to breaking the shackles on potential growth in Europe.
JEL codes: D24, G21, L25, O47.
Keywords: Zombie Firms; Factor Reallocation; Productivity; Credit Constraints.
********************
Sociétés zombies, fragilité des banques et atonie des restructurations en Europe : libérer la
croissance de ses entraves
Dans cette étude, on analyse les liens entre les sociétés « zombies (ces sociétés non viables qui,
normalement, sortiraient du marché dans un environnement soumis à la concurrence), la situation
financière des banques et leurs conséquences pour la productivité globale dans onze pays européens. Une
fois neutralisés les effets cycliques, les résultats montrent que ces sociétés zombies sont plus souvent liées
à des banques fragiles, ce qui laisse penser que le problème qu’elles posent en Europe tient peut-être, en
partie au moins, au laxisme du système bancaire. Leur survie croissante aboutit à la congestion des
marchés et entrave la croissance d’entreprises plus productives, au détriment de gains dans la productivité
globale. Les résultats de notre analyse indiquent que les effets de cette prolifération de sociétés non viables
sur une mauvaise allocation du capital pourraient directement être imputés, pour un tiers environ, à l’état
de santé des banques et, si l’on pousse l’analyse, qu’une disponibilité réduite de l’offre de crédit aux
entreprises en bonne santé pourrait, en partie, en être la cause. Enfin, l’amélioration de la santé du système
bancaire va plus souvent de pair avec une diminution du nombre de sociétés zombies dans les pays où le
régime de faillite n’entrave pas inutilement la restructuration des entreprises. Aussi, la mise à profit des
complémentarités entre les initiatives de consolidation des banques et la réforme des procédures de faillite
concourrait à libérer la croissance potentielle de ses entraves.
Classification JEL: D24, G21, L25, O47.
Mots-clés: sociétés zombies ; redéploiement des facteurs ; productivité; difficultés d’accès au crédit.

ECO/WKP(2017)65
4
TABLE OF CONTENTS
1. Introduction and main findings ............................................................................................................. 5 2. Productivity, zombie firms and public policy ....................................................................................... 7 3. Empirical framework .......................................................................................................................... 11 4. Data and definitions ............................................................................................................................ 14 5. Empirical results ................................................................................................................................. 17 6. Conclusion .......................................................................................................................................... 27
REFERENCES .............................................................................................................................................. 28
APPENDIX A: ADDITIONAL TABLES AND FIGURES ......................................................................... 31
Tables
Table 1. Zombie firms and bank health: baseline results .................................................................... 19 Table 2. Zombie firms and bank health: role of insolvency regimes .................................................. 21 Table 3. Capital reallocation, bank health and zombie congestion...................................................... 24 Table 4. Credit availability for healthy firms and zombie congestion ................................................. 26 Table A1. Summary statistics ................................................................................................................. 31 Table A2. Zombie firms and bank health: role of the crisis ................................................................... 32 Table A3. Zombie firms and bank health: robustness tests .................................................................... 33 Table A4. Zombie firms, bank health and insolvency regimes: robustness ........................................... 34 Table A5. Capital reallocation and bank health: robustness tests .......................................................... 35
Figures
Figure 1. Decomposition of the growth rate of OECD potential output per capita ................................ 7 Figure 2. The design of insolvency regimes across countries ............................................................... 17 Figure 3. Zombie firms are connected to weak banks .......................................................................... 18 Figure 4. Insolvency regimes shape the link between zombie firms and bank health .......................... 23 Figure 5. Zombie congestion and access to finance to healthy firms ................................................... 26 Figure A1. The evolution of bank health ................................................................................................. 36 Figure A2. Zombie firms and weak banks: additional evidence .............................................................. 38
Boxes
Box 1. Measuring bank health ................................................................................................................... 16

ECO/WKP(2017)65
5
BREAKING THE SHACKLES: ZOMBIE FIRMS, WEAK BANKS AND DEPRESSED
RESTRUCTURING IN EUROPE
By Dan Andrews and Filippos Petroulakis1
1. Introduction and main findings
1. The collapse in potential output growth over the past two decades brings into closer focus the
structural barriers to productivity growth in Europe and the scope for policy to break these shackles. Firm-
level research is increasingly linking the aggregate productivity slowdown to the widening productivity
dispersion across firms (Andrews et al. 2016), rising capital misallocation (Gopinath et al. 2017) and
declining business dynamism (Decker et al. 2016). A related source of concern is that firms that would
typically exit or be forced to restructure in a competitive market – i.e. ”zombie firms” – are increasingly
surviving, which may weigh on average productivity and crowd-out growth opportunities for more
productive firms (Adalet McGowan et al. 2017b). In some countries, these problems may be symptomatic
of impaired banking sectors. In this view, banks’ reluctance or lack of incentives to deal with non-
performing loans (NPLs) and realize losses on their balance sheets that may arise from corporate
insolvencies, may lead to ”evergreening” of loans to zombie firms (i.e. bank forbearance). But almost
everything we know about this issue is based on the Japanese experience of the 1990s (Caballero et al.
2008; Peek and Rosengren 2005) and cross-country research on the connection between zombie firms and
weak banks is scarce.
2. Accordingly, this paper explores the connection between zombie firms and bank health and the
resulting consequences for aggregate productivity growth. To this end, we assemble a cross-country micro
dataset by linking ORBIS, the largest commercially available firm-level source of cross-country data, with
bank-level information from Bankscope and microdata on firms’ access to finance from the Survey on the
Access to Finance for Enterprises (SAFE), run by the European Central Bank (ECB). We use principal
components analysis to construct a multi-dimensional indicator of bank health, which takes into account
tangible equity, net income, NPLs, return on assets, and measures of maturity mismatch and asset
riskiness. Our final dataset covers 11 European countries, from 2001 to 2014. In turn, cross-country
empirical analysis delivers four main policy findings.
3. First, after controlling for cyclical influences at the industry-country level, our baseline (within-
industry) estimates show that zombie firms have a higher likelihood of being connected to a weak bank.
These results survive a battery of robustness tests. Assuming a causal relationship, our baseline estimates
imply that weak banks (i.e. those one standard deviation below the mean of the bank health distribution)
are between 1.2 and 2.2 percentage points more likely of being connected with a zombie firm compared to
healthy banks (i.e. those one standard deviation above the mean of the bank health distribution). This
translates into a 13% to 24% difference in zombie incidence between healthy and weak banks relative to
the mean. These results are consistent with the idea that the zombie firm problem in Europe may at least
partly stem from bank forbearance.
1. Corresponding authors are: Dan Andrews ([email protected]) from the OECD Economics
Department and Filippos Petroulakis ([email protected]) from the European Central
Bank. The views expressed in this paper are those of the authors alone, and may not necessarily reflect
those of the OECD or the European Central Bank. The authors would like to thank Giuseppe Nicoletti,
Müge Adalet McGowan, Peter Gal, Valentine Millot and Jean-Marc Fournier from the OECD Economics
Department and Bob Anderton, Isabel Vanksteenkiste, Beatrice Pierluigi, Agostino Consolo, Bjorn
Fischer, Ralph Setzer, Manuela Storz and Livio Stracca from the European Central Bank. All errors are our
own.

ECO/WKP(2017)65
6
4. We then explore the potential for the design of insolvency regimes to condition the link between
zombie firms and bank health. Even when banks are healthy, an insolvency framework which creates
impediments to corporate restructuring and reduces recovery rates for creditors may reduce the economic
incentives for banks to commence the process of recovery, liquidation, or restructuring. Consistent with
this idea, we exploit new OECD insolvency regime indicators (see Adalet McGowan et al, 2017a) to show
that improvements in bank health are more likely to be associated with a reduction in the prevalence of
zombie firms in countries where insolvency regimes do not unduly inhibit corporate restructuring. Put
differently, the effectiveness of efforts to reduce NPLs will be limited if insolvency frameworks remain
hostile to efficient restructuring. Taken together, these findings carry strong policy implications and imply
that leveraging the important complementarities between efforts to restore bank health and insolvency
regime reform will be important for breaking the shackles on potential growth in Europe.
5. Third, we explore the aggregate consequences of the zombie firm-weak bank connection through
the channel of capital reallocation. We first replicate the key findings of Adalet McGowan et al. (2017b),
and show that on average, more productive firms attract more capital (i.e. capital reallocation is
productivity-enhancing) but the extent to which this is true diminishes as zombie congestion (i.e. the share
of the industry capital stock sunk in zombie firms) rises. Consistent with the empirical link between
zombie firms and bank health uncovered above, we then show that the capital reallocation process is less
(more) productivity-enhancing in industries exposed to weaker (healthier) banks. For example, a one
standard deviation increase in bank health would raise our preferred measure of the efficiency of capital
reallocation (the difference in capital growth between firms one standard deviation above and below the
sectoral mean of productivity) by 1.6 percentage points (from 6.6% to 8.2%). Moreover, our results
suggest that around one-third of the impact of zombie congestion on capital misallocation can be directly
attributed to bank health. These findings are significant given that rising capital misallocation is emerging
as a key explanation of the productivity slowdown in some countries (Gopinath et al. 2017).
6. Finally, we study the channels through which zombie congestion may adversely affect the growth
opportunities of healthier and more productive firms. If zombie congestion crowds-out investment
opportunities for healthier and more productive firms, then one would expect that this relationship is also
reflected in access to credit. Using data from the Survey on the Access to Finance of Enterprises (SAFE)
from the European Central Bank (ECB), we find a statistically significant negative relationship at the
sectoral level between the share of capital sunk in zombie firms and credit availability for healthy firms.
Intuitively, this could reflect direct crowd-out effects – i.e. banks cannot lend to healthy firms because their
balance sheets are weakened due to their zombie exposure – or reduced borrowing capacity because
zombie congestion has reduced industry profitability and thus the returns on potential projects of healthy
firms. Assuming banks engage in sectoral diversification, we hypothesize that this is more likely to reflect
the latter and less so direct crowd-out. These results should be interpreted with caution, however, given
that the sample size is very small and the economic magnitude of the estimated coefficient is modest.
7. The paper is structured as follows. The following section illustrates the link between zombies and
productivity weakness, and then reviews existing literature between zombie firms, weak banks, and
insolvency regimes. Section 3 outlines the empirical strategy while Section 4 explains the data sources.
Section 5 then provides new empirical evidence on four issues: i) the connection between zombie firms
and weak banks; ii) how this link is conditioned by the design of insolvency regimes; iii) the aggregate
consequences of the zombie firm-weak bank connection through the channel of capital reallocation; and iv)
channels through which zombie congestion adversely affects growth, with a particular focus on healthy
firms access to finance. Section 6 provides some concluding remarks.
ECO/WKP(2017)65
7
2. Productivity, zombie firms and public policy
2.1 The exit margin as a source of productivity weakness
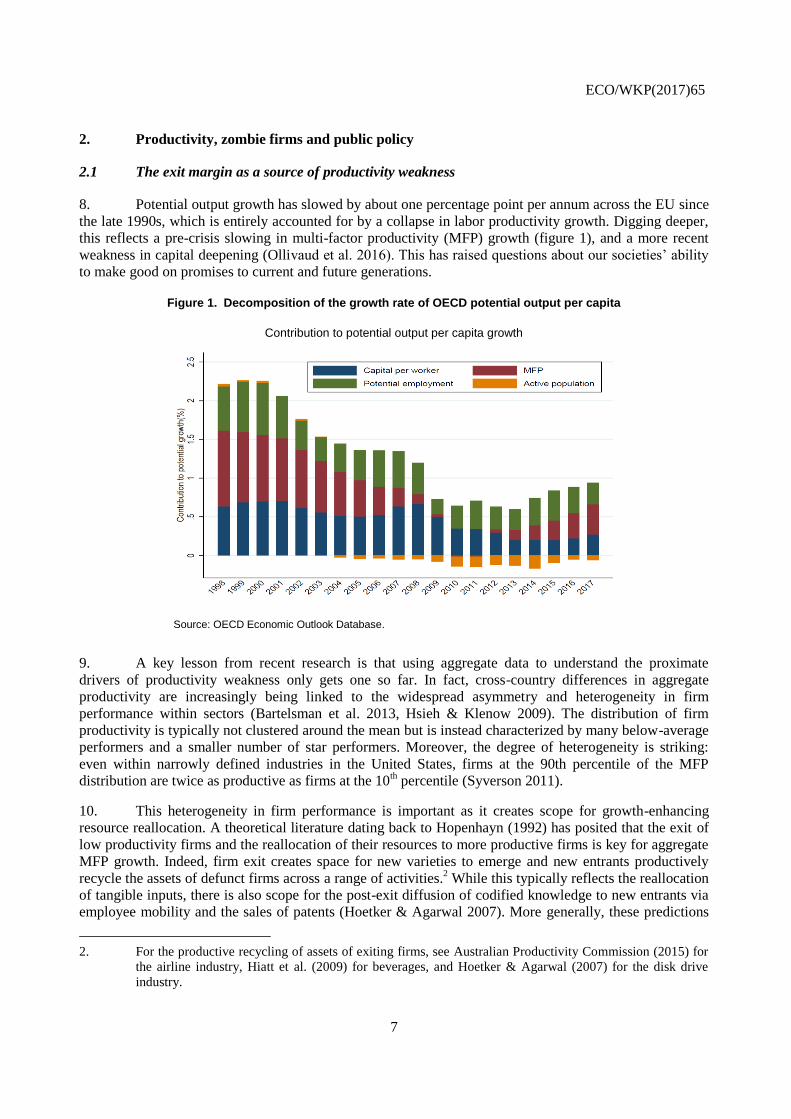
8. Potential output growth has slowed by about one percentage point per annum across the EU since
the late 1990s, which is entirely accounted for by a collapse in labor productivity growth. Digging deeper,
this reflects a pre-crisis slowing in multi-factor productivity (MFP) growth (figure 1), and a more recent
weakness in capital deepening (Ollivaud et al. 2016). This has raised questions about our societies’ ability
to make good on promises to current and future generations.
Figure 1. Decomposition of the growth rate of OECD potential output per capita
Contribution to potential output per capita growth
Source: OECD Economic Outlook Database.
9. A key lesson from recent research is that using aggregate data to understand the proximate
drivers of productivity weakness only gets one so far. In fact, cross-country differences in aggregate
productivity are increasingly being linked to the widespread asymmetry and heterogeneity in firm
performance within sectors (Bartelsman et al. 2013, Hsieh & Klenow 2009). The distribution of firm
productivity is typically not clustered around the mean but is instead characterized by many below-average
performers and a smaller number of star performers. Moreover, the degree of heterogeneity is striking:
even within narrowly defined industries in the United States, firms at the 90th percentile of the MFP
distribution are twice as productive as firms at the 10th percentile (Syverson 2011).
10. This heterogeneity in firm performance is important as it creates scope for growth-enhancing
resource reallocation. A theoretical literature dating back to Hopenhayn (1992) has posited that the exit of
low productivity firms and the reallocation of their resources to more productive firms is key for aggregate
MFP growth. Indeed, firm exit creates space for new varieties to emerge and new entrants productively
recycle the assets of defunct firms across a range of activities.2 While this typically reflects the reallocation
of tangible inputs, there is also scope for the post-exit diffusion of codified knowledge to new entrants via
employee mobility and the sales of patents (Hoetker & Agarwal 2007). More generally, these predictions
2. For the productive recycling of assets of exiting firms, see Australian Productivity Commission (2015) for
the airline industry, Hiatt et al. (2009) for beverages, and Hoetker & Agarwal (2007) for the disk drive
industry.
ECO/WKP(2017)65
8
have been borne out in a host of empirical studies3, which document that within-industry resource
reallocation is a significant contributor to – if not the predominant driver of – aggregate productivity
growth. While the creative-destruction process in a well-functioning market economy compels poorly
performing firms to improve their efficiency or exit the market, there are signs from recent firm-level
studies that this process may be slowing down.
11. First, the level of productivity dispersion within industries has risen over time, implying a
widening gap between more productive and less productive firms (Andrews et al. 2016). This finding of
rising productivity dispersion is confirmed by a range of studies using alternate data sources (Decker et al.
2016, Berlingieri et al. 2017, Gamberoni et al. 2016) and it appears that it is not just driven by frontier
firms pushing the boundary outward. Instead, it has been attributed to stagnating laggard firm productivity
related to the declining ability or incentives of such firms to adopt best practices from the frontier
(Andrews et al. 2016). This raises serious questions about what allows weak firms that do not adopt the
latest technologies to remain in the market.
12. Second, the contribution of resource reallocation to aggregate productivity growth has declined
over time. This is reflected in a declining responsiveness of firm growth (investment) to productivity over
recent decades in Europe (Adalet McGowan et al. 2017b) and the United States (Decker et al., 2017),
which implies that the propensity of high productivity firms to expand and low productivity firms to
downsize (or exit) has fallen (Decker et al., 2017). Similarly, Gopinath et al. (forthcoming) document a
rising dispersion of return to capital in the manufacturing sector in Spain, Italy, and Portugal in the run-up
to the crisis, which they attribute to the misallocation of credit-driven capital inflows towards high net
worth, but not necessarily productive, firms. Evidence of a decline in productivity-enhancing reallocation
is particularly significant in light of rising productivity dispersion, which would ordinarily imply stronger
incentives for productive firms to aggressively expand and drive out less productive firms.
13. Finally, rising productivity dispersion and declining productivity-enhancing reallocation have
coincided with a decline in a variety of measures of business dynamism. A well-documented aspect of this
development is that firm entry has declined in many countries (Criscuolo et al. 2014). Clearly, this does not
augur well for productivity growth given that young firms possess a comparative advantage in
commercializing radical innovations (Acemoglu et al. 2013) and place indirect pressure on incumbent
firms to improve their productivity via technology adoption. But a less widely understood fact is that
declining firm entry has also been accompanied by a rising survival probability of marginal firms that
would typically exit in a competitive market (Andrews et al. 2016).
14. The prolonged survival of such firms not only weighs on average productivity but potentially
crowds-out growth opportunities for more productive firms. Until recently, almost everything we knew
about this issue was confined to Japan in the 1990s. In this regard, Caballero et al. (2008) argue that the
survival of zombie firms congests markets and lowers industry profitability – by inflating wages relative to
productivity and depressing market prices – which deters the expansion of healthier firms. Using firm-level
data for the Japanese episode, Caballero et al (2008) infer whether a firm is a zombie by comparing its
interest payments to prime lending rates. They confirm that in industries where a higher share of capital is
sunk in zombie firms, healthy firms experience lower investment and employment growth, and that the
productivity gap between non-zombie and zombie firms is higher, implying that new firms need to clear a
wide productivity threshold in order to enter the market.
15. Outside of the Japanese episode, Adalet McGowan et al. (2017b) apply the same framework to a
broad sample of OECD countries. After controlling for cyclical influences at the industry-country level, a
higher share of industry capital sunk in zombie firms is found to crowd-out the growth – in terms of
investment and employment – of healthy firms within an industry. Moreover, young firms are particularly
3. See Baily et al. (1992), Foster et al. (2006), Baldwin & Gu (2006), Disney et al. (2003).

ECO/WKP(2017)65
9
affected. They find that up to one-quarter of the actual decline in aggregate business investment in Italy
between 2008 and 2013 can be linked to the rise in zombie congestion. But the story does not end there
since zombie congestion disproportionately crowds-out the growth of more productive firms, thus slowing
aggregate MFP growth via less efficient capital reallocation. In Spain, for example, perhaps one-half of the
decline in the efficiency of capital reallocation can be accounted for by the rise in zombie congestion.
2.2 Zombie firms and weak banks
16. Despite the renewed research interest in zombie firms and their aggregate consequences, the
literature on the causes of the problem is slimmer. The seminal paper on the emergence of zombies in
Japan is Peek and Rosengren (2005), who confirm the widely suspected phenomenon of “evergreening”,
whereby banks engage in zombie lending by continuing to finance weak or even insolvent firms
(“unnatural selection”). This was attributed to perverse institutional incentives, such as the reluctance of
banks to write-off loans, which increased the closer was the reported capital to regulatory requirements
(“balance sheet cosmetics”). Cultural incentives also mattered: banks had an implicit duty to support
troubled firms, and relationship-lending forces were particularly important. Overall, 14 to 36% of all firms
were zombies at some point, according to Kwon et al (2015).4
17. These studies from Japan provide insights into the proximate causes of zombie congestion in
Europe. The most obvious account would emphasize the damage to the banking sector incurred from the
financial crisis, which undermined its ability to channel scarce credit to the most efficient uses. In this
regard, Acharya et al (2017) provide some evidence that undercapitalised banks in Europe have directed
loans to zombie firms in order to avoid incurring losses on their loan portfolios, which – instead of raising
real activity – crowded-out the growth of non-zombie firms via zombie congestion.5 At the same time,
recent evidence shows that bank stress hinders the deleveraging process of zombie firms in the euro
periphery (Storz et al., 2017).
18. Against this, Schivardi et al (2017) study the universe of loans in Italy in 2003-2014, matched
with the universe of firms. While their results confirm both zombie lending and negative effects on healthy
firms, they claim that the aggregate effects on MFP and the growth of healthy firms are minimal.6 They
also find no evidence that bank capitalizations affects credit supply to non-zombies. While this paper is
clearly related to our own, it differs in two key respects. First, Schivardi et al (2017) focus on new lending.
Under the stricter supervision landscape in Europe, however, new lending to zombies may only constitute a
small part of the forbearance strategy of banks. Instead, indirect means of forbearance – i.e. beneficial
4. Subsequent work has shed further light on the nuances of the Japanese episode. Sakai et al. (2010) found
that small firms that eventually defaulted performed worse and paid higher interest rates than surviving
firms. This finding – which contradicts Peek and Rosengren – may reflect differences in sample
composition, particularly the focus on listed firms only in the seminal study. Against this, Akiyoshi and
Kobayashi (2010) directly test for the effect of bank distress on firm productivity and confirm the negative
link. Nishimura et al (2005) find that firms with relatively high MFP exited, while firms with relatively low
MFP stayed in the market, an indication of unnatural selection. Okada and Horioka (2008) argued that the
selection mechanism was disruptive, with banks giving preference to high and low MFP firms, at the
expense of medium MFP firms, who presumably could survive even with rationed credit.
5. Note that the study is conducted using data from the syndicated loan market only, and so misses lending to
SMEs, as well as non-syndicated credit (bonds and loans). Moreover, it takes place in the context of a
policy with likely favourable general equilibrium effects, which could have affected the outlook of the
troubled firms from the point of view of the bank. As such, general equilibrium effects are missing from
the analysis.
6. Note, however, that Schivardi et al (2017) find that a bank recapitalization of 4 billion euros in 2012
(0.25% of GDP), would lead to additional GDP growth of 0.2-0.35% annually for five years, which is
arguably sizable.

ECO/WKP(2017)65
10
restructuring, maturity extension or conversion of the payment structure (i.e. from regular instalments to a
lump-sum payment at maturity) – may be more prevalent. For this reason, we implicitly focus on
forbearance strategies by considering indebtedness when constructing zombie firm indicators, and not only
new lending.7 Second, Schivardi et al (2017) consider the bank-firm relationship, and therefore abstract
from the possibility that lending is restricted because healthy firms lack the profitability required to get
good credit, due to zombie congestion. By contrast, we employ a catch-all approach and thus consider all
types of zombie-friendly behaviour.
2.3 Zombie firms, bank health and insolvency regimes
19. The fact that zombies appear after large shocks in some countries but not others suggests that
there is a potentially important role for structural policies, particularly the extent to which insolvency
regimes foster the timely initiation and resolution of insolvency proceedings.8 In this regard, new evidence
assembled in Adalet McGowan et al (2017a) reveal significant differences across European countries in
barriers to corporate restructuring and the personal costs associated with entrepreneurial failure implied by
national insolvency regimes. Moreover, they demonstrate the potential for reforms to insolvency regimes
to reduce the share of capital sunk in zombie firms. For example, reducing barriers to restructuring to best
practices could reduce the zombie capital share by one-half and one-third in Italy and Greece, respectively.
These gains are partly realized via the restructuring of weak firms, which in turn spurs the reallocation of
capital to more productive firms (Adalet McGowan et al 2017a) and generates MFP gains within laggard
firms via more efficient technological adoption (Adalet McGowan et al 2017c).
20. In a frictionless model, when a firm has trouble meeting its obligations to its debtor it will
relinquish ownership of its collateral. If this is not sufficient to repay the value of the debt, it will enter into
bankruptcy proceedings to determine the value of its assets, which are then sold-off to pay the remainder of
the debt. The faster this process is completed, the sooner will the resources tied to the failing firm be able
to be reallocated to more productive uses. In practice, there can be a number of frictions that emanate from
the inability of the insolvency framework to address the existence of incomplete contracts, which can
severely delay the orderly reallocation process. Smith & Stromberg (2005) argue that the principal role of
an orderly bankruptcy process is to mitigate bargaining frictions between the debtor and its creditor(s). By
preventing a ”rush to the exit” motive, a well-designed insolvency regime verifies the value of assets and
liabilities, it maintains the value of assets during bargaining, and improves coordination among creditors,
among others.9
21. In the context of zombie lending, poorly designed insolvency frameworks are likely to interact
with evergreening motives. Recall that a bank will be willing to evergreen loans to a troubled firm (either
by extending new loans or allowing non-payment of existing loans via restructuring of debt) because it
does not want to write-off losses on its balance sheet and increase provisions. It will do so to the extent to
which the amount recovered is not high enough to cover the increase in provisions or, even if expected
recovery is complete, it is expected to be delayed to such an extent that the bank prefers to evergreen.
7. More specifically, Schivardi et al (2017) examine the classification of NPLs, they do not check to see
whether weak banks have different strategies in how they treat problematic loans, which would be
indicative evidence of forbearance.
8. For instance, we know little about why zombie firms emerged as a widespread phenomenon in 1990s
Japan in contrast to other episodes. As Peek and Rosengren point out, this stands in contrast to the S&L
crisis, where banks quickly shrank their loan portfolios after the shock Indeed, that was the case even
though loose lending standards from the previous decade were also a large part of the problem, and also in
contrast to the last crisis, where debt overhang was a major concern several years after the shock.
9. Similar arguments are made by Marinc & Vlahu (2012), who also underline the role of the bankruptcy
regime in preventing hold-out problems.

ECO/WKP(2017)65
11
Thus, a poorly-designed insolvency framework ultimately implies a lower expected recovery value for the
amounts owed to the bank and it follows that evergreening motives should be higher than under a more
appropriate regime. This leads us to suspect that improvements in bank health are more likely to be
associated with a reduction in the prevalence of zombie firms in countries where insolvency regimes do not
unduly inhibit corporate restructuring.
2.4 Four key issues for investigation
22. Against this background, this paper addresses four key issues. First, it explores whether zombie
firms are more likely to be connected to weak banks, in order to gauge the extent to which bank
forbearance is a relevant policy concern. Second, it examines whether the aforementioned link between
zombie firms and weak banks is conditioned by the design of insolvency regimes, with a view to highlight
potential policy complementarities between financial sector and insolvency regime reform. Third, the
paper explores consequences of the zombie firm-weak bank connection for aggregate productivity via the
channel of capital reallocation. Finally, it contributes to the relatively scarce literature on the channels
through which zombie firms affect growth, by examining whether zombie congestion crowds-out healthy
firms’ access to credit.
3. Empirical framework
3.1 Zombie firms and weak banks
23. Our first aim is to establish a robust connection between zombie firms and weak banks. To this
end, we estimate the following baseline model for 11 countries10
, over the period 2003-2014:
𝒛𝒐𝒎𝒃𝒊𝒆𝒊𝒔𝒄,𝒕 = 𝜶𝟎 + 𝜶𝟏𝑩𝒂𝒏𝒌 𝑯𝒆𝒂𝒍𝒕𝒉𝒊𝒔𝒄,𝒕−𝟐 + 𝑿𝒊𝒔𝒄,𝒕−𝟐𝜣 + 𝜸𝒔𝒄,𝒕 + 𝜺𝒊𝒔𝒄,𝒕. (1)
The dependent variable takes the value of 1 if the firm is classified as a zombie in a given year and 0
otherwise. Bank Health denotes the health of the bank associated with firm i in sector s in country c and is
increasing in health.11
We enter bank health in the model with a two-year lag (t-2) in order to observe it at
beginning of the time window used to define zombie firms (recall that firms are classified as zombies if
they demonstrate persistent financial weakness for three consecutive years) but the results are also highly
robust to using a three-year lag.12
The matrix X is composed of relevant firm-level controls, such as firm
size, firm age and labour productivity.13
We use a rich fixed effect structure, denoted by γ. In our baseline
specification we use a triple-interacted country-sector-year fixed effect, meaning that we control for the
effects of time-varying shocks at the country-industry level, and we thus exploit firm-level variation within
country-sector-year cells. Given our fixed effects structure, we are unable to use logit or probit models, and
10. These include: Austria, Denmark, Estonia, France, Germany, Greece, Latvia, Slovenia, Spain, Portugal,
United Kingdom.
11. Although we mainly rely on the holistic bank health measure, we also briefly explore the role of different
bank balance sheet variables.
12. We do this as we cannot know whether a troubled firm at time t is allowed to survive by its bank because
the bank judges it to have growth potential, or because the bank engages in zombie forbearance. As such,
we need to observe the firm as being troubled for some time in order to be more confident classifying it as
a zombie. At the same time, the timing relationship between bank health and the incentive to allow zombie
firms to survive (”bad” forbearance), or simply engage in temporary forbearance for struggling firms with
good growth prospects (”good” forbearance), is unclear.
13. We do this as we want to control for possible selection on size or age (which have been shown to be
important) or for cases where productive firms are struggling and their banks forbear as they expect to see
profits in the future (in which case forbearance is efficient), and isolate the effect of bank health.
ECO/WKP(2017)65
12
so we estimate all our models with OLS (via linear probability models). Since our working hypothesis is
that healthier banks have less of an incentive to allow zombie firms to stay alive (or remain zombies,
without restructuring their debt), we expect α1<0.
24. One implication of our high-dimensional fixed effects structure is that since we identify off
deviations from within-group (i.e. country-industry-year) means, we potentially underestimate aggregate
effects (which is indeed the case as we show in section 5). Intuitively, over the period we study, there was
a worsening of bank health as a result of the financial crisis initially, and the sovereign debt crisis
subsequently, for each country and sector. By imposing a triple-interacted fixed effect framework, we are
effectively purging a lot of this variation. Thus, after establishing the robustness of our results to
controlling for country-sector-year fixed effects, we also apply a less burdensome fixed effects structure, in
order to produce a less conservative bound for the magnitude of our results. The latter involves controlling
for time fixed effects (to absorb global shocks) and country-industry fixed effects to control for time-
invariant country-specific industry characteristics. We also report an upper bound effect that includes
country-sector fixed effects but omits time effects.
3.2 Zombie firms, bank health and insolvency regimes
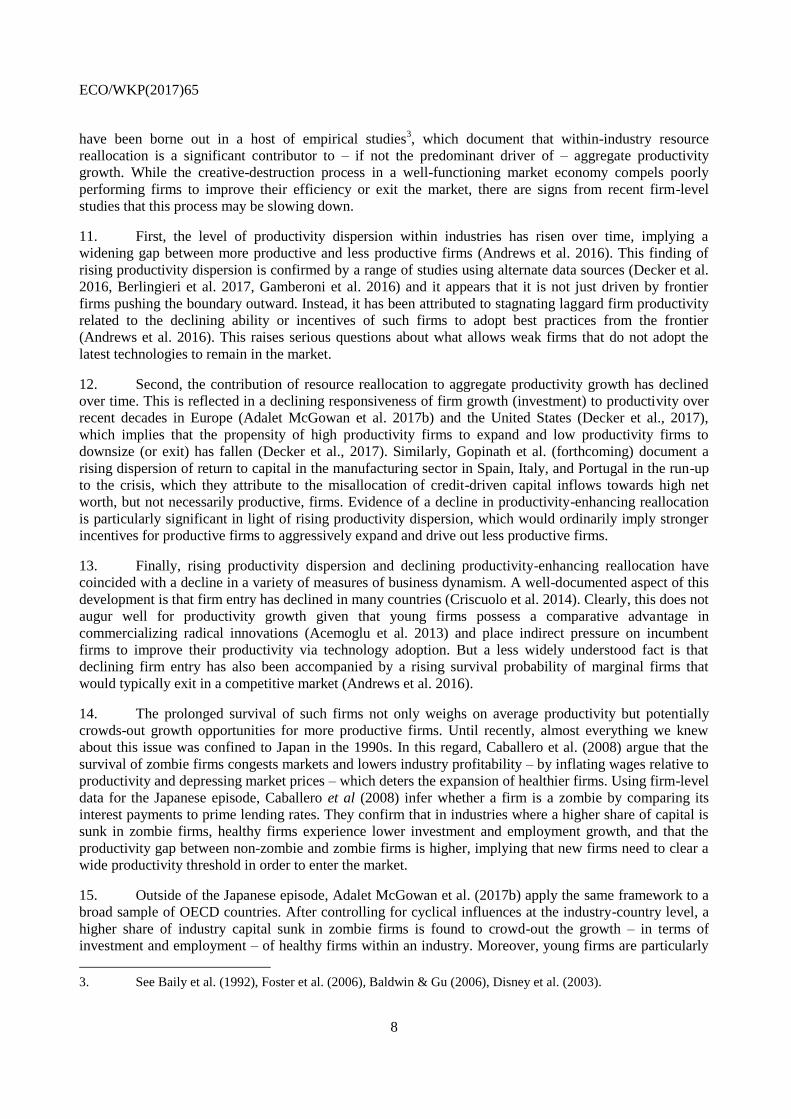
25. Next, we incorporate the insolvency framework indicators. We focus on four indicators, denoted
by INSOLc, as they vary only at the country level and pertain to a single point in time.14
Due to the lack of
temporal variation, the level effect of the indicator variable is absorbed by the country fixed effect, and so
we identify its effect from the interaction with bank health. We augment (1) as follows:
𝑧𝑜𝑚𝑏𝑖𝑒𝑖𝑠𝑐,𝑡 = 𝛼0 + 𝛼1𝐵𝑎𝑛𝑘 𝐻𝑒𝑎𝑙𝑡ℎ𝑖𝑠𝑐,𝑡−2 + 𝛼2𝐵𝑎𝑛𝑘 𝐻𝑒𝑎𝑙𝑡ℎ𝑖𝑠𝑐,𝑡−2 × 𝐼𝑁𝑆𝑂𝐿𝑐
+𝑿𝒊𝒔𝒄,𝒕−𝟐𝜣 + 𝜸𝒔𝒄,𝒕 + 𝜺𝒊𝒔𝒄,𝒕 (2)
26. The insolvency variables are defined as deviations from best practices, so a rising value of the
indicator denotes a framework that is more likely to delay the initiation and resolution of insolvency
proceedings. More specifically, our working assumption is that higher barriers to corporate restructuring,
for example, will reduce the extent to which improvements in bank health translate into a reduction in
zombie firm prevalence. Thus, our prediction is that α1 < 0, as before, and α2>0.
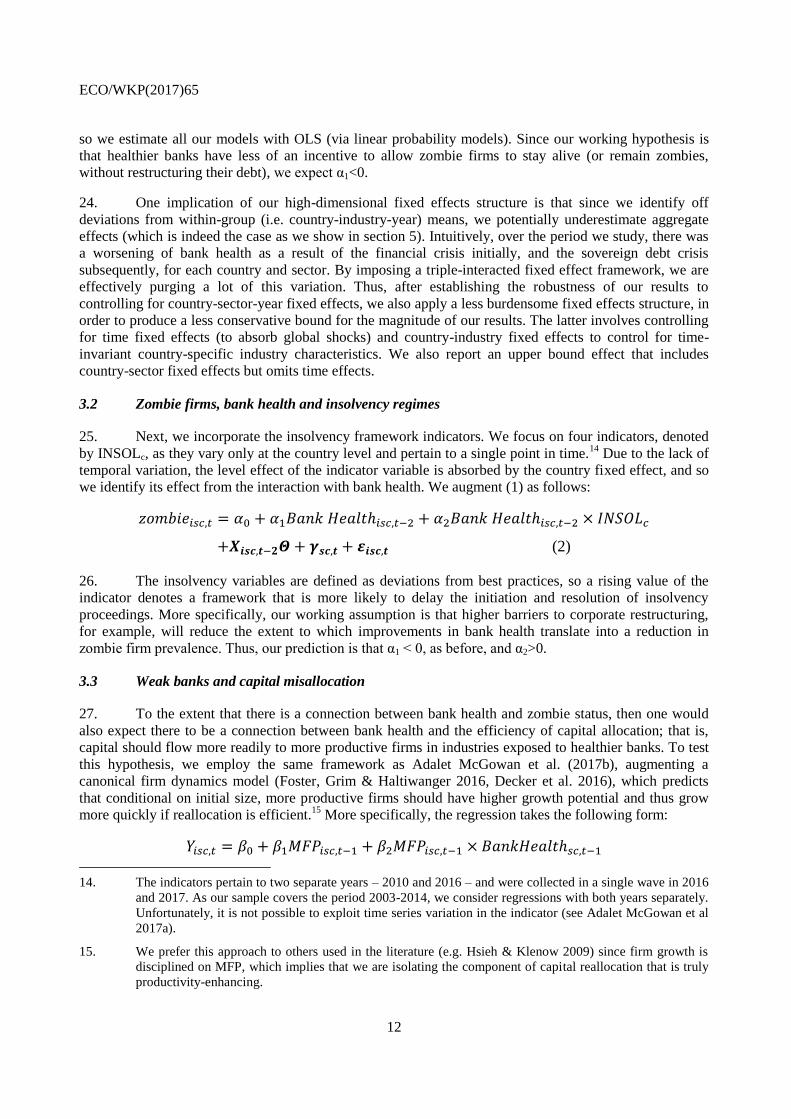
3.3 Weak banks and capital misallocation
27. To the extent that there is a connection between bank health and zombie status, then one would
also expect there to be a connection between bank health and the efficiency of capital allocation; that is,
capital should flow more readily to more productive firms in industries exposed to healthier banks. To test
this hypothesis, we employ the same framework as Adalet McGowan et al. (2017b), augmenting a
canonical firm dynamics model (Foster, Grim & Haltiwanger 2016, Decker et al. 2016), which predicts
that conditional on initial size, more productive firms should have higher growth potential and thus grow
more quickly if reallocation is efficient.15
More specifically, the regression takes the following form:
𝑌𝑖𝑠𝑐,𝑡 = 𝛽0 + 𝛽1𝑀𝐹𝑃𝑖𝑠𝑐,𝑡−1 + 𝛽2𝑀𝐹𝑃𝑖𝑠𝑐,𝑡−1 × 𝐵𝑎𝑛𝑘𝐻𝑒𝑎𝑙𝑡ℎ𝑠𝑐,𝑡−1
14. The indicators pertain to two separate years – 2010 and 2016 – and were collected in a single wave in 2016
and 2017. As our sample covers the period 2003-2014, we consider regressions with both years separately.
Unfortunately, it is not possible to exploit time series variation in the indicator (see Adalet McGowan et al
2017a).
15. We prefer this approach to others used in the literature (e.g. Hsieh & Klenow 2009) since firm growth is
disciplined on MFP, which implies that we are isolating the component of capital reallocation that is truly
productivity-enhancing.

ECO/WKP(2017)65
13
+𝜷𝟑𝑴𝑭𝑷𝒊𝒔𝒄,𝒕−𝟏 × 𝒁𝒐𝒎𝒃𝒊𝒆𝑪𝒂𝒑𝒊𝒕𝒂𝒍𝒔𝒄,𝒕−𝟏 + 𝑿𝒊𝒔𝒄,𝒕−𝟏𝜣 + 𝜸𝒔𝒄,𝒕 + 𝜺𝒊𝒔𝒄,𝒕 (3)
where: Y is the growth in the capital stock for firm i, in sector s, country c, and time t, MFP denotes firm-
level multi-factor productivity measured as a deviation from the country-industry-year average to control
for MFP differences across industries and countries, and Zombie Capital gives the share of industry capital
sunk in zombie firms. We expect β1 to be positive, consistent with the prediction that more productive
firms should grow faster relative to their peers. A positive β2 would indicate that in sectors exposed to
healthy banks, this effect is magnified, and the efficiency of capital reallocation is strengthened. Put
differently, sectors connected to more stressed banks should be characterized by less efficient capital
reallocation. Finally, β3 is expected to be negative, to the extent that a higher share of industry capital sunk
in zombie firms crowds-out the growth of more productive firms (see Adalet McGowan et al. 2017b). The
extent to which weak banks can account for the adverse effect of zombie congestion on capital reallocation
can be quantified by comparing the estimated magnitude of β3 from equation 3 with the estimated
coefficient on MFPxZombie Capital term from a version of equation 3 that excludes the MFPxBankHealth
term.
28. For the reallocation models, we focus on 7 countries from our sample which give us the broadest
estimates of MFP at the firm level. These are Austria, France, Germany, Slovenia, Spain, Portugal, and the
United Kingdom. See Adalet McGowan et al. (2017b) for more details.
3.4 Zombie firms and credit crowd-out
29. Finally, we explore the question of whether the survival of zombie firms crowds-out credit access
to healthier firms, by combining data from ORBIS with SAFE, in a sample of 4 euro area countries
(France, Germany, Italy and Spain). More specifically, we examine whether healthy firms operating in
industries where a higher share of industry capital is sunk in zombie firms have more difficulty obtaining
bank credit, than similar firms in sectors where zombie congestion is lower. The sample chosen is
representative and we utilize the rolling panel component of the survey, which contains firm-level balance
sheet information. The period covered is from 2009 to 2013.
30. The model is as follows:
𝐶𝑟𝑒𝑑𝑖𝑡𝐴𝑣𝑎𝑖𝑙𝑎𝑏𝑖𝑙𝑖𝑡𝑦𝑖𝑠𝑐,𝑡 = 𝛿0 + 𝛿1𝑍𝑜𝑚𝑏𝑖𝑒𝐶𝑎𝑝𝑖𝑡𝑎𝑙𝑠𝑐,𝑡−1 + 𝑋𝑖𝑠𝑐,𝑡−1𝛩 + 𝛾𝑐,𝑡 + 휀𝑖𝑠𝑐,𝑡 [4]
where: Credit Availability is increasing in the extent to which bank loan (or credit line) availability for
firms has improved over time (see section 4.2.4). The remaining variables are defined above. Contrary to
the other models, the bulk of the variation in the zombie capital share is at the sectoral level, since zombie
shares are highly persistent over time (85% autocorrelation). As such, if we add sectoral effects, there is
little variation left. Instead, we use country-year fixed effects – which controls for time-varying country-
specific shocks – and thus our variation comes from sectoral differences within each country in a specific
year. In other words, we purge the industry zombie shares in each country of the country average in a given
year and then exploit sectoral variation, based on 61 sectors (between NACE Rev 2. 10-82, excluding 64-
66 – i.e. financials).

ECO/WKP(2017)65
14
4. Data and definitions
4.1 Micro data sources
31. Our firm-level data come from ORBIS – compiled by Bureau Van Dijk – the largest cross-
country panel database on the balance sheet and output data for firms. We adopt the same data cleaning
and harmonisation procedures as Adalet McGowan et al. (2017b), who closely follow the suggestions of
Gal (2013), Kalemli-Ozcan et al (2015) and Andrews et al (2016). The data is cleaned in a common
manner across all countries, harmonizing balance sheets in terms of consolidation level and time horizon
(calendar year). Firm-level nominal variables are deflated using 2-digit industry deflators from the OECD
STAN database (as firm-level prices are not available, all productivity measures are revenue-based) and
prices are expressed in industry purchasing power parities. We use the methods identified in Gal (2013) to
construct capital stock and productivity variables (see below).16
32. Bank balance sheet data is sourced from Bankscope, which contains data for over 30,000 banks
as far back as 2001. We match ORBIS and Bankscope based on the banker variable in ORBIS, and we
follow the literature and assume that the stated banker relationship also implies a borrowing relationship.
There is ample evidence in the recent literature (Kalemli-Ozcan et al. 2015, Chodorow-Reich 2014) that
lending relationships are highly sticky. Consistent with other papers, we are able to match a very large
fraction of our firms to their main bank (Kalemli-Ozcan et al. 2015, Storz et al. 2017), with match rates
exceeding 90% in most countries. For cases where the firm mentions more than one bank, we assume that
the first bank mentioned is the main one. Summary statistics are given in Table A1. Finally, we exploit
restricted microdata on firms’ access to finance from the Survey on the Access to Finance for Enterprises
(SAFE), run by the European Central Bank (ECB).
4.2 Key variable definitions
4.2.1 Productivity
33. For productivity, we use two different methods, depending on the application, with a goal of
striking a balance between maximizing our sample, and using a robust estimate. As a control variable in
the zombie firm regression analysis, we simply use gross output per employee, deflated using the 2-digit
OECD STAN industry deflators mentioned above, which we denote as labour productivity (LPR). While
this allows us to maximise data coverage, it should be noted that Bartelsman et al. (2013) find that LPR
captures systematic variations in in value-added based labour productivity. For the reallocation regressions,
we follow Adalet McGowan et al. (2017b), and use a productivity measure based on a Solow residual
(MFPR).
4.2.2 Zombie firms
34. We employ two different definitions of zombie firms, each with the view of maximizing our
sample, but our regression estimates are insensitive to the choice of measure. In each case, we only
consider firms aged ten years or more, as start-ups are in general not expected to be profitable. First, we
define as zombies – following Adalet McGowan et al. (2017b) – firms that register an interest coverage
ratio (the ratio of profit to interest payments) below 1 for three years in a row. This measure intends to
capture firms that are not profitable enough to cover debt payments – and thus on the margin of exit in a
competitive market. We presume that these firms are potentially benefiting from creditor forbearance.
16. See Gal (2013) and Andrews et al (2016) for more details.

ECO/WKP(2017)65
15
35. One drawback of the interest coverage (IC) measure is that it requires data on interest payments,
which are often sparsely reported in the countries for which we can successfully match firms to banks. As a
complementary measure, we thus follow Storz et al (2017) and classify the firm as a zombie if it has: i) low
debt service capacity for three years in a row17
; and ii) either negative return on assets or negative
investment for three years in a row. Again, the logic is that firms that have chronically low debt service
capacity, negative returns on assets or negative investment are likely to be on the brink of exit, unless their
creditors allow them to remain operational. This measure, which we call NRI, is highly correlated with the
IC measure (correlation around 0.7), and allows for a larger sample of firms from all countries, plus the
addition of Denmark and Estonia (where interest rate data are scarcely reported). Accordingly, we adopt
this NRI definition when our dependent variable is a binary indicator of zombie firm status in order to
maximise sample coverage, but are careful to show that our results are also robust to using the IC measure.
In sections 5.3 and 5.4, however, where we focus on the zombie capital share and country coverage in
more restricted, we employ the IC measure in order to ensure consistency and comparability with Adalet
McGowan et al (2017b), whose baseline model we adopt.
4.2.3 Bank Health
36. Since the aim is to link bank health as a whole to zombie firms and capital reallocation, and not
to characterize the relevant drivers of a bank balance sheet in detail, we rely on a holistic measure of bank
health. Accordingly, we construct a bank health index by Principal Components Analysis of the following
measures: capital (TCE), NPLs, return on average assets (ROAA), Retail Funding, Z-Score, Net Income,
and Net Interest Income.18
Retail Funding is given by the ratio of retail deposits and total assets, and is
intended to measure the extent to which the bank relies on sticky retail deposits, as opposed to more
volatile wholesale funding (such as money market funds, whose dry-up was a key driver of bank stress in
the euro crisis). The Z-Score is given by the sum of ROAA and TCE, divided by the standard deviation of
ROAA, and captures the riskiness of bank assets. Of course, there are a number of challenges in measuring
bank health (see Box 1), which should be kept in mind.
37. Figure A1 of Appendix A shows the evolution of the average value of the bank health indicator
for the whole sample and for each country in our sample separately. Overall the indicator for each country
aligns well with the evolution of the crisis. The earlier parts of the crisis saw sharp declines in the health of
Baltic banks followed by a relatively swift recovery, whereas the hit came later for Greece (the sharpest as
expected), as well as Portugal, Spain, and Slovenia. Austria, Denmark, France, Germany and the United
Kingdom exhibit much smaller declines in bank health, but typically do not recover to reach pre-crisis
levels of health (partly due to low profitability).
17. Here, we set the limit for low debt service capacity as a ratio of EBIT to financial debt (sum of loans and
long-term debt) below 20%.
18. Principal Components Analysis has become fairly standard in economics, for applications where the
precise nature and number of the relevant variables are unknown and the precise magnitude of each
component variable not important (see Bernanke et al. 2005). Storz et al. (2017) take a similar approach.

ECO/WKP(2017)65
16
Box 2. Measuring bank health
Before proceeding, it is important to note that the ex-ante relationship between bank balance sheet variables and bank health, and by extension lending, is unclear.
1 All things equal, a higher level of regulatory capital is
considered a sign of a healthy balance sheet, but it could also be the result of low risk-taking, and little lending activity. At the same time, banks possessing high quality, high return assets, which generate a steady flow of income with limited risk, may afford to have relatively lower levels of capital adequacy. As such, capital may be a misleading metric of bank health. Risk-weighted (or regulatory) capital could be a potentially better measure but data availability issues force us to use Tangible Common Equity (TCE) as our measure of bank capital, which is typically the most stringent of all regulatory definitions and is not adjusted for risk.
2 The same concerns hold for
alternative indicators of bank health, over and above capital, as they are likely to measure different vulnerabilities. For instance, a high return on average assets (ROAA) and Net Interest Income indicate that a bank can withstand shocks by drawing down cash buffers, while low level of maturity mismatch implies that a bank may be less vulnerable to funding shock. Finally, we cannot observe exactly what determines bank health from the perspective of internal bank management.
3
1. Strictly speaking, bank balance sheets refer to asset, liabilities, and equity capital. Here, we use the term to refer also to variables typically belonging to the bank’s profit and loss (P&L) statement, such as net income or return on assets.
2. TCE is the owner equity after removing preferred stock, goodwill, and intangible assets (the latter two generally refer to difficult to value and highly illiquid assets, such as trademarks). As such, it is typically thought of as the loss-absorbing capacity of the owners of the bank.
3. For example, the health of the bank as judged by its internal risk management framework will determine whether the managers deem the bank to be sound, and hence influence the forbearance strategy
4.2.4 Access to finance for healthy firms
38. To measure healthy firms’ access to finance, we use a restricted microdata version of the Survey
on the Access to Finance for Enterprises (SAFE), designed and run by the ECB to provide insight into the
firms’ perception of credit availability. The relevant question the survey asks firms is whether, compared to
the previous six months, it is more difficult to obtain different types of bank credit; we focus on loans or
credit lines. In each wave, we rescale the response variable as follows: -1 indicates that access to bank loan
availability has worsened over the last six months; 0 indicates no change; and 1 indicates an improvement.
We cumulate the access to bank credit variable across time for the duration of the presence of the firm in
the sample to implicitly create an index of credit availability across time. For instance, if access improves
for both semesters of 2012 and 2013, then the value for 2013 will be 4.19
39. We also use a composite financing gap indicator (see Ferrando et al., 2013) to take into account
credit demand (and not just supply), which makes use of the self-reported change in financing needs for the
firm (increased, decreased, or unchanged). The (rescaled) composite indicator takes a value of -1 for
increased needs and deteriorating availability, -0.5 for either increased needs or deteriorating availability
(but not both), and so forth. Again, responses are cumulated across time.20
4.2.5 Insolvency Framework
40. To test the effect of the insolvency framework on the relationship between bank health and
zombie firms, we make use of a novel set of indicators developed by the OECD (see Adalet McGowan et
19. When we cumulate the semester-level data, we truncate the value to +/- 3, as less than 1% of observations
are outside this set. Results are very similar if instead we use the semester-level variables.
20. In detail for the other values: 0 for unchanged situation (increased need and improved availability,
decreased need and deteriorated availability, or both unchanged); 0.5 for one-sided decreasing financing
gap (decreased needs or improved availability, but not both); and 1 for two-sided decrease in financing gap
(decreased needs and improved availability).

ECO/WKP(2017)65
17
al. (2017a). The set covers 13 different distinct features of the insolvency framework which – based on
international best practice and existing research – may carry adverse consequences for productivity growth
by delaying the initiation of and increasing the length of insolvency proceedings. We focus our attention on
three composite indices – the aggregate index (insol13 – an unweighted average of the 13 components)
plus two sub-indices: barriers to corporate restructuring and the lack of preventative and streamlining
measures.
41. According to these metrics, cross-country differences in the design of insolvency regimes are
significant. For example, the United Kingdom’s low value on the aggregate composite indicators in Figure
2 reflects the fact that the personal costs associated with entrepreneurial failure and barriers to restructuring
are low, while there is also a number of provisions to aid prevention and streamlining. In Estonia, however,
the reverse is true and our working hypothesis is that this is likely to result in an insolvency regime which
delays the timely restructuring of weak firms and thus slows down the reallocation of scarce resources to
their most productive use.21
Figure 2. The design of insolvency regimes across countries, 2016
Increasing in the extent to which the insolvency regime delays the initiation and resolution of proceedings
Note: The stacked bars correspond to three subcomponents of the insolvency indicator in 2016. The diamond corresponds to the value of the aggregate insolvency indicator based on these three subcomponents in 2010. Only countries for which data are available for the three sub-components in 2016 are included.
Source: Calculations based on the OECD questionnaire on insolvency regimes. See Adalet McGowan et al. (2017a).
5. Empirical results
5.1 Are zombie firms connected to weak banks?
42. Figure 3 presents graphical evidence of the relationship between bank health and zombie firms.
The graph shows the share of firms at the country-industry- year level associated with each bank that are
defined as zombies (y variable), plotted against the two-year lags of the bank health composite index (x
21. As discussed in Adalet McGowan et al. (2017a), an inability of creditors to initiate restructuring, a lack of
priority given to new financing over unsecured creditors and an indefinite stay on assets translates into
significant barriers to corporate restructuring in Estonia. Similarly, a lack of early warning mechanisms,
pre-insolvency regimes and special insolvency procedures for Small and Medium-Sized Enterprises
(SMEs) imply that prevention and streamlining is weak in Estonia.
0.0
0.5
1.0
1.5
2.0
2.5
3.0
GB
R
RU
S
FR
A
JP
N
US
A
CH
E
DN
K
CH
L
DE
U
ES
P
FIN
IRL
ISR
SV
N
CR
I
NZ
L
PR
T
AU
T
GR
C
SV
K
ITA
KO
R
ME
X
AU
S
LV
A
PO
L
TU
R
NO
R
SW
E
CA
N
LT
U
BE
L
CZ
E
NL
D
HU
N
ES
T
Personal costs to failed entrepreneurs Lack of prevention and streamlining Barriers to restructuring 2010

ECO/WKP(2017)65
18
variable).22
The red line is a linear regression fit of y on x, purged of country-industry-year fixed effects to
control for cyclical shocks at the country-industry level. For ease of observation, we split the sample of the
x variable into 50 bins of equal size, and each point in the scatter plot gives the sample mean of y for each
bin (after controlling for country-industry-year fixed effects). A strong negative relationship emerges
between bank health and the zombie firm share, which we interpret as evidence that zombie firms are more
likely to be connected to weak banks.
Figure 3. Zombie firms are connected to weak banks
Average zombie firm share for each bin of bank health
Note: The figure uses the binscatter command in Stata to shows the average zombie firm share (based on the NRI definition; see Section 4.2.2) for each bin of bank health, purged of country-industry-fixed effects. The relationship is statistically significant at the 1% level and is based on over 1.5 million firm-bank observations for 11 European countries over the period 2001-2014.
43. Table 1 shows the results from our baseline model for zombies and banks (equation 1). Panel A
shows the results from regressions with country-industry and year fixed effects, which remove time
invariant country-industry effects, and also time-varying global shocks. The model in column 1 includes
only bank capital and NPLs, to focus on the asset side. Both are highly significant and have the expected
signs. Columns 2 and 3 progressively include more balance sheet variables, to account for the role of
income, asset riskiness, and the risk coming from the liability side in the form of maturity mismatch. While
the coefficients always have the expected signs, they are not always significant, illustrating the
multicollinearity problem mentioned previously. As such, column 4 shows results from a model containing
only the composite index, which is an increasing function of bank health. The estimated coefficient is
negative, as expected, and statistically significant at the 1% level.
44. Panel B shows results from the more restrictive model that contains country-industry-year fixed
effects, so variation comes from differences across firms operating in the same country-industry-year cell.
Results are similar for most variables. Although coefficients are for the most part smaller in absolute value,
22. Figure A2 in the appendix shows the corresponding charts for the (seven) individual constituent
components of the bank health index.

ECO/WKP(2017)65
19
as we now control for a substantially larger part of the variation, their signs remain unchanged.23
Crucially,
the composite index of bank health remains highly significant.
Table 1. Zombie firms and bank health: baseline results
Notes: The dependent variable is a binary indicator of zombie status, based on the NRI definition (see Section 4.2.2). All bank balance sheet variables are expressed in two year lags. All regressions include a control for bank size. Firm controls include firm age, lagged productivity, and a set of dummies for firm employment. Standard Errors clustered at the bank level. t statistics in parentheses. * p<0.10, ** p<0.05, *** p<0.01
45. Table A2 explores the relationship further. Column 1 shows the full results of the baseline
regression, with the previously omitted firm level controls shown for exposition purposes.24
In turn,
columns 2-4 demonstrate that the relationship between zombie status and bank health is virtually
unchanged before and after the crisis. This indicates that the forbearance incentives of banks are not simply
a cyclical phenomenon. Of course, the aggregate size of the zombie population and the incentives of banks
to forbear are cyclical, but the marginal incentive does not seem to vary.
23. The coefficients on NPLs are now much smaller in magnitude and insignificant, and the opposite holds for
net interest income.
24. Older firms are more likely to be zombies while firms with high (lagged) productivity are less likely to be
zombies. Micro firms (less than ten employees) appear to be the most likely to be zombies, as expected, as
firms that do not grow are expected to be more problematic.
(1) (2) (3) (4)
Capital -0.0022*** -0.0020** -0.0020*
(-2.71) (-2.27) (-1.94)
NPLs 0.0055*** 0.0056*** 0.0049***
(4.11) (3.59) (3.40)
Net Income -0.0008 -0.0022
(-0.27) (-0.75)
Net Interest Income -0.0042 -0.0021
(-1.30) (-0.58)
Maturity Mismatch -0.0017
(x10) (-1.20)
Z-Score -0.0004*
(x10) (-1.61)
Bank Health -0.0073***
(-4.95)
Firm Controls Yes Yes Yes Yes
N 1534841 1534011 1508501 1508501
R2 0.0784 0.0784 0.0789 0.0786
Capital -0.0008*** -0.0006*** -0.0004***
(-3.30) (-2.49) (-1.87)
NPLs -0.0003 0.0000 -0.0002
(-0.52) (-0.05) (-0.42)
Net Income -0.0006 -0.0011
(-0.66) (-1.07)
Net Interest Income -0.0046*** -0.0037***
(-4.38) (-3.58)
Maturity Mismatch -0.0003
(x10) (-0.69)
Z-Score -0.0004***
(x10) (-3.52)
Bank Health -0.0026***
(-5.31)
Firm Controls Yes Yes Yes Yes
N 1534412 1533582 1508076 1508076
R2 0.1014 0.1014 0.1015 0.1014
Panel A - Country-Industry and Year Fixed Effects
Panel B - Country-Industry-Year Fixed Effects
ECO/WKP(2017)65
20
46. We can gauge the economic magnitude of the effect by comparing the banks at high and low
levels of health. With the NRI definition (column 4 of Table 1, Panel B) of zombies, healthy banks
(defined as those one standard deviation above the bank health variable mean) have a 1.2 percentage points
lower probability of being associated with zombies compared to weak banks (defined as those one standard
deviation below the bank health variable mean). At a mean zombie rate of 13% in the sample, this
translates to roughly 9% difference in zombie incidence between healthy and weak banks relative to the
mean.25
It should be noted that this is most likely a conservative estimate, as it removes country-industry-
year fixed effects. If, for instance, we include country-sector and year fixed effects (i.e. column 4 of Table
1, Panel A), then healthy banks are 1.8 percentage points less likely to be associated with zombies, a
difference in relative incidence of 19%. If we drop year fixed effects, then the corresponding figures rise to
2.2 percentage points and 24%.
47. Table A3 explores the robustness of our baseline estimates. Columns 1-3 show that the
relationship between zombie firms and bank health is evident in manufacturing, services and construction.
Column 4 shows that the coefficient of bank health is still negative and highly significant, when we apply
the interest coverage definition of a zombie firm, instead of NRI (see Section 4.2.2). Column 5 then shows
that the results are robust to excluding firms with less than 20 employees, which tend to be under-
represented in ORBIS (see Gal 2013, Kalemli-Ozcan et al. 2015).
48. The final columns of Table A3 provide further evidence that our estimated relationship between
zombie firms and weak banks is not simply a product of reverse causality, whereby troubled firms would
adversely affect the balance sheets of their banks. While we partly mitigate these concerns above by
entering bank health with a two-year lag, controlling for cyclical shocks and running separate pre and post-
crisis regressions, an alternate approach is to directly remove potential sources of such reverse causality.
Accordingly, Column 6 shows that the estimated relationship is robust to excluding larger firms (i.e. firms
with 50 or more employees). This is significant since bank balance sheets are likely to be more sensitive to
large firms in distress than smaller firms.
49. Removing large firms, however, may not adequately address endogeneity concerns if a given
bank has high indirect exposure, via its connections with a cluster of small firms which together account
for a significant share of sectoral activity. Accordingly, column 7 shows that the results are robust to
removing firm-year observations for cases with high (above median) bank exposure to specific sectors,
defined as the sum of tangible fixed assets of all the firms in a country-sector-year cell with which a bank
is linked, as a fraction of bank assets. This is important in the face of a new literature on the role of
collateral in amplifying sectoral shocks, either through collateral firesales (real estate or equipment) or
through agglomeration effects (Benmelech & Bergman 2011, Benmelech et al. 2014), and particularly
housing in the case of small firms (Banerjee & Blicke 2016). Jaskowski (2015) makes the theoretical
argument that zombie lending may in fact be a rational strategy on the part of banks, who engage in
zombie lending as a way of preventing a string of bankruptcies and forced fire sales. With our approach,
we can thus control for a specific form of this externality (operating specifically through sectoral effects),
and we confirm the robustness of our results.
50. Finally, if a bank was particularly exposed to a sector badly hit by the crisis, then it is possible
that the country-industry-year fixed effect will not fully remove any correlation between bank health and
the error term, thus inducing reverse causality. As a robustness check, we also run an IV regression for
both the NRI and IC definitions (see the final two columns of Table A3), using the pre-crisis lag of bank
25. The magnitude of the effect is slightly larger using the IC definition (Table A3, column 4), where the
difference in probability is 1.2 percentage points, which given a mean zombie rate of 9.4%, implies a
difference of 13% in zombie incidence between healthy and weak banks (defined as those one standard
deviation above/below the bank health variable mean respectively).

ECO/WKP(2017)65
21
health as an instrument. The IV coefficient is actually more negative than OLS, suggesting that, if
anything, the OLS estimate may be biased is downward.26
5.2 Insolvency regimes shape the link between zombie firms and bank health
51. Table 2 shows the estimates of equation 2, where we use insolvency regime indicators for two
separate years: 2016 (Panel A) and 2010 (Panel B). As predicted, the Bank Health×INSOL interaction is
positive and highly significant (column 1 of Panel A). Column 2 shows that this result is mainly driven by
the Barriers to Restructuring (BTR) sub-component and this result is robust to an alternative definition of
zombie firms based on the interest coverage ratio (Figure 4). This suggests that in countries with high
barriers to restructuring weak firms, improvements in bank health are less likely to translate into fewer
zombie firms. This is a central result of the paper: policy initiatives to improve bank health following a
financial crisis are more likely to be associated with a decline in zombie congestion in countries where
insolvency regimes do not unduly inhibit corporate restructuring since such regimes increase the economic
incentives for banks to recognize the loans to zombie firms as non-performing and commence restructuring
or foreclosure proceedings. Thus, there are important complementarities between policy initiatives to
improve bank health and insolvency reform.
Table 2. Zombie firms and bank health: role of insolvency regimes
Notes: The dependent variable is a binary indicator of zombie status, based on the NRI definition (see Section 4.2.2). All regressions include firm productivity, firm age, and dummies for size. All regressors are lagged by two years. INSOL12 is the aggregate measure without rights of employees, and INSOL13 includes rights of employees. Standard Errors clustered at the country-sector level. t statistics in parentheses. * p<0.10, ** p<0.05, *** p<0.01
26. Specifically, we instrument for the second lag of bank health using its fifth lag (and so the seventh lag of
bank health). As we also control for bank size, we have to instrument for it as well (also using its fifth lag),
since bank size is correlated with health, and so failing to instrument for it would violate the exclusion
restriction. See Acemoglu and Angrist (2000) for a similar argument.
Barriers Lack of Barriers
to restructuring prevention to restructuring
Panel A - 2016 indicators
Bank Health -0.0069*** -0.0049*** -0.0035*** -0.0049***
(-3.52) (-6.46) (-4.40) (-6.29)
Bank Health x INSOL 0.0141** 0.0116*** 0.0028 0.0113***
(2.39) (4.56) (1.46) (4.35)
Bank Health x GDP growth -0.0003**
(-2.53)
Bank Health x INSOL xGDP growth 0.0005*
(1.91)
N 1487846 1508076 1508076 1508076
R-squared 0.1011 0.1014 0.1014 0.1015
Panel B - 2010 indicators
Bank Health -0.0052** -0.0053*** -0.0028*** -0.0051***
(-2.54) (-4.17) (-3.57) (-4.11)
Bank Health x INSOL 0.0061 0.0082** 0.0004 0.0075**
(1.31) (2.41) (0.30) (2.29)
Bank Health x GDP growth -0.0004*
(-1.86)
Bank Health x INSOL x GDP growth 0.0006
(1.44)
N 1487846 1487846 1508076 1487846
R-squared 0.1011 0.1011 0.1014 0.1011
Country-Industry-Year FE Yes Yes Yes Yes
(1) (2) (3) (4)
insol13

ECO/WKP(2017)65
22
52. Column 3 shows that the interaction term is not statistically significant for the indicator relating
to prevention and streamlining (LPS), which broadly refer to mechanisms that allow firms under temporary
distress to avoid entering into insolvency. This should not be surprising: zombie firm problems mostly
manifest themselves during slow recoveries after deep recessions brought about by financial crises, when
temporary distress is not expected to be of first order importance. Finally, column 4 repeats the exercise
with barriers to restructuring, except now augmenting the model to include two additional interaction terms
with GDP growth (lagged by two years, as with all other controls). The concern is that, although we
include country-industry-sector fixed effects, our model could be capturing (accidental) correlation
between the insolvency framework and the size of the downturn.27
The main result is robust to this test. In
Panel B, we repeat the same exercise for 2010 values of the insolvency framework. The results for barriers
to restructuring remain highly statistically significant, although the coefficients for the aggregate measures
now become statistically insignificant (though they do maintain the correct sign).28
53. One way to illustrate the importance of the insolvency regime is to estimate how much more
potent the role of a healthy bank would be if the regime were at the level of best practices. In Figure 4, we
plot, for each country in our sample, how the percentage point difference between the zombie-reducing
effect of a healthy bank (one standard deviation above the mean) versus a weak bank (one standard
deviation below the mean) varies according to the design of the insolvency regime, as measured by the
barriers to restructuring indicator (BTR) in 2010. The results in Panel A pertain to the baseline NRI
definition of zombie firms which allows us to include Denmark in the exercise, while Panel B shows the
corresponding exercise based on the interest coverage definition of zombie firms. As the framework
performance is measured in terms of distance from best practice, the blue bars can be interpreted as ”room
for improvement” in terms of reducing zombie prevalence through reforming BTR. By definition, the best
performer in the sample, the United Kingdom, has no room for improvement. For example, Panel B shows
that if Estonia – where barriers to corporate restructuring are high – reformed its insolvency regime to the
sample minimum (i.e. the United Kingdom), then the reduction in the zombie firm share associated with a
two standard deviation improvement in bank health could be around 2.6 percentage points higher than
otherwise.
54. We also show, with red diamonds, the position of the country using the value of BTR in 2016, to
capture the effect of reforms. Several countries, particularly in the euro periphery, have implemented
important reforms, and have gone some way into reducing the incentives of banks to allow zombies to
operate. Reforms to insolvency regimes since 2010 in Greece, Slovenia, and Portugal have managed to
exploit roughly half of the possibilities offered by improving their BTR, with smaller improvements in
Spain and Latvia. Germany has been the most successful in that regard, fully capturing reform
opportunities.
27. If, for instance, Denmark, which was one of the countries least-affected by the crisis, had an insolvency
framework that entailed low barriers to restructuring, it is possible that the effect we capture is purely
driven by such noise.
28. It is unclear why this is the case, but regardless, our focus and intuitive framework relates to barriers to
restructuring mostly, and less so to other features of the framework. The changes in the sample occur
because of small data availability issues for Denmark. In the 2016 wave, there are no data for insol13, and
for the 2010 wave we only have data for LPS.

ECO/WKP(2017)65
23
Figure 4. Insolvency regimes shape the link between zombie firms and bank health
Zombie firm share reduction associated with an improvement in bank health according to the insolvency regimes
A: NRI definition of zombie firms
B: Interest coverage definition of zombie firms
Notes: The graph shows the percentage point difference between the zombie-reducing effect of a healthy bank (one standard deviation above the mean) versus a weak bank (one standard deviation below the mean) under the barriers to restructuring performance (BTR) in 2010. As the BTR indicator is defined as distance from the frontier, the bars indicate the gains from reducing BTR to sample minimum. The red diamonds show the difference in 2016. Given that Denmark lacks insolvency regime indicators for 2010, we assume that the 2010 value is equivalent to the 2016 value and as such do not simulate potential gains from reform. The estimates in Panel A are based on the coefficients in Table 2, while the estimates in Panel B are based on the coefficients in Table A4.
5.3 Weak banks amplify capital misallocation
55. Table 3 and Table A5 show the results from the baseline reallocation regression.29
Row 1 shows
that more productive firms grow at a statistically significantly higher pace, suggesting that the process of
capital reallocation enhances aggregate productivity. Moreover, Row 2 shows that bank health acts as an
29. The regressions in this section use a definition of capital using only tangible fixed assets, but if we use total
fixed assets instead (including intangibles), the results are broadly similar. These results are available from
the authors on request.
01
23
4
GB DK PT FR AT DE GR ES SI LV EE
Zom
bie
reduction (
%)
room for improvement actual improvement
01
23
GB PT FR AT DE GR ES SI EE LV
Zom
bie
reduction (
%)
room for improvement actual improvement

ECO/WKP(2017)65
24
amplifier to the reallocation process: that is, productive firms in industries exposed to healthy banks grow
faster than those in industries exposed to weak banks. Table A5 shows that the relationship between bank
health and capital reallocation is robust across sectors (Panel A) and was not materially affected by the
crisis (Panel C).30
The economic magnitude of this effect is significant: an increase in bank health by one
standard deviation above its mean would raise the difference in the capital growth between high and low
productivity firms (i.e. those one standard deviation above and below the sectoral mean) from 6.6% to
8.3%. As such, the health of the banking system is important in channelling scarce capital to productive
firms and thus underpinning their growth.
Table 3. Capital reallocation, bank health and zombie congestion
Note: The dependent variable is log real capital growth. The zombie capital share is constructed using the IC definition of zombie firms (See Section 4.2.2) for sake of comparability with the estimates in Adalet McGowan et al (2017b). All regressors are lagged. Standard Errors clustered at the country-sector level. t statistics in parentheses. * p<0.10, ** p<0.05, *** p<0.01.
56. Next, we jointly examine bank health and zombie congestion. We do this in steps. First, we
estimate a capital reallocation model that separately includes a zombie capital×MFP interaction (which is
expected to have a negative coefficient; see Adalet McGowan et al., 2017b); then we include also a bank
health×MFP interaction (which is expected to have a positive coefficient). Finally, Column 3 reports the
estimates of the model that includes both interaction terms. Regarding the latter, our expectation is that the
inclusion of the bank health×MFP interaction will reduce the estimated absolute magnitude of the
coefficient on the zombie capital×MFP interaction, as bank health is relevant to both zombie congestion
and capital reallocation.
57. As expected from Adalet McGowan et al. (2017b), a higher zombie capital share dampens the
efficiency of capital reallocation, by moderating the responsiveness of firm capital growth to (lagged)
MFP; moreover, when both interactions are included, they remain highly significant but their absolute
30. There is evidence that reallocation intensity fell during the crisis – which is consistent with the findings of
Foster, Grim & Haltiwanger (2016) for the United States – although this result is driven by the construction
sector (Table A5, Panel B). If we broaden the definition of capital to include intangible assets, however, the
estimated effects are larger and the MFPxCrisis interaction becomes significant for services.
(1) (2) (3)
Full Sample Full Sample Full Sample
TFP 0.0547*** 0.0655*** 0.0616***
(11.63) (9.97) (9.88)
TFPx Bank Health 0.0165*** 0.0147***
(5.35) (4.76)
TFP x Industry Zombie Share -0.1340*** -0.0894**
(-3.16) (-2.29)
Age -0.0019 *** -0.0018*** -0.0018 ***
(-6.53) (-6.42) (-6.43)
10<Employment<24 -0.0212*** -0.0213*** -0.0213***
(-4.25) (-4.27) (-4.29)
25<Employment<49 -0.0154** -0.0154** -0.0155***
(-2.57) (-2.55) (-2.59)
49<Employment<99 -0.0204* -0.0201* -0.0205*
(-1.81) (-1.74) (-1.81)
99<Employment<249 -0.0339*** -0.0344*** -0.0344***
(-2.91) (-2.93) (-2.95)
Employment > 250 -0.0306** -0.0312** -0.0310**
(-2.31) (-2.33) (-2.32)
N 6063141 6063141 6063141
R-squared 0.0612 0.0608 0.0613
Country-Industry-Year FE Yes Yes Yes

ECO/WKP(2017)65
25
magnitude falls, indicating that they are correlated. The coefficient on the zombie capital×MFP interaction
changes from -0.1340 to -0.0894, a fall in absolute magnitude of around 33%. To the extent that causation
runs from bank health to zombie firms, this suggests that around one-third of the distortionary effects of
zombie congestion on capital reallocation can be directly attributed to weak banks which allow zombie
firms to fester.
58. The estimated coefficient in Column 2 (Table 3) imply that if Spain were able to reduce its
zombie capital share to the sample minimum (Slovenia), then the difference in the capital growth between
high and low productivity firms (those one standard deviation above and one standard deviation below
sectoral mean) would be 1.5 percentages points higher. Similarly, if bank health in Spain were at the level
of France in 2012, the gap in capital growth between high and low productivity firms in 2013 would have
been roughly 0.8 percentages points higher (based on the estimated coefficient in Column 1, Table 3).
These estimated effects are economically significant, since the difference in capital growth between high
and low productivity firms fell by 3.6 percentage points31
in Spain from 2004 to 2013, consistent with the
idea that rising capital misallocation is a key driver of the productivity slowdown in Spain (Gopinath et al
2017) and more generally (see Section 2).
5.4 Zombie firms and credit crowd-out
59. Figure 7 shows the binned scatter plot of the sectoral average of the cumulated credit availability
variable for healthy firms against the (lagged) share of zombie capital in the same sector, controlling for
country-year fixed effects. The left panel shows the plot for bank loans, and the right panel for bank credit
lines. We see a clear negative effect of zombie capital on bank credit availability for healthy firms: sectors
with a high share of capital tied to zombie firms, within country-year clusters, are associated with more
restricted access to bank loans. Regression results in Table 4 (Panel A) confirm the graphical evidence, for
both the simple and the composite indicator (which accounts for credit demand).32
Given that our sample is
size is relatively small (12,781 observations for loans, 8,720 for credit lines) and time panel short, these
results should be viewed as indicative.
60. To gauge the magnitude of the effect, it is useful to restrict attention to values at 0 or 1 of the
credit availability indicators, since the sample period is one of gradually improving financing conditions.33
We then regress this transformed variable on the zombie capital share and various control variables. The
results (presented in Panel B of Table 4) show that the estimated log-odds coefficient on the zombie capital
share is less than one, which implies that healthy firms are less likely to access credit when the zombie
capital share is higher. These estimates imply that a one standard-deviation increase in the zombie capital
share is associated with a reduction in the probability of improved loan availability by 1.3 percentage
points (with a similar magnitude for credit lines). Compared to an average probability of improvement in
loan availability of 18.6% at the mean of the distribution, the overall effect is modest, but not trivial.
31. Adalet McGowan et al. (2017b), using a longer dataset, document an even larger impact.
32. An alternative way is to directly control for credit demand, using the self-reported indicator of changing
credit needs. Doing so is similar in spirit to the Khwaja & Mian (2008) approach of using firm fixed-effects
in lending regressions. Running the basic model with the credit availability indicator with dummies for
financing needs gives very similar results.
33. Over the sample period (i.e. 2009 to 2013), we observe a general improvement in lending conditions – save
for 2011H2-2012H1 – which likely tied to the cycle and accommodative monetary policy.

ECO/WKP(2017)65
26
Figure 5. Zombie congestion and access to finance to healthy firms
Healthy firms’ access to credit for each bin of the zombie capital share
Notes: The plot is a fitted line from regressing credit availability on the share of capital in the sector tied to zombie-firms (based on the IC definition), with country-year fixed effects. The scatters show the mean of the vertical axis variable for each bin of the variable on the horizontal axis. The left panel shows results for bank loans, and the one to the right for credit lines.
Table 4. Credit availability for healthy firms and zombie congestion
Notes: The dependent variable is the cumulated indicator of bank credit availability (loans or credit lines) as described in the text, truncated at ± 3, where 0 indicates no change, and higher values improvement in availability. The ordered logit coefficients are expressed in log-odds ratio, whereby values less than 1 indicates that credit is less likely to be available for a given increase in the independent variable of interest The zombie capital share is constructed using the IC definition of zombie firms (See Section 4.2.2). Standard Errors clustered at the country-sector level. t statistics in parentheses. * p<0.10, ** p<0.05, *** p<0.01
61. The negative relationship between credit availability to healthy firms and zombie capital in a
sector could either be the result of lower profitability of potential investments due to zombie congestion, or
limited lending capacity of banks exposed to this particular sector due to zombie forbearance. However,
our sense is that it is more likely to reflect the former. Banks are unlikely, on average, to be overtly
exposed to a specific sector so much so that exposure to zombie firms in that sector substantially hurts their
balance sheet. For instance, the median bank exposure to a specific country-sector-year cell, given by the
total tangible capital of the firms in that particular sector associated with any given bank, is approximately
(1) (2) (3) (4)
Loans Credit Lines Loans Credit Lines
Panel A - Simple Indicator
Zombie Capital Share -0.0052** -0.0048** 0.9901** 0.9889**
in Sector (-2.20) (-2.57) (2.22) (2.55)
Large 0.1399*** 0.1435*** 1.3434*** 1.4879***
(3.46) (4.24) (3.55) (4.78)
Young 0.0039 -0.0144 1.006 0.9809
(0.15) (-0.49) (0.10) (0.25)
N 12781 8720 12781 8720
R2 0.0414 0.0479
Panel B - Composite Indicator
Zombie Capital Share -0.0068** -0.0044** 0.9933 0.9904*
in Sector (-2.13) (-2.08) (1.41) (1.85)
Large 0.1328** 0.1496*** 1.2359** 1.4100***
(2.02) (3.62) (2.18) (4.47)
Young -0.0035 -0.0317 0.9682 0.9602
(-0.08) (-0.90) (0.44) (0.45)
N 10101 7820 10101 7820
R2 0.0336 0.0507
Country-Year FE Yes Yes Yes Yes
B: Ordered logit log-odds ratio coefficientsA: OLS coefficients

ECO/WKP(2017)65
27
0.12% of total bank assets. This makes it unlikely that losses from loans to zombies in a given sector would
affect lending capacity to a healthy firm in the same sector. Of course, this is not to imply that crowd-out
cannot occur through the bank balance sheet. In fact, contrary to the zombie congestion case, credit crowd-
out may spillover to other sectors, but this hypothesis is difficult to address with the data at hand.
6. Conclusion
62. This paper presents robust evidence that zombie firms are more likely to be connected to weak
banks. We use two different zombie definitions with very similar results, and none of them depends on
new lending, but indebtedness, so we account for forbearance. We then show that the effect of bank health
on zombie status is amplified under insolvency regimes that do not unduly inhibit corporate restructuring.
Thus efficient insolvency policies, together with healthier banks, would appear to be important in resolving
the zombie problem, thereby raising aggregate productivity growth.
63. Next, we show that healthy banks foster productivity-enhancing capital reallocation, the process
by which productive firms grow relatively more. We also show that about one-third of the negative effects
of zombie congestion on the efficiency of reallocation, identified in earlier work, could be attributed to
weak banks.
64. Finally, we offer some evidence on the mechanism behind zombie congestion. The negative
zombie effects on reallocation and productivity have been attributed to congestion effects (competition) or
the credit crowd-out. However, little is known about the crowd-out channel. We provide some evidence of
the existence of credit crowd-out, using SAFE. Results are indicative due to the small sample, but we
document a modest but statistically significant effect: healthy firms report smaller improvements in access
to finance in sectors with a high share of capital tied to zombie firms. This would suggest that zombie
congestion works mostly through reduced profits for healthy firms, which reduce expected return on
projects, and as a result lead to worse borrowing opportunities.
65. Set in the broader context of the productivity slowdown and the aftermath of the global financial
crisis, which has hurt bank and firm balance sheets, our results can carry important implications. As rising
capital misallocation has been shown to be a key driver of the aggregate productivity slowdown (Gopinath
et al 2017), while zombie congestion is intimately linked to the other key micro dimensions to the
slowdown, such as rising productivity dispersion (Andrews et al 2016) and declining business dynamism
(Decker et al. 2016), identifying and correcting the distortions which disrupt the natural market selection
mechanism is vital to reviving productivity growth.
66. The results imply that in order to facilitate the unwinding of the zombie problem, it is essential
that bank balance sheets are strong, underlining the need for fast recapitalizations after crises and other
measures to reduce NPLs. But strengthening banks is an insufficient policy response while insolvency
regimes remain hostile to the orderly restructuring and resolution of weak firms. Thus, in countries with
weak banks and weak insolvency regimes, efforts to improve banks’ health should be accompanied by
appropriate insolvency reforms to reduce impediments to corporate restructuring. At the same time,
countries with strong firms and banks should view the establishment of an efficient insolvency framework
as equivalent to a macro-prudential tool, to be used in conjunction with post-crisis recapitalisation.

ECO/WKP(2017)65
28
REFERENCES
Acemoglu, D., U. Akcigit, N. Bloom and W. Kerr (2013), “Innovation, Reallocation and Growth”, NBER
Working Papers, No. 18993.
Acemoglu, D. and J. Angrist (2000), “How Large Are Human-Capital Externalities? Evidence from
Compulsory Schooling Laws”, NBER Macroeconomics Annual, Vol. 15, 9-59.
Acharya, V., Eisert, T., Eufinger, C. & Hirsch, C. (2017), “Whatever it takes: The Real Effects of
Unconventional Monetary Policy”, Mimeo.
Adalet McGowan, M. and D. Andrews (2016), “Insolvency Regimes and Productivity Growth: A
Framework for Analysis”, OECD Economics Department Working Papers, No. 1309.
Adalet McGowan, M., D. Andrews and V. Millot (2017a), “Insolvency Regimes, Zombie Firms and
Capital Reallocation”, OECD Economics Department Working Papers, No. 1399.
Adalet McGowan, M., D. Andrews and V. Millot (2017b), “The Walking Dead: Zombie Firms and
Productivity Performance in OECD Countries”, OECD Economics Department Working Papers,
No. 1372.
Adalet McGowan, M., D. Andrews and V. Millot (2017c), “Insolvency Regimes, Technology Diffusion
and Productivity Growth: Evidence from Firms in OECD Countries”, OECD Economics Department
Working Papers, forthcoming.
Akiyoshi, F. & Kobayashi, K. (2010), “Banking Crisis and Productivity of Borrowing Firms: Evidence
from Japan”, Japan and the World Economy 22(3), 141–150.
Andrews, D., Criscuolo, C. & Gal, P. (2016), “The Best versus the Rest: The Global Productivity
Slowdown, Divergence across Firms and the Role of Public Policy”, OECD Productivity Working
Paper, No. 2.
Australian Productivity Commission (2015), “Business Set-up, Transfer and Closure”, Draft Report,
Canberra.
Baily, M. N., Hulten, C. & Campbell, D. (1992), “Productivity dynamics in manufacturing plants”,
Brookings Papers on Economic Activity: Microeconomics pp. 187–249.
Baldwin, J. & Gu, W. (2006), “Competition, firm turnover and productivity growth”, Research Paper
Series, Statistics Canada.
Banerjee, R. & Blicke, K. (2016), “Housing Collateral and Small Firm Activity in Europe”, BIS Working
Paper No. 575.
Bank of England (2013), “Inflation Report”, Bank of England, London.
Bank of Korea (2013), “Financial Stability Report”, Bank of Korea, Seoul.
Bartelsman, E., J. Haltiwanger and S. Scarpetta (2013), “Cross-Country Differences in Productivity: The
Role of Allocation and Selection”, American Economic Review 103(1), 305–334.
Benmelech, E. & Bergman, N. (2011), “Bankruptcy and the Collateral Channel”, Journal of Finance 66(2),
337–378.
Benmelech, E., Bergman, N., Milanez, A. & Mukharlyamov, V. (2014), “The Agglomeration of
Bankruptcy”, NBER Working Paper, No. 20254.
Berlingieri, G., Blanchenay, P. & Criscuolo, C. (2017), “The Great Divergence(s)”, OECD Science,
Technology and Industry Policy Papers.
ECO/WKP(2017)65
29
Bernanke, B., Boivin, J. & Eliasz, P. (2005), “Measuring the Effects of Monetary Policy: A Factor-
Augmented Vector Autoregressive (FAVAR) Approach”, Quarterly Journal of Economics 120,
387–422.
Caballero, R., Hoshi, T. & Kashyap, A. (2008), “Zombie Lending and Depressed Restructuring in Japan”,
American Economic Review 98(5), 1943–1977.
Chodorow-Reich, G (2014), “The Employment Effects of Credit Market Disruptions: Firm-Level Evidence
from the 2008-09 Financial Crisis”, Quarterly Journal of Economics 129(1), 1–59.
Criscuolo, C., Gal, P. & Menon, C. (2014), “The Dynamics of Employment Growth: New Evidence from
18 Countries”, OECD Science, Technology and Industry Policy Papers.
Decker, R., Haltiwanger, J., Jarmin, R. S. & Miranda, J. (2016), “Changing Business Dynamism and
Productivity: Shocks vs. Responsiveness”, Unpublished Manuscript.
Decker, R., Haltiwanger, J., Jarmin, R. S. & Miranda, J. (2017), “Declining Dynamism, Allocative
Efficiency, and the Productivity Slowdown”, American Economic Review: Papers and Proceedings
107(5), 322–326.
Disney, R., Haskel, J. & Heden, Y. (2003), “Restructuring and Productivity Growth in UK
Manufacturing”, Economic Journal pp. 666–694.
Ferrando, A., Griesshaber, N., Koehler-Ulbrich, P., Perez-Duarte, S. & Schmitt, N. (2013), “Measuring the
opinion of firms on the supply and demand of external financing in the euro area”, IFC Bulletin,
Bank for International Settlements 36, 283–303.
Foster, L., Grim, C. & Haltiwanger, J. (2016), “Reallocation in the Great Recession: Cleansing or Not?”,
Journal of Labor Economics 34(1), S293–S331.
Foster, L., Grim, C., Haltiwanger, J. & Wolf, Z. (2016), “Firm-Level Dispersion in Productivity: Is the
Devil in the Details?”, American Economic Review: Papers and Proceedings 106(5), 95–98.
Foster, L., Haltiwanger, J. & Krizan, C. J. (2006), “Market Selection, Reallocation, and Restructuring in
the U. S Retail Trade Sector in the 1990s”, Review of Economics and Statistics 88(4), 748–758.
Gal, P. (2013), “Measuring Total Factor Productivity at the Firm Level using OECD-ORBIS”, OECD
Economics Department Working Papers No. 1049.
Gamberoni, E., Giordano, C. & Lopez-Garcia, P. (2016), “Capital and Labour (mis)allocation in the Euro
Area: Some Stylized Facts and Determinants”, ECB Working Paper.
Gopinath, G., Kalemli-Ozcan, S., Karabarbounis, L. & Villegas-Sanchez, C. (2017), “Capital Allocation
and Productivity in South Europe”, Quarterly Journal of Economics, forthcoming.
Hiatt, S., Sine, W. & Tolbert, P. (2009), “From Pabst to Pepsi: The Deinstitutionalization of Social
Practices and the Creation of Entrepreneurial Opportunities”, Administrative Science Quarterly pp.
635–667.
Hoetker, G. & Agarwal, R. (2007), “Death Hurts, But It Isn’t Fatal: The Postexit Diffusion of Knowledge
Created by Innovative Companies”, Academy of Management Journal pp. 446–467.
Hopenhayn, H. (1992), “Entry, Exit, and Firm Dynamics in Long Run Equilibrium”, Econometrica 60(5),
1127–1150.
Hsieh, C.-T. & Klenow, P. J. (2009), “Misallocation and Manufacturing TFP in China and India”, The
Quarterly Journal of Economics 124(4), 1403–1448.
Jaskowski, M. (2015), “Should zombie lending always be prevented?”, International Review of Economics
& Finance 40C, 191–203.
ECO/WKP(2017)65
30
Kalemli-Ozcan, S., Laeven, L. & Moreno, D. (2015), “Debt Overhang, Rollover Risk and Investment in
Europe”, Mimeo, University of Maryland.
Khwaja, A. I. & Mian, A. (2008), “Tracing the impact of bank liquidity shocks: Evidence from an
emerging market”, American Economic Review 98(4), 1413–42.
Kwon, H., Narita, F. & Narita, M. (2015), “Resource reallocation and zombie lending in Japan in the
1990s”, Review of Economic Dynamics 18, 709–732.
Marinc, M. & Vlahu, R. (2012), The Economics of Bank Bankruptcy Law, Springer-Verlag, Berlin-
Heidelberg.
Nishimura, K., Nakajima, T. & Kiyota, K. (2005), “Does the Natural Selection Mechanism Still Work in
Severe Recessions? Examination of the Japanese Economy in the 1990s”, Journal of Economic
Behavior and Organization 58, 53–78.
Okada, T. & Horioka, C. (2008), “A Comment on Nishimura, Nakajima, and Kiyota”s “Does the Natural
Selection Mechanism Still Work in Severe Recessions? Examination of the Japanese Economy in
the 1990s”“, Journal of Economic Behavior & Organization 67, 517–520.
Ollivaud, P., Y. Guillemette and D. Turner (2016), “The Links between Weak Investment and the
Slowdown in OECD Productivity and Potential Output Growth”, OECD Economics Department
Working Papers, No. 1304.
Peek, J. & Rosengren, E. (2005), “Unnatural Selection: Perverse Incentives and the Misallocation of Credit
in Japan”, American Economic Review 95(4), 1144–1166.
Sakai, K., Uesugi, I. & Watanabe, T. (2010), “Firm Age and the Evolution of Borrowing Costs: Evidence
from Japanese Small Firms”, Journal of Banking & Finance 34(8), 1970–1981.
Schivardi, F., Sette, E. & Tabellini, G. (2017), “Credit Misallocation During the European Financial
Crisis”, Bank of Italy Working Paper.
Smith, D. & Stromberg, P. (2005), Maximizing the Value of Distressed Assets: Bankruptcy Law and the
Efficient Reorganization of Firms, Cambridge University Press.
Storz, M., Koetter, M., Setzer, R. & Westphal, A. (2017), “Do We Want these two to Tango? On Zombie
Firms and Stressed Banks in Europe”, Mimeo, ECB.
Syverson, C. (2011), “What Determines Productivity?” Journal of Economic Literature 49(2), 326–365.

ECO/WKP(2017)65
31
APPENDIX A: ADDITIONAL TABLES AND FIGURES
Table A1. Summary statistics
N Mean Median S.D. Min Max
Firms
Tangible Fixed Assets (1000s) 2,141,170 8504 135 298754 0 1.28E+08
Tangibility 2,140,963 0.217 0.132 0.229 0 11.523
Number of employees 2,202,818 111 11 1860 1 477100
Zombie (IC) 1,854,147 0.073 0.26 0 1
Zombie (NRI) 2,093,000 0.098 0.298 0 1
Number of employees
Below 10 1,031,694
Between 10 and 19 385,345
Between 20 and 49 384,261
Between 50 and 99 168,819
Between 100 and 249 129,083
Over 250 103,616
Banks
Bank Health 2,202,818 -0.139 0.02 1.649 -8.964 5.592
Tangible Common Equity (% assets) 2,202,818 5.38 4.81 3.86 -72.8 98.96
NPLs(% assets) 2,202,818 1.6 0.831 2.48 0 90.61
ROAA 2,202,818 0.275 0.36 1.32 -58.11 29.89
Z-Score 2,202,818 37.94 14.95 83.04 -34.89 3891.32
Net Income (% assets) 2,202,818 0.252 0.356 1.373 -82.24 25
Net Interest Income (% assets) 2,202,818 1.617 1.58 0.82 -3.13 29.29
Deposits (% liabilities) 2,202,818 53.431 51.68 19.2 0 100

ECO/WKP(2017)65
32
Table A2. Zombie firms and bank health: role of the crisis
Notes: The dependent variable is a binary indicator of zombie status. All bank balance sheet variables are expressed in two years lags. All regressions include a control for bank size. Firm controls include firm age, lagged productivity, and a set of dummies for firm employment.
Standard Errors clustered at the country-sector level. t statistics in parentheses.
* p<0.10, ** p<0.05, *** p<0.01
(1) (2) (3) (4)
Full Sample Pre-Crisis Crisis Full Sample
Bank Health -0.0026*** -0.0022** -0.0028*** -0.0028***
(-5.31) (-2.43) (-4.75) (-3.52)
Crisis x Bank Health 0.0002
(0.29)
Age 0.0005*** 0.0004*** 0.0005*** 0.0005***
(5.60) (4.72) (5.69) (5.60)
Labor Productivity -0.0377*** -0.0282*** -0.0432*** -0.0377***
(-10.41) (-15.52) (-9.24) (-10.41)
10<Employment<24 -0.0095*** -0.0074** -0.0104*** -0.0095***
(-3.73) (-2.15) (-4.37) (-3.73)
25<Employment<49 -0.0048* -0.0015 -0.0067* -0.0048*
(-1.65) (-0.58) (-1.83) (-1.65)
49<Employment<99 0.0104** 0.0149*** 0.0074 0.0104**
(2.42) (5.23) (1.20) (2.42)
99<Employment<249 0.0166*** 0.0210*** 0.0139* 0.0166***
(3.01) (4.09) (1.86) (3.01)
Employment > 250 0.0138** 0.0183*** 0.0111 0.0138**
(2.45) (4.41) (1.45) (2.45)
Country-Industry-Year FE Yes Yes Yes Yes
N 1508076 578756 929320 1508076
R2 0.1014 0.0442 0.1043 0.1014

ECO/WKP(2017)65
33
Table A3. Zombie firms and bank health: robustness tests
Notes: The dependent variable is a binary indicator of zombie status based on the NRI definition, with the exception of column 4 and 9. All bank balance sheet variables are expressed in two years lags. All regressions include a control for bank size. Firm controls include firm age, lagged productivity, and a set of dummies for firm employment.
Standard Errors clustered at the country-sector level. t statistics in parentheses. The Stock-Yogo critical values for 10% maximal IV size are 7.03 - higher values of the Kleibergen-Papp F-statistic indicate rejection of weak-instrument null.
* p<0.10, ** p<0.05, *** p<0.01
(1) (2) (3) (4) (5) (6) (7) (8) (9)
Manufacturing Services Construction IC Over 20 Below 50 Low Exposure IV - NRI IV - IC
Bank Health -0.0026*** -0.0023*** -0.0040*** -0.0026*** -0.0033*** -0.0025*** -0.0029*** -0.0054** -0.0051**
(-3.19) (-3.59) (-4.75) (-5.31) (-3.94) (-5.18) (-4.75) (-2.45) (-2.12)
Age 0.0003** 0.0006*** 0.0003*** 0.0005*** 0.0003*** 0.0007*** 0.0005*** 0.0006*** 0.0008***
(2.40) (7.22) (3.50) (5.60) (4.43) (6.97) (5.39) (5.10) (7.11)
Labor Productivity -0.0503*** -0.0399*** -0.0218*** -0.0377*** -0.0229*** -0.0414*** -0.0371*** -0.0487*** -0.0336***
(-11.55) (-8.98) (-7.87) (-10.41) (-9.78) (-11.20) (-12.04) (-12.94) (-9.71)
10<Employment<24 -0.0072** -0.0075*** -0.0151*** -0.0095*** -0.0122*** -0.0114*** -0.0003
(-2.45) (-2.88) (-3.44) (-3.73) (-5.05) (-3.49) (-0.10)
25<Employment<49 -0.0010 -0.0008 -0.0155*** -0.0048* -0.0116*** -0.0073 0.0049
(-0.30) (-0.26) (-3.57) (-1.65) (-3.61) (-1.44) -1.13
49<Employment<99 0.0277*** 0.0101** -0.0119** 0.0104** 0.0428 0.0041 0.0221***
(5.84) (1.99) (-2.39) (2.42) (1.14) -0.62 -4.24
99<Employment<249 0.0411*** 0.0122* -0.0098 0.0166*** 0.0709 -0.0012 0.0276***
(7.06) (1.95) (-1.59) (3.01) (1.46) (-0.16) -4.85
Employment > 250 0.0489*** 0.0058 -0.0214*** 0.0138** 0.0082 -0.0134* 0.0215***
(9.35) (0.91) (-3.13) (2.45) (1.29) (-1.66) -2.71
Employment 0.0000 0.0000***
(-0.96) (3.54)
Employment square 0.0000 -0.0000***
(0.19) (-2.71)
Country-Industry-Year FE Yes Yes Yes Yes Yes Yes Yes Yes Yes
N 357421 889924 260731 1508076 556375 1214627 679161 510859 466875
R2 0.107 0.092 0.1331 0.1013 0.0798 0.1132 0.1132
Kleibergen-Paap F-statistic 13.322 14.661

ECO/WKP(2017)65
34
Table A4. Zombie firms, bank health and insolvency regimes: robustness
Robustness to interest coverage (IC) definition of zombie firms
Notes: The dependent variable is a binary indicator of zombie status, based on the IC definition (see Section 4.2.2). All regressions include firm productivity, firm age, and dummies for size. All regressors are lagged by two years. INSOL12 is the aggregate measure without rights of employees, and INSOL13 includes rights of employees. Standard Errors clustered at the country-sector level. t statistics in parentheses. * p<0.10, ** p<0.05, *** p<0.01
insol13 Barriers Lack of Barriers
to restructuring prevention to restructuring
Panel A - 2016 indicators
Bank Health -0.0067*** -0.0053*** -0.0033*** -0.0053***
(-3.45) (-5.48) (-3.56) (-5.42)
Bank Health x INSOL 0.0141** 0.0144*** 0.003 0.0141***
(2.39) (4.43) (1.17) (4.28)
Bank Health x GDP growth -0.0003***
(-3.67)
Bank Health x INSOL xGDP growth 0.0007***
(2.76)
N 1387620 1389844 1389844 1389844
R-squared 0.0583 0.0585 0.0585 0.0585
Panel B - 2010 indicators
Bank Health -0.0038** -0.0049*** -0.0024*** -0.0046***
(-2.19) (-3.89) (-2.56) (-3.82)
Bank Health x INSOL 0.0031 0.0076** -0.0003 0.0068**
(0.83) (2.38) (-0.23) (2.17)
Bank Health x GDP growth -0.0004***
(-2.67)
Bank Health x INSOL x GDP growth 0.0007**
(2.04)
N 1387620 1387620 1387620 1387620
R-squared 0.0583 0.0583 0.0584 0.0584
Country-Industry-Year FE Yes Yes Yes Yes
(1) (2) (3) (4)
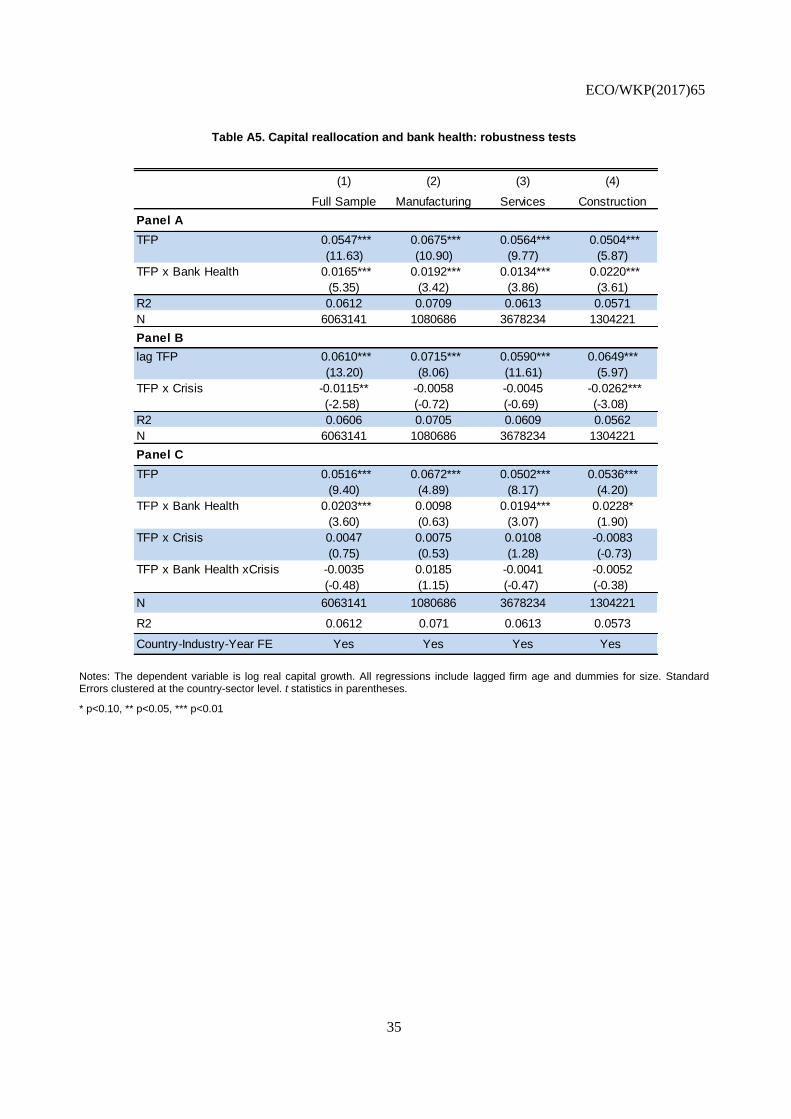
ECO/WKP(2017)65
35
Table A5. Capital reallocation and bank health: robustness tests
Notes: The dependent variable is log real capital growth. All regressions include lagged firm age and dummies for size. Standard Errors clustered at the country-sector level. t statistics in parentheses.
* p<0.10, ** p<0.05, *** p<0.01
Full Sample Manufacturing Services Construction
Panel A
TFP 0.0547*** 0.0675*** 0.0564*** 0.0504***
(11.63) (10.90) (9.77) (5.87)
TFP x Bank Health 0.0165*** 0.0192*** 0.0134*** 0.0220***
(5.35) (3.42) (3.86) (3.61)
R2 0.0612 0.0709 0.0613 0.0571
N 6063141 1080686 3678234 1304221
Panel B
lag TFP 0.0610*** 0.0715*** 0.0590*** 0.0649***
(13.20) (8.06) (11.61) (5.97)
TFP x Crisis -0.0115** -0.0058 -0.0045 -0.0262***
(-2.58) (-0.72) (-0.69) (-3.08)
R2 0.0606 0.0705 0.0609 0.0562
N 6063141 1080686 3678234 1304221
Panel C
TFP 0.0516*** 0.0672*** 0.0502*** 0.0536***
(9.40) (4.89) (8.17) (4.20)
TFP x Bank Health 0.0203*** 0.0098 0.0194*** 0.0228*
(3.60) (0.63) (3.07) (1.90)
TFP x Crisis 0.0047 0.0075 0.0108 -0.0083
(0.75) (0.53) (1.28) (-0.73)
TFP x Bank Health xCrisis -0.0035 0.0185 -0.0041 -0.0052
(-0.48) (1.15) (-0.47) (-0.38)
N 6063141 1080686 3678234 1304221
R2 0.0612 0.071 0.0613 0.0573
Country-Industry-Year FE Yes Yes Yes Yes
(1) (2) (3) (4)

ECO/WKP(2017)65
36
Figure A1. The evolution of bank health

ECO/WKP(2017)65
37
Notes: The chart gives average bank health for banks in our dataset (11 countries), weighted by the number of firms for which a bank is considered to be their main bank. Bank health is given by the first principal component (i.e. the one associated with the largest eigenvalue) from a principal component analysis of seven core balance sheet and financial statement variables of banks. These are tangible common equity, net income, net interest income, NPLs, Z-score (a measure of riskiness of assets), return on average assets, and retail funding, all as a share of total assets.

ECO/WKP(2017)65
38
Figure A2. Zombie firms and weak banks: additional evidence