breakdown of order in a self-organised barrier discharge
TRANSCRIPT
Eur. Phys. J. D (2012) 66: 214DOI: 10.1140/epjd/e2012-30220-4
Regular Article
THE EUROPEANPHYSICAL JOURNAL D
Breakdown of order in a self-organised barrier discharge
R. Wilda and L. Stollenwerk
University of Greifswald, Institute of Physics, Felix-Hausdorff Str. 6, 17489 Greifswald, Germany
Received 2 April 2012 / Received in final form 4 June 2012Published online 28 August 2012c© The Author(s) 2012. This article is published with open access at Springerlink.com
Abstract. In this work, we investigate the transition of a hexagonal patterned self-organised barrier dis-charge into a stochastic distributed pattern during voltage reduction. The techniques of 2D Fourier trans-formation and, for the first time, the triple correlation function are used. Introducing measures for theangular and radial order it is possible to observe a supercritical bifurcation scenario for the decaying order.A chronological sequence of an angular and a radial breakdown of the pattern has been revealed. Possiblelimits of reproducibility and dependence on the frequency of the applied voltage are estimated.
1 Introduction
Barrier discharges (BD) are gas discharge systems whoseelectrodes confine a discharge gap that hosts at least onedielectric barrier. The resulting capacitance in the elec-tric circuit allows for an operation solely in AC mode.This particular plasma source permits applications suchas ozone generation, surface modification, and plasma dis-play panels [1–3]. Recent investigations even deal with theapplication in the medical field [4,5].
Laterally extended systems, i.e. systems where the lat-eral extension is much larger than the discharge gap, havebeen found to produce self-organised structures. In thiscase, the discharge breaks up into a number of filamentsthat may show a collective behaviour yielding higher or-dered structures. That way, the structures are observedto be e.g. hexagonal [6,7], squared [8], or an arrangementof concentric rings [9,10]. Further, it has been observedthat it is possible to change the pattern by some variationof an operation parameter, such as the applied voltage orfrequency [11,12].
In this work, we investigate the transition process froma hexagonal pattern to a random arrangement of the fil-aments that occurs during the reduction of the appliedvoltage amplitude. The process is then investigated using2D Fourier transformation and the triple correlation func-tion. For both of these tools, a characteristic feature ofthe hexagonal pattern is used to define a measure for thehexagonal order. That way, the bifurcation behaviour canbe investigated under parameter variation.
This contribution continues with a description of theexperimental setup (Sect. 2) and a brief introduction tothe triple correlation function (Sect. 3). The result sec-tion contains the discussion of the observed phenomenon
a e-mail: [email protected]
U
observation
gas ITO glass spacer glass ITO
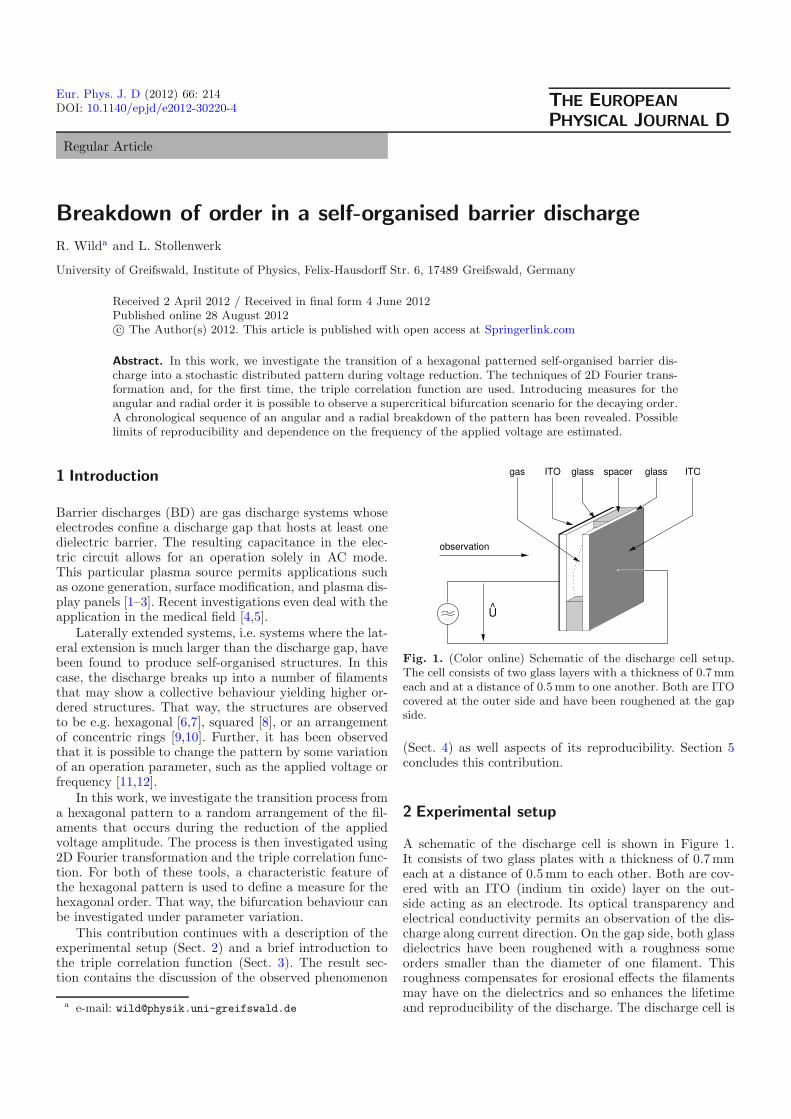
Fig. 1. (Color online) Schematic of the discharge cell setup.The cell consists of two glass layers with a thickness of 0.7 mmeach and at a distance of 0.5 mm to one another. Both are ITOcovered at the outer side and have been roughened at the gapside.
(Sect. 4) as well aspects of its reproducibility. Section 5concludes this contribution.
2 Experimental setup
A schematic of the discharge cell is shown in Figure 1.It consists of two glass plates with a thickness of 0.7mmeach at a distance of 0.5mm to each other. Both are cov-ered with an ITO (indium tin oxide) layer on the out-side acting as an electrode. Its optical transparency andelectrical conductivity permits an observation of the dis-charge along current direction. On the gap side, both glassdielectrics have been roughened with a roughness someorders smaller than the diameter of one filament. Thisroughness compensates for erosional effects the filamentsmay have on the dielectrics and so enhances the lifetimeand reproducibility of the discharge. The discharge cell is

Page 2 of 6 Eur. Phys. J. D (2012) 66: 214
mounted in a closed chamber. Since the experiments wereperformed without gas flow, the chamber was evacuatedand refilled after each measurement.
All presented experiments are performed in pure he-lium at a pressure of 200 hPa. The discharge is electricallysupplied with a function generator (HP 33120A) whosesinusoidal signal is amplified to voltage amplitudes of sev-eral hundred volts (AMT 0.6B100-LC). The amplifier lim-its the supply voltage frequency to about 100 kHz. Theelectrical behaviour is monitored with a digital oscillo-scope (Yokogawa 700430, 150MHz). The applied voltageamplitude U is measured via a voltage divider, the realcurrent through the discharge is measured via a Wheat-stone bridge. The lateral structure of the discharge is ac-quired with a Proxitronic image intensified camera thathas a resolution of 512 × 480 px. An exposure time of200μs and a frame rate of 250 fps were used. Because ofthe decreasing luminosity of the discharge at low frequen-cies, the lowest used frequency is limited by the sensitivityof the camera to 50kHz. In the post processing, images areaveraged over three camera frames to reduce noise, and in-homogenities in the camera sensitivity are equalised.
3 The triple correlation function
The triple correlation function (TCF) is used to evaluatethe occuring patterns in the discharge. It can be applied toany structure that allows to determine reliable positionsof the available substructures, e.g. filaments. In general,the structure must consist of solitary objects of any form.Unlike the two-dimensional fourier transformation, whichis commonly used to analyse spatial patterns, the TCFignores the geometry of the substructures and considersonly the positions. The technique of TCF is already uti-lized in the field of dusty plasmas [13,14], but has to ourknowlegde never been applied to patterned discharges. Itspurpose is to analyze the filament positions and to esti-mate a probability distribution of finding a second fila-ment at a certain angle and distance from a first filament.In this work, the filament position is defined as the centreof the filaments luminescence density.
As shown in Figure 2, the positions of any triple offilaments (i, j, k) are considered. The interfilamentary dis-tances r′ = |ji| and r = |jk| as well as the enclosed angleϕ = angle(i, j, k) are determined. As we want to inves-tigate a hexagonal lattice, we know that there is a typi-cal nearest neighbour distance d0 of filaments. Hence, thevalue of r′ is limited to r′max, which is chosen to be slightlylarger than the typical neighbour distance d0. Triples withr′ larger than r′max are discarded, the other ones are sortedinto bins with the dimensions Δr and Δϕ. The counts forthese bins give the abundance of occurrence ny(r, ϕ).
Finally, the normalised abundance y is computed asny normalised to the radius r:
y(r, ϕ) =1rny(r, ϕ). (1)
The TCF can be regarded as an extension of the paircorrelation function by the angular resolution. The pair
i
j
k
Fig. 2. (Color online) Representation of the triple correlationfunction. The distances r′,r and the angle ϕ between any fila-ment triples (i, j, k) are calculated. ◦ – filaments used in currentcorrelation, • – filaments considered for calculation of solely rrelative to j, • – filaments considered for calculation of bothr′ and r relative to j.
correlation function has also been used to examine thearrangement of filaments in a BD [15], however, the ad-ditional angular resolution makes it easier to distinguisha rather strict order like a hexagonal lattice from otherpatterns.
4 Hexagonal pattern breakdownat decreasing voltage
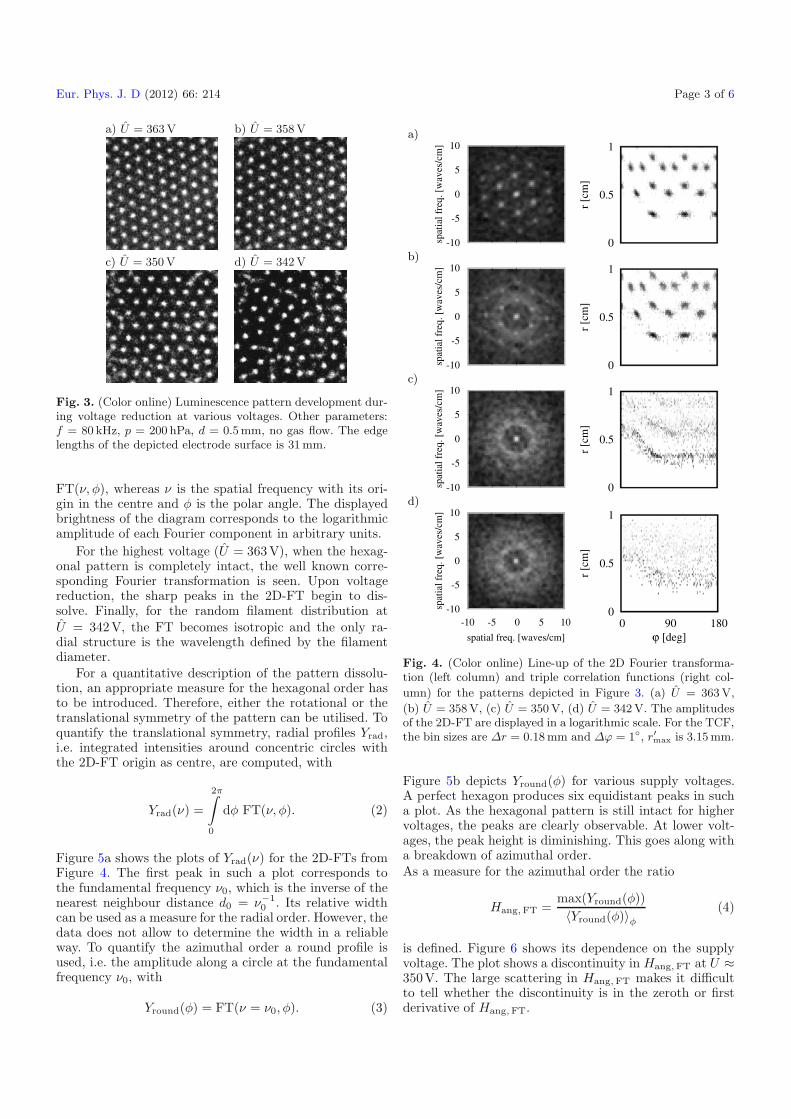
Figure 3 exemplarily displays the pattern behaviour ofthe discharge at a frequency of f = 80kHz during volt-age reduction. The amplitude of the applied voltage isdecremented from 400V to 300V. The maximum valueis low enough to avoid parasitic arc discharges in ar-eas other than the discharge gap, but sufficiently high toproduce stable hexagonal discharge patterns. As the volt-age is reduced, the pattern dissolves into a loose arrange-ment of filaments, before the discharge is eventually dis-tinguished. The selected images were shot at the voltagesU = 363 V, 358 V, 350 V, and 342 V. First disturbances ofthe hexagonal order occur at U ≈ 360V. Starting from theegde of the planar cell, growing movement of the filamentsdisturbs the order of the structure more and more. In thecourse of voltage reduction the number of filaments be-comes reduced and at U ≈ 345V the filaments are almostcompletely randomly distributed.
The pattern series is examined with the 2D Fouriertransformation (2D-FT) using the FFTW code describedin [16]. The images in Figure 3 are set into the Fourierspace via a fast Fourier transformation (Fig. 4, left-handside). These two dimensional plots are referred to as
Eur. Phys. J. D (2012) 66: 214 Page 3 of 6
a) U = 363 V b) U = 358 V
c) U = 350 V d) U = 342 V
Fig. 3. (Color online) Luminescence pattern development dur-ing voltage reduction at various voltages. Other parameters:f = 80 kHz, p = 200 hPa, d = 0.5 mm, no gas flow. The edgelengths of the depicted electrode surface is 31 mm.
FT(ν, φ), whereas ν is the spatial frequency with its ori-gin in the centre and φ is the polar angle. The displayedbrightness of the diagram corresponds to the logarithmicamplitude of each Fourier component in arbitrary units.
For the highest voltage (U = 363V), when the hexag-onal pattern is completely intact, the well known corre-sponding Fourier transformation is seen. Upon voltagereduction, the sharp peaks in the 2D-FT begin to dis-solve. Finally, for the random filament distribution atU = 342V, the FT becomes isotropic and the only ra-dial structure is the wavelength defined by the filamentdiameter.
For a quantitative description of the pattern dissolu-tion, an appropriate measure for the hexagonal order hasto be introduced. Therefore, either the rotational or thetranslational symmetry of the pattern can be utilised. Toquantify the translational symmetry, radial profiles Yrad,i.e. integrated intensities around concentric circles withthe 2D-FT origin as centre, are computed, with
Yrad(ν) =
2π∫
0
dφ FT(ν, φ). (2)
Figure 5a shows the plots of Yrad(ν) for the 2D-FTs fromFigure 4. The first peak in such a plot corresponds tothe fundamental frequency ν0, which is the inverse of thenearest neighbour distance d0 = ν−1
0 . Its relative widthcan be used as a measure for the radial order. However, thedata does not allow to determine the width in a reliableway. To quantify the azimuthal order a round profile isused, i.e. the amplitude along a circle at the fundamentalfrequency ν0, with
Yround(φ) = FT(ν = ν0, φ). (3)
a)
-10
-5
0
5
10
spat
ial f
req.
[w
aves
/cm
]
0
0.5
1
r [c
m]
b)
-10
-5
0
5
10
spat
ial f
req.
[w
aves
/cm
]
0
0.5
1
r [c
m]
c)
-10
-5
0
5
10
spat
ial f
req.
[w
aves
/cm
]
0
0.5
1
r [c
m]
d)
-10 -5 0 5 10
spatial freq. [waves/cm]
-10
-5
0
5
10
spat
ial f
req.
[w
aves
/cm
]
0
0.5
1
0 90 180
r [c
m]
ϕ [deg]
Fig. 4. (Color online) Line-up of the 2D Fourier transforma-tion (left column) and triple correlation functions (right col-
umn) for the patterns depicted in Figure 3. (a) U = 363 V,
(b) U = 358 V, (c) U = 350 V, (d) U = 342 V. The amplitudesof the 2D-FT are displayed in a logarithmic scale. For the TCF,the bin sizes are Δr = 0.18 mm and Δϕ = 1◦, r′max is 3.15 mm.
Figure 5b depicts Yround(φ) for various supply voltages.A perfect hexagon produces six equidistant peaks in sucha plot. As the hexagonal pattern is still intact for highervoltages, the peaks are clearly observable. At lower volt-ages, the peak height is diminishing. This goes along witha breakdown of azimuthal order.As a measure for the azimuthal order the ratio
Hang, FT =max(Yround(φ))〈Yround(φ)〉φ
(4)
is defined. Figure 6 shows its dependence on the supplyvoltage. The plot shows a discontinuity in Hang, FT at U ≈350V. The large scattering in Hang, FT makes it difficultto tell whether the discontinuity is in the zeroth or firstderivative of Hang, FT.

Page 4 of 6 Eur. Phys. J. D (2012) 66: 214
-8
-7
-6
-5
-4
-3
0 2.5 5 7.5 10
log
ampl
itude
Yra
d [a
.u.]
spatial frequency ν [waves/cm]
nearestneighbour
U=363 VU=358 VU=350 VU=342 V
(a)
0
0
0
0
0 60 120 180 240 300 360
ampl
itude
Yro
und
[a.u
.]
angle φ [deg]
U=363 V
U=358 V
U=350 V
U=342 V
(b)
Fig. 5. (Color online) Analysis of the 2D Fourier transforma-tion in Figure 4. (a) Azimuthally averaged radial profiles of 2DFourier transformation at various voltages. (b) Round profileof 2D Fourier transformation at the respective radius of thefirst order peak for various voltages.
0
1
2
3
4
5
6
330 340 350 360 370 380
Han
g, F
T [
a.u.
]
amplitude supply voltage U [V]
Fig. 6. (Color online) Ratio of the highest amplitude in theround profile to its mean value in dependence of the supplyvoltage.
The same transition is now investigated using thetriple correlation function. In Figure 4, the TCF areshown next to their corresponding 2D-FT image. For dis-tances below the distance of nearest neighbours d0 (e.g.d0 = 3.15mm in Fig. 4, TCF at U = 363V), the abun-dance is close to zero. The same lower limit for the distanceof neighbouring filaments is also responsible for the nearly
vanishing abundance at small angles. Physically, the low-est filament distance is determined by the inhibition ofignition in the vicinity of a filament [17,18]. Hence, theminimal filament distance is independent from the hexag-onal pattern, and so the low abundance for small distancesand small angles stays stable after the pattern breakdown(Fig. 4, TCF at U = 342V). This corresponds to the ob-served fundamental frequency ν0 in the radial profile of the2D-FT, that apparently remains after the transition. Foran intact hexagonal pattern (Fig. 4, TCF at U = 363V),the abundance at the distance d0 has three peaks, namelyat 60◦, 120◦, and 180◦. As the hexagonal pattern dissolveswith decreasing supply voltage, the peaks get broader. Atthe end of this transition, the peaks have completely dis-appeared in azimuthal direction. In radial direction, onlya small modulation stays visible.
Analogue to the 2D-FT interpretation, a measure forthe hexagonal order shall be introduced. As the peak at(r, ϕ) = (d0, 60◦) is a well defined feature of the hexagonalpattern, its height y60 = y(d0, 60◦) is taken as the basisfor the measure of order. To classify the angular order, y60
relative to the average abundance at the fixed distance d0
is calculated. Similarly, for the radial order y60 relative tothe average abundance at the fixed angle of 60◦ is chosen.Hence, two quantities being a measure for the hexagonalorder are defined:
Hang,TCF =y60
〈y(d0, ϕ)〉ϕ(5)
Hrad,TCF =y60
〈y(r, 60◦)〉r. (6)
Figure 7a shows the order analysis using Hang,TCF andHrad,TCF for the previously observed breakdown in Fig-ures 3 and 4. Basically, both plots display the same be-haviour: for high voltages the measure of order remainsnearly constant. For very low voltages (approximately340V in Fig. 7a), the peak y60 vanishes in the noise. This isdue to low order and additionally due to a decreased num-ber of filaments (Fig. 7b). Hence, below a certain supplyvoltage Hang,TCF and Hrad,TCF are not meaningful any-more.
The transition from a nearly constant Hang,TCF orHrad,TCF to a decreasing order is rather abrupt, so ob-viously there is a bifurcation from an ordered to an un-ordered system via a supercritical bifurcation. For a reli-able computation of the bifurcation point Ub, the curvesin Figure 7a are fitted with equation (7).
qfit(ν) ={
m · U + b U < Ub
m · Ub + b U ≥ Ub.(7)
Here, Ub depicts the bifurcation point, m and b are theslope and the offset of the straight line for U < Ub. The bi-furcation points in Figure 7a are Ub, ang = 362 V for theangular order and Ub, rad = 356V for the radial order. Inall measurements, the bifurcation point Ub, rad for the ra-dial order is at lower voltages than the bifurcation pointUb, ang for the angular order.

Eur. Phys. J. D (2012) 66: 214 Page 5 of 6
0
1
2
3
4
5
6
7
8
330 340 350 360 370 380 390 400
Hra
d, T
CF[
a.u.
], H
ang,
TC
F [a
.u.]
amplitude supply voltage U [V]
Ub,ang = 362.2 V
Ub,rad = 356.3 V
angular orderradial order
(a)
0
20
40
60
80
100
120
140
330 340 350 360 370 380 390 400
# of
fila
men
ts n
amplitude supply voltage U [V]
(b)
Fig. 7. (Color online) (a) Magnitude of angular and radialorder corresponding to equations (5) and (6) as a function ofthe applied voltage amplitude. (b) Number of filaments as afunction of the applied voltage amplitude.
0 1 2 3 4 5 6 7 8 9
330 340 350 360 370 380 390 400
Hra
d, T
CF
[a.u
.]
amplitude supply voltage U [V]
measurement 1measurement 2measurement 3
Fig. 8. (Color online) Scattering of the angular order bifurca-tion point with respect to the applied voltage. Parameters forall three measurements: f = 75 kHz, p = 200 hPa, d = 0.5 mm,no gas flow.
However, the absolute bifurcation point may vary.Figure 8 shows exemplarily three independent bifurca-tion measurements for the angular order that were eachdone with the same experimental conditions, f = 75 kHz,p = 200 hPa, d = 0.5 mm and without gas flow. Whilethe bifurcation was reproduced, the actual value for thebifurcation voltage varies between 350V and 365V.
A correlation between the applied frequency and thebifurcation voltage could not be found. If there is a de-pendence between those quantities, it is camouflaged bythe bifurcation voltage uncertainty.
5 Conclusion
The hexagonal pattern breakdown in self-organised dielec-tric barrier discharges has been investigated with the 2DFourier analysis technique and for the first time with theTCF. While decreasing the supply voltage of the dischargesystem, the lateral pattern changes from a regular hexago-nal filament arrangement to an unordered arrangement offilaments. The loss of order is observable both in the 2D-FT and in the TCF. However, the definition of a scalarmeasure of order is succesful only for the TCF. For the 2D-FT, the measure for lateral order suffers from the widthand the overlap of neighbouring maxima. A measure forthe angular order is determinable, but its values scatterrather wide, which makes the determination of a bifur-cation type impossible. In contrast, the measures of or-der derived from the TCF, Hrad,TCF and Hang,TCF, bothshow a distinct bifurcation point within a supercriticalbifurcation.
To understand this discrepancy, it is necessary toregard the mechanism of filament interaction. Differ-ent experiments indicate that the filament interaction isbest described by a particle-like approach, i.e. the in-teraction takes place on the basis of direct neighbour-hood [18,19], especially in the regime of loose filamentarrangements [11]. This results in a strong local order butdoes not enforce a long-range order.
The Fourier transformation is a global approach of apattern description. To rate the lateral order of a hexag-onal pattern, the width of the peaks at the fundamentalfrequency ν0 = d−1
0 should be determined. However, fromthe actual data, this is not possible in a reliable way. Thederived measure for the angular order reveals a distinctbifurcation between an ordered and unordered filamentarrangement, but it suffers from long-range deviations inthe pattern during the transition phase which blur theotherwise sharp bifurcation point.
On the other hand, the TCF emphasises the local ar-rangement of filaments. Thus, the derived measures of or-der Hrad,TCF and Hang,TCF both are able to describe thetransition between the states of order well and to deter-mine a well defined bifurcation point.
The analysis of several measurements leads to the con-clusion, that the bifurcation voltage cannot exactly be re-produced, as it varies in the intervall between 350V and365V. The sequence of the breakdown of order, i.e. an-gular order at higher voltages and radial order at lowervoltages, however, is not affected. Further, a possible de-pendence between applied frequency and bifurcation volt-age has not been found in the course of this investigation.
In order to discuss the transition from a physical pointof view, one has to bear in mind that it occurs close tothe ignition voltage of the discharge. Above the ignitionvoltage, the discharge is ignited everywhere, where the
Page 6 of 6 Eur. Phys. J. D (2012) 66: 214
inhibitory interaction of a neighbouring filament is neg-ligible, since the applied voltage is sufficient. This wouldresult in a discharge pattern with the highest packing den-sity, hence a hexagonal pattern. Reducing the voltage be-low ignition voltage results in a pattern that consists onlyof the filaments that are maintained by residual surfacecharges, reignition of new filaments in unoccupied placescan no longer occur. Thus, filaments may arrange ran-domly with an arbitrarily large inter-filament distance.This is consistent with the observed behaviour below thebifurcation voltage.
This work has been funded by the Deutsche Forschungsgemein-schaft, SFB-TRR 24, B14. We also acknowledge the supportivework of Peter Druckrey, Uwe Meißner and Thomas Schumann.We would like to thank Andre Schella and Andre Melzer forthe hint at the TCF and fruitful discussions.
References
1. U. Kogelschatz, Plasma Chem. Plasma Process. 23, 1(2003)
2. H.-E. Wagner, R. Brandenburg, K.V. Kozlov, A.Sonnenfeld, P. Michel, J.F. Behnke, Vacuum 71, 417(2003)
3. J.-P. Boeuf, J. Phys. D 36, R53 (2003)4. G. Fridman, G. Friedman, A. Gutsol, A.B. Shekhter,
V.N. Vasilets, A. Fridman, Plasma Process. Polym. 5, 503(2008)
5. K.-D. Weltmann, E. Kindel, T. von Woedtke, M. Hahnel,M. Stieber, R. Brandenburg, Pure Appl. Chem. 82, 1223(2010)
6. W. Breazeal, K.M. Flynn, E.G. Gwinn, Phys. Rev. E 52,1503 (1995)
7. A.L. Zanin, E.L. Gurevich, A.S. Moskalenko, H.U.Bodeker, H.-G. Purwins, Phys. Rev. E 70, 036202 (2004)
8. L.F. Dong, Z. Yin, L. Wang, G. Fu, Y. He, Z. Chai, X. Li,Thin Solid Films 435, 120 (2003)
9. E.L. Gurevich, A.L. Zanin, A.S. Moskalenko, H.-G.Purwins, Phys. Rev. Lett. 91, 154501 (2003)
10. L.F. Dong, H. Yue, Y.F. He, W.L. Fan, H. Xiao, J.Y. Chen,Z.G. Bai, Phys. Plasmas 17, 082302 (2010)
11. L. Stollenwerk, S.V. Gurevich, J.G. Laven, H.-G. Purwins,Eur. Phys. J. D 42, 273 (2007)
12. L. Stollenwerk, S. Amiranashvili, J.-P. Boeuf, H.-G.Purwins, Eur. Phys. J. D 44, 133 (2007)
13. P. Ludwig, H. Thomsen, K. Balzer, A. Filinov, M. Bonitz,Plasma Phys. Control Fusion 52, 124013 (2010)
14. A. Schella, T. Miksch, A. Melzer, J. Schablinski, D. Block,A. Piel, H. Thomsen, P. Ludwig, M. Bonitz, Phys. Rev. E84, 056402 (2011)
15. A. Chirokov, A. Gutsol, A. Fridman, K.D. Sieber, J.M.Grace, K.S. Robinson, Plasma Sources Sci. Technol. 13,623 (2004)
16. M. Frigo, S.G. Johnson, Proc. IEEE 2, 216 (2005)17. L. Stollenwerk, H.-G. Purwins, Contrib. Plasma Phys. 70,
22 (2005)18. L. Stollenwerk, New J. Phys. 11, 103034 (2009)19. I. Brauer, M. Bode, E. Ammelt, H.-G. Purwins, Phys. Rev.
Lett. 84, 4104 (2000)
Open Access This is an open access article distributedunder the terms of the Creative Commons AttributionLicense (http://creativecommons.org/licenses/by/3.0), whichpermits unrestricted use, distribution, and reproduction in anymedium, provided the original work is properly cited.