bravoconnect 2014: spend analytics & benchmarking
TRANSCRIPT


Spend Analytics & BenchmarkingDavid Coley | Heart of England NHS Foundation TrustPavel Ollitervo-Murphy & Scott Pryde | BravoSolution

David Coley - Introduction
Procurement Director at Heart of England NHS Foundation Trust for 13 years.
Expert in implementation of eProcurement and analysis solutions as well as strategic change management in NHS trusts.
Track record in driving strategic approach to NHS procurement, reducing a transactional focus and upskilling the function to manage supplier relationships.

Pavel Ollitervo-Murphy - Introduction
Principal Consultant with 9 years experience in Procurement.
Previously at GSK as a Sourcing Manager managing Marketing Services.
Before this Pavel worked at GSK eSourcing Department as Sourcing Manager providing expertise and consulting to various parts of the business to optimise their sourcing.

Scott Pryde - Introduction
Procurement & supply chain success in multiple industries from electronics to healthcare
Several of the UK’s largest and most innovative spend analytics initiatives.
Healthcare supply chain, medtech market and technology innovation expertise

Performance & Motivation
Target
Measure
Analyse
Compare
Collaborate
Improve

Case StudySpend Analytics & Benchmarking
David Coley | Heart of England Foundation Trust

HEALTHCARE TRENDS
Ageing population & lifestyle
Restructuring
Primary care commissioning
Tariff based reimbursement
£20Bn savings & QIPP
Capacity constraints & restructuring
Innovation
The Challenges to the NHS
HOSPITAL SECTOR
Demand and capacity
Responsiveness
Reimbursement
Budgets
Service efficiency & productivity
Patient safety & outcomes
Innovation

£6m deficit 13/14 – first deficit posted since becoming a Foundation Trust
£24m CIP target for 14/15 with only £13m of plans
4th Year of a £5.5m non-pay savings challenge
A&E 4 hour wait being scrutinised by Monitor
18 weeks and Cancer targets under considerable pressure
Planning for Winter
Reducing length of stay and delayed discharges
Centre-led action network (CLAN) model across estates and pharmacy
Procure and deploy GS1 compliant trust wide point of use stock system
Collaboration with multiple aggregation partners
Procurement Challenges at Heart of England

Progress Expected on Policy Based Actions
Standards• Leadership• Process• Partnerships• People
Scorecard• Doing it well• Doing it efficiently• Doing it right
Systems• GS1• eProcurement• Analytics• Benchmarking
Stakeholders• Special interest
groups• e.g. Orthopaedic
Surgeons
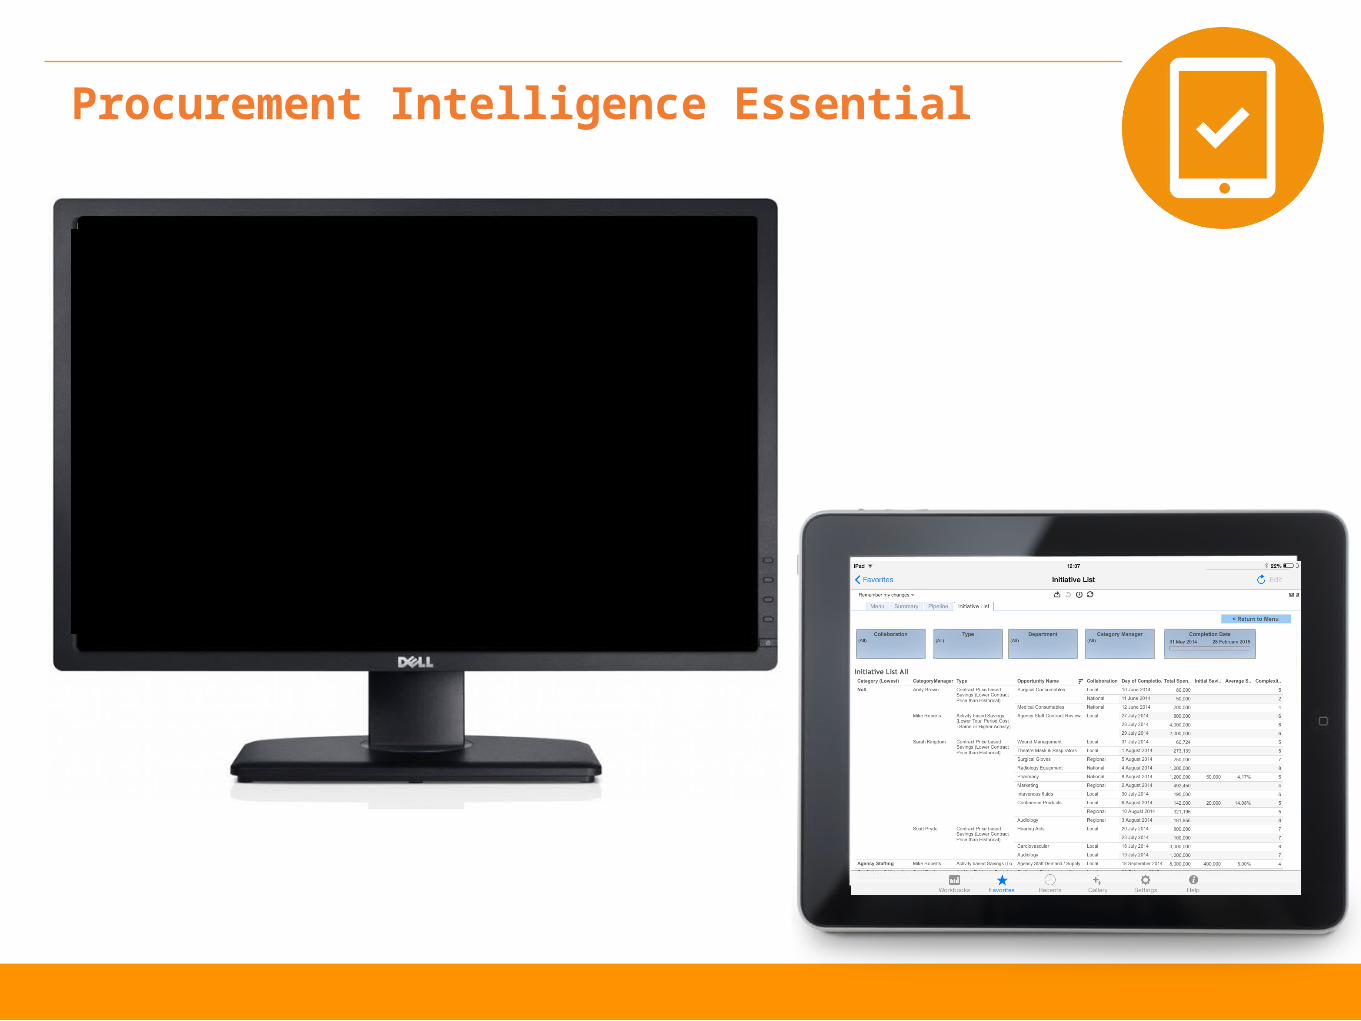
Procurement Intelligence Essential

EnhancedSpend Analysis
Benchmarking &
Focus Groups
Share Market Intelligence ,
Context,Experience
Multilevel Collaboration ,
Integration &
Professional Networking
Solution
TraditionalAnalysis
NOW
IMPACT
Enabling Technologies ?

Challenge

10% Savings, All Categories
Category Spend (£) Initiative Savings Target(£)
TOTAL 21,543,991,902 9.84% 2,119,057,063
CLINICAL
Medical & Surgical Equipment 4,234,448,282 10.00% 423,444,828Pharmaceuticals Blood Products & Medical Gases (Secondary Care Only) 3,520,038,443 8.00% 281,603,075Staff & Patient Consulting Services & Expenses (Clinical) 3,067,569,723 10.00% 306,756,972Chemicals & Reagents 506,116,402 8.00% 40,489,312Laboratory Equipment & Services 488,970,451 8.00% 39,117,636Purchased Healthcare 480,274,463 8.00% 38,421,957Diagnostic Imaging & Radiotherapy Equipment & Services 370,183,111 8.00% 29,614,649Digital Health (Secondary Care Only) 205,364,836 15.00% 30,804,725Patients Appliances 201,386,791 8.00% 16,110,943Bedding Linen & Textiles 57,883,628 15.00% 8,682,544Dressings 54,353,176 9.00% 4,891,786Dental & Optical Equipment 52,531,924 10.00% 5,253,192
NON-CLINICAL
Staff & Patient Consulting Services & Expenses (Non Clinical) 2,055,942,064 12.00% 246,713,048Building & Engineering Products & Services 2,036,673,424 12.00% 244,400,811Hotel Services Equipment Materials & Services 1,514,742,817 10.00% 151,474,282Provisions 809,509,382 8.00% 64,760,751Fuel Light Power Water 686,305,556 10.00% 68,630,556Office Equipment Telecomms Computers & Stationery 673,386,704 10.00% 67,338,670Transportation 289,985,231 8.00% 23,198,818Furniture Fittings 158,710,128 10.00% 15,871,013Staff Clothing 45,895,952 15.00% 6,884,393Patients Clothing & Footwear 15,956,562 15.00% 2,393,484Hardware Crockery 8,466,629 15.00% 1,269,994Gardening & Farming 7,395,384 10.00% 739,538Recreational Equipment & Souvenirs 1,900,841 10.00% 190,084
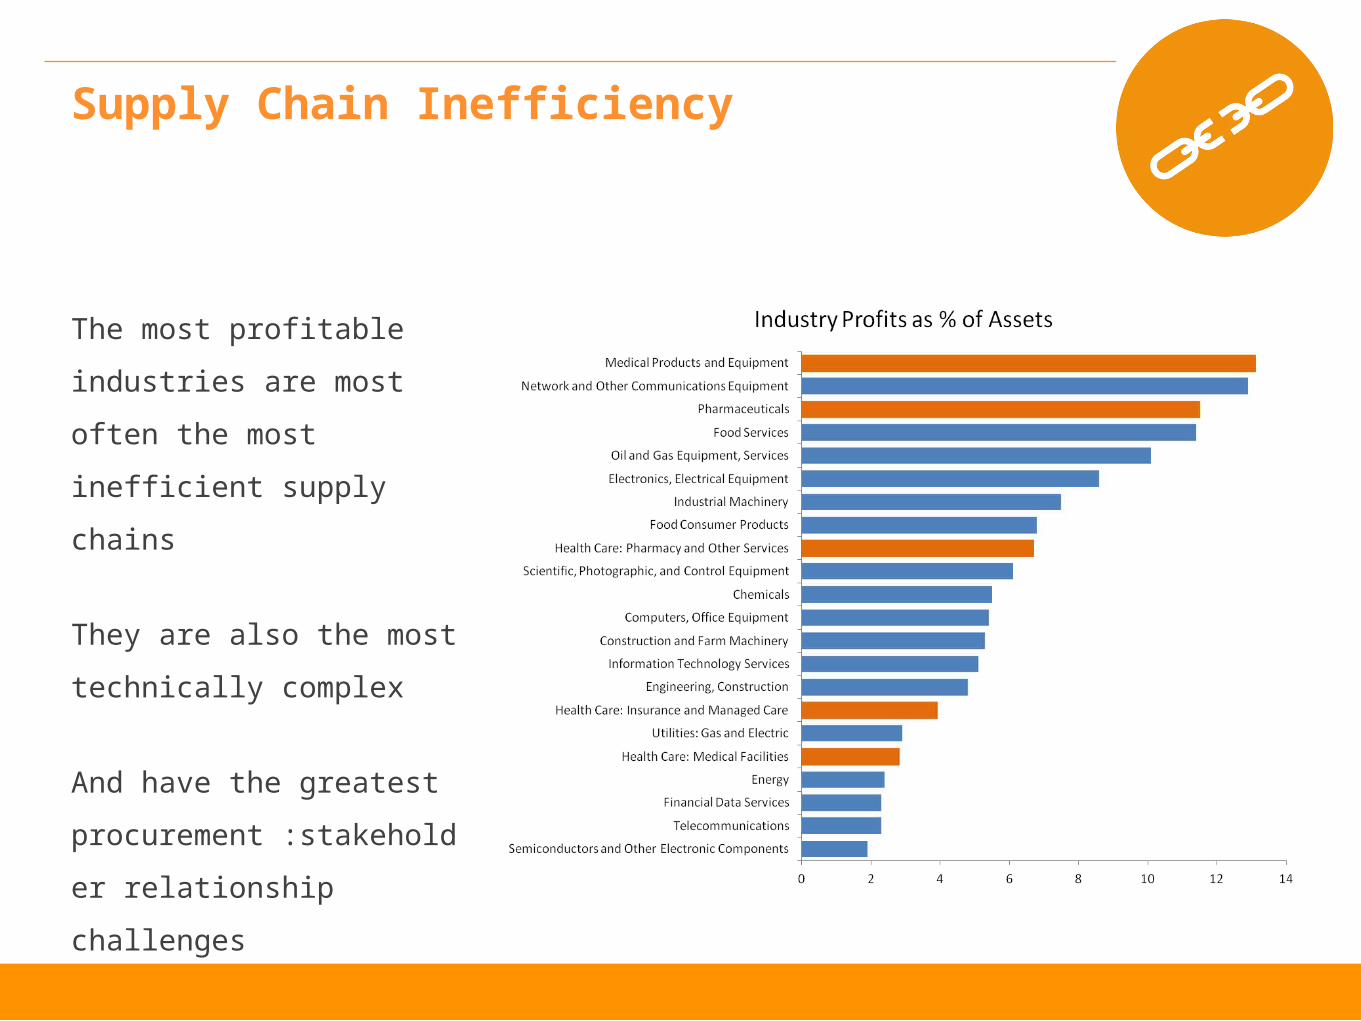
The most profitable industries
are most often the most
inefficient supply chains
They are also the most
technically complex
And have the greatest
procurement :stakeholder
relationship challenges
Supply Chain Inefficiency

Variety, Variability, Volatility

Safety, Outcomes and Quality

Unified & Aligned Relationships

Interactive Session


Analytics Overview

Core
Wider spend capture
Avoidance of leakage
Improved Stakeholder Alignment
Stronger Cost Control
Auditable Savings Delivery

Challenge 1
10% NHS Savings Essential – Where to start ?


Benchmarking

Benchmarking
Deeper category & supply chain knowledge
Improved Clinical Product Governance
Alternative proven stakeholder practice
Clinical equivalence
Enhanced credibility, closer relationships, increased leverage
Higher savings & efficiency impact

Challenge 2
Orthopaedic Hip Prosthesis Benchmarking

• Share Evidence, Expertise & Experience across the system
• Expand reach with same skills & resources
• Collaborate Locally & Nationally
• Make best use of national initiatives
• Reduce supply chain tender & contract management burden
• Increase aggregation leverage where appropriate
Collaboration

#3 Information and knowledge sharing alongside analytics
Collaboration - Example

Group Discussion

• How do you use spend analytics & business intelligence in your organisation?
• What knowledge, information and data challenges does your organisation face?
• How will procurement intelligence change in the future ?
Group Discussions
• What are the challenges that you face in reducing sources of inefficiency: variety, variability, volatility ?
• How do you benchmark across you organisation ?
• What other information is required alongside raw data and statistics in order to make better judgements ?
• What technologies have had the biggest impact on procurement performance in your organisation & why ?
• How are new technologies e.g. social media and online market places changing how you manage your supply chain ?
Measure performance, get connected, get motivated !

Q&A

Thank You!