benchmarking and performance analysis of optimization...
TRANSCRIPT
IntroductionBenchmarking
Performance AnalysisConclusions
Benchmarking and Performance Analysis ofOptimization Software
TED RALPHSISE Department
COR@L LabLehigh [email protected]
CPAIOR, Bologna, 15 June 2010
T.K. Ralphs Benchmarking
IntroductionBenchmarking
Performance AnalysisConclusions
Outline
1 Introduction
2 BenchmarkingPurposeSequential CodesParallel Codes
3 Performance Analysis
4 Conclusions
T.K. Ralphs Benchmarking
IntroductionBenchmarking
Performance AnalysisConclusions
My Hats
Research ScientistLab Director (COR@L)Software Developer (SYMPHONY, CHiPPS, DIP, CBC, MiBS, ...)Open Source Project Leader (COIN-OR)EducatorThesis AdvisorIndustry Consultant
T.K. Ralphs Benchmarking
IntroductionBenchmarking
Performance AnalysisConclusions
Caveats
This talk is heavily biased towards LP-based branch-and-boundalgorithms for solving mathematical programming problems.In such a setting, results can be “messy.”Important aspects of this setting are that we have to account for
numerical errorfailure of the algorithm to converge
This talk contains a lot more questions than answers!
T.K. Ralphs Benchmarking
IntroductionBenchmarking
Performance AnalysisConclusions
Background: COIN-OR
The Common Optimization Interface for Operations Research Initiativewas an initiative launched by IBM at ISMP in 2000.IBM seeded an open source repository with four initial projects andcreated a Web site.The goal was to develop the project and then hand it over to thecommunity.The project has now grown to be self-sustaining and was spun off as anonprofit educational foundation in the U.S. several years ago.The name was also changed to the Computational Infrastructure forOperations Research to reflect a broader mission.
T.K. Ralphs Benchmarking
IntroductionBenchmarking
Performance AnalysisConclusions
What is COIN-OR Today?
The COIN-OR FoundationA non-profit foundation promoting the development and use ofinteroperable, open-source software for operations research.A consortium of researchers in both industry and academiadedicated to improving the state of computational research in OR.A venue for developing and maintaining standards.A forum for interaction and discussion of OR software.
The COIN-OR Repository
A collection of interoperable software tools for buildingoptimization codes, as well as a few stand-alone packages.A venue for peer review of OR software tools.A development platform for open source projects, including anSVN repository,
See www.coin-or.org for more information.T.K. Ralphs Benchmarking
IntroductionBenchmarking
Performance AnalysisConclusions
The COIN-OR Foundation
The foundation has been up and running for more than five years.We have two boards.
A strategic board to set overall directionA technical board to advise on technical issues
The boards are composed of members from both industry andacademia, as well as balanced across disciplines.Membership in the foundation is available to both individuals andinstitutions.The foundation Web site and repository are hosted by INFORMS.
T.K. Ralphs Benchmarking

IntroductionBenchmarking
Performance AnalysisConclusions
My Hats: COIN-OR
Member of Strategic Leadership BoardChair of Technical Leadership CouncilProject Manager
CoinBinary/CoinAllSYMPHONYCHiPPS
ALPSBiCePSBLIS
DIPCBCMiBS
T.K. Ralphs Benchmarking
IntroductionBenchmarking
Performance AnalysisConclusions
What You Can Do With COIN
We currently have 50+ projects and more are being added all the time.Most projects are now licensed under the EPL (very permissive).COIN has solvers for most common optimization problem classes.
Linear programmingNonlinear programmingMixed integer linear programmingMixed integer nonlinear programming (convex and nonconvex)Stochastic linear programmingSemidefinite programmingGraph problemsCombinatorial problems (VRP, TSP, SPP, etc.)
COIN has various utilities for reading, building, and manipulatingoptimization models and feeding them to solvers.COIN has overarching frameworks that support implementation ofbroad algorithm classes.
Parallel searchBranch and cut (and price)Decomposition-based algorithms
T.K. Ralphs Benchmarking
IntroductionBenchmarking
Performance AnalysisConclusions
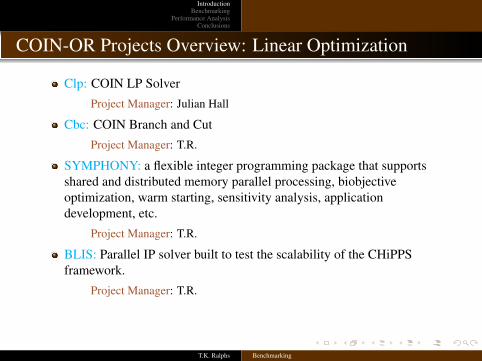
COIN-OR Projects Overview: Linear Optimization
Clp: COIN LP SolverProject Manager: Julian Hall
Cbc: COIN Branch and CutProject Manager: T.R.
SYMPHONY: a flexible integer programming package that supportsshared and distributed memory parallel processing, biobjectiveoptimization, warm starting, sensitivity analysis, applicationdevelopment, etc.
Project Manager: T.R.
BLIS: Parallel IP solver built to test the scalability of the CHiPPSframework.
Project Manager: T.R.
T.K. Ralphs Benchmarking
IntroductionBenchmarking
Performance AnalysisConclusions
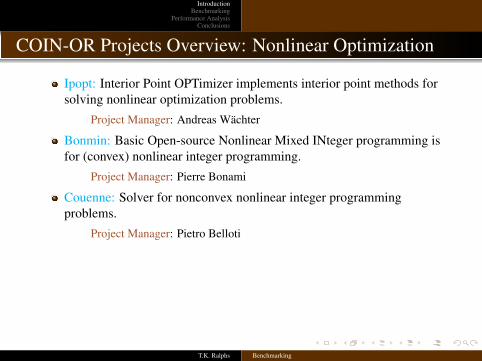
COIN-OR Projects Overview: Nonlinear Optimization
Ipopt: Interior Point OPTimizer implements interior point methods forsolving nonlinear optimization problems.
Project Manager: Andreas Wächter
Bonmin: Basic Open-source Nonlinear Mixed INteger programming isfor (convex) nonlinear integer programming.
Project Manager: Pierre Bonami
Couenne: Solver for nonconvex nonlinear integer programmingproblems.
Project Manager: Pietro Belloti
T.K. Ralphs Benchmarking
IntroductionBenchmarking
Performance AnalysisConclusions
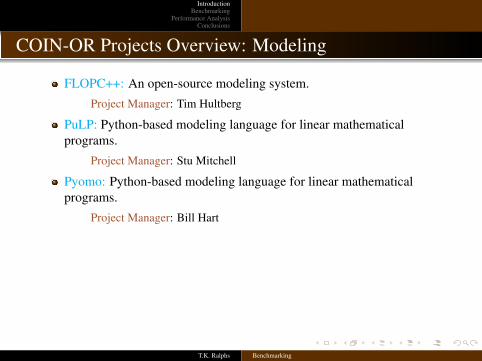
COIN-OR Projects Overview: Modeling
FLOPC++: An open-source modeling system.Project Manager: Tim Hultberg
PuLP: Python-based modeling language for linear mathematicalprograms.
Project Manager: Stu Mitchell
Pyomo: Python-based modeling language for linear mathematicalprograms.
Project Manager: Bill Hart
T.K. Ralphs Benchmarking
IntroductionBenchmarking
Performance AnalysisConclusions
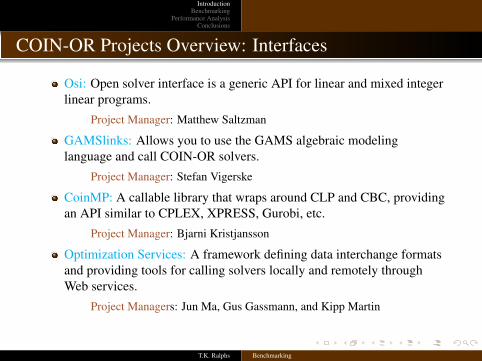
COIN-OR Projects Overview: Interfaces
Osi: Open solver interface is a generic API for linear and mixed integerlinear programs.
Project Manager: Matthew Saltzman
GAMSlinks: Allows you to use the GAMS algebraic modelinglanguage and call COIN-OR solvers.
Project Manager: Stefan Vigerske
CoinMP: A callable library that wraps around CLP and CBC, providingan API similar to CPLEX, XPRESS, Gurobi, etc.
Project Manager: Bjarni Kristjansson
Optimization Services: A framework defining data interchange formatsand providing tools for calling solvers locally and remotely throughWeb services.
Project Managers: Jun Ma, Gus Gassmann, and Kipp Martin
T.K. Ralphs Benchmarking
IntroductionBenchmarking
Performance AnalysisConclusions
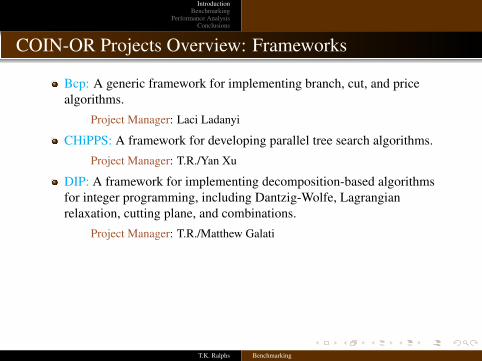
COIN-OR Projects Overview: Frameworks
Bcp: A generic framework for implementing branch, cut, and pricealgorithms.
Project Manager: Laci Ladanyi
CHiPPS: A framework for developing parallel tree search algorithms.Project Manager: T.R./Yan Xu
DIP: A framework for implementing decomposition-based algorithmsfor integer programming, including Dantzig-Wolfe, Lagrangianrelaxation, cutting plane, and combinations.
Project Manager: T.R./Matthew Galati
T.K. Ralphs Benchmarking
IntroductionBenchmarking
Performance AnalysisConclusions
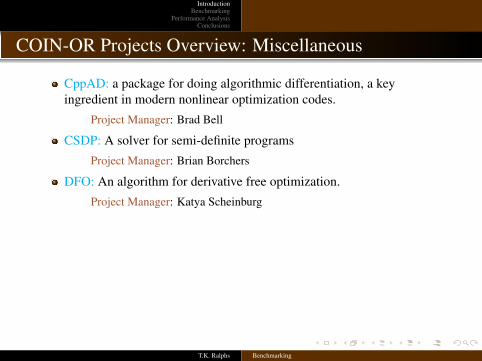
COIN-OR Projects Overview: Miscellaneous
CppAD: a package for doing algorithmic differentiation, a keyingredient in modern nonlinear optimization codes.
Project Manager: Brad Bell
CSDP: A solver for semi-definite programsProject Manager: Brian Borchers
DFO: An algorithm for derivative free optimization.Project Manager: Katya Scheinburg
T.K. Ralphs Benchmarking
IntroductionBenchmarking
Performance AnalysisConclusions
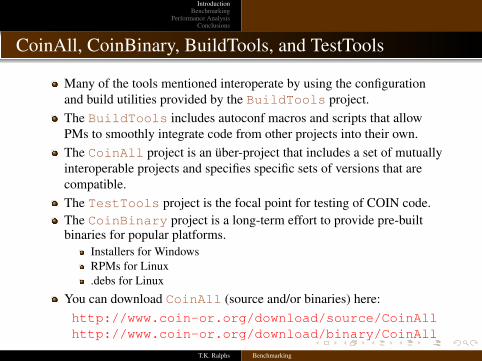
CoinAll, CoinBinary, BuildTools, and TestTools
Many of the tools mentioned interoperate by using the configurationand build utilities provided by the BuildTools project.The BuildTools includes autoconf macros and scripts that allowPMs to smoothly integrate code from other projects into their own.The CoinAll project is an über-project that includes a set of mutuallyinteroperable projects and specifies specific sets of versions that arecompatible.The TestTools project is the focal point for testing of COIN code.The CoinBinary project is a long-term effort to provide pre-builtbinaries for popular platforms.
Installers for WindowsRPMs for Linux.debs for Linux
You can download CoinAll (source and/or binaries) here:http://www.coin-or.org/download/source/CoinAllhttp://www.coin-or.org/download/binary/CoinAll
T.K. Ralphs Benchmarking
IntroductionBenchmarking
Performance AnalysisConclusions
PurposeSequential CodesParallel Codes
Outline
1 Introduction
2 BenchmarkingPurposeSequential CodesParallel Codes
3 Performance Analysis
4 Conclusions
T.K. Ralphs Benchmarking
IntroductionBenchmarking
Performance AnalysisConclusions
PurposeSequential CodesParallel Codes
The Different Roles of Benchmarking
Comparing performance of different codesComparing performance of different versions of the same codeDebugging sofwareSetting a direction/goal for future researchTuning software
T.K. Ralphs Benchmarking
IntroductionBenchmarking
Performance AnalysisConclusions
PurposeSequential CodesParallel Codes
Academy versus Industry
The role of benchmarking in academia is different than in thecommercial sector.
Commercial codes: Primary goal is to satisfy users.
Academic codes: Primary goal is to test ideas and generate papers.
The importance of software to the progress of academic research isevident.However, academic research is (unfortunately) still driven primarily bypublication in archival journals.Software is difficult to evaluate as an intellectual product on its ownmerits.Developers are forced to publish papers in archival journals aboutsoftware instead of publishing the software itself.Publications about software necessitate the use of benchmarks.
T.K. Ralphs Benchmarking
IntroductionBenchmarking
Performance AnalysisConclusions
PurposeSequential CodesParallel Codes
Developing/Maintaining Benchmarks
Many academic test sets are developed in an ad hoc fashion specificallyto support findings reported in a paper.Hence, they are essentially only vetted by the referees of the paper whomay not even examine the test set closely.Once cited in a paper, the test set is established and may drive theresearch agenda.Many codes become tuned to the benchmark.This introduces undesirable biases into the literature.Fortunately, there are some exceptions.
T.K. Ralphs Benchmarking
IntroductionBenchmarking
Performance AnalysisConclusions
PurposeSequential CodesParallel Codes
The Role of Open Source
Open source projects can play an important role in benchmarking.Reference implementations released in open source provide awell-understood baseline for comparison.Without such implementations, it is virtually impossible to do aproperly designed and controlled experiment.Comparisons against black-box software are often not very meaningful.This was one of the central motivation for the founding of COIN-OR.
T.K. Ralphs Benchmarking
IntroductionBenchmarking
Performance AnalysisConclusions
PurposeSequential CodesParallel Codes
Benchmarking within Open Source
Within open source projects, benchmarking plays a role somewherebetween academia and industry.Since development is decentralized, benchmarking can provide an“early warning system” for problems.As in industry, they can also make it easier to track progress.There may still be a tendency to “develop to the benchmark” that has tobe guarded against.COIN-OR uses nightly builds and standard benchmarks to trackdevelopment.
T.K. Ralphs Benchmarking
IntroductionBenchmarking
Performance AnalysisConclusions
PurposeSequential CodesParallel Codes
Issue 1: What is Really Being Tested?
In general, the challenge is to test only a particular aspect of a givenalgorithm.To do so, we want to hold all other aspects of the algorithm constant.This is most easily accomplished when all experiments are done withina common software framework on a common experimental platform.Even in the most ideal circumstances, it can be difficult to drawconclusions.
Should the values of parameters be re-tuned?Should “unrelated” parameter settings be held constant?
How do you show that a new technique will be effective within astate-of-the-art implementation without access to the implementation?
T.K. Ralphs Benchmarking
IntroductionBenchmarking
Performance AnalysisConclusions
PurposeSequential CodesParallel Codes
Issue 2: How To Measure Performance?
Most papers in mathematical programming use measures such as
Without time limitRunning time (wallclock or CPU?)Tree size (which nodes to count?)
With time limitFraction solved (tolerance?)Final gap (how measured?)Quality of solution (what is optimum?)
CostFeasibility
Time to first solution (quality?)
Are these good choices? Probably not.
T.K. Ralphs Benchmarking
IntroductionBenchmarking
Performance AnalysisConclusions
PurposeSequential CodesParallel Codes
Issue 3: What Is a Fair Comparison?
How do we really compare two different codes “fairly”?Codes may have inconsistent default parameters
Error tolerancesGap tolerances
Two codes claiming to have found an optimal solution may neverthelessproduce a different optimal value.In the case of nonlinear optimization, we may also have to deal with thefact that codes can produce local optima.Details of implementation
Who implemented the code and how well is it optimized?Are there differences in the implementation of common elements that aretangential to what is being tested?
T.K. Ralphs Benchmarking
IntroductionBenchmarking
Performance AnalysisConclusions
PurposeSequential CodesParallel Codes
Benchmarking Parallel Codes
For the foreseeable future, increases in computing power will come inthe form of additional cores rather than improvements in clock speeds.For this reason, most codes will need to be parallelized in some way toremain competitive.All of the previously mentioned issues are brought into even greatercontrast when benchmarking such codes.In addition to traditional performance measures, we must also considerscalability.
What is it?What are the tradeoffs?
T.K. Ralphs Benchmarking
IntroductionBenchmarking
Performance AnalysisConclusions
PurposeSequential CodesParallel Codes
Parallel Scalability
Parallel scalability measures how well an algorithm is able to takeadvantage of increased resources (primarily cores/processors).Generally, this is measured by executing the algorithm with differentlevels of available resources and observing the change in performance.The most clear-cut and often-cited measure is speedup, which measurestime to optimality for different numbers of processors.This is not necessarily a relevant measure for real-world performance.
T.K. Ralphs Benchmarking
IntroductionBenchmarking
Performance AnalysisConclusions
PurposeSequential CodesParallel Codes
Traditional Measures of Performance
Parallel System: Parallel algorithm + parallel architecture.Scalability: How well a parallel system takes advantage of increasedcomputing resources.
Terms
Sequential runtime: Ts
Parallel runtime: Tp
Parallel overhead: To = NTp − Ts
Speedup: S = Ts/Tp
Efficiency: E = S/N
Standard analysis considers change in efficiency on a fixed test set asnumber of processors is increased.This analysis is purely “compute-centric,” and does not take intoaccount the effects of limitations on memory and storage.
T.K. Ralphs Benchmarking
IntroductionBenchmarking
Performance AnalysisConclusions
PurposeSequential CodesParallel Codes
Amdahl’s Law
Amdahl’s Law postulates a theoretical limit on speed-up based on theamount of inherently sequential work to be done.If s is the fraction of work to be done that is sequential, then efficiencyon p processors is limited to s + (1− s)/p.In other words, efficiency is bounded by the sequential fraction s.In reality, there is no well-defined “sequential fraction.”The analysis also assumes a single, fixed test set.Isoefficiency analysis considers the increase in problem size to maintaina fixed efficiency as number of processors is increased.This is perhaps a more reasonable measure.
T.K. Ralphs Benchmarking
IntroductionBenchmarking
Performance AnalysisConclusions
PurposeSequential CodesParallel Codes
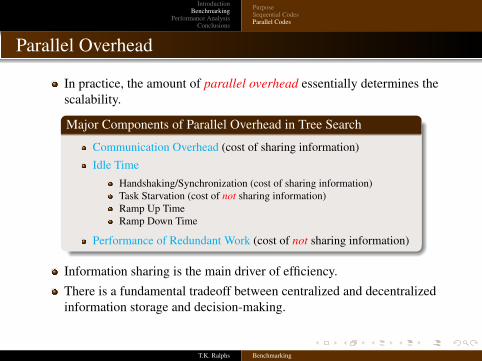
Parallel Overhead
In practice, the amount of parallel overhead essentially determines thescalability.
Major Components of Parallel Overhead in Tree Search
Communication Overhead (cost of sharing information)Idle Time
Handshaking/Synchronization (cost of sharing information)Task Starvation (cost of not sharing information)Ramp Up TimeRamp Down Time
Performance of Redundant Work (cost of not sharing information)
Information sharing is the main driver of efficiency.There is a fundamental tradeoff between centralized and decentralizedinformation storage and decision-making.
T.K. Ralphs Benchmarking
IntroductionBenchmarking
Performance AnalysisConclusions
PurposeSequential CodesParallel Codes
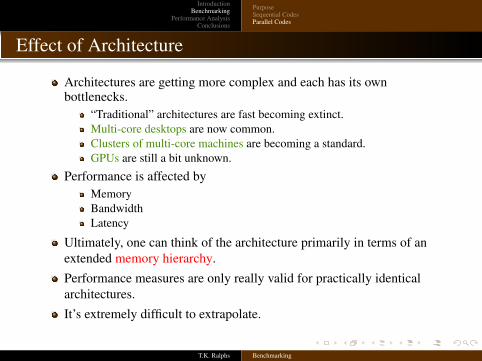
Effect of Architecture
Architectures are getting more complex and each has its ownbottlenecks.
“Traditional” architectures are fast becoming extinct.Multi-core desktops are now common.Clusters of multi-core machines are becoming a standard.GPUs are still a bit unknown.
Performance is affected byMemoryBandwidthLatency
Ultimately, one can think of the architecture primarily in terms of anextended memory hierarchy.Performance measures are only really valid for practically identicalarchitectures.It’s extremely difficult to extrapolate.
T.K. Ralphs Benchmarking
IntroductionBenchmarking
Performance AnalysisConclusions
PurposeSequential CodesParallel Codes
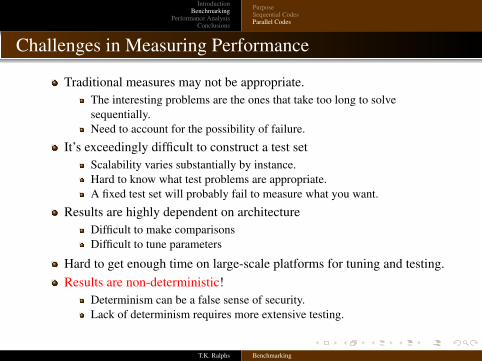
Challenges in Measuring Performance
Traditional measures may not be appropriate.The interesting problems are the ones that take too long to solvesequentially.Need to account for the possibility of failure.
It’s exceedingly difficult to construct a test setScalability varies substantially by instance.Hard to know what test problems are appropriate.A fixed test set will probably fail to measure what you want.
Results are highly dependent on architectureDifficult to make comparisonsDifficult to tune parameters
Hard to get enough time on large-scale platforms for tuning and testing.Results are non-deterministic!
Determinism can be a false sense of security.Lack of determinism requires more extensive testing.
T.K. Ralphs Benchmarking
IntroductionBenchmarking
Performance AnalysisConclusions
PurposeSequential CodesParallel Codes
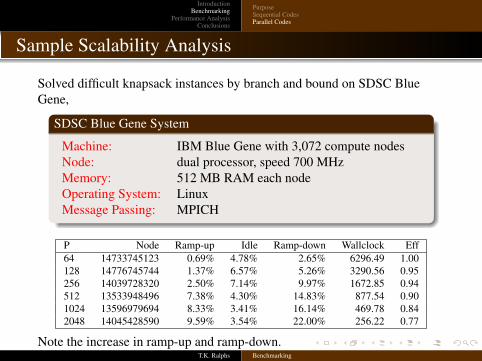
Sample Scalability Analysis
Solved difficult knapsack instances by branch and bound on SDSC BlueGene,
SDSC Blue Gene System
Machine: IBM Blue Gene with 3,072 compute nodesNode: dual processor, speed 700 MHzMemory: 512 MB RAM each nodeOperating System: LinuxMessage Passing: MPICH
P Node Ramp-up Idle Ramp-down Wallclock Eff64 14733745123 0.69% 4.78% 2.65% 6296.49 1.00128 14776745744 1.37% 6.57% 5.26% 3290.56 0.95256 14039728320 2.50% 7.14% 9.97% 1672.85 0.94512 13533948496 7.38% 4.30% 14.83% 877.54 0.901024 13596979694 8.33% 3.41% 16.14% 469.78 0.842048 14045428590 9.59% 3.54% 22.00% 256.22 0.77
Note the increase in ramp-up and ramp-down.T.K. Ralphs Benchmarking
IntroductionBenchmarking
Performance AnalysisConclusions
PurposeSequential CodesParallel Codes
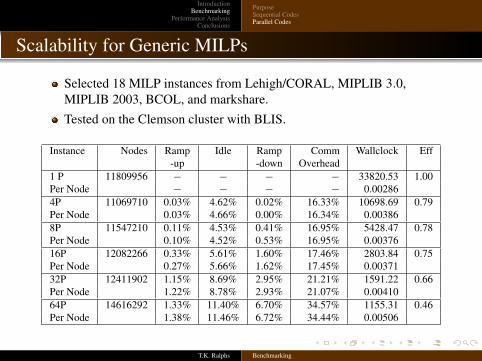
Scalability for Generic MILPs
Selected 18 MILP instances from Lehigh/CORAL, MIPLIB 3.0,MIPLIB 2003, BCOL, and markshare.Tested on the Clemson cluster with BLIS.
Instance Nodes Ramp Idle Ramp Comm Wallclock Eff-up -down Overhead
1 P 11809956 − − − − 33820.53 1.00Per Node − − − − 0.002864P 11069710 0.03% 4.62% 0.02% 16.33% 10698.69 0.79Per Node 0.03% 4.66% 0.00% 16.34% 0.003868P 11547210 0.11% 4.53% 0.41% 16.95% 5428.47 0.78Per Node 0.10% 4.52% 0.53% 16.95% 0.0037616P 12082266 0.33% 5.61% 1.60% 17.46% 2803.84 0.75Per Node 0.27% 5.66% 1.62% 17.45% 0.0037132P 12411902 1.15% 8.69% 2.95% 21.21% 1591.22 0.66Per Node 1.22% 8.78% 2.93% 21.07% 0.0041064P 14616292 1.33% 11.40% 6.70% 34.57% 1155.31 0.46Per Node 1.38% 11.46% 6.72% 34.44% 0.00506
T.K. Ralphs Benchmarking
IntroductionBenchmarking
Performance AnalysisConclusions
PurposeSequential CodesParallel Codes
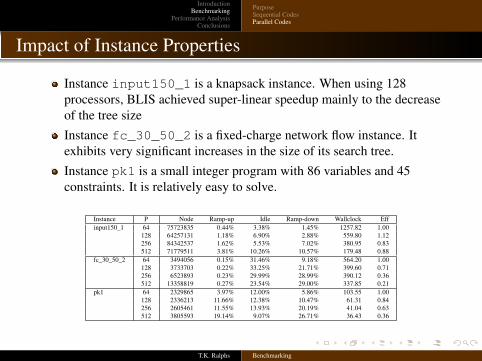
Impact of Instance Properties
Instance input150_1 is a knapsack instance. When using 128processors, BLIS achieved super-linear speedup mainly to the decreaseof the tree sizeInstance fc_30_50_2 is a fixed-charge network flow instance. Itexhibits very significant increases in the size of its search tree.Instance pk1 is a small integer program with 86 variables and 45constraints. It is relatively easy to solve.
Instance P Node Ramp-up Idle Ramp-down Wallclock Effinput150_1 64 75723835 0.44% 3.38% 1.45% 1257.82 1.00
128 64257131 1.18% 6.90% 2.88% 559.80 1.12256 84342537 1.62% 5.53% 7.02% 380.95 0.83512 71779511 3.81% 10.26% 10.57% 179.48 0.88
fc_30_50_2 64 3494056 0.15% 31.46% 9.18% 564.20 1.00128 3733703 0.22% 33.25% 21.71% 399.60 0.71256 6523893 0.23% 29.99% 28.99% 390.12 0.36512 13358819 0.27% 23.54% 29.00% 337.85 0.21
pk1 64 2329865 3.97% 12.00% 5.86% 103.55 1.00128 2336213 11.66% 12.38% 10.47% 61.31 0.84256 2605461 11.55% 13.93% 20.19% 41.04 0.63512 3805593 19.14% 9.07% 26.71% 36.43 0.36
T.K. Ralphs Benchmarking
IntroductionBenchmarking
Performance AnalysisConclusions
PurposeSequential CodesParallel Codes
Properties Affecting Scalability
Shape of search tree (balanced or not)Time to process a nodeNumber/distribution of feasible solutionsRelative strength of upper/lower bound (proving optimality)Sizes of node descriptions
T.K. Ralphs Benchmarking
IntroductionBenchmarking
Performance AnalysisConclusions
PurposeSequential CodesParallel Codes
Benchmarking Tests
Scalability can be tested separately from sequential performance.
Scalability Tests
Test set with known optima (prove optimality)Instances known to have balanced treesInstances with small node processing times and large treesInstances with large node processing times and small treesInstances with large node descriptions
T.K. Ralphs Benchmarking
IntroductionBenchmarking
Performance AnalysisConclusions
PurposeSequential CodesParallel Codes
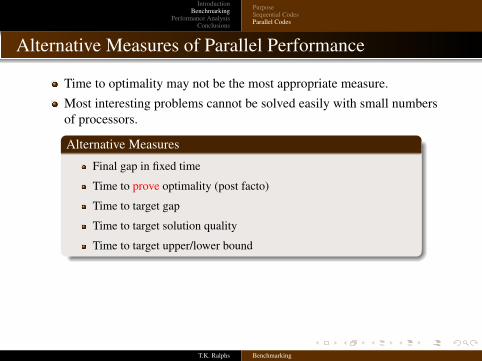
Alternative Measures of Parallel Performance
Time to optimality may not be the most appropriate measure.Most interesting problems cannot be solved easily with small numbersof processors.
Alternative Measures
Final gap in fixed time
Time to prove optimality (post facto)
Time to target gap
Time to target solution quality
Time to target upper/lower bound
T.K. Ralphs Benchmarking
IntroductionBenchmarking
Performance AnalysisConclusions
PurposeSequential CodesParallel Codes
Tradeoffs
How important is scalability versus sequential performance?The answer depends on the availability of computing resources.With large numbers of processors available, good scalability mayovercome sub-standard performance.Keep in mind, however, that going on level deeper in a balanced treedoubles the size.Hence, parallelism is unlikely to be much of a silver bullet.
T.K. Ralphs Benchmarking
IntroductionBenchmarking
Performance AnalysisConclusions
Outline
1 Introduction
2 BenchmarkingPurposeSequential CodesParallel Codes
3 Performance Analysis
4 Conclusions
T.K. Ralphs Benchmarking
IntroductionBenchmarking
Performance AnalysisConclusions
Performance Tuning
One of the goals of benchmarks is performance tuning.Does the information used to benchmark help us to tune?Not really, we need more in-depth analysis.This section focuses on branch and bound algorithms generally.
T.K. Ralphs Benchmarking
IntroductionBenchmarking
Performance AnalysisConclusions
Assessing the Performance of B&B
Benchmarking focuses on aggregate measures, but these measures arenot very useful for performance tuning.Most commercial and open-source solvers report:
optimality gap (global lower and upper bound)number of candidate nodesstatistics to indicate use/effectiveness of various components of thealgorithm
PreprocessingCutting plane generatorsPrimal heuristics
These are ultimately not very useful in identifying strategies forperformance improvement.
T.K. Ralphs Benchmarking
IntroductionBenchmarking
Performance AnalysisConclusions
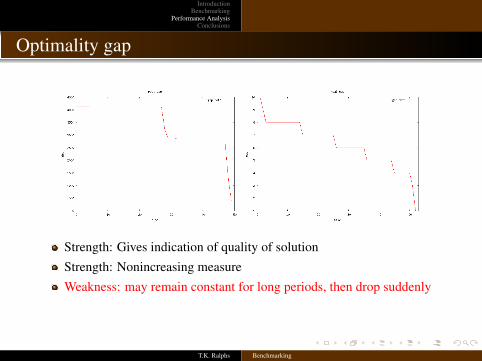
Optimality gap
Strength: Gives indication of quality of solutionStrength: Nonincreasing measureWeakness: may remain constant for long periods, then drop suddenly
T.K. Ralphs Benchmarking
IntroductionBenchmarking
Performance AnalysisConclusions
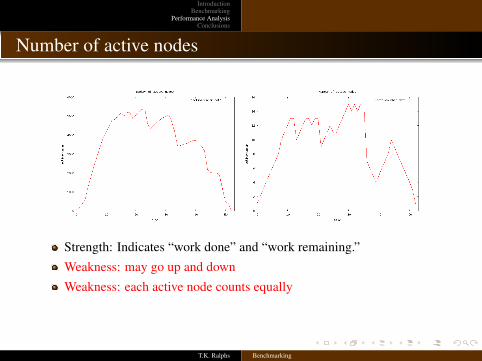
Number of active nodes
Strength: Indicates “work done” and “work remaining.”Weakness: may go up and downWeakness: each active node counts equally
T.K. Ralphs Benchmarking
IntroductionBenchmarking
Performance AnalysisConclusions
Deeper Analysis
In principle, there is a wealth of additional information available that can beused to visualize performance.
Number of nodes of different statusesCandidateInfeasibleBranchedFathomed
For each “feasible” node:LP relaxation valueinteger infeasibilityhistory/position in tree (e.g., depth and parent)statistics about methods applied
How can we use this information to better assess performance?
T.K. Ralphs Benchmarking
IntroductionBenchmarking
Performance AnalysisConclusions
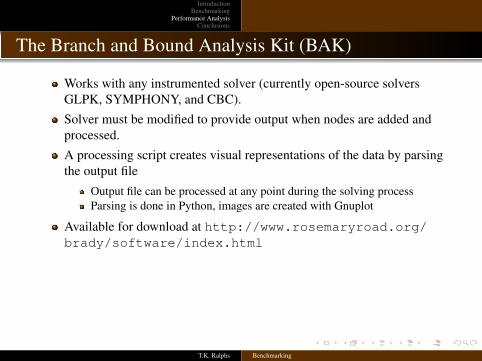
The Branch and Bound Analysis Kit (BAK)
Works with any instrumented solver (currently open-source solversGLPK, SYMPHONY, and CBC).Solver must be modified to provide output when nodes are added andprocessed.A processing script creates visual representations of the data by parsingthe output file
Output file can be processed at any point during the solving processParsing is done in Python, images are created with Gnuplot
Available for download at http://www.rosemaryroad.org/brady/software/index.html
T.K. Ralphs Benchmarking
IntroductionBenchmarking
Performance AnalysisConclusions
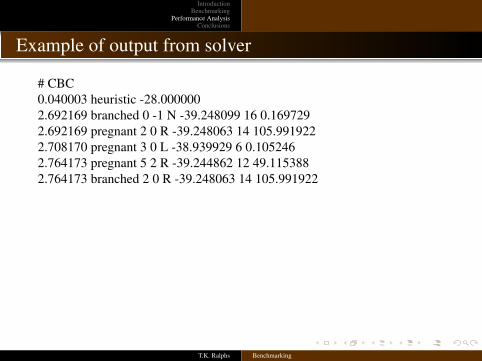
Example of output from solver
# CBC0.040003 heuristic -28.0000002.692169 branched 0 -1 N -39.248099 16 0.1697292.692169 pregnant 2 0 R -39.248063 14 105.9919222.708170 pregnant 3 0 L -38.939929 6 0.1052462.764173 pregnant 5 2 R -39.244862 12 49.1153882.764173 branched 2 0 R -39.248063 14 105.991922
T.K. Ralphs Benchmarking
IntroductionBenchmarking
Performance AnalysisConclusions
Visual Representations
Histogram of active node LP boundsScatter plot of active node LP bounds & integer infeasibilityIncumbent node history in scatter plotB&B trees showing the LP bound of each node
T.K. Ralphs Benchmarking
IntroductionBenchmarking
Performance AnalysisConclusions
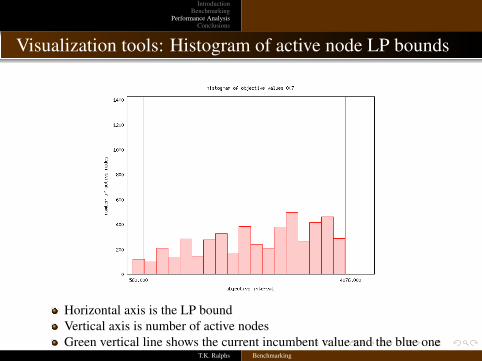
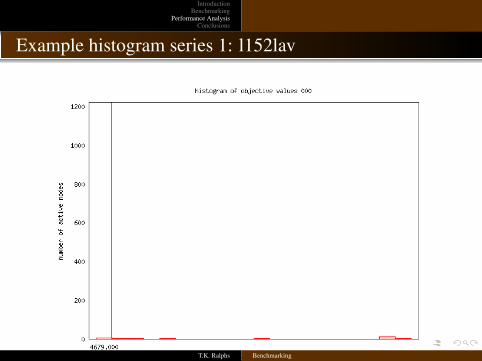
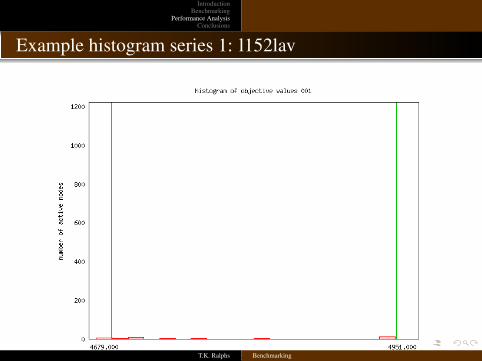
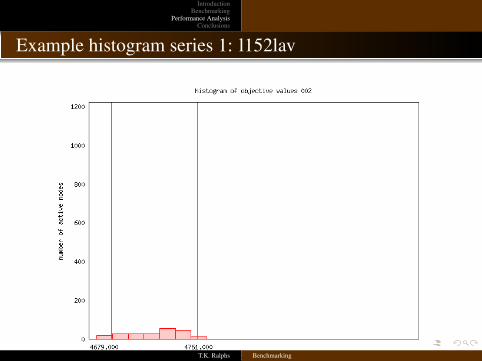
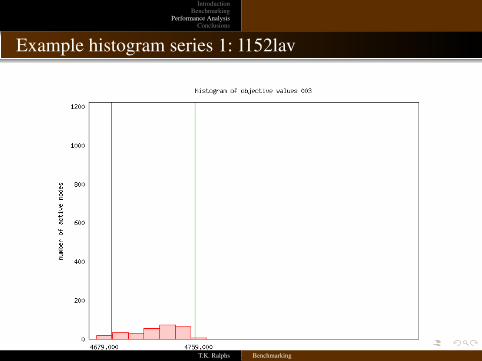
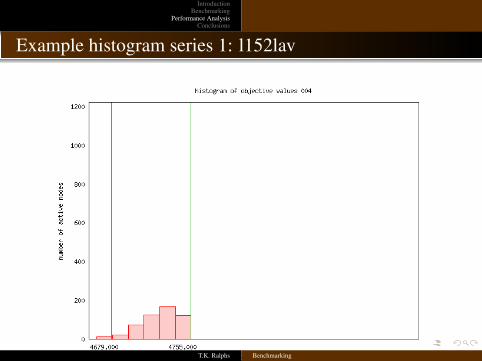
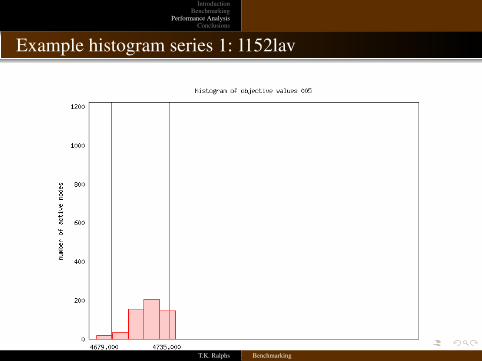
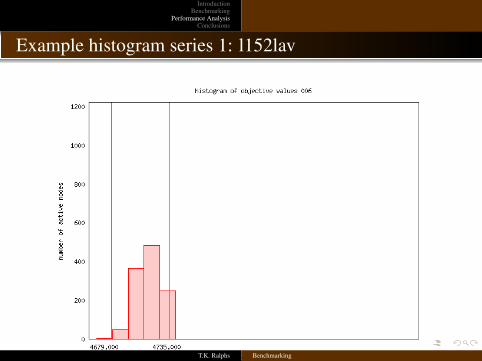
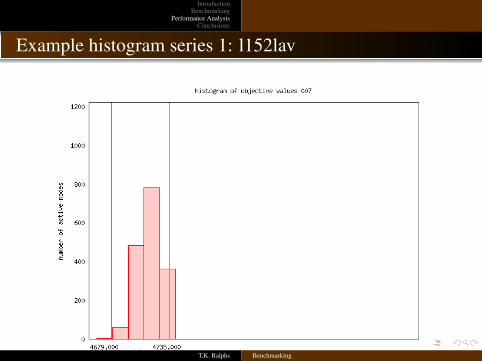
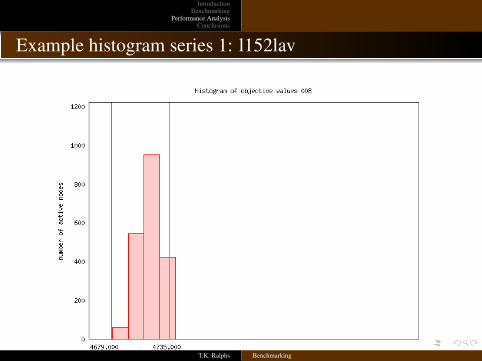
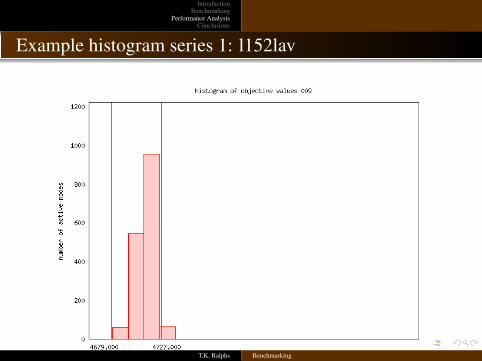
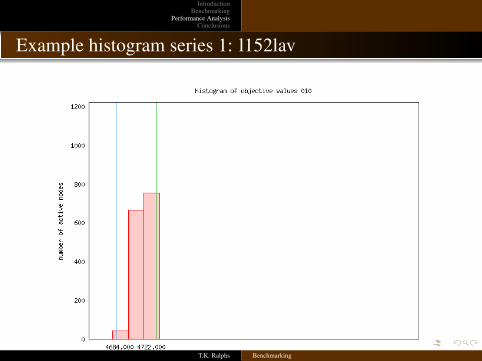
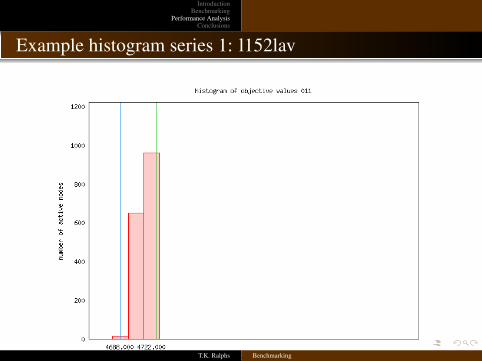
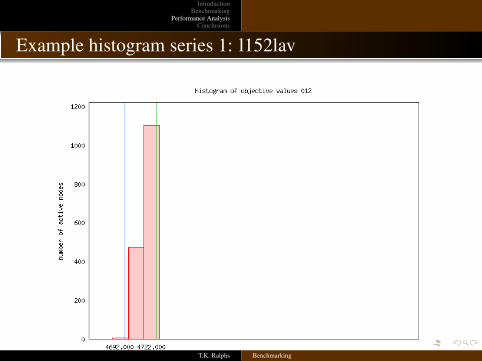
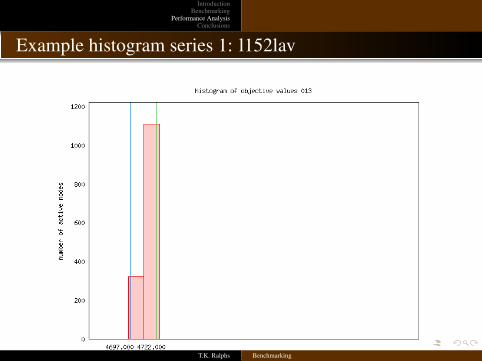
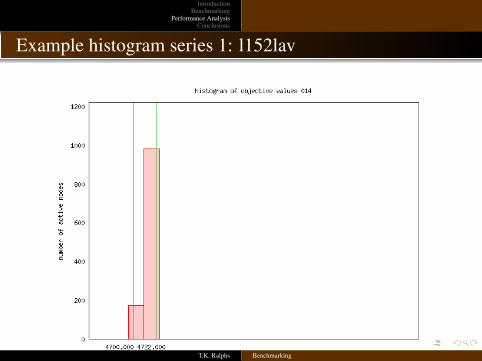
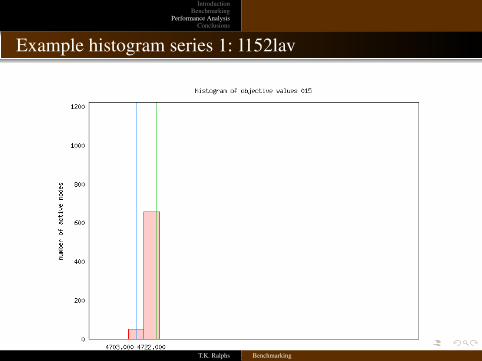
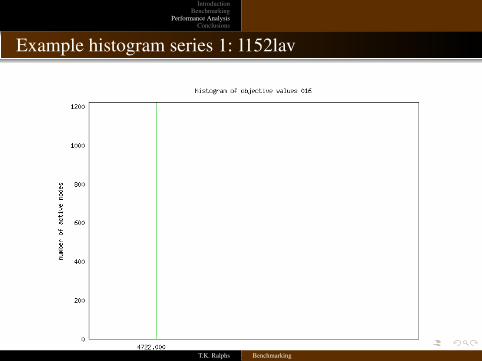
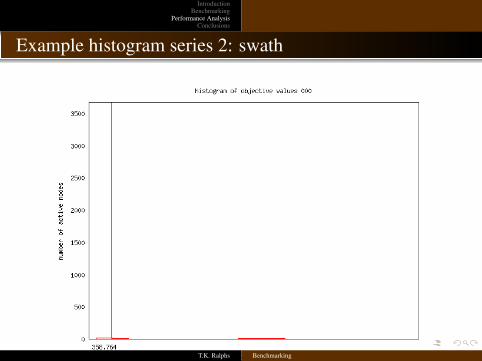
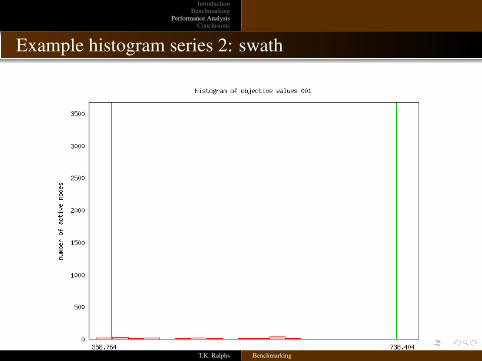
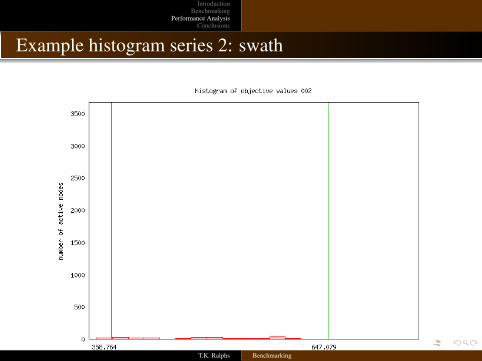
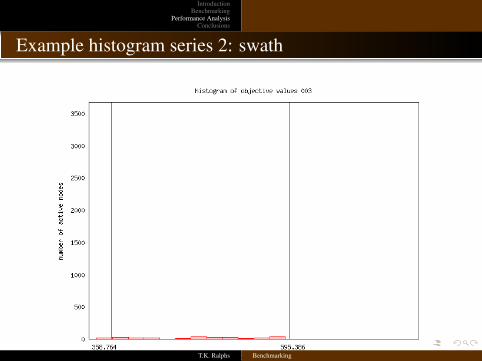
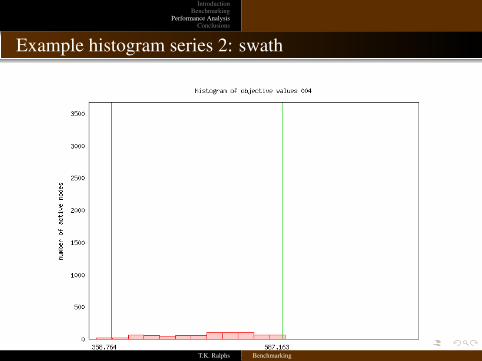
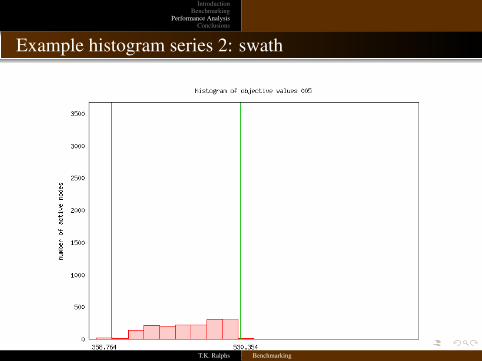
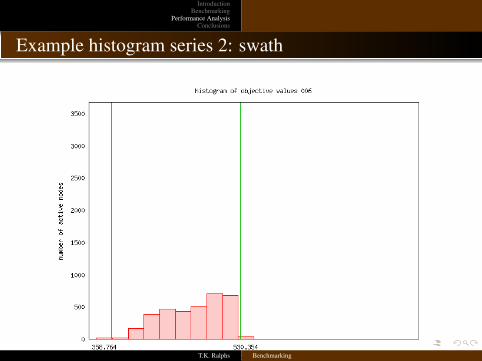
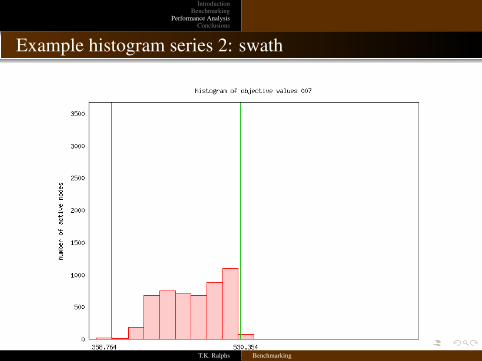
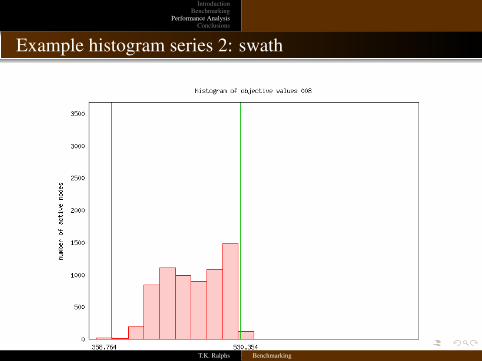
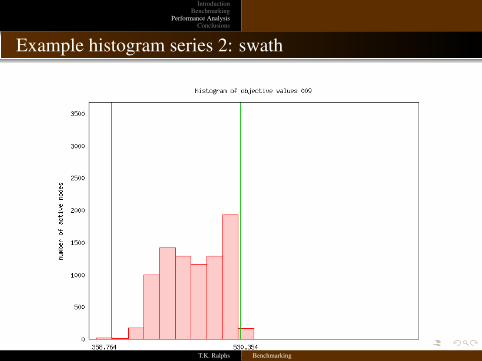
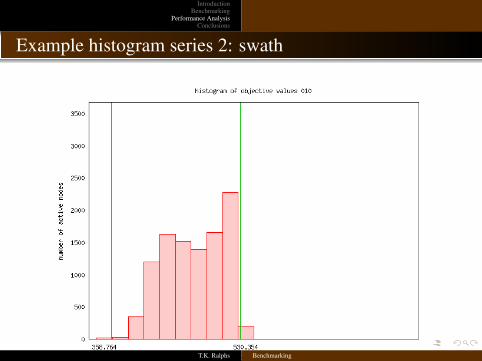
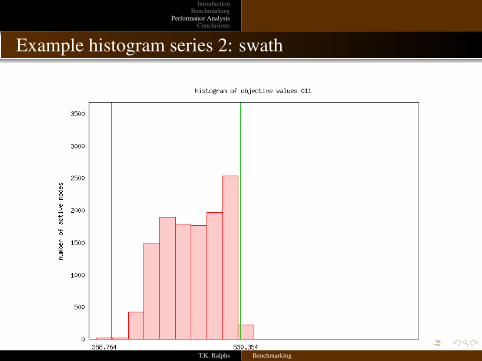
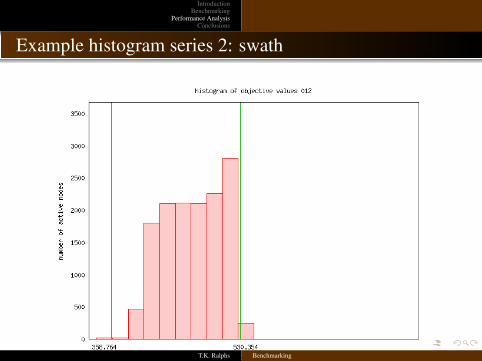
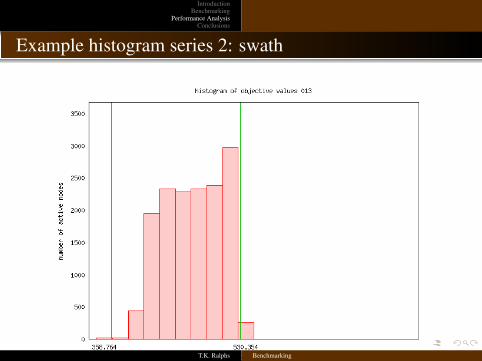
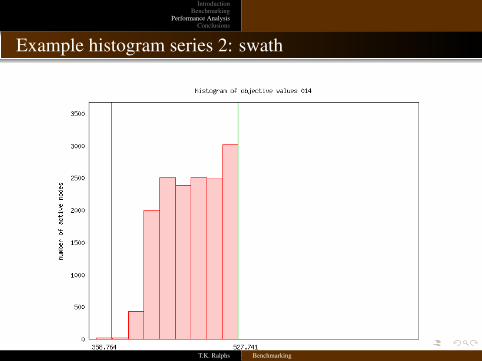
Visualization tools: Histogram of active node LP bounds
Horizontal axis is the LP boundVertical axis is number of active nodesGreen vertical line shows the current incumbent value and the blue oneshows the overall LP boundT.K. Ralphs Benchmarking
IntroductionBenchmarking
Performance AnalysisConclusions
Example histogram series 1: l152lav
T.K. Ralphs Benchmarking
IntroductionBenchmarking
Performance AnalysisConclusions
Example histogram series 1: l152lav
T.K. Ralphs Benchmarking
IntroductionBenchmarking
Performance AnalysisConclusions
Example histogram series 1: l152lav
T.K. Ralphs Benchmarking
IntroductionBenchmarking
Performance AnalysisConclusions
Example histogram series 1: l152lav
T.K. Ralphs Benchmarking
IntroductionBenchmarking
Performance AnalysisConclusions
Example histogram series 1: l152lav
T.K. Ralphs Benchmarking
IntroductionBenchmarking
Performance AnalysisConclusions
Example histogram series 1: l152lav
T.K. Ralphs Benchmarking
IntroductionBenchmarking
Performance AnalysisConclusions
Example histogram series 1: l152lav
T.K. Ralphs Benchmarking
IntroductionBenchmarking
Performance AnalysisConclusions
Example histogram series 1: l152lav
T.K. Ralphs Benchmarking
IntroductionBenchmarking
Performance AnalysisConclusions
Example histogram series 1: l152lav
T.K. Ralphs Benchmarking
IntroductionBenchmarking
Performance AnalysisConclusions
Example histogram series 1: l152lav
T.K. Ralphs Benchmarking
IntroductionBenchmarking
Performance AnalysisConclusions
Example histogram series 1: l152lav
T.K. Ralphs Benchmarking
IntroductionBenchmarking
Performance AnalysisConclusions
Example histogram series 1: l152lav
T.K. Ralphs Benchmarking
IntroductionBenchmarking
Performance AnalysisConclusions
Example histogram series 1: l152lav
T.K. Ralphs Benchmarking
IntroductionBenchmarking
Performance AnalysisConclusions
Example histogram series 1: l152lav
T.K. Ralphs Benchmarking
IntroductionBenchmarking
Performance AnalysisConclusions
Example histogram series 1: l152lav
T.K. Ralphs Benchmarking
IntroductionBenchmarking
Performance AnalysisConclusions
Example histogram series 1: l152lav
T.K. Ralphs Benchmarking
IntroductionBenchmarking
Performance AnalysisConclusions
Example histogram series 1: l152lav
T.K. Ralphs Benchmarking
IntroductionBenchmarking
Performance AnalysisConclusions
Example histogram series 2: swath
T.K. Ralphs Benchmarking
IntroductionBenchmarking
Performance AnalysisConclusions
Example histogram series 2: swath
T.K. Ralphs Benchmarking
IntroductionBenchmarking
Performance AnalysisConclusions
Example histogram series 2: swath
T.K. Ralphs Benchmarking
IntroductionBenchmarking
Performance AnalysisConclusions
Example histogram series 2: swath
T.K. Ralphs Benchmarking
IntroductionBenchmarking
Performance AnalysisConclusions
Example histogram series 2: swath
T.K. Ralphs Benchmarking
IntroductionBenchmarking
Performance AnalysisConclusions
Example histogram series 2: swath
T.K. Ralphs Benchmarking
IntroductionBenchmarking
Performance AnalysisConclusions
Example histogram series 2: swath
T.K. Ralphs Benchmarking
IntroductionBenchmarking
Performance AnalysisConclusions
Example histogram series 2: swath
T.K. Ralphs Benchmarking
IntroductionBenchmarking
Performance AnalysisConclusions
Example histogram series 2: swath
T.K. Ralphs Benchmarking
IntroductionBenchmarking
Performance AnalysisConclusions
Example histogram series 2: swath
T.K. Ralphs Benchmarking
IntroductionBenchmarking
Performance AnalysisConclusions
Example histogram series 2: swath
T.K. Ralphs Benchmarking
IntroductionBenchmarking
Performance AnalysisConclusions
Example histogram series 2: swath
T.K. Ralphs Benchmarking
IntroductionBenchmarking
Performance AnalysisConclusions
Example histogram series 2: swath
T.K. Ralphs Benchmarking
IntroductionBenchmarking
Performance AnalysisConclusions
Example histogram series 2: swath
T.K. Ralphs Benchmarking
IntroductionBenchmarking
Performance AnalysisConclusions
Example histogram series 2: swath
T.K. Ralphs Benchmarking

IntroductionBenchmarking
Performance AnalysisConclusions
Example histogram series 2: swath
T.K. Ralphs Benchmarking
IntroductionBenchmarking
Performance AnalysisConclusions
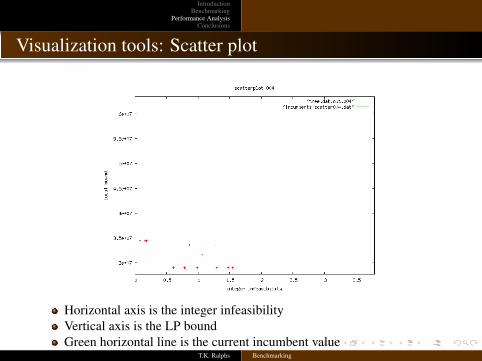
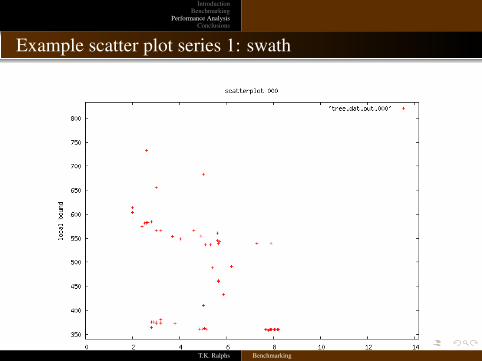
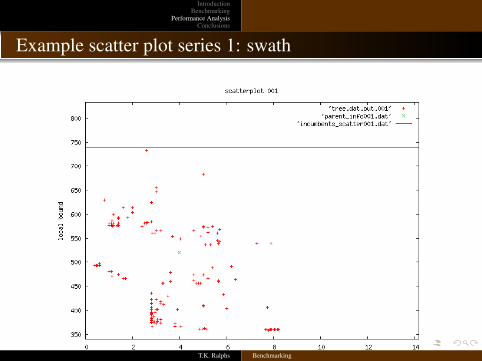
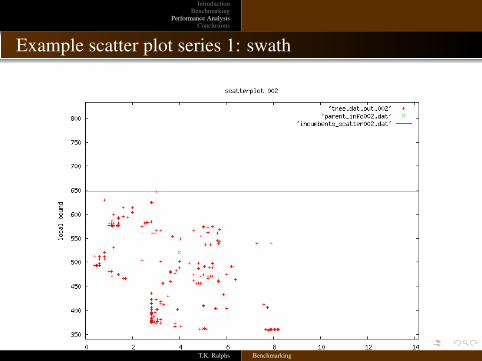
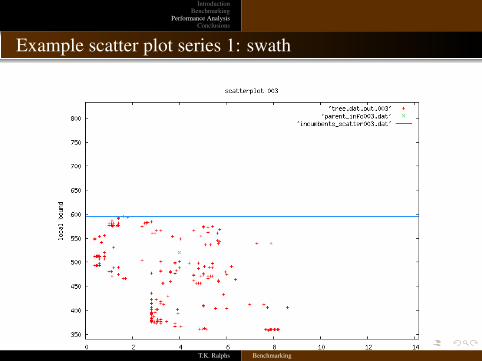
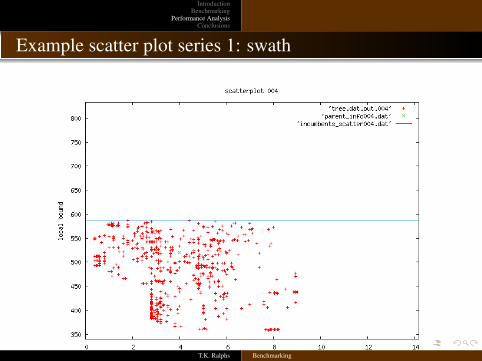
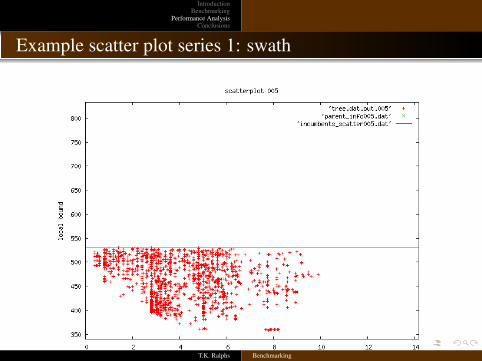
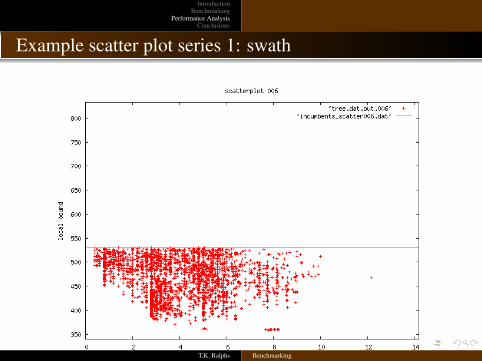
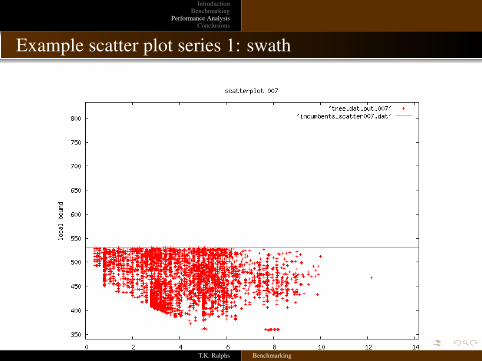
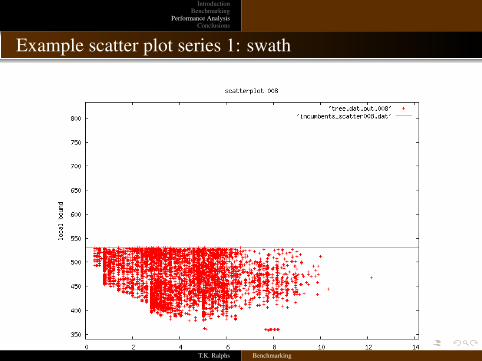
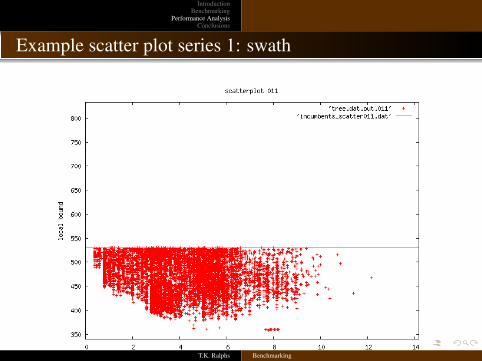
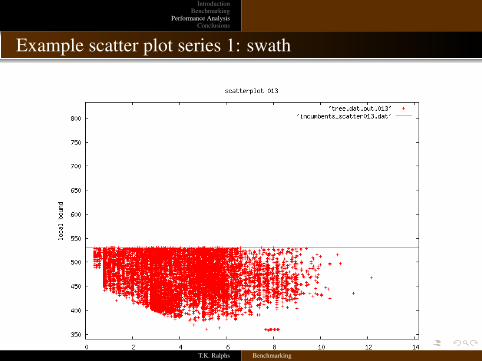
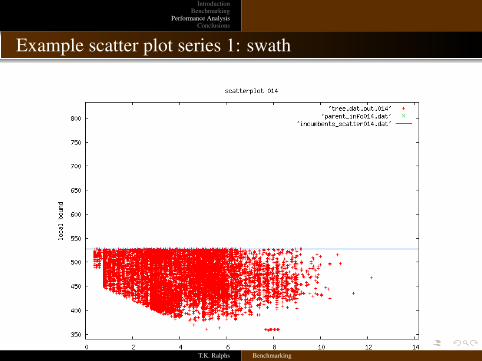
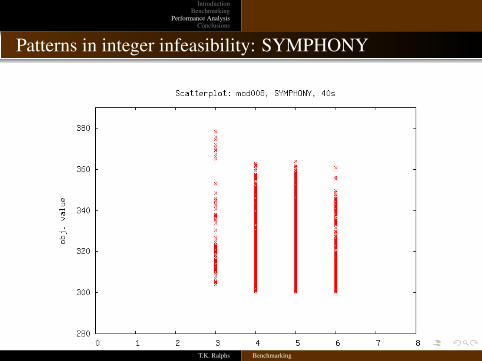
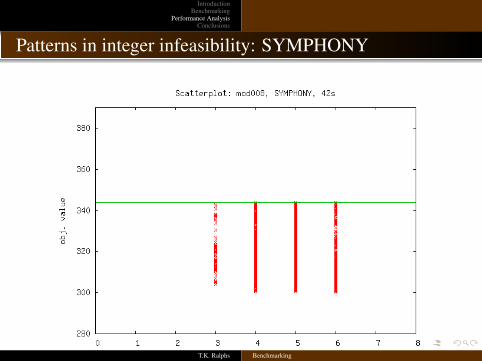
Visualization tools: Scatter plot
Horizontal axis is the integer infeasibilityVertical axis is the LP boundGreen horizontal line is the current incumbent value
T.K. Ralphs Benchmarking
IntroductionBenchmarking
Performance AnalysisConclusions
Example scatter plot series 1: swath
T.K. Ralphs Benchmarking
IntroductionBenchmarking
Performance AnalysisConclusions
Example scatter plot series 1: swath
T.K. Ralphs Benchmarking
IntroductionBenchmarking
Performance AnalysisConclusions
Example scatter plot series 1: swath
T.K. Ralphs Benchmarking
IntroductionBenchmarking
Performance AnalysisConclusions
Example scatter plot series 1: swath
T.K. Ralphs Benchmarking
IntroductionBenchmarking
Performance AnalysisConclusions
Example scatter plot series 1: swath
T.K. Ralphs Benchmarking
IntroductionBenchmarking
Performance AnalysisConclusions
Example scatter plot series 1: swath
T.K. Ralphs Benchmarking
IntroductionBenchmarking
Performance AnalysisConclusions
Example scatter plot series 1: swath
T.K. Ralphs Benchmarking
IntroductionBenchmarking
Performance AnalysisConclusions
Example scatter plot series 1: swath
T.K. Ralphs Benchmarking
IntroductionBenchmarking
Performance AnalysisConclusions
Example scatter plot series 1: swath
T.K. Ralphs Benchmarking

IntroductionBenchmarking
Performance AnalysisConclusions
Example scatter plot series 1: swath
T.K. Ralphs Benchmarking

IntroductionBenchmarking
Performance AnalysisConclusions
Example scatter plot series 1: swath
T.K. Ralphs Benchmarking
IntroductionBenchmarking
Performance AnalysisConclusions
Example scatter plot series 1: swath
T.K. Ralphs Benchmarking

IntroductionBenchmarking
Performance AnalysisConclusions
Example scatter plot series 1: swath
T.K. Ralphs Benchmarking
IntroductionBenchmarking
Performance AnalysisConclusions
Example scatter plot series 1: swath
T.K. Ralphs Benchmarking
IntroductionBenchmarking
Performance AnalysisConclusions
Example scatter plot series 1: swath
T.K. Ralphs Benchmarking

IntroductionBenchmarking
Performance AnalysisConclusions
Example scatter plot series 1: swath
T.K. Ralphs Benchmarking
IntroductionBenchmarking
Performance AnalysisConclusions
Patterns in integer infeasibility: SYMPHONY
T.K. Ralphs Benchmarking
IntroductionBenchmarking
Performance AnalysisConclusions
Patterns in integer infeasibility: SYMPHONY
T.K. Ralphs Benchmarking
IntroductionBenchmarking
Performance AnalysisConclusions
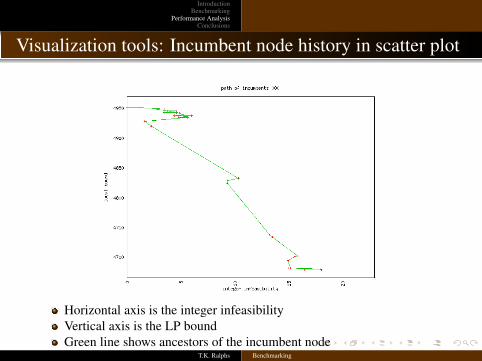
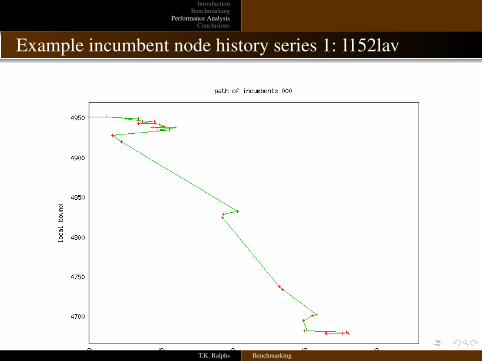
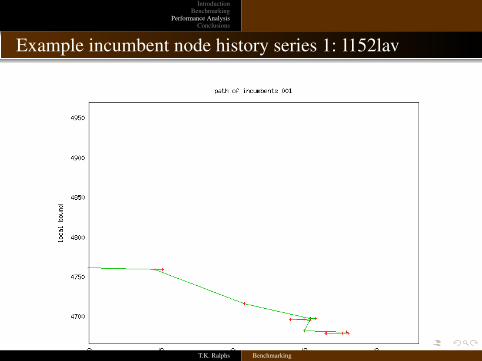
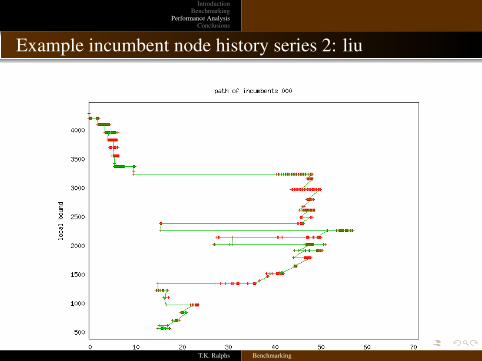
Visualization tools: Incumbent node history in scatter plot
Horizontal axis is the integer infeasibilityVertical axis is the LP boundGreen line shows ancestors of the incumbent node
T.K. Ralphs Benchmarking
IntroductionBenchmarking
Performance AnalysisConclusions
Example incumbent node history series 1: l152lav
T.K. Ralphs Benchmarking
IntroductionBenchmarking
Performance AnalysisConclusions
Example incumbent node history series 1: l152lav
T.K. Ralphs Benchmarking
IntroductionBenchmarking
Performance AnalysisConclusions
Example incumbent node history series 2: liu
T.K. Ralphs Benchmarking
IntroductionBenchmarking
Performance AnalysisConclusions
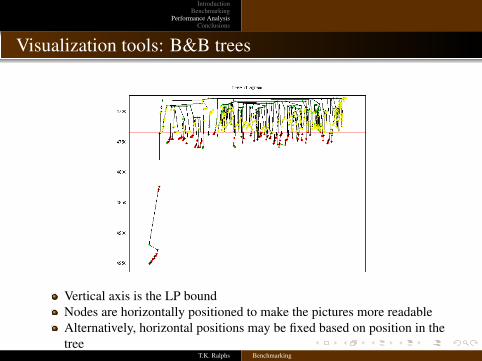
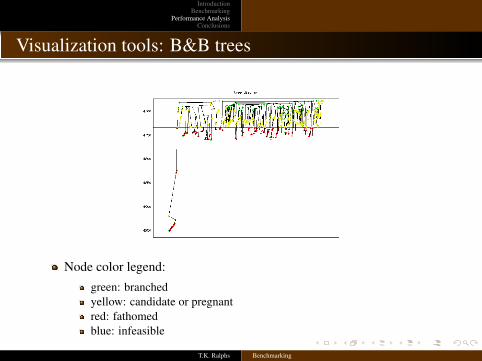
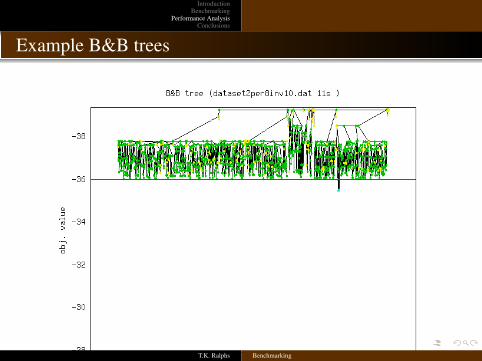
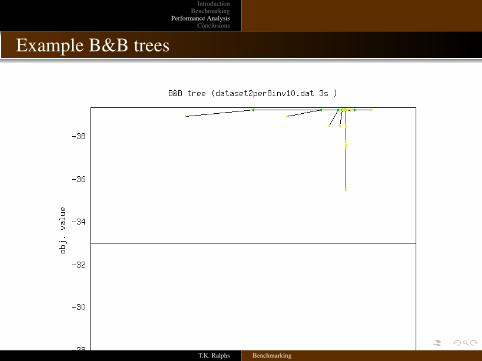
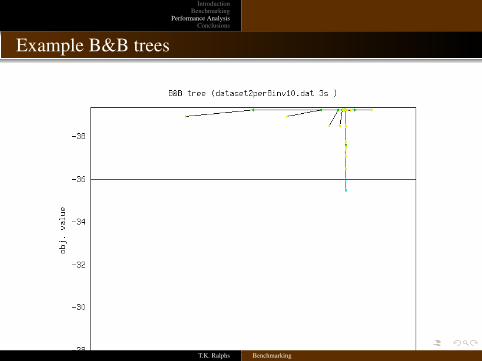
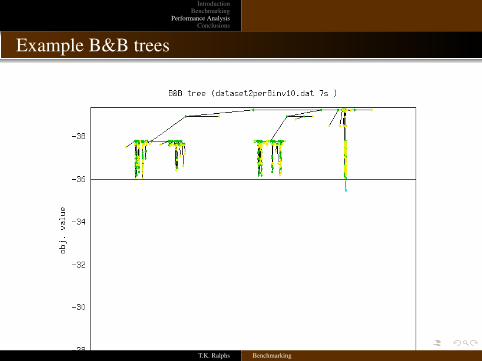
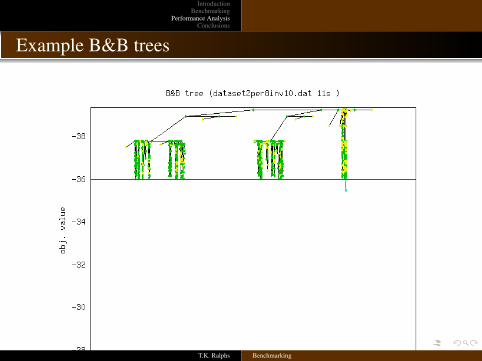
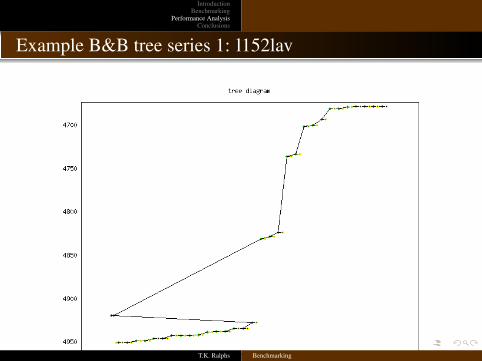
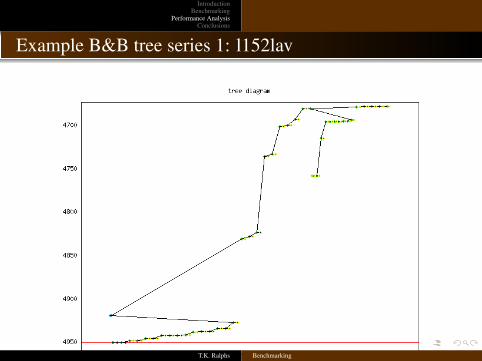
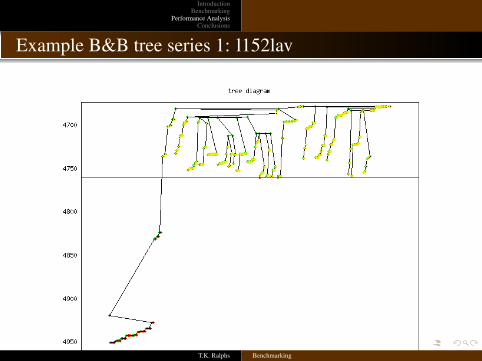
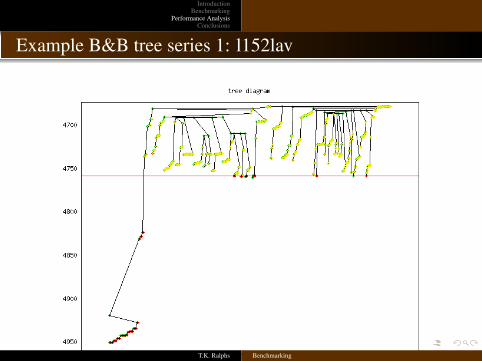
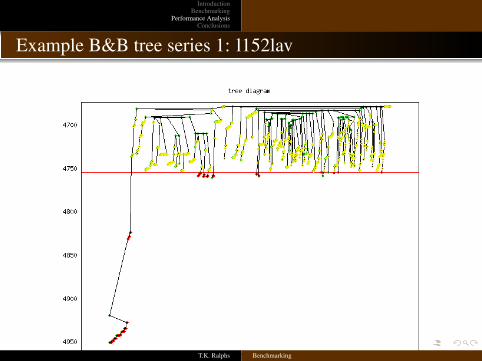
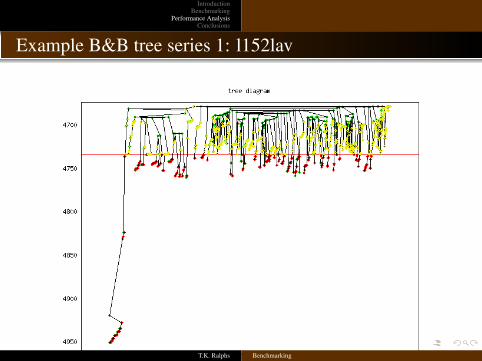
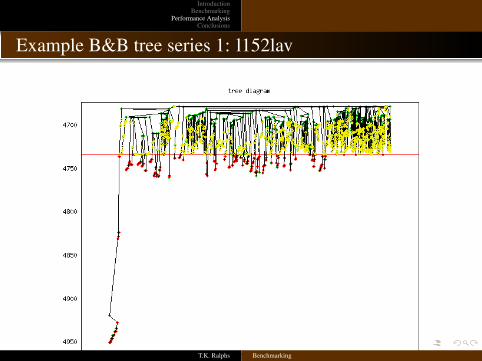
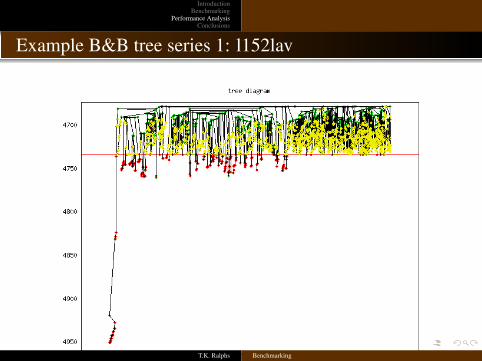
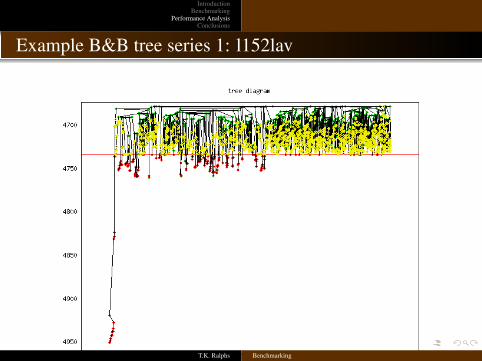
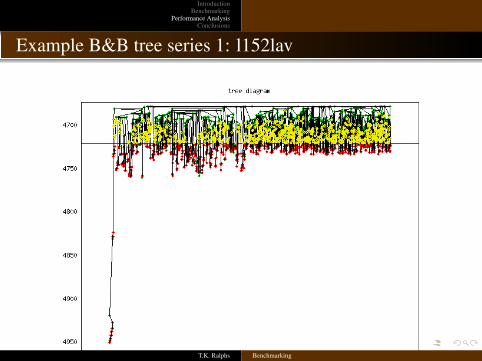
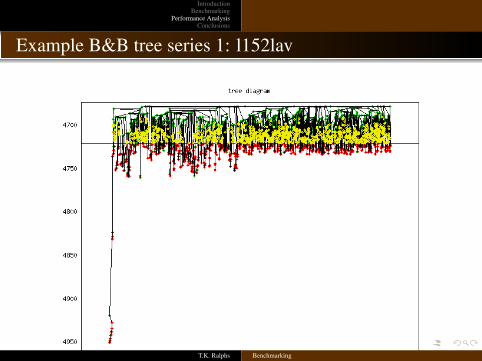
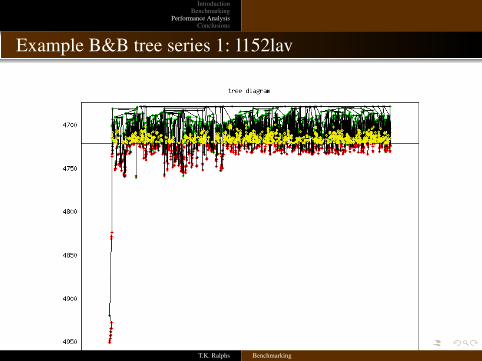
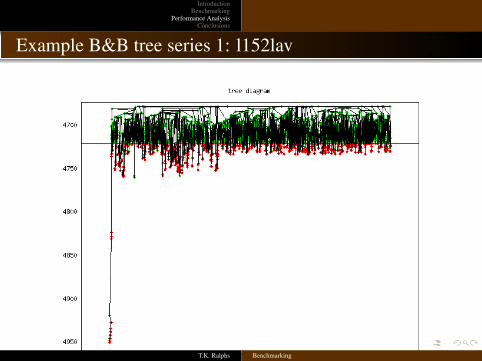
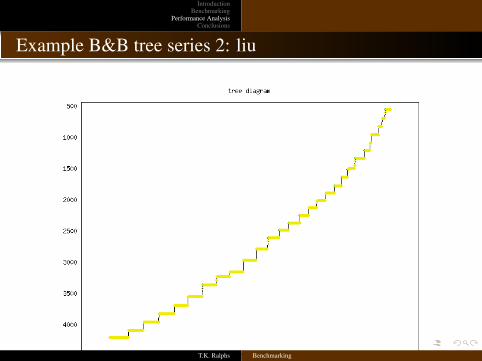
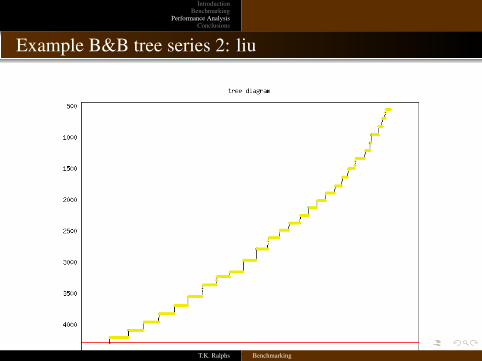
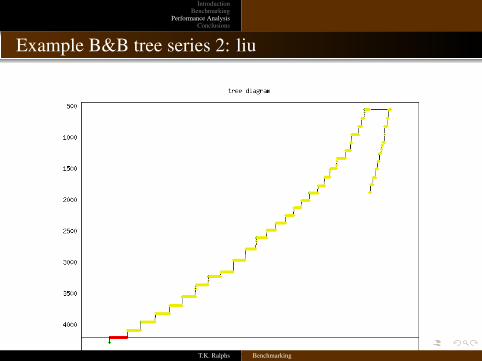
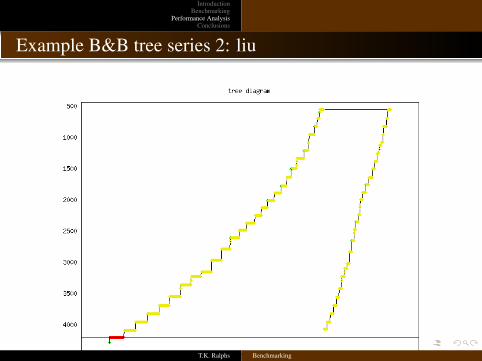
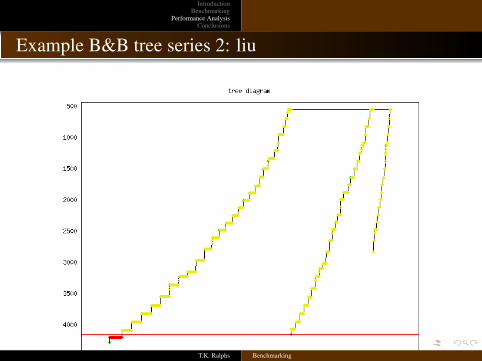
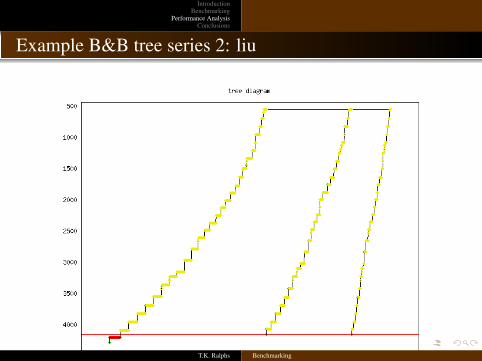
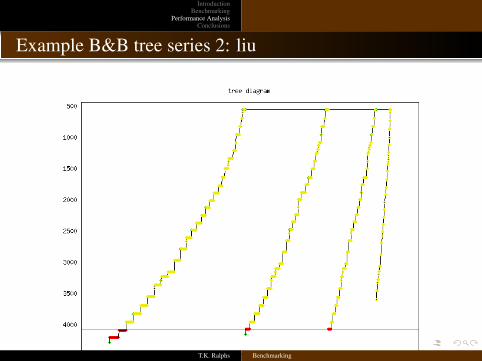
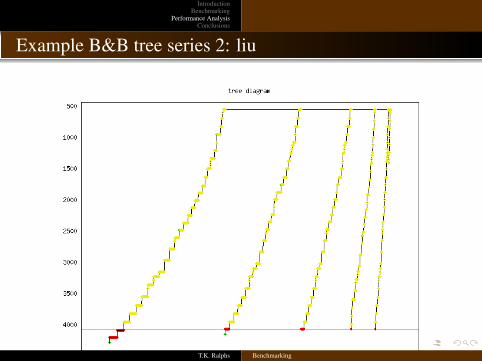
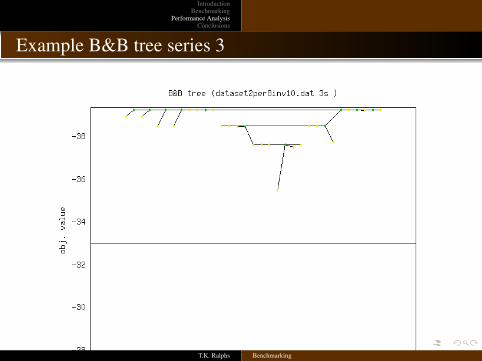
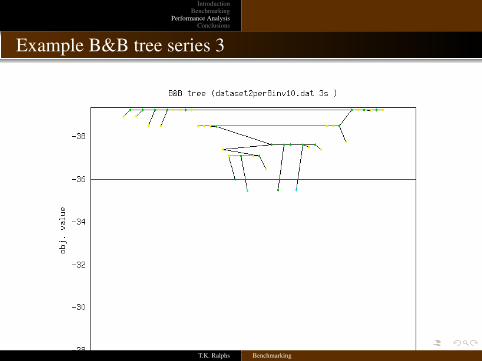
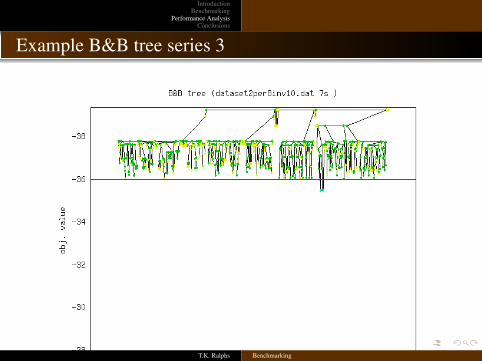
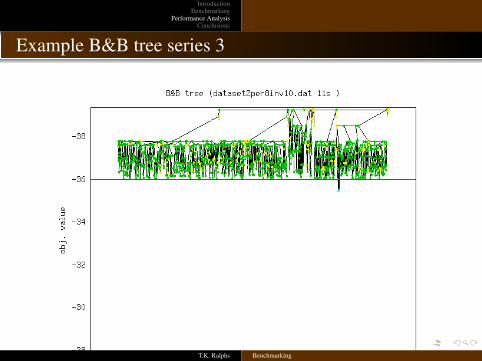
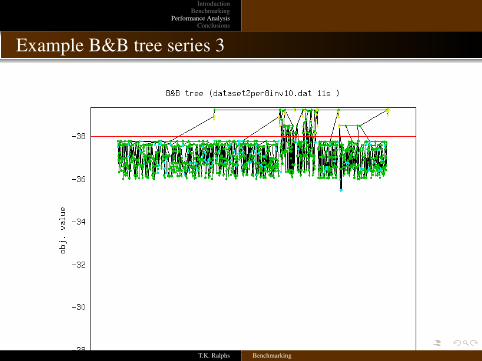
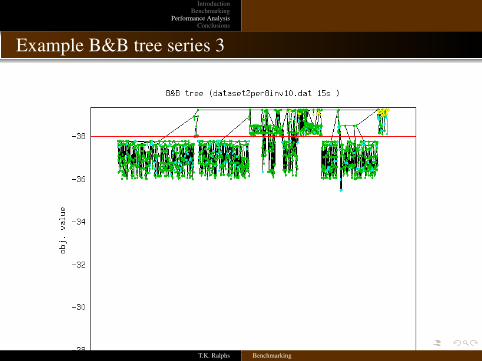
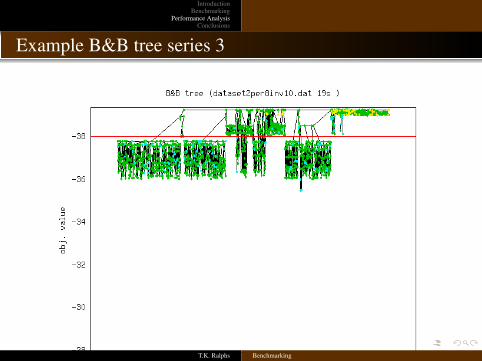
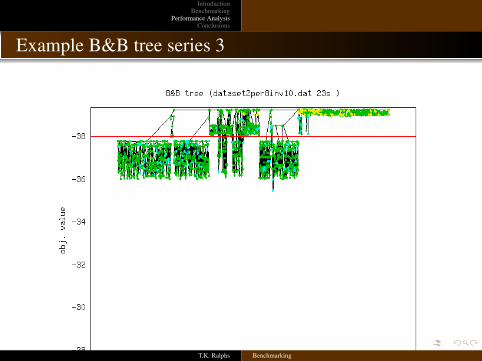
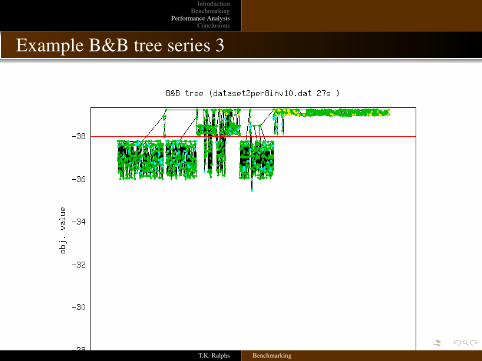
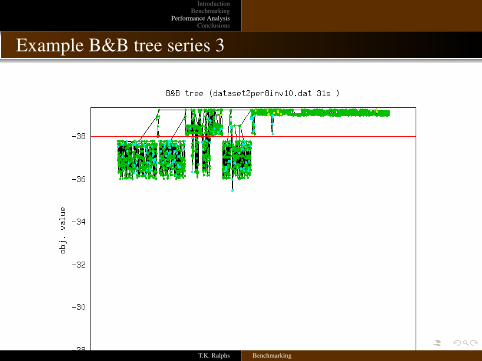
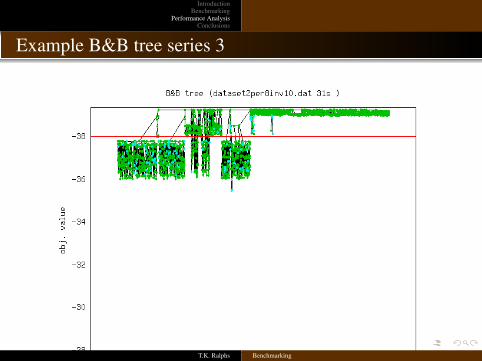
Visualization tools: B&B trees
Vertical axis is the LP boundNodes are horizontally positioned to make the pictures more readableAlternatively, horizontal positions may be fixed based on position in thetree
T.K. Ralphs Benchmarking
IntroductionBenchmarking
Performance AnalysisConclusions
Visualization tools: B&B trees
Node color legend:green: branchedyellow: candidate or pregnantred: fathomedblue: infeasible
T.K. Ralphs Benchmarking
IntroductionBenchmarking
Performance AnalysisConclusions
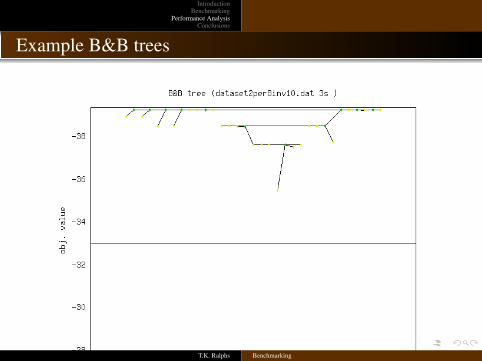
Example B&B trees
T.K. Ralphs Benchmarking
IntroductionBenchmarking
Performance AnalysisConclusions
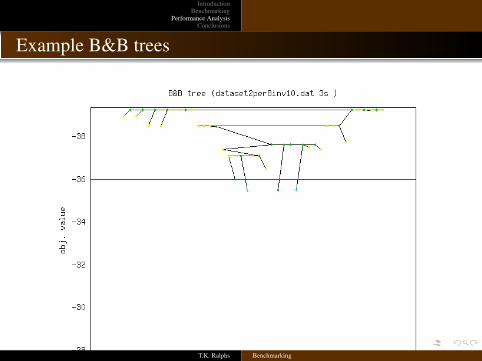
Example B&B trees
T.K. Ralphs Benchmarking
IntroductionBenchmarking
Performance AnalysisConclusions
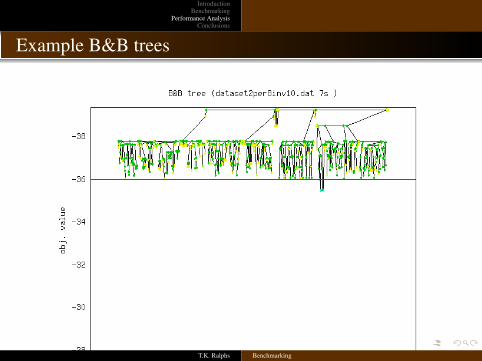
Example B&B trees
T.K. Ralphs Benchmarking
IntroductionBenchmarking
Performance AnalysisConclusions
Example B&B trees
T.K. Ralphs Benchmarking
IntroductionBenchmarking
Performance AnalysisConclusions
Example B&B trees
T.K. Ralphs Benchmarking
IntroductionBenchmarking
Performance AnalysisConclusions
Example B&B trees
T.K. Ralphs Benchmarking
IntroductionBenchmarking
Performance AnalysisConclusions
Example B&B trees
T.K. Ralphs Benchmarking
IntroductionBenchmarking
Performance AnalysisConclusions
Example B&B trees
T.K. Ralphs Benchmarking
IntroductionBenchmarking
Performance AnalysisConclusions
Example B&B tree series 1: l152lav
T.K. Ralphs Benchmarking
IntroductionBenchmarking
Performance AnalysisConclusions
Example B&B tree series 1: l152lav
T.K. Ralphs Benchmarking
IntroductionBenchmarking
Performance AnalysisConclusions
Example B&B tree series 1: l152lav
T.K. Ralphs Benchmarking
IntroductionBenchmarking
Performance AnalysisConclusions
Example B&B tree series 1: l152lav
T.K. Ralphs Benchmarking
IntroductionBenchmarking
Performance AnalysisConclusions
Example B&B tree series 1: l152lav
T.K. Ralphs Benchmarking
IntroductionBenchmarking
Performance AnalysisConclusions
Example B&B tree series 1: l152lav
T.K. Ralphs Benchmarking
IntroductionBenchmarking
Performance AnalysisConclusions
Example B&B tree series 1: l152lav
T.K. Ralphs Benchmarking
IntroductionBenchmarking
Performance AnalysisConclusions
Example B&B tree series 1: l152lav
T.K. Ralphs Benchmarking
IntroductionBenchmarking
Performance AnalysisConclusions
Example B&B tree series 1: l152lav
T.K. Ralphs Benchmarking

IntroductionBenchmarking
Performance AnalysisConclusions
Example B&B tree series 1: l152lav
T.K. Ralphs Benchmarking
IntroductionBenchmarking
Performance AnalysisConclusions
Example B&B tree series 1: l152lav
T.K. Ralphs Benchmarking
IntroductionBenchmarking
Performance AnalysisConclusions
Example B&B tree series 1: l152lav
T.K. Ralphs Benchmarking

IntroductionBenchmarking
Performance AnalysisConclusions
Example B&B tree series 1: l152lav
T.K. Ralphs Benchmarking

IntroductionBenchmarking
Performance AnalysisConclusions
Example B&B tree series 1: l152lav
T.K. Ralphs Benchmarking
IntroductionBenchmarking
Performance AnalysisConclusions
Example B&B tree series 1: l152lav
T.K. Ralphs Benchmarking

IntroductionBenchmarking
Performance AnalysisConclusions
Example B&B tree series 1: l152lav
T.K. Ralphs Benchmarking
IntroductionBenchmarking
Performance AnalysisConclusions
Example B&B tree series 1: l152lav
T.K. Ralphs Benchmarking
IntroductionBenchmarking
Performance AnalysisConclusions
Example B&B tree series 2: liu
T.K. Ralphs Benchmarking
IntroductionBenchmarking
Performance AnalysisConclusions
Example B&B tree series 2: liu
T.K. Ralphs Benchmarking
IntroductionBenchmarking
Performance AnalysisConclusions
Example B&B tree series 2: liu
T.K. Ralphs Benchmarking
IntroductionBenchmarking
Performance AnalysisConclusions
Example B&B tree series 2: liu
T.K. Ralphs Benchmarking
IntroductionBenchmarking
Performance AnalysisConclusions
Example B&B tree series 2: liu
T.K. Ralphs Benchmarking
IntroductionBenchmarking
Performance AnalysisConclusions
Example B&B tree series 2: liu
T.K. Ralphs Benchmarking
IntroductionBenchmarking
Performance AnalysisConclusions
Example B&B tree series 2: liu
T.K. Ralphs Benchmarking
IntroductionBenchmarking
Performance AnalysisConclusions
Example B&B tree series 2: liu
T.K. Ralphs Benchmarking
IntroductionBenchmarking
Performance AnalysisConclusions
Example B&B tree series 3
T.K. Ralphs Benchmarking
IntroductionBenchmarking
Performance AnalysisConclusions
Example B&B tree series 3
T.K. Ralphs Benchmarking
IntroductionBenchmarking
Performance AnalysisConclusions
Example B&B tree series 3
T.K. Ralphs Benchmarking
IntroductionBenchmarking
Performance AnalysisConclusions
Example B&B tree series 3
T.K. Ralphs Benchmarking
IntroductionBenchmarking
Performance AnalysisConclusions
Example B&B tree series 3
T.K. Ralphs Benchmarking
IntroductionBenchmarking
Performance AnalysisConclusions
Example B&B tree series 3
T.K. Ralphs Benchmarking
IntroductionBenchmarking
Performance AnalysisConclusions
Example B&B tree series 3
T.K. Ralphs Benchmarking
IntroductionBenchmarking
Performance AnalysisConclusions
Example B&B tree series 3
T.K. Ralphs Benchmarking
IntroductionBenchmarking
Performance AnalysisConclusions
Example B&B tree series 3
T.K. Ralphs Benchmarking
IntroductionBenchmarking
Performance AnalysisConclusions
Example B&B tree series 3
T.K. Ralphs Benchmarking
IntroductionBenchmarking
Performance AnalysisConclusions
Example B&B tree series 3
T.K. Ralphs Benchmarking
IntroductionBenchmarking
Performance AnalysisConclusions
Outline
1 Introduction
2 BenchmarkingPurposeSequential CodesParallel Codes
3 Performance Analysis
4 Conclusions
T.K. Ralphs Benchmarking
IntroductionBenchmarking
Performance AnalysisConclusions
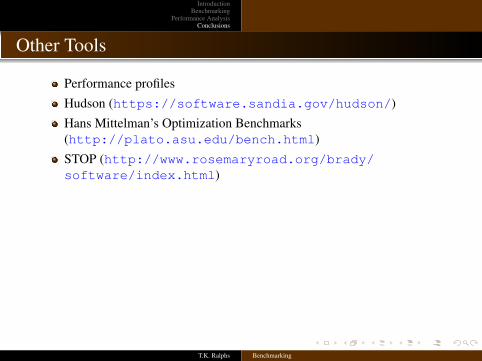
Other Tools
Performance profilesHudson (https://software.sandia.gov/hudson/)Hans Mittelman’s Optimization Benchmarks(http://plato.asu.edu/bench.html)STOP (http://www.rosemaryroad.org/brady/software/index.html)
T.K. Ralphs Benchmarking
IntroductionBenchmarking
Performance AnalysisConclusions
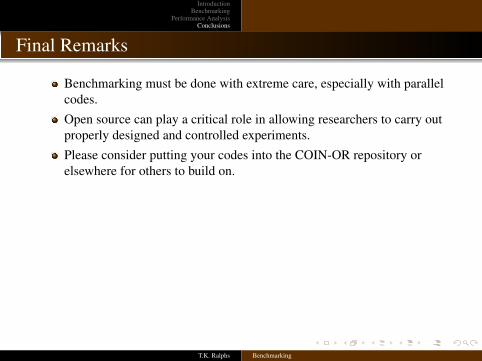
Final Remarks
Benchmarking must be done with extreme care, especially with parallelcodes.Open source can play a critical role in allowing researchers to carry outproperly designed and controlled experiments.Please consider putting your codes into the COIN-OR repository orelsewhere for others to build on.
T.K. Ralphs Benchmarking