bp equities gulf oil lubticants india ltd initiating
TRANSCRIPT
Enhancing Footprint

Gulf Oil Lubricants India Ltd Initiating Coverage
Institutional Research BP Equities Pvt. Limited (www.bpwealth.com) 17/03/2017
B P W E A L T H
Table of Content
Summary on Business Profile & Explanation on why we like this company…………………...……....………….....3-5
Investment Rationale…………………………………………………………………………………………………………….5-11
⇒ Industry itself moving towards volume growth
⇒ OEM tie-ups and Chennai plant to further drive volumes
⇒ Baazar segment to drive market share gains
⇒ Stable crude oil prices to protect margins
Improving financials…………..…………………………………………………………………………………………………...12
Company overview……………...……………………………………………………………………………………………...14-17
Peer Comparison, Key Concerns & valuation Band ………………….…………………...………………………………...17
Valuation & Outlook ……………………………………………………..………………………………………………..……….18
Financial Statements…...……………………………………………………...…………………….....................................19-22
Disclaimer……………………………………………………………………………………………………..………...…………...23

2nd Feb , CY11
Gulf oil Lubricants India Ltd
Share Holding Pattern (%)
Sector Outlook Positive
CMP (Rs) 704
Target Price (Rs) 879
BSE code 538567
NSE Symbol GULFOILLUB
Bloomberg GOLI IN
Reuters GOLU.BO
Key Data
Nifty 9160
52 Week H/L (Rs) 780/452
O/s Shares (mn) 49
Market Cap (Bn) 35
Average volume
3 months 24,220
6 months 20,130
1 year 29,320
Stock
Face Value (Rs) 2
Relative Price Chart
Company Overview: Gulf Oil Lubricants India Ltd is 68.7% owned by Gulf Oil International, which is a Hinduja group com-pany. The brand Gulf was acquired from Chevron in 1980 and the parent company has rights in all countries except Portugal, Spain, and USA. Gulf has been present in India since 1920. Previously, the lubricant business was part of Gulf Oil Corporation. It was demerged as a pure play lubricant company in CY14 with separate financial statements available from FY15. The company is has one manufactur-ing facility in Silvasa with production capacity 95,000 Kilo-ltrs and one upcoming facility in Chennai with capacity of 40,000 kilo-ltrs. The company currently has 55,000 retailers across the country spread across spare-part shops, lube shops, Dealers etc. Gulf has over 7% share in baazar segment with 8% in CVs, 9% in MC/2W, 4.5% in PCMO and 5% in tractors. Gulf oil lubricants derives maximum reve-nues share from DEO segment (Diesel Engine Oil) which contributes 45% followed by MCO/2W seg-ment (motorcycle) contributing 20%, Industrial grades contributing 14% and PCMO contributes 5%. Investment Rationale Lubricant industry itself moving toward volume growth The lubricant demand in India is mainly driven by automotive (60% demand) and Industrial (40%) seg-ment (excluding process oils). In the automotive segment 20% demand is driven by direct sales to OEMs and rest is generated from baazar segment (replacement market). The increased spending on infrastructure and improving outlook for mining industry has also added to volumes for automotive lu-bricants as CVs remain significant consumer for lubricants. The improving consumption of some indus-trial fuel like bitumen, Fuel oil and naphtha in recent months( growth of 10% and 15% respectively) indicate the uptick in industrial activity. Improving volumes of fuels is one of the key indicators for higher lubricant consumption, as consumption of fuel oil lubricants is directly proportional to each other. Further, the lengthening drain cycle also is showing signs of peaking out which is further strengthening volumes as drain cycle had been structurally responsible for lower volume growth for automotive lubricants The drain cycles now seem to peak due to factors like
⇒ Higher drain cycle only possible under idle conditions like uniform speed of 45Km/hr, constant surface, no idling. These conditions are practically not possible
⇒ People prefer to change lubricant more on timely basis rather than based on distance trav-elled in the personal mobility space.
⇒ Lubricants have definite shelf life and need to be changed after certain time frame.
OEMs tie-ups and Chennai Plant to further drive volumes The OEM tie-up has been one of the key strategies for volume growth and developing goodwill in baazar segment. The OEM approval is necessary for pushing the sales in baazar segment as the cus-tomers are more inclined to use the oil specified by the OEM manufacturer. Gulf is having its portfolio of CV’s oil co branded with Ashok Leyland. The OEM presence also gives the lubricant company addi-tional business in direct fills, this is evident from the fact that Gulf derives 9% of its revenue from Ashok Leyland of which major part is in B2B. The Leyland legacy has been one of the key reasons for Gulf to have considerable presence in southern India. Gulf is adding capacity of almost 50,000 kilo liters in Chennai region with capex of Rs 1.5 Bn out of which Rs 600 mn has been already spent this plant is expected to begin commercial production by Oct-2017. This plant is expected to have significant logis-tical advantages as company has higher sales in southern India (close to 30%). The sales are pres-ently serviced from the Silvassa plant located in western part of country. The Chennai plant Gulf can save significantly on logistics cost, this savings can be close to Rs 3/ltr (as per management). This plant is also expected to improve its standing in terms of pricing, volumes and servicing in south India. Baazar segment to drive market share gains The Baazar segment which is the replacement market is the largest consumer of lubricants. This busi-ness being B2C in nature is more profitable due to higher pricing power but its needs lot of brand build-ing and underline marketing like dealer commission, sales incentive, workshop and training sessions for channel partners. Gulf has signed MS Dhoni as brand ambassador for brand building in personal mobility segment. The strategy of focusing on OEMs first has also aided gulf in developing presence in baazar segment with 8% market share for commercial vehicles and 5% market share for tractors. In-creasing the distribution reach by 10-12% every year is expected to further add to the volumes as Gulf has presence only at 55,000 sales point as compared to total number of 1,50,000—1,80,000. Divi-dends from the investments in marketing are expected to start paying off in next two years and this is evident from the fact that Gulf has doubled its volumes in personal mobility segment in last 6 years. This aggressive strategy has also helped the company to grow at volumes 2-3 times that of industry growth. We expect the volume growth of 14.5%. 7.5% and 10.8% for FY 17, FY18 and FY19 respec-tively.
Oil & Gas / Initiating Coverage 17th March, 2017
Buy
BUY HOLD SELL
> 15% -5% to 15% < -5%
Stock Rating
Research Analyst Samarth Shedshale [email protected] 022-61596411
B P W E A L T H
3
68.6%3.6%
13.4%14.4%
Promoter FII DII Others
100200300400500600700800900
Mar-16 Jun-16 Sep-16 Dec-16 Mar-17
Gulf oil lubricants(India) Ltd Nifty

Gulf Oil Lubricants India Ltd Initiating Coverage
Institutional Research BP Equities Pvt. Limited (www.bpwealth.com) 17/03/2017
B P W E A L T H
Stable Crude oil prices to protect margins: Gulf’s major raw materials are derivatives of crude oil with primary being Base oil and additives used in lubricants. The price of base oil is depended not only on crude oil prices but also on demand supply economics of base oil cracks. This industry has been in oversupply situation over last few years as the volume demand for lubricants has remained low. With increased use semi-synthetic and synthetic lubri-cants base oils of grade 2 and grade 3 are finding increased usage. The grade 1 lubricants have higher excess supply in the market. The stable crude oil prices or even gradual increase in crude oil prices can be passed on by Gulf fully thus protecting margins. The prices of additives are also expected to improve further along with crude prices but the increase is expected to be in less quantum compared to crude increase (as additive prices had not corrected sharply). These additives are supplied by 3 major players namely Chevron, Lubrizol and Shell. Even in the rising Base oil price environment, we expect the strong brand companies to easily pass on raw material price hike due to strong pricing power that these com-panies enjoy in baazar segment. This phenomenon is evident from the fact that Gulf was able to in-crease its prices in baazar segment by 3% in November immediately after demonetization and company was able to post higher volume growth (5.5% vs 2%) than its peers. Improving financial & operational performance Gulf’s financial performance has been largely stable ever since it was the part of merged entity GOCL but its financial performance has started improving after demerger due to better management band-width and falling base oil prices. The company has utilized gains from base oil prices towards brand building and increasing distribution network which would benefit the company long run. The realizations and margins are expected to improve due to increasing share of profitable personal mobility with share improving from 24.5% to 27%. This increase is expected to be driven by 25% volume growth in PCO and 12% in the MCO segment. The commissioning of Chennai plant is expected to reduce the selling and distribution expenses. There has been change in strategy with company becoming price setter from a follower few years back (Gulf has increased its prices in baazar segment immediately after base oil prices increased in month of November and this was followed by another increase in January). The capex requirements of the company are to moderate over next 5 years as company will be having enough capacity to fulfill the upcoming demand. The Sales are expected to grow at 11% CAGR while EBIDTA is expected to grow by 21% CAGR with operating profits rising from Rs1582mn to Rs2802mn on account of expected margin improvement 280bps. We expect the company to remain FCF positive from FY 18 with cumulative FCF of Rs1400mn in next 3 years. Why we like this stock & valuation methodology At the present price of Gulf oil lubricants trades at 20 times for FY19E EPS of Rs 35.2, the share price and multiples have expanded in last two years on back of re-rating and margins benefits derived on account of fall in base oil prices. We expect company’s PAT to expand at 20.2% CAGR from FY16 to FY19 on account 11.2% CAGR in volumes, increasing contribution from personal mobility segment and cost saving from Chennai plant. We value Gulf at 10% discount to Castrol’s valuation due to superior brand recall, negative working capital and higher distribution network but in volume growth Castrol lags behind Gulf by significant margin and volume are one of driving factors for higher profits. Hence we value Gulf at 25 times(10% discount to Castrol) its estimated FY19 and assign target price of Rs 879. The view is expected to remain cautious in near tem as full impact of higher base oil price is expected to hit margin in Q4 of this financial year and Q1 of next financial year but we expect company to pass on hikes completely in all trade channels.
4
Crude and its derivatives ac-count major cost for lubricant companies with base oil ac-counting 60% and additives accounting 30% of total cost and Packaging cost account-ing 10%.

Gulf Oil Lubricants India Ltd Initiating Coverage
Institutional Research BP Equities Pvt. Limited (www.bpwealth.com) 17/03/2017
B P W E A L T H
Key Financials (Standalone)
YE March (Rs. mn) FY16 FY17E FY18E CY19E
Net Sales 10,114 11,494 13,766 15,992
Sales Growth (Y-oY) 4.5% 13.6% 19.8% 16.2%
EBIDTA 1,582 1,655 2,145 2,782
EBIDTA Growth (Y-o-Y) 25.2% 4.6% 29.6% 29.7%
Net Profit 1,003 1,039 1,308 1,742
Net Profit Growth (Y-o-Y) 29.6% 3.6% 25.8% 33.2%
Diluted EPS 20.2 21.0 26.4 35.2
Diluted EPS Growth (Y-o-Y) 29.6% 3.6% 25.8% 33.2%
No of Diluted shares (mn) 50 50 50 50
Key Ratios
EBIDTA (%) 15.6% 14.4% 15.6% 17.4%
NPM (%) 9.9% 9.0% 9.5% 10.9%
RoE (%) 40.4% 33.0% 32.6% 33.8%
RoCE (%) 35.2% 30.7% 35.4% 42.1%
Tax Rate % 34.5% 34.0% 34.0% 34.0%
Book Value Per share (Rs.) 50.1 63.5 80.9 104.1
Valuation Ratios
P/E (x) 34.6x 33.4x 26.5x 19.9x
EV/EBITDA 21.7x 21.0x 16.3x 12.4x
P/BV (x) 14.0x 11.0x 8.6x 6.7x
Market Cap. / Sales (x) 3.4x 3.0x 2.5x 2.2x
Source: Company, BP Equities Research
Gulf Oil Lubricants India Ltd Initiating Coverage
Institutional Research BP Equities Pvt. Limited (www.bpwealth.com) 17/03/2017
B P W E A L T H
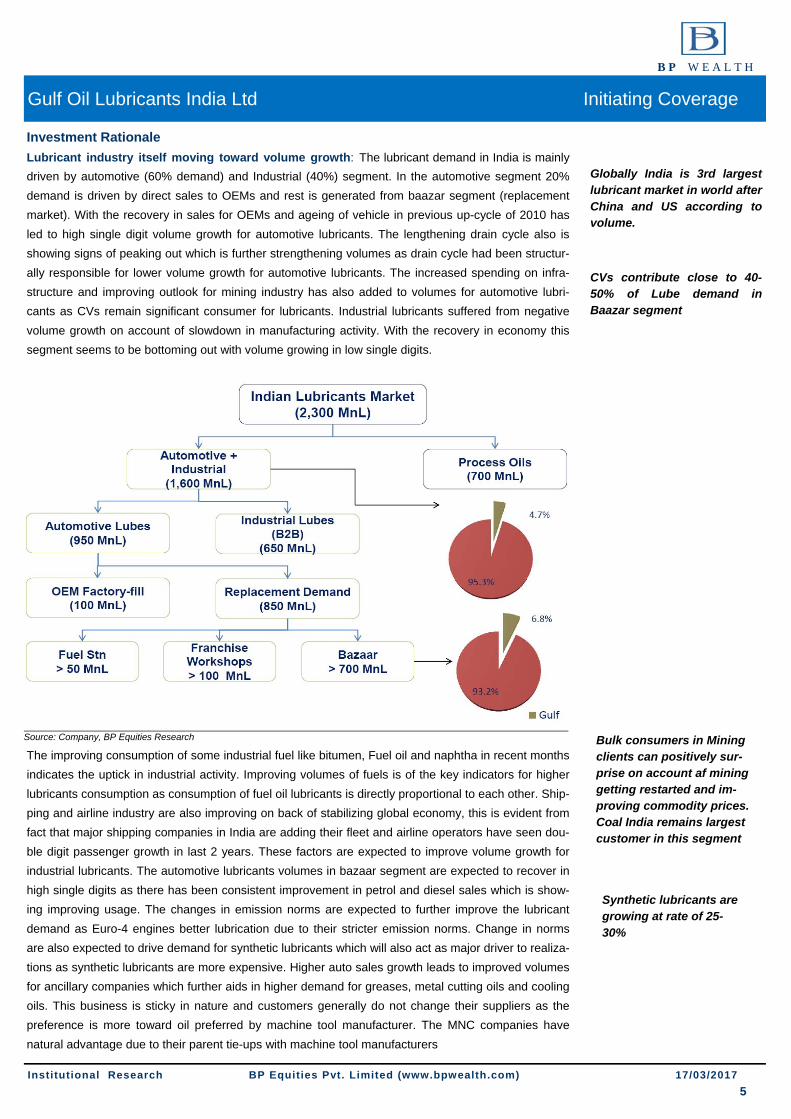
CVs contribute close to 40-50% of Lube demand in Baazar segment
Investment Rationale Lubricant industry itself moving toward volume growth: The lubricant demand in India is mainly driven by automotive (60% demand) and Industrial (40%) segment. In the automotive segment 20% demand is driven by direct sales to OEMs and rest is generated from baazar segment (replacement market). With the recovery in sales for OEMs and ageing of vehicle in previous up-cycle of 2010 has led to high single digit volume growth for automotive lubricants. The lengthening drain cycle also is showing signs of peaking out which is further strengthening volumes as drain cycle had been structur-ally responsible for lower volume growth for automotive lubricants. The increased spending on infra-structure and improving outlook for mining industry has also added to volumes for automotive lubri-cants as CVs remain significant consumer for lubricants. Industrial lubricants suffered from negative volume growth on account of slowdown in manufacturing activity. With the recovery in economy this segment seems to be bottoming out with volume growing in low single digits.
The improving consumption of some industrial fuel like bitumen, Fuel oil and naphtha in recent months indicates the uptick in industrial activity. Improving volumes of fuels is of the key indicators for higher lubricants consumption as consumption of fuel oil lubricants is directly proportional to each other. Ship-ping and airline industry are also improving on back of stabilizing global economy, this is evident from fact that major shipping companies in India are adding their fleet and airline operators have seen dou-ble digit passenger growth in last 2 years. These factors are expected to improve volume growth for industrial lubricants. The automotive lubricants volumes in bazaar segment are expected to recover in high single digits as there has been consistent improvement in petrol and diesel sales which is show-ing improving usage. The changes in emission norms are expected to further improve the lubricant demand as Euro-4 engines better lubrication due to their stricter emission norms. Change in norms are also expected to drive demand for synthetic lubricants which will also act as major driver to realiza-tions as synthetic lubricants are more expensive. Higher auto sales growth leads to improved volumes for ancillary companies which further aids in higher demand for greases, metal cutting oils and cooling oils. This business is sticky in nature and customers generally do not change their suppliers as the preference is more toward oil preferred by machine tool manufacturer. The MNC companies have natural advantage due to their parent tie-ups with machine tool manufacturers
5
Source: Company, BP Equities Research Bulk consumers in Mining clients can positively sur-prise on account af mining getting restarted and im-proving commodity prices. Coal India remains largest customer in this segment
Globally India is 3rd largest lubricant market in world after China and US according to volume.
Synthetic lubricants are growing at rate of 25-30%
Gulf Oil Lubricants India Ltd Initiating Coverage
Institutional Research BP Equities Pvt. Limited (www.bpwealth.com) 17/03/2017
B P W E A L T H
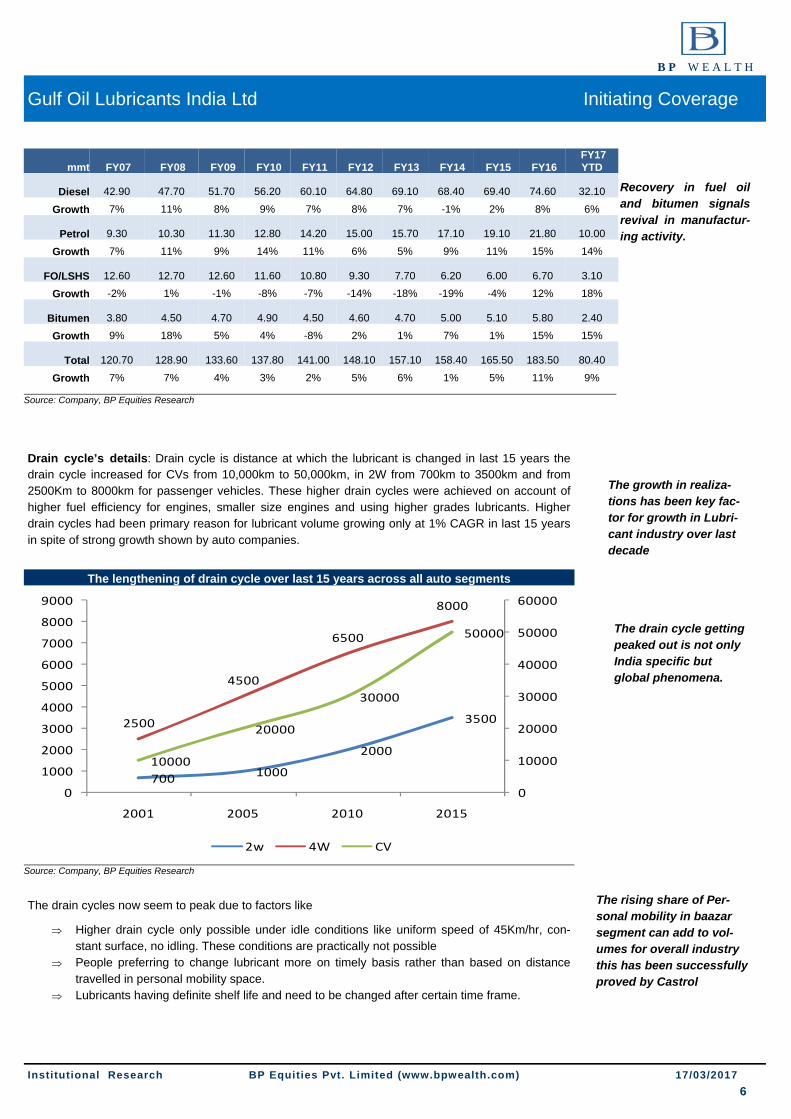
Drain cycle’s details: Drain cycle is distance at which the lubricant is changed in last 15 years the drain cycle increased for CVs from 10,000km to 50,000km, in 2W from 700km to 3500km and from 2500Km to 8000km for passenger vehicles. These higher drain cycles were achieved on account of higher fuel efficiency for engines, smaller size engines and using higher grades lubricants. Higher drain cycles had been primary reason for lubricant volume growing only at 1% CAGR in last 15 years in spite of strong growth shown by auto companies.
The drain cycles now seem to peak due to factors like
⇒ Higher drain cycle only possible under idle conditions like uniform speed of 45Km/hr, con-stant surface, no idling. These conditions are practically not possible
⇒ People preferring to change lubricant more on timely basis rather than based on distance travelled in personal mobility space.
⇒ Lubricants having definite shelf life and need to be changed after certain time frame.
6
Source: Company, BP Equities Research
700 1000
2000
35002500
4500
6500
8000
10000
20000
30000
50000
0
10000
20000
30000
40000
50000
60000
0
1000
2000
3000
4000
5000
6000
7000
8000
9000
2001 2005 2010 2015
2w 4W CV
The growth in realiza-tions has been key fac-tor for growth in Lubri-cant industry over last decade
Recovery in fuel oil and bitumen signals revival in manufactur-ing activity.
mmt FY07 FY08 FY09 FY10 FY11 FY12 FY13 FY14 FY15 FY16 FY17 YTD
Diesel
42.90
47.70
51.70
56.20
60.10
64.80
69.10
68.40
69.40
74.60
32.10
Growth 7% 11% 8% 9% 7% 8% 7% -1% 2% 8% 6%
Petrol
9.30
10.30
11.30
12.80
14.20
15.00
15.70
17.10
19.10
21.80
10.00
Growth 7% 11% 9% 14% 11% 6% 5% 9% 11% 15% 14%
FO/LSHS
12.60
12.70
12.60
11.60
10.80
9.30
7.70
6.20
6.00
6.70
3.10
Growth -2% 1% -1% -8% -7% -14% -18% -19% -4% 12% 18%
Bitumen
3.80
4.50
4.70
4.90
4.50
4.60
4.70
5.00
5.10
5.80
2.40
Growth 9% 18% 5% 4% -8% 2% 1% 7% 1% 15% 15%
Total
120.70
128.90
133.60
137.80
141.00
148.10
157.10
158.40
165.50
183.50
80.40
Growth 7% 7% 4% 3% 2% 5% 6% 1% 5% 11% 9%
Source: Company, BP Equities Research
The drain cycle getting peaked out is not only India specific but global phenomena.
The rising share of Per-sonal mobility in baazar segment can add to vol-umes for overall industry this has been successfully proved by Castrol
The lengthening of drain cycle over last 15 years across all auto segments

Gulf Oil Lubricants India Ltd Initiating Coverage
Institutional Research BP Equities Pvt. Limited (www.bpwealth.com) 17/03/2017
B P W E A L T H
OEMs tie-ups and Chennai Plant to further drive volumes
The OEM tie-up has been one of the key strategies for volume growth and developing goodwill in
baazar segment. The OEM approval is necessary for pushing the sales in baazar segment as the cus-
tomers are more inclined to use the oil specified by the OEM manufacturer. Gulf is having its portfolio
of CVs oil co branded with Ashok Leyland. The OEM presence also give the lubricant company addi-
tional business in Direct fills. This is evident from the fact that Gulf derives 9% of its revenue from
Ashok Leyland of which major part is in B2B. The Leyland legacy has been one of the key reasons for
Gulf to have considerable presence in southern India. Gulf is adding capacity of almost 50,000 kilo
liters in Chennai region with capex of Rs1.5Bn out of which 600mn has been already spent this plant is
expected to begin commercial production by Oct-2017. This plant is expected to have significant logis-
tical advantages as company has higher sales in southern India. The sales are presently serviced from
the Silvassa plant located in western part of country with Chennai plant Gulf can save significantly on
logistic cost, this saving can be close to Rs 3/ltr. This plant is also expected to improve its standing in
terms of pricing, volumes and service in south India.
The recent tie-up with Bajaj Auto is expected to improve the market share of Gulf oil by 1% directly to
MCO segment. Gulf’s OEM tie-up for PCMO can further add to volumes in both direct fill and baazar
segment. The tie-up with Mahindra and Swaraj in 2014 has aided higher market share for Gulf in Trac-
tor segment. The sales to Ashok Leyland have also gone from 74cr to 97cr, we expect this momentum
to sustain due to market share in gains by Ashok Leyland in CV segment, with aggressive entry of
Ashok Leyland in LCV segment after split with Nissan we expect higher volume for Gulf from direct-fill
business.
7
Gulf has been successful in adding 1-2 OEMs each year we have not factored in any new OEM tie-ups. The direct fill business is low margin busi-ness but gives much needed volumes and recognition.
Source: Company, BP Equities Research
Source: Company, BP Equities Research
Year OEM Remarks
2006-07 Ashok Leyland for CVs Co-branded oils
2010-11 Mahindra PVs Co-branded oils
2011-12 Ashok Leyland-Nissan for LCVs Co-branded oils
2011-12 Leyland Deere for CE Genuine oils
2011-12 MAN Co-branded oils
2012-13 Bharat Benz Genuine oils
2013-14 Mahindra Tractors Co-branded oils
2013-14 Swarj Tractors Co-branded oils
2014-15 Schwing Stetter Branded Oil
2015-16 Swarj Tractors Genuine oils
2016-17 Bajaj Auto Co-branded oils
735 971.1
7.60%
9.60%
0.00%
2.00%
4.00%
6.00%
8.00%
10.00%
12.00%
0
200
400
600
800
1000
1200
FY 15 Fy16
Ashok leyland Sales(mn) % of sales
South India is responsible for close to 30% of Gulf sales. Western and Southern mar-kets are considered to be most lucrative markets for lubricant industry

Gulf Oil Lubricants India Ltd Initiating Coverage
Institutional Research BP Equities Pvt. Limited (www.bpwealth.com) 17/03/2017
B P W E A L T H
Baazar segment to drive market share gains The Baazar segment which is the replacement market is the largest consumer of lubricants. This business being B2C in nature is more profitable due to higher pricing power but its needs a lot of brand building and underline marketing like dealer commission, sales incentive, workshop and training sessions for channel partners. Gulf has signed MS Dhoni as brand ambassador for brand building in personal mobility segment. The strategy of focusing on OEM’s first has also aided gulf in developing presence in baazar segment with 8% market share for commer-cial vehicles and 5% market share for tractors. Increasing the distribution reach by 10-12% every year is ex-pected to further add to the volumes as Gulf has presence only 55,000 sales point as compared to total number of 1,50,000 - 1,80,000. By increasing the point of sales the company can fully utilize the advertising spending which is underutilized presently as per management. As per the recent management surveys, Gulf has inquires in 60% dealers which is roughly 1,00,000 as compared to its presence of 55,000 which proves that Gulf has the potential to gain the market share upto 1,00,000. Increase in distribution presence is one of key reason to gain market share highly profitable MCO and PCMO areas as these are segments which are brand conscious and shelve availability is needed. We expect the traction in MCO volumes to increase with company tying-up with Bajaj Auto. Gulf is among top three brands in lubricant industry. Dividends from the investments in marketing are expected to start paying off in next two years and this is evident from the fact that Gulf has doubled its volumes in personal mobility segment in last 6 years. This aggressive strategy has also helped the company to grow at volumes 2-3times that of industry growth. We expect the volume growth of 14.5%. 7.5% and 10.8% for FY 17, FY18 and FY19 respectively.
In CVOs Gulf has managed to gain share by discounting, key peers focusing more on personal mobility segment and maintain value for money brands which are at discount to prices which market leader commands. This seg-ment is more price conscious and needs product with better durability as vehicle usage is higher. The market share gains in tractor oil have increased since Gulf launched co branded oil with Mahindra for tractors. Aggres-sive pricing strategy has also helped Gulf in gaining volume in the STUs and tender businesses. These markets were left vacant after Castrol had slowly exited this business owning lower profits.
Channel sales Mix
Garages –50%, Spare part shops– 20%, Lube shops-20%, Other-20%
Gulf ‘s Superfleet brand is at discount of close to 15% as compared market leaders prices for same grade
9
Car Stop 185 to 700
Bike Stop 4000 to 6000
Rural Stockists 140 to 300
Retail Reach 56000
Institutional clients 350
Rapidly expanding distribution network across channels and sustained Advertising spending..
Focus Areas Personal Mobility Tractor CV Industrial
OEMs Tide, shell, Elf, BPCL Gulf Gulf, BPCL Castrol,Elf,OMCs,Tide
Fuel stations OMCs OMCs OMCs
Spare-part Shops Gulf, IOC, Elf, Castrol, Tide Gulf,Elf
Lube shops Gulf, IOC, Elf, Castrol, Tide Gulf, Elf
Work shops Castrol Gulf, Elf
Autr. Dealers Gulf, Mobil Gulf, Elf Gulf, Elf Elf
Gulf plans to add its distribution network by 10% every year and company has historically main-tained that pace.
Castrol and Gulf are aggressive players in below line marketing while OMC s suffer due to slower deci-sion making and other MNC s suffer from weaker below line marketing
Source: Company, BP Equities Research
Source: Company, BP Equities Research
3%
6% 6% 6% 6% 6% 6%
7%
0%
1%
2%
3%
4%
5%
6%
7%
8%
FY09 FY10 FY11 FY12 FY13 FY14 FY15 FY16
Addvertising Spending(%)
DEOs will continue to have lion’s share in Gulf overall portfolio

Gulf Oil Lubricants India Ltd Initiating Coverage
Institutional Research BP Equities Pvt. Limited (www.bpwealth.com) 17/03/2017
B P W E A L T H
The volumes growth is expected to be moderate i.e. 7.6% growth in FY18 due to lower factory fills in Q1 of FY 18 as CV sales are expected to be lower due to increased cost of M&HCVs on account of BS-4 emissions but we expect improvement in M&HCVs in FY19 on account of various safety reforms like scrapage policy and overloading caps (expected incremental demand of 2 lac vehicles). Gulf is expected to benefit from higher factory fills and baazar segment.
The contribution from personal mobility segment which is MCO and PCMO is expected to increase from 24.5% in FY16 to 27% by FY19. The profits in personal mobility segment are higher than all other segments hence increasing contribution in this segment can improve overall margins for Gulf. The Diesel Engine Oil (DEO) contribution is expected to fall to 42% by FY19 from 45% presently due to higher growth in personal mobility growth. The DEO segment is comparatively less profitable as this is more competitive due cost con-scious customers but it will continue to remain largest contributor in Gulf’s portfolio.
Source: Company, BP Equities Research
10
We expect MCO sales to grow at 12% CAGR and PCMO to grow at 25% CAGR over next few years compared to 8% growth in DEOs
..have led to sustained volume growth which is roughly 2-3x the industry growth
4653
61
65 64 6875
8692.5
102.524.0%
15.2% 15.1%
6.6%
-1.5%
6.3%10.3%
14.7%
7.6%10.8%
-5.0%
0.0%
5.0%
10.0%
15.0%
20.0%
25.0%
30.0%
0
20
40
60
80
100
120
FY10 FY11 FY12 FY13 FY14 FY15 FY16 FY17E FY18E FY19E
Volumes(KL tons) Growth(%)
Improving share of Personal mobility has led to company reducing dependence on DEO
13%
24.50%27%
0%
5%
10%
15%
20%
25%
30%
FY09 FY16 FY19E
Personal mobility Share
63%
45%42%
0%
10%
20%
30%
40%
50%
60%
70%
FY09 FY16 FY19E
DEO share
Gulf gives higher margins and credit to Distributors as compared to Cas-trol which has led to Gulf having higher volume growth than peers
Source: Company, BP Equities Research

Gulf Oil Lubricants India Ltd Initiating Coverage
Institutional Research BP Equities Pvt. Limited (www.bpwealth.com) 17/03/2017
B P W E A L T H
Lubricant companies have been able to pass on raw mate-rial prices to their customers historically which has protected their margins as shown in chart below. The companies had wit-nessed inflationary scenario in 2010-11
Stable Crude oil prices to protect margins: Gulf’s major raw materials are derivatives of crude oil with primary being Base oil and additives used in lubricants. The prices of base oil are depended not only on crude oil prices but also on demand supply economics of base oil cracks. This industry has been in oversupply situation over last few years as the volume demand for lubricants has remained low. With increased use semi-synthetic and synthetic lubricants base oils of grade 2 and grade 3 are finding increased usage. The grade 1 lubricants are having higher excess supply in the market. The stable crude oil prices or even gradual increase in crude oil prices can be passed on by Gulf fully thus protecting margins. The prices of additives are also expected to improve further along with crude prices but the increase is expected to be in less quantum compared to crude increase (as additive prices had not corrected sharply) . These additives are supplied by 3 major players which are Chev-ron, Lubrizol and Shell. Even in the rising Base oil price environment we expect the strong brand com-panies to easily pass on raw material price hike due to strong pricing power these companies enjoy in baazar segment. This phenomenon is evident from fact the that Gulf was able to increase its prices in baazar segment by 3% in November immediately after de-monetization and company was even able to post higher volume growth (5.5% vs 2%)than its peers.
11
Source: BP Equities Research
1000
14001150 1080
760625 588 701 720
80
111 112 10999
5247
57 60
0
200
400
600
800
1000
1200
1400
1600
0
20
40
60
80
100
120
CY10 CY11 CY12 CY13 CY14 CY15 CY16 CY17E CY18E
Base oil($/mt) Brent Crude($/ballel
45.7 46.7
53.5
58.561
64.267
69 70
40
45
50
55
60
65
70
75
80
CY10 CY11 CY12 CY13 CY14 CY15 CY16 CY17E CY18E
We expect base oil prices to trade with upward bias and expect further weakening of rupee
Margin trend for major lubricant companies across cycles
5.37.8
9.7 8.6
12.8 12.7 12.8 12.6 13.615.915.8
17
22.123.8
20.918.5
20.118.4
23.7
28.5
0
5
10
15
20
25
30
FY07 FY08 FY09 FY10 FY11 FY12 FY13 FY14 FY15 FY16
Gulf Castrol
104121 127
135142
134 133148
156
0
20
40
60
80
100
120
140
160
180
FY11 FY12 FY13 FY14 FY15 FY16 FY17E FY18E FY19E
Gross realizations(Rs/ltr)
Gulf has been able to improve its pricing historically
Source: BP Equities Research
Gulf Oil Lubricants India Ltd Initiating Coverage
Institutional Research BP Equities Pvt. Limited (www.bpwealth.com) 17/03/2017
B P W E A L T H
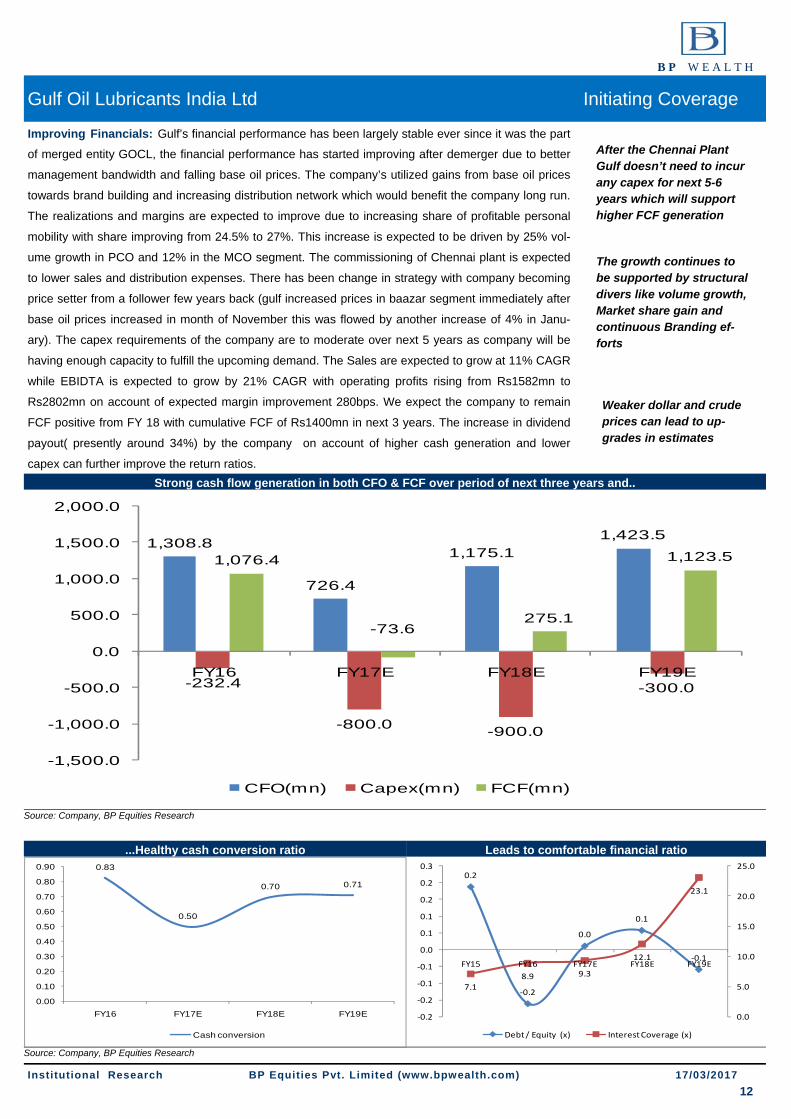
Improving Financials: Gulf’s financial performance has been largely stable ever since it was the part
of merged entity GOCL, the financial performance has started improving after demerger due to better
management bandwidth and falling base oil prices. The company’s utilized gains from base oil prices
towards brand building and increasing distribution network which would benefit the company long run.
The realizations and margins are expected to improve due to increasing share of profitable personal
mobility with share improving from 24.5% to 27%. This increase is expected to be driven by 25% vol-
ume growth in PCO and 12% in the MCO segment. The commissioning of Chennai plant is expected
to lower sales and distribution expenses. There has been change in strategy with company becoming
price setter from a follower few years back (gulf increased prices in baazar segment immediately after
base oil prices increased in month of November this was flowed by another increase of 4% in Janu-
ary). The capex requirements of the company are to moderate over next 5 years as company will be
having enough capacity to fulfill the upcoming demand. The Sales are expected to grow at 11% CAGR
while EBIDTA is expected to grow by 21% CAGR with operating profits rising from Rs1582mn to
Rs2802mn on account of expected margin improvement 280bps. We expect the company to remain
FCF positive from FY 18 with cumulative FCF of Rs1400mn in next 3 years. The increase in dividend
payout( presently around 34%) by the company on account of higher cash generation and lower
capex can further improve the return ratios. Strong cash flow generation in both CFO & FCF over period of next three years and..
12
Source: Company, BP Equities Research
...Healthy cash conversion ratio Leads to comfortable financial ratio
Source: Company, BP Equities Research
0.2
‐0.2
0.0
0.1
‐0.1
7.18.9 9.3
12.1
23.1
0.0
5.0
10.0
15.0
20.0
25.0
‐0.2
‐0.2
‐0.1
‐0.1
0.0
0.1
0.1
0.2
0.2
0.3
FY15 FY16 FY17E FY18E FY19E
Debt / Equity (x) Interest Coverage (x)
0.83
0.50
0.70 0.71
0.00
0.10
0.20
0.30
0.40
0.50
0.60
0.70
0.80
0.90
FY16 FY17E FY18E FY19E
Cash conversion
After the Chennai Plant Gulf doesn’t need to incur any capex for next 5-6 years which will support higher FCF generation
The growth continues to be supported by structural divers like volume growth, Market share gain and continuous Branding ef-forts
1,308.8
726.4
1,175.11,423.5
-232.4
-800.0 -900.0
-300.0
1,076.4
-73.6275.1
1,123.5
-1,500.0
-1,000.0
-500.0
0.0
500.0
1,000.0
1,500.0
2,000.0
FY16 FY17E FY18E FY19E
CFO(mn) Capex(mn) FCF(mn)
Weaker dollar and crude prices can lead to up-grades in estimates
Gulf Oil Lubricants India Ltd Initiating Coverage
Institutional Research BP Equities Pvt. Limited (www.bpwealth.com) 17/03/2017
B P W E A L T H
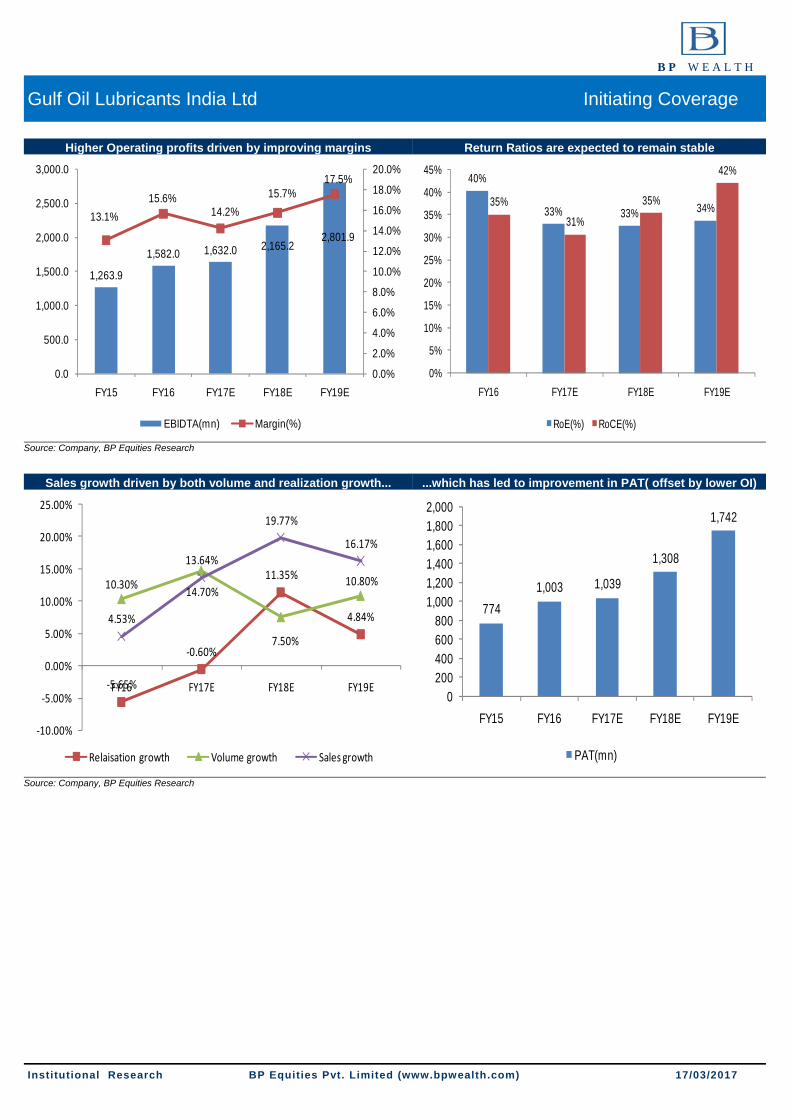
40%
33% 33% 34%35%
31%
35%
42%
0%
5%
10%
15%
20%
25%
30%
35%
40%
45%
FY16 FY17E FY18E FY19E
RoE(%) RoCE(%)
Higher Operating profits driven by improving margins Return Ratios are expected to remain stable
‐5.65%
‐0.60%
11.35%
4.84%
10.30% 14.70%
7.50%
10.80%
4.53%
13.64%
19.77%
16.17%
‐10.00%
‐5.00%
0.00%
5.00%
10.00%
15.00%
20.00%
25.00%
FY16 FY17E FY18E FY19E
Relaisation growth Volume growth Sales growth
7741,003 1,039
1,308
1,742
0200400600800
1,0001,2001,4001,6001,8002,000
FY15 FY16 FY17E FY18E FY19E
PAT(mn)
Sales growth driven by both volume and realization growth... ...which has led to improvement in PAT( offset by lower OI)
1,263.9
1,582.0 1,632.0 2,165.22,801.9
13.1%15.6%
14.2%15.7%
17.5%
0.0%
2.0%
4.0%
6.0%
8.0%
10.0%
12.0%
14.0%
16.0%
18.0%
20.0%
0.0
500.0
1,000.0
1,500.0
2,000.0
2,500.0
3,000.0
FY15 FY16 FY17E FY18E FY19E
EBIDTA(mn) Margin(%)
Source: Company, BP Equities Research
Source: Company, BP Equities Research

Gulf Oil Lubricants India Ltd Initiating Coverage
Institutional Research BP Equities Pvt. Limited (www.bpwealth.com) 17/03/2017
B P W E A L T H
Company Background
Gulf Oil Lubricants India Ltd is 68.7% owned by Gulf Oil International, which is a Hinduja group com-pany. The brand Gulf was acquired from Chevron in 1980 and the parent company has rights in all countries except Portugal, Spain, and USA. Gulf has been present in India since 1920. Previously, the lubricant business was part of Gulf Oil Corporation. It was demerged as a pure play lubricant company in CY14 with separate financial statements available from FY15. The company is having one manufac-turing facility in Silvasa with production capacity 95,000 Kilo-ltrs and one upcoming facility in Chennai with capacity of 40,000 kilo-ltrs. Gulf is having sales mix of 80:20 for automotive and industrial seg-ments respectively with strong presence in southern markets which partly due to the Ashok Leyland legacy. The company is having 55,000 retailers across the country spread across spare-part shops, lube shops, Dealers etc. Gulf has over 7% share in baazar segment with 8% in CVs, 9% in MC/2W, 4.5% in PCMO and 5% in tractors.
Gulf oil lubricants derives maximum revenues share from DEO segment (diesel engine oil) contributing 45% followed by MCO/2W segment (motorcycle) contributing 20%, Industrial grades contribute 14% and PCMO contributes 5%.
The company supplies wide range of oils like Engine oil, Gear Oil, Transmission oil and motor oil for automotive industry. Through parentage of Gulf oil international the company has access to new tech-nology and products. Gulf also trades in batteries and greases which contribute 4% to total sales
13
Key Brands of Gulf
Gulf Superfleet for CVs
Gulf Pride 4T Plus for 2Ws
Gulf Pride Scooter
Gulf Ultrasynth X for 4W
Gulf Max Suppreme 20W-50
Gulf XHD Supreme 15W-40 for Tractors
Gulf Harmony for Industrial applications
Gulf CNG supreme for 3W
Gulf Marine for shipping ap-plications
Source: Company, BP Equities Research
Source: Company, BP Equities Research
8%
5%
9%
4.50%
0%1%2%3%4%5%6%7%8%9%
10%
Commercial vehicles
Tractors Motorcycles & scooters
Passenger vehciles
Market share(%)
45%
20%4.50%
13.5%
17%
DEO/CVO MCO/2W PCMO
Industial grades others
21%
35%7%
7%
30%
Castrol OMCs Tide water Gulf Others
Market share of Gulf across various segments
Segment wise contribution to sales Gulf’s market share in Baazar segment

Gulf Oil Lubricants India Ltd Initiating Coverage
Institutional Research BP Equities Pvt. Limited (www.bpwealth.com) 17/03/2017
B P W E A L T H
Plant details: Presently these is only one plant operational at Silvassa while one facility upcoming in Chennai with capacity of 50,000 KL ton.
Key Milestones:
Management details
14
Source: Company, BP Equities Research
Source: Company, BP Equities Research
Plants Capacity Remark
Silvassa 95000mnT The capacity is calculated on basis of plant working in 2.5 shifts per day
Chennai 50000Mnt This is plant is expected to start commercial operations by Oct-2017
Date Events 2014-Jun Gulf Oil Lubricants listed on NSE & BSE
2015-Jan Silvassa Capacity increased to 95 KL ton
2015-Mar Tie-up with Schwing Stetter for co-branded oils
2015-Dec Launches "Ultrasynth X" for mid size cars
2016-Oct Tie-up with Bajaj Auto for MCO
2017-Feb 600mn spend on Chennai Plant till date
Name Designa- Decription
Sanjay Hinduja Chairman
Mr. Sanjay G. Hinduja holds a Bachelors degree in Business Administra-tion from Richmond College, London. He has professional experience with Credit Suisse Bank and Chase Manhattan Bank and has experience and knowledge in the global oil and energy sector
Ravi Chawla MD
Mr. Ravi Chawla holds a Bachelors Degree in Commerce from Sydenham College, Mumbai University. He also holds a Master in Management Stud-ies degree (specialising in Marketing) from Mumbai University.He has held positions responsible for all areas of marketing, business development, sales via channel & B2B & general management for the last 20 years with India level responsibility. He has extensive experience of over 15 years in the lubricants space with Pennzoil (1998 to 2006) & in Gulf Oil (since 2007).
Manish Gangwal CFO Mr.Manish Gangwal hold Bachelors degree in Commerce from St.Xaviers. He also is charted accountant from ICAI and cost accountant from ICWAI. He is working with Gulf since 2008

Gulf Oil Lubricants India Ltd Initiating Coverage
Institutional Research BP Equities Pvt. Limited (www.bpwealth.com) 17/03/2017
B P W E A L T H
15
Source: Company, BP Equities Research
Source: Company, BP Equities Research

Gulf Oil Lubricants India Ltd Initiating Coverage
Institutional Research BP Equities Pvt. Limited (www.bpwealth.com) 17/03/2017
B P W E A L T H
⇒ Peer group comparison
⇒ EV/EBITDA chart
17
Source: BP Equities Research (* Castrol India estimates are for CY17 and CY18)
Source: BP Equities, Ace Equity
PE Band - Gulf Oil Lubricants India Ltd.
200.00
300.00
400.00
500.00
600.00
700.00
800.00
900.00
Price 18x 25x 30x 35x
Company CMP M Cap P/E EPS EV/EBITDA RoE (%)
(Rs.) (Rs. Bn) FY18E FY19E FY18E FY19E FY18E FY19E FY18E FY19E
Gulf oil Lubricants 704 58.4 26.7 20.0 26.4 35.2 16.3 12.4 32.6 34.8
Castrol India ltd 422 208.8 28.9 26.9 14.6 15.7 20.0 18.4 106.0 105.0

Gulf Oil Lubricants India Ltd Initiating Coverage
Institutional Research BP Equities Pvt. Limited (www.bpwealth.com) 17/03/2017
B P W E A L T H
Valuation and Outlook: At the present price of Gulf oil lubricants trades at 20 times for FY19E EPS of Rs35.2, the share price and multiples have expanded in last two years on back of re-rating and margins benefits derived on account of fall in base oil prices. We expect company’s PAT to expand at 20.2% CAGR from FY16 to FY19 on account 11.2% CAGR in volumes, increasing contribution from personal mobility segment and cost saving from Chennai plant. We value Gulf at 10% discount to Cas-trol’s valuation due superior brand recall, negative working capital and higher distribution network but in volume growth Castrol lags behind gulf by significant margin and volume are one of driving factors for higher profits. Hence we value Gulf at 25 times(10% discount to Castrol) its estimated FY19 and assign target price of Rs 879. The view is expected to remain cautious in near tem as full impact of higher base price is expected to hit margin in Q4 of this financial year and Q1 of next financial year but we expect company to pass on hikes completely in all trade channels.
Key Risks and concerns: ⇒ Adverse movement in crude oil prices can affect profitability of the company as raw material cost
constitutes 50% of its sales.
⇒ Aggressive pricing by competitors can affect both volume as well as margins.
⇒ Further increase in drain cycles can act as structural dampener to volumes.
⇒ Delayed economic recovery can affect the volumes both in baazar as well as OEM segment.
⇒ Electric vehicles will act as structural negative for lubricant industry.
⇒ Gulf is net importer as major portion of raw material is imported and also the company is paying Royalty in dollars, in case of adverse movement in currency can impact the P&L.
18
Source: BP Equities Research
Lubricant companies com-mand the valuation of con-
sumer companies due to simi-lar nature of business like as-
set light model, strong brands, high dividend payout
Valuation Basis FY16 FY17 FY18 FY19 Gulf oil Lubricants India ltd EPS 16 20.2 21.0 26.4 35.2 Growth in EPS (YoY %) 30% 4% 26% 33% Implied PE 35 34 27 20 Assigned PE (25x PE) 25 25 25 25 Target Price 506 524 660 879 CMP 704 704 704 704 Upside Potential (%) 25%

Gulf Oil Lubricants India Ltd Initiating Coverage
Institutional Research BP Equities Pvt. Limited (www.bpwealth.com) 17/03/2017
B P W E A L T H
19
Source: Company, BP Equities Research
Source: Company, BP Equities Research
Profit & Loss A/c ( Standalone) YE March (Rs. mn) FY16 FY17E FY18E FY19E Net Sales 10,114 11,494 13,766 15,992 Growth % 4.5% 13.6% 19.8% 16.2% Total Operating Revenue 10,114 11,494 13,766 15,992 Growth % 4.5% 13.6% 19.8% 16.2% Less: Raw Material Consumed 5,058 5,966 7,335 8,488 Employee Cost 574 679 780 912 Other Expenses 3,052 3,193 3,506 3,811 Total Operating Expenditure 8,532 9,838 11,620 13,210 EBIDTA 1,582 1,655 2,145 2,782 Growth % 25.2% 4.6% 29.6% 29.7% Less: Depreciation 60 93 130 142 EBIT 1,522 1,562 2,015 2,640 Growth % 25.2% 2.7% 29.0% 31.0% Interest Paid 178 178 178 121 Non-operating Income 189 190 144 120 Profit Before tax 1,533 1,574 1,981 2,639 Tax 529 535 674 897 Net Profit before Minority 1,003 1,039 1,308 1,742 Minority Interest 0 0 0 0 Net Profit 1,003 1,039 1,308 1,742 Adjusted Profit 1,003 1,039 1,308 1,742 Reported Diluted EPS Rs 20.2 21.0 26.4 35.2 Growth % 29.6% 3.6% 25.8% 33.2% Adjusted Diluted EPS Rs 20.2 21.0 26.4 35.2 Growth % 29.6% 3.6% 25.8% 33.2%
Common Sized Profit & Loss Account ( Standalone) YE March (Rs. mn) FY16 FY17E FY18E FY19E Total Revenues 100.0% 100.0% 100.0% 100.0%
Less: Raw Material Consumed 50.0% 51.9% 53.3% 53.1% Employee Cost 5.7% 5.9% 5.7% 5.7% Other Expenses 30.2% 27.8% 25.5% 23.8% Total Operating Expenditure 84.4% 85.6% 84.4% 82.6% EBIDTA 15.6% 14.4% 15.6% 17.4% Depreciation 0.6% 0.8% 0.9% 0.9% Interest Paid 1.8% 1.5% 1.3% 0.8% Non-operating Income 1.9% 1.7% 1.0% 0.8% Extraordinary Items 0.0% 0.0% 0.0% 0.0% Profit Before Tax 15.2% 13.7% 14.4% 16.5% Current tax 0.0% 0.0% 0.0% 0.0%
Profit/Loss of Associate Company 0.0% 0.0% 0.0% 0.0% Profit After Tax 9.9% 9.0% 9.5% 10.9% Adjusted Profit 9.9% 9.0% 9.5% 10.9%

Gulf Oil Lubricants India Ltd Initiating Coverage
Institutional Research BP Equities Pvt. Limited (www.bpwealth.com) 17/03/2017
B P W E A L T H
20
Source: Company, BP Equities Research
Cash Flows (Standalone) YE March (Rs. Mn) FY16 FY17E FY18E FY19E PAT 1,003.1 1,039.1 1,307.7 1,741.8 Less: Non Operating Income (188.9) (190.0) (144.0) (120.0) Add: Depreciation 60.4 93.0 129.9 142.2 Add: Interest Paid 177.9 177.5 177.9 120.6 Operating Profit before Working Capital Changes 1,052.5 1,119.7 1,471.5 1,884.6 (Inc)/Dec in Current Assets (510.9) (565.9) (495.0) (686.7) Inc/(Dec) in Current Liabilities 920.1 401.7 611.0 573.0 Changes in Inventory (153.0) (229.1) (412.4) (347.5) Net Cash Generated From Operations 1,308.8 726.4 1,175.1 1,423.5 Cash Flow from Investing Activities (Inc)/Dec in Fixed Assets (232.4) (800.0) (900.0) (300.0) (Inc)/Dec in Capital Work In Progress 65.2 (15.5) (6.8) (6.7) (Inc)/Dec in Investment (Strategic) 0.0 0.0 0.0 0.0 (Inc)/Dec in Investment (Others) (15.9) 0.0 0.0 0.0 Add: Non Operating Income Income 188.9 190.0 144.0 120.0 Net Cash Flow from/(used in) Investing Activities 5.9 (625.5) (762.8) (186.7) Cash Flow from Financing Activities 0.0 0.0 0.0 0.0 Inc/(Dec) in Total Loans (196.2) 223.7 (191.2) (591.6) Inc/(Dec) in Reserves & Surplus (70.6) 0.0 0.0 0.0 Inc/(Dec) in Equity 28.8 (28.8) 0.0 0.0 Dividend Paid (347.0) (346.9) (446.0) (594.6) Less: Interest Paid (177.9) (177.5) (177.9) (120.6) Adjustments (5.5) (0.0) 0.0 0.0 Net Cash Flow from Financing Activities (768.4) (329.6) (815.1) (1,306.8) Net Inc/Dec in cash equivalents 546.3 (228.7) (402.7) (70.0) Opening Balance 1,804.4 2,350.7 2,122.0 1,719.2 Closing Balance Cash and Cash Equivalents 2,350.7 2,122.0 1,719.2 1,649.2

Gulf Oil Lubricants India Ltd Initiating Coverage
Institutional Research BP Equities Pvt. Limited (www.bpwealth.com) 17/03/2017
B P W E A L T H
21
Source: Company, BP Equities Research
Balance Sheet ( Standalone) YE March( Rs. mn) FY16 FY17E FY18E CY19E Liabilities Equity Capital 99 99 99 99 Share application money pending allotment 29 0 0 0 Reserves & Surplus 2,357 3,050 3,911 5,059 Equity 2,485 3,149 4,011 5,158 Preference Share Capital 0 0 0 0 Net Worth 2,485 3,149 4,011 5,158 Minority Interest Net Deferred tax liability/(Asset) 64 80 96 112 Total Loans 1,947 2,154 1,947 1,340 Capital Employed 4,496 5,384 6,054 6,610 Assets Gross Block 1,469 2,269 3,169 3,469 Less: Depreciation 400 493 623 765 Net Block 1,069 1,776 2,546 2,704 Capital WIP 19 34 41 48 Long Term Loans & Advances 117 117 117 117 Non Current Investments 0 0 0 0 Current Assets Inventories 1,569 1,798 2,210 2,558 Sundry Debtors 1,064 1,417 1,509 1,753 Cash and Bank Balance 2,351 2,122 1,719 1,649 Loans and Advances 1,073 1,264 1,652 2,079 Other Current Assets 59 80 96 112 Total Current Assets 6,115 6,682 7,186 8,151 Less:Current Liabilities & Provisions Sundry Creditors 1,310 1,617 1,910 2,172 Provisions 1,123 1,149 1,377 1,599 Other Current Liabilities 392 460 551 640 Total Current Liabilities & Provisions 2,825 3,226 3,837 4,410 Capital Applied 4,496 5,384 6,054 6,610
Gulf Oil Lubricants India Ltd Initiating Coverage
Institutional Research BP Equities Pvt. Limited (www.bpwealth.com) 17/03/2017
B P W E A L T H
22
Source: Company, BP Equities Research
Source: Company, BP Equities Research
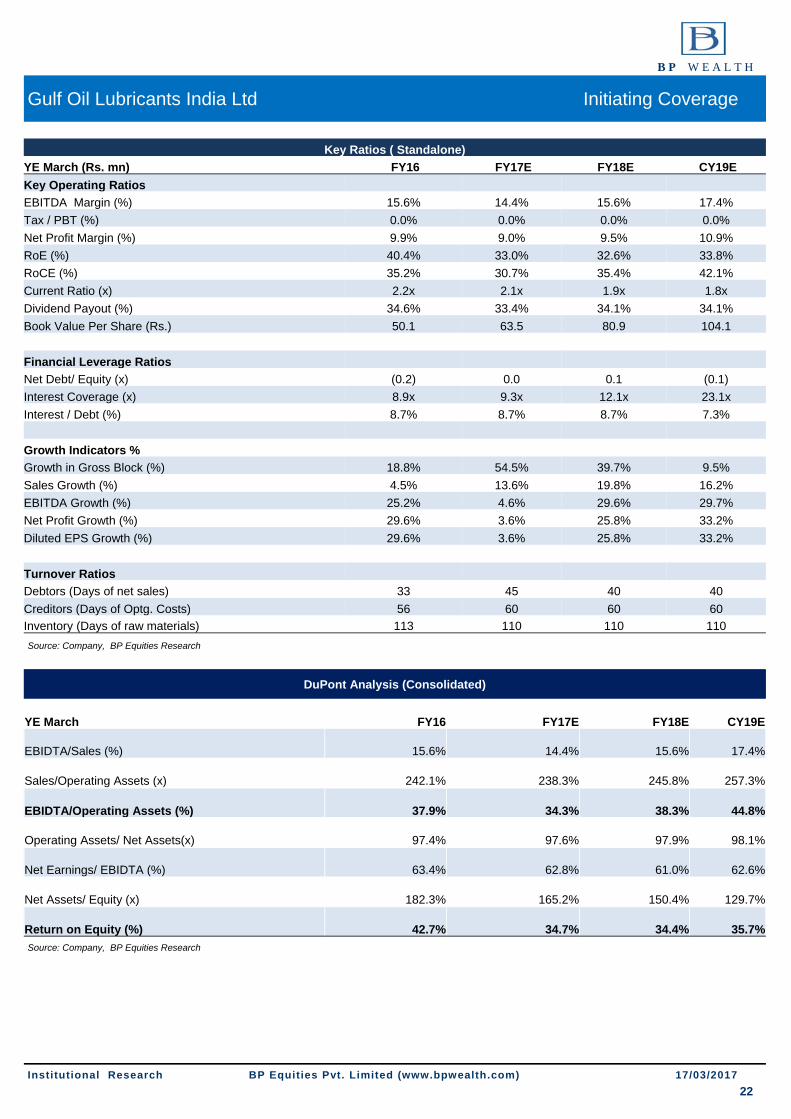
Key Ratios ( Standalone) YE March (Rs. mn) FY16 FY17E FY18E CY19E Key Operating Ratios EBITDA Margin (%) 15.6% 14.4% 15.6% 17.4% Tax / PBT (%) 0.0% 0.0% 0.0% 0.0% Net Profit Margin (%) 9.9% 9.0% 9.5% 10.9% RoE (%) 40.4% 33.0% 32.6% 33.8% RoCE (%) 35.2% 30.7% 35.4% 42.1% Current Ratio (x) 2.2x 2.1x 1.9x 1.8x Dividend Payout (%) 34.6% 33.4% 34.1% 34.1% Book Value Per Share (Rs.) 50.1 63.5 80.9 104.1 Financial Leverage Ratios Net Debt/ Equity (x) (0.2) 0.0 0.1 (0.1) Interest Coverage (x) 8.9x 9.3x 12.1x 23.1x Interest / Debt (%) 8.7% 8.7% 8.7% 7.3% Growth Indicators % Growth in Gross Block (%) 18.8% 54.5% 39.7% 9.5% Sales Growth (%) 4.5% 13.6% 19.8% 16.2% EBITDA Growth (%) 25.2% 4.6% 29.6% 29.7% Net Profit Growth (%) 29.6% 3.6% 25.8% 33.2% Diluted EPS Growth (%) 29.6% 3.6% 25.8% 33.2% Turnover Ratios Debtors (Days of net sales) 33 45 40 40 Creditors (Days of Optg. Costs) 56 60 60 60 Inventory (Days of raw materials) 113 110 110 110
DuPont Analysis (Consolidated)
YE March FY16 FY17E FY18E CY19E
EBIDTA/Sales (%) 15.6% 14.4% 15.6% 17.4%
Sales/Operating Assets (x) 242.1% 238.3% 245.8% 257.3%
EBIDTA/Operating Assets (%) 37.9% 34.3% 38.3% 44.8%
Operating Assets/ Net Assets(x) 97.4% 97.6% 97.9% 98.1%
Net Earnings/ EBIDTA (%) 63.4% 62.8% 61.0% 62.6%
Net Assets/ Equity (x) 182.3% 165.2% 150.4% 129.7%
Return on Equity (%) 42.7% 34.7% 34.4% 35.7%

Research Desk Tel: +91 22 61596464
Disclaimer Appendix
General Disclaimer
This report has been prepared by the research department of BP EQUITIES Pvt. Ltd, is for information purposes only. This report is not construed as an offer to sell or the solicitation of an offer to buy or sell any security in any jurisdiction where such an offer or solicitation would be illegal.
BP EQUITIES Pvt. Ltd have exercised due diligence in checking the correctness and authenticity of the information contained herein, so far as it relates to current and historical information, but do not guarantee its accuracy or completeness. The opinions expressed are our current opinions as of the date appearing in the material and may be subject to change from time to time. Prospective investors are cau-tioned that any forward looking statement are not predictions and are subject to change without prior notice.
Recipients of this material should rely on their own investigations and take their own professional advice. BP Equities or any of its affiliates or employees shall not be in any way responsible for any loss or damage that may arise to any person from any inadvertent error in the information contained in this report. BP EQUITIES Pvt. Ltd. or any of its affiliates or employees do not provide, at any time, any express or implied warranty of any kind, regarding any matter pertaining to this report, including without limitation the implied warranties of merchant-ability, fitness for a particular purpose, and non-infringement. The recipients of this report should rely on their own investigations.
BP Wealth and/or its affiliates and/or employees may have interests/ positions, financial or otherwise in the securities mentioned in this report. Opinions expressed are our current opinions as of the date appearing on this material only. While we endeavor to update on a rea-sonable basis the information discussed in this material, there may be regulatory, compliance, or other reasons that prevent us from doing so.
This report is not directed to or intended for display, downloading, printing, reproducing or for distribution to or use by any person in any locality, state and country or other jurisdiction where such distribution, publication or use would be contrary to the law or regulation or would subject to BP Equities or any of its affiliates to any registration or licensing requirement within such jurisdiction.
Institutional Sales Desk Tel: +91 22 61596403/04/05
Analyst (s) Certification:
We analysts and the authors of this report, hereby certify that all of the views expressed in this research report accurately reflect our per-sonal views about any and all of the subject issuer (s) or securities. We also certify that no part of our compensation was, is, or will be directly or indirectly related to the specific recommendation (s) or view (s) in this report. Analysts aren't registered as research analysts by
Analyst (s) holding in the Stock : Nil
B P W E A LT H
Corporate Office: 4th floor, Rustom Bldg, 29, Veer Nariman Road, Fort, Mumbai-400001 Phone- +91 22 6159 6464 Fax-+91 22 6159 6160 Website- www.bpwealth.com
Registered Office: 24/26, 1st Floor, Cama Building, Dalal street, Fort, Mumbai-400001
BP Equities Pvt. Ltd. CIN No: U67120MH1997PTC107392