botflowmon: identify social bot traffic with …
TRANSCRIPT

BOTFLOWMON: IDENTIFY SOCIAL BOT TRAFFIC WITH NETFLOW AND
MACHINE LEARNING
by
YEBO FENG
A THESIS
Presented to the Department of Computer and Information Science and the Graduate School of the University of Oregon
in partial fulfillment of the requirements for the degree of
Master of Science
June 2018

ii
THESIS APPROVAL PAGE Student: Yebo Feng Title: BotFlowMon: Identify Social Bot Traffic with NetFlow and Machine Learning This thesis has been accepted and approved in partial fulfillment of the requirements for the Master of Science degree in the Department of Computer and Information Science by: Jun Li Chairperson Ramakrishnan Durairajan Member Lei Jiao Member and Sara D. Hodges Interim Vice Provost and Dean of the Graduate School Original approval signatures are on file with the University of Oregon Graduate School. Degree awarded June 2018

iii
© 2018 Yebo Feng This work is licensed under a Creative Commons
Attribution-NonCommercial-ShareAlike (United States) License.

iv
THESIS ABSTRACT Yebo Feng Master of Science Department of Computer and Information Science June 2018 Title: BotFlowMon: Identify Social Bot Traffic with NetFlow and Machine Learning
With the rapid development of online social networks (OSN), maintaining the
security of social media ecosystems becomes dramatically important for public. Among
all the security threats in OSN, malicious social bot is the most common risk factor.
This paper puts forward a detection method called BotFlowMon that only utilize
NetFlow data to identify OSN bot traffic. The detection procedure takes the raw NetFlow
data as input and use DBSCAN algorithm to aggregate related flows into transaction
level data. Then a special data fusion technique along with a visualization method are
proposed to extract features, normalize values and help analyzing flows. A new clustering
algorithm called Clustering Based on Density Sort and Valley Point Competition is also
designed to subdivide transactions into basic operations. After the above preprocessing
steps, some classic machine learning algorithms are applied to construct the classification
model.

v
CURRICULUM VITAE NAME OF AUTHOR: Yebo Feng GRADUATE AND UNDERGRADUATE SCHOOLS ATTENDED: University of Oregon, Eugene, United States Yangzhou University, Yangzhou, China AREAS OF SPECIAL INTEREST: Data Science Machine Learning Network and Security PROFESSIONAL EXPERIENCE: UO Graduate Research Assistant, Jun 16, 2017 to Sep 15, 2017 UO Graduate Teaching Fellowship, Sep 16, 2017 to June 15, 2018

vi
ACKNOWLEDGMENTS
I wish to express sincere appreciation to Professors Lei and Ramakrishnan for their
assistance in the preparation of this manuscript. I gratefully appreciate my advisor Prof. Jun
Li’s contributions of time, ideas, and funding to make my master experience productive
and stimulating. Also, I want to give thanks to my parents, who rendered me kind help
when I felt depressed.
Lastly, thanks to all my friends and faculties in University of Oregon, who gave me
supports, happiness and precious memories in the last two years.

vii
TABLE OF CONTENTS
Chapter Page I. INTRODUCTION .................................................................................................... 01
II. RELATED WORK ................................................................................................. 03
Content-Based Approach ....................................................................................... 03
Topology-Based Approach .................................................................................... 04
CrowdSourcing-Based Approach .......................................................................... 04
III. DATA SOURCE .................................................................................................... 06
Chat Bot ................................................................................................................. 07
Poster Bot ............................................................................................................... 08
Amplification Bot .................................................................................................. 08
OSN Crawler .......................................................................................................... 09
IV. BOTFLOWMON SCHEMA ................................................................................. 11
Preprocessing ......................................................................................................... 12
Aggregation............................................................................................................ 13
Flow Fingerprint Generation.................................................................................. 14
Flow Subdivision ................................................................................................... 19
Density ............................................................................................................. 20
Potential Point .................................................................................................. 21
Valley Point ..................................................................................................... 21
Valley Point Competition ................................................................................ 21
Machine Learning .................................................................................................. 22
V. EVALUATION ....................................................................................................... 24

viii
Chapter Page
VI. CONCLUSION...................................................................................................... 29
REFERENCES CITED ................................................................................................ 30

ix
LIST OF FIGURES Figure Page 1. Flow chart for BotFlowMon .................................................................................. 11 2. Quantile to Quantile plot of NetFlow size and Number of Packets ....................... 17 3. Quantile to Quantile plot of TOS ........................................................................... 17
4. A transaction lasting for 35.74s, containing 220 NetFlows. .................................. 18
5. More Flow Fingerprint examples........................................................................... 19
6. Subdivision example .............................................................................................. 22
7. Purity scores with different r values ...................................................................... 25
8. Scatter Diagram for Subdivision ............................................................................ 26
9. Result for 6*200 matrix version ............................................................................ 27
10. Result for 4*200 matrix version ............................................................................ 27

x
LIST OF TABLES Table Page 1. Configuration of NetFlow ...................................................................................... 06 2. Configuration of Flow Fingerprint matri ............................................................... 15 3. Detailed results for CNN ....................................................................................... 27

1
CHAPTER I
INTRODUCTION
The definition of online social networks (OSN) encompasses networking for
business, pleasure, and all points in between. Over the past decades, we have witnessed
the rapid expansion of OSN. Based on the statistics from Q1 2018, Facebook achieved
more than 2.196 billion active users around the world, and twitter also reached 336
million.
With such a boom, the security of OSN becomes a severe problem worthy of our
concern. OSNs are increasingly threatened by social bots (E Ferrara, 2016), which are
software-controlled social accounts and visitors that mimic human users or crawl for
private data with abnormal intentions (J Zhang, 2016). In fact, not all the social bots are
malicious, lots of companies and institution use bots for customer service and
information spreading. However, there have been reports on various attacks, abuses, and
manipulations based on social bots (E Ferrara, 2015), such as infiltrating Facebook (Y
Boshmaf, 2011) or Twitter (L Bilge, 2009), launching spam campaign (H Gao, 2010),
performing financial fraud and conducting political astroturf (J Ratkiewicz, 2011).
The Existing works to detect bots on OSNs need to utilize the network topology,
private data in payload or account activity histories, which is sensitive and might violate
privacy. In this paper, a new detection method called BotFlowMon is proposed that inputs
flow level data such as Cisco's NetFlow (B Claise, 2004) to differentiate social bots
traffic from legitimate (human) traffic. From NetFlow data, we can just get low volume,
coarse-grained, non-application specific data (R Sommer, 2002) and cannot touch the
sensitive payload information, making this approach privacy-preserving and can be

2
deployed by telecommunications companies like AT&T and Xfinity, also adds challenges
to detection procedure. While with the help of some data fusion and machine learning
techniques, it is possible to identify social bot traffic in such scenario.
This BotFlowMon system uses labeled NetFlow data (social bot traffic versus
legitimate traffic) as ground truth and utilize four important modules to perform the
classification. (1) The aggregation module transfers the raw NetFlow data into transaction
level dataset to make the characteristics obvious for detection. (2) Flow fingerprint
generation module extract features from transaction level dataset and normalize the
features into matrix. In this step, a flow fingerprint visualization method is also
developed to help analysis. (3) The subdivision module cut each transaction into more
basic operations, which accelerates the learning model to converge and reduce the data
volume requirement for training. (4) Machine learning module, takes the preprocessed
data as input to construct a classification model and achieves satisfactory accuracy.

3
CHAPTER II
RELATED WORK
In order to maintain secure and harmonious online social environments for public
users, network security community has been developing innovative techniques to identify
bot users effectively. According to the different kinds of data the techniques require, we
can generally classify the detection approaches into three categories: (A) content-based
detection approaches, (B) detection methods based on OSN topology, (C) approaches
require crowdsourcing on posts and profile analysis (A Karataş, 2011). There are some
other approaches that may be the mixture of these three categories. No doubt, they have
great performances on identifying specific types of OSN bots, but to a certain degree, the
sensitive data they require to utilize intrude upon users' privacy, making these approaches
difficult to be extensively used.
Content-Based Approach
The key idea of content-based bot detection method is to observe the differences
between human being and bot in terms of tweet contents, activity histories and linguistic
features. Nowadays, big data is exploding as more and more information is collected and
stored, it becomes much easier to fetch massive labeled data from ISPs. Meanwhile,
benefitting from rapid development of machine learning, nature language processing and
semantic analysis, constructing a classification model to classify bots becomes very
efficacious. Lots of great content-based detection approaches have been proposed:
"BotOrNot" (CA Davis, 2016), as the first social bot detection framework publicly
available for Twitter, analyzed 15k manually verified social bots and 16k legitimate

4
accounts and achieved 86\% accuracy; SentiBot (JP Dickerson, 2014), relies on tweet
syntax, semantics and user behaviors to distinguish human and social bots.
The limitations of this approach are that large volume of high-quality labeled
social data is required for the analysis process and the collection of the data needs to be
carefully performed to avoid invasion of privacy. Moreover, as bots are becoming more
and more sophisticated by using AI powered techniques, this approach is facing
unprecedented challenges.
Topology-Based Approach
Approaches based on topology (social network structure) focus on detecting
amplification bots and Sybil account. For these attacks, multiple accounts are controlled
by one master, so we can assume that these malicious accounts are connected to each
other and have some similar attributes. Once the topology structure of the network is
acknowledged, some methods like Random Walk, Bayesian Network and Loopy Belief
Propagation can be applied to identify malicious accounts. In 2009, SybilInfer (G
Danezis, 2009) utilizes the combination of Bayesian inference and Monte-Carlo sampling
techniques to estimate the set of legitimate and Sybil accounts; Sybilbelief (NZ Gong,
2014), identifies Sybil nodes with low false positive rates and low false negative rates by
using Markov Random Field and Belief Propagation.
CrowdSourcing-Based Approach
As crowdsourcing is becoming a valuable method for companies and researchers
to measure scores for tasks, some bot detection schemas based on crowdsourcing have
been put forward. In 2012, Gang Wang (G Wang, 2012) constructed a two-layered bot
detection system containing filtering and crowdsourcing layer. The leverage of this

5
strategy faces two fundamental issues. First, it is hard to manage security and privacy
issues, strict policy should be implemented when sharing the information with the crowd
to prevent privacy leaks. Second, it is expensive to keep the system running both duo to
the high running time cost of the crowd and cost of crowd workforce.

6
CHAPTER III
DATA SOURCE
NetFlow is a feature that was introduced on Cisco routers that provides the ability
to collect IP network traffic as it enters or exits an interface. Initially, it is invented for
monitoring overall network traffic, so the information we can leverage from NetFlow is
very basic and limited, only contains partial attributes from the header of IP datagram.
The configuration of the NetFlow is shown in the table below:
Table 1
Configuration of NetFlow
Configuration of NetFlow Start Time Input Interface num End Time Output Interface num Duration Packets Protocol Bytes Source Address Flows Destination Address Packets Source Address Port TCP Flags Destination Address Port ToS Source Port bits per second Destination Port packets per second Source AS Bytes per package Destination AS
The datasets we use to construct and test BotFlowMon come from two sources:
traffic generated and gathered from our own computers and routers, which has superior
flexibility and conveniences for simulation and experiments; datasets generated and
collected from University of Oregon's campus traffic, although it is a relatively small ISP,
still offers realistic scenario verification tests.
For legitimate flows, no API related scripts can be used during the data creation
process, so we created and labeled the legitimate traffic flow by manually doing normal

7
daily operations on Twitter and Facebook. For social bot traffic, a variety of social bot
programs are used to perform bot activities on Twitter and Facebook. The traffic of them
are collected and labeled as the ground truth. In order to have a comprehensive social bot
simulation and fetch highly credible labeled data, we categorize the social bots to four
types by implementation mechanisms: (A) chat bot, the program or artificial intelligence
based script which conducts a conversation via auditory or textual methods; (B)poster
bot, automatically disseminates fraud information, spam and commercial promotions by
tweeting, posting and commenting; (C) amplification bot, massively amplifies certain
messages or conduct speculations by working as fake follower or forwarding robot; (D)
OSN crawler, a programmed spider that systematically browses and collect private data
for malicious intentions.
Chat Bot
Chat bots are very active on messaging applications such as Twitter DM,
Facebook Messenger or WeChat. They can be artificial intelligence powered or simply
logic-based programs that automatically perform conversations with normal users for
unusual purposes.
The simulation of this abnormal behavior relies on some widely used chat bot
frameworks, APIs and open-sourced programs such as botmaster (RS Wallace, 2003),
Ontbot (H AI-Zubaide, 2011) and python-twitter API. We created hundreds of Twitter
and Facebook accounts and performed these chat bot programs only for research purpose.
Multitudinous flow traffic of the conversations between human beings and these chat bots
are collected, with different frequencies, response times and transmission contents
(include images, audio files, texts and hyperlinks).

8
Poster Bot
Benefitting from easily used official and third-party APIs, poster bot becomes the
most common social bot in OSN. They have started to distribute spam tweets and
Facebook posts which can be broadly defined as unwanted that contains malicious URLs
in most cases or occasionally malicious texts (J Zhang, 2016) (C Grier, 2010). These
malicious URLs could cause financial, privacy losses to the users and pollute the social
network environment. According to a study in 2010 (C Grier, 2010), roughly 8% of the
URLs in tweets are malicious ones that direct users to scams, malware and phishing sites,
and about 0.13% of the spam URLs will be clicked.
In order to collect data for designing effective spam defenses, we wrote several
poster bot programs based on APIs such as Tweepy (J Roesslein, 2009) and Facebook
API (W Graham, 2008). We ran these bots program during different time periods to post
some harmless messages that contained textual contents, tiny videos, images and external
links on Twitter and Facebook. The related NetFlow traffic data in different activity rates
and network environments are collected to enrich the training dataset.
Amplification Bot
Amplification bot, benefits from its large volume, can be easily used to create
some heat topics for commercial purposes and defraudations. Without creating new
contents, amplification bots often work as fake followers, those Twitter or Facebook
accounts specifically created to inflate the number of followers of a target account. Fake
followers are dangerous for the social platform and beyond, since they may alter concepts
like popularity and influence in the Twittersphere, hence impacting on economy, politics,

9
and society (S Cresci, 2015). It also serves as forwarding and liking robot, popularizes
some unwanted junk information and helps commercial promotion.
From its operation mechanism, most amplification bots are sybil accounts,
powered by a large botnet and have one bot master to send commands. Since the social
topology is unknown in NetFlow data, we only need to simulate each amplification bot's
interactions with OSNs. OAuth (D Hardt, 2012) software is used for token management
and switching accounts. API-based bot scripts are also implemented for amplification bot
simulation.
OSN Crawler
OSNs such as Facebook and Twitter, contain valuable data about millions of users
that coveted by commercial institutions and fraudulent groups. The core functionality of
OSNs is enabling users to share slices of life, personal perspectives and profiles,
however, can be exploited by crawlers to aggregate data about large numbers of OSN
users for re-publication or other more nefarious purposes that violate users' privacy and
security.
There are two kinds of OSN crawlers in social networks. One is API-based, which
relies on a relative large botnet and to dig users' private sensitive date. Because in OSNs,
lots of users' information can only be seen by their friends, so a large amount of bots are
need to get access to privacy efficiently. Once the relationship is built, private data can be
easily fetched with basic API functions.
Another kind of OSN crawler is page crawler, instead of using API privileges, it
directly reads the HTML files of OSNs and utilize regular expression to extract target
information. The NetFlow traffic of this bot has large resemblance to normal users'

10
traffic, but still differs on flow density, operation regularity and frequency, making the
trace detectable if properly analyzed.
Both the two kinds of crawlers are roundly simulated during data collection step.
11
CHAPTER IV
BOTFLOWMON SCHEMA
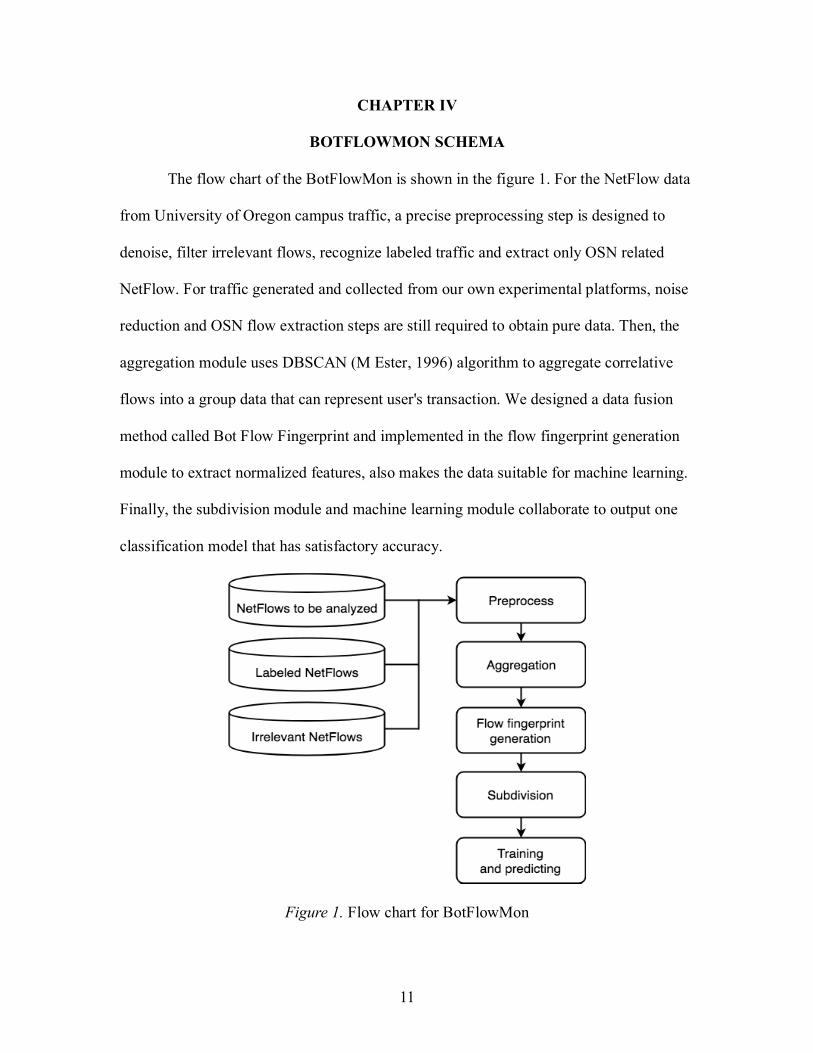
The flow chart of the BotFlowMon is shown in the figure 1. For the NetFlow data
from University of Oregon campus traffic, a precise preprocessing step is designed to
denoise, filter irrelevant flows, recognize labeled traffic and extract only OSN related
NetFlow. For traffic generated and collected from our own experimental platforms, noise
reduction and OSN flow extraction steps are still required to obtain pure data. Then, the
aggregation module uses DBSCAN (M Ester, 1996) algorithm to aggregate correlative
flows into a group data that can represent user's transaction. We designed a data fusion
method called Bot Flow Fingerprint and implemented in the flow fingerprint generation
module to extract normalized features, also makes the data suitable for machine learning.
Finally, the subdivision module and machine learning module collaborate to output one
classification model that has satisfactory accuracy.
Figure 1. Flow chart for BotFlowMon

12
Preprocessing
For NetFlow data from campus traffic, the first indispensable step is grouping
flows by user. In campus network environment, thousands of users' network traffic are
mixed together, we need to settle each single user's flows into one group by matching IP
address and address port number. For data amassed from our own experimental
platforms, this process can be skipped because we strictly controlled that only one user's
operations can be performed at one time.
Then, a filtration machine is constructed to wipe out flows with zero Byte, zero
duration, irrelevant protocols (such as ICMP) and external flows that pass by edge router.
For now, we have relatively clean NetFlows, but we still need to extract the traffic
flows only related with the OSNs. The basic thought is for each flow, we check its
interaction IP addresses to test whether it belongs to Facebook, Twitter or other social
websites. However, one concern is the IP blocks of the OSNs may change over time, and
each OSN has a huge number of IP blocks. It is difficult to build a static IP library to
accurately match the result. The breakthrough is that autonomous systems will update
router tables to maintain network reachability information, the access to the dynamic
router table enables us to match the most updated and historical accurate IP blocks. With
those information, a IP block library can be built dynamically to help the extraction
process. In order to obtain that information, BGP stream (C Orsini, 2016) is used in this
step. BGP stream is an open-source software framework for the analysis of both historical
and real-time Border Gateway Protocol (BGP) measurement data. Those BGP data
contain the updated and historical router information including the router tables. By using

13
the BGPStream API, we can look up what IP blocks are forwarded to Facebook and
Twitter at different time.
The IP address matching process is implemented with the longest prefix match
algorithm (T Hayashi, 1999), which refers to an algorithm used by routers in Internet
Protocol (IP) networking to select an entry from a forwarding table. The algorithm also
needs to be executed in parallel, because for one single day, there could be more than
100GB data generated from campus traffic and around 500MB data collected from our
small experimental platform. The parallelization can significantly increase the efficiency
of the processing.
With the help of BGP stream and parallelized longest prefix match algorithm, we
are able to efficiently extract the only OSN related flow data. Although there still could
contain some tiny noise in the grouped data such as traffic delivered by CDN protocol,
sufficient detailed traffic flows are obtained for analysis and would not affect final result.
Aggregation
Inasmuch as the little information flow-level data contains, DBSCAN (M Ester,
1996), a density-based clustering algorithm, is used to aggregate the related flows into
one transaction, so that the features of both malicious and legitimate traffic become
conspicuous and make it feasible to distinguish. Here, transaction refers to that one user
performs several operations on OSN for some purposes in a relatively short time period.
For example, a transaction can be taking 30 seconds to reply some messages through
Facebook Messenger or tweeting 20 anomalous hyperlinks on twitter within one minute.
We treat flows as points scattered on timeline, DBSCAN groups together points
that are closely packed together (points with many nearby neighbors), marking as outliers

14
points that lie alone in low-density regions (whose nearest neighbors are too far away).
This one-dimensional DBSCAN algorithm will be used to group the data by taking two
parameters as threshold values, one is density threshold value minPts, refers to bits per
second (bps) in this case; one is radius threshold value ε, refers to time interval between
flows. Based on experimental results, we set minPts as 1500 bps, a relatively small value
for OSN traffic, because some EventListeners in web scripts and API programs
frequently generate some tiny streams between users and OSN servers, these traffic
should definitely be included instead of being labeled as outliers. We set ε as relatively
large values between 10 to 20 seconds, because lots of people may spend some time on
reading content on OSN, with no or very few NetFlow data created during this time
period, but it still needs to be treated as a single transaction. Moreover, if we get very
large patterns after the aggregation process, we can still cut this pattern into pieces in the
following steps to fix the complexity problem, but there are no ways to fix if we get very
tiny patterns containing too few information.
In addition, as a solution for getting a grip on complexity, one transaction's time
duration should be in the range of 1.5 seconds to 60 seconds. Any transactions shorter
than that range will be discarded as noise (could be OSN notifications or status checking
traffic) and any transactions longer than that range will force to be divided evenly until
qualified.
Flow Fingerprint Generation
After the aggregation process, we can obtain transactions level data represented
by different numbers of flows. In order to easily apply machine learning algorithms to
train classification models, we need encode the transactions into normalized data,

15
transferring both numerical attributes and symbolic attributes into the same format. Here,
a data fusion method named Flow Fingerprint along with a visualization method are
proposed for this reason.
The basic idea of the Flow Fingerprint approach is to transfer the aggregated
flows to a 6 × 200 matrix shown as the table below. For each transaction level data, it
contains specific number of flows that have different start time and end time. The
transaction itself also has an overall start and end time. We perform equal division to
partition the transaction time duration into 200 pieces and extract features from each
piece to fill each column of the matrix respectively.
Table 2
Configuration of Flow Fingerprint matrix
Flow Fingerprint matrix 1: outgoing traffic bps bps𝑜1, bps𝑜2, bps𝑜3,… , bps𝑜200 2: outgoing traffic pps pps𝑜1, pps𝑜2, pps𝑜3,… , pps𝑜200 3: outgoing traffic ToS tos𝑜1, tos𝑜2, tos𝑜3, … , tos𝑜200 4: incoming traffic bps bps𝑖1, bps𝑖2, bps𝑖3,… , bps𝑖200 5: incoming traffic pps pps𝑖1, pps𝑖2, pps𝑖3,… , pps𝑖200 6: incoming traffic ToS tos𝑖1, tos𝑖2, tos𝑖3,… , tos𝑖200
Row 1 to row 3 are features extracted from outgoing NetFlows, while row 4 to
row 6 are features extracted from incoming NetFlows. They both take bits per second
(bps), packets per second (pps) and type of service (ToS) as data entries. At one moment,
several different flows could overlap, so the bps and pps values should be the
accumulation of the overlap NetFlows. Let F be the set of flows overlapped at time t, the
pps and bps values at t can be calculated with the following equations.
bps(t) =∑𝑓.𝑏𝑝𝑠𝑓∈𝐹

16
pps(t) = ∑𝑓. 𝑝𝑝𝑠𝑓∈𝐹
ToS, a 8-bit field that becomes increasingly important as voice and video gain
popularity on today's social networks. It is used for prioritizing traffic to guarantee high
quality datagram transmission service. As it is a symbolic value, we only fill the
dominating flow's ToS value into the matrix when several flows overlapped. Here,
dominating flow means the flow has the largest bps value at the moment. There is one
concern that in NetFlow system, two bits of ToS field are reserved for customization,
theoretically, ISPs can rewrite the whole ToS field for differentiated demands, which
means the classification model may not be universal. So, we will train another
classification model only utilizing 4 × 200 matrix (incoming and outgoing ToS are wiped
off) as a comparison. This comparison model would be more generally applicable but has
weaker performance.
The normalization of the matrix is based on the dispersion of bps, pps and ToS
values in the entire network. In order to achieve that, we fetched 235GB NetFlow data
from campus traffic including internal router flows and performed the same matrix
transformation procedure on these data. Then create a new dataset that have the same
number of values that evenly distribute in the range of 0 to 255. Three gigantic quantile to
quantile plots are drawn based on these two dataset to represent the dispersions of bps,
pps and ToS values respectively (figure 2 and 3 are the quantile to quantile plots of bps
and pps). From now on, three value mapping functions 𝑓𝑟(𝑏𝑝𝑠), 𝑓𝑔(𝑝𝑝𝑠) and 𝑓𝑔(𝑡𝑜𝑠) can
be constructed to normalize the matrix values into the range of 0 to 255 based on the
quantile to quantile plots. The final matrix is called flow fingerprint.

17
Figure 2. Quantile to Quantile plot of NetFlow size and Number of Packets
Figure 3. Quantile to Quantile plot of TOS
Why should we normalize the matrix values into 0 to 255? Actually, in the
machine learning step, we still convert them into the range of 0 to 1 to fit training
algorithms, but for now, we can easily visualize the matrix for better observation and
analysis with the 0 to 255 range. We visualize the 6 × 200 matrix to two colorful bars in
standard RGB space with the length of 200 pixels.

18
Figure 4. A transaction lasting for 35.74s, containing 220 NetFlows.
Figure 4 is an example of the visualized flow fingerprint, which represents a
legitimate user that spent 35.74 seconds browsing Facebook and reloaded the page twice
during this transaction. The beginning and ending position of the image represent the
starting time and ending time of the transaction. The bar above denotes the outgoing
traffic, while the bar beneath denotes the incoming traffic. The RGB value of each pixel
is calculated by the following equation. By figuring out the difference value with 255,
column lager bps and pps values tends have deeper color while column with smaller bps
and pps values tends to have lighter color.
RGB(bps, pps, tos) = (255 − 𝑓𝑟(𝑏𝑝𝑠), 255 − 𝑓𝑔(𝑝𝑝𝑠), 255 − 𝑓𝑏(𝑡𝑜𝑠))
Some more examples are shown in figure 5. Flow fingerprint 1 and 2 are two
users conducting a conversation with each other through Twitter DM, the difference is
flow fingerprint 1 was generated by legitimate user while flow fingerprint 2 was
generated by a chat bot; Flow fingerprint 3 was created by a poster bot, using API to
tweet textual messages on Twitter for every 3 seconds; Flow fingerprint 4 is a hybrid bot,
crawling friends' photo albums and posting link spams at the same time.

19
Figure 5. More Flow Fingerprint examples
Flow Subdivision
After the previous preprocessing steps, we already have normalized dataset can
perfectly fit machine learning algorithms. However, satisfactory results still cannot be
obtained due to two issues: (A) There can be countless kinds of bot and human
transactions existing, with different operation frequencies, combinations of operations
and density dispersions. This makes the limited training set cannot cover all possible
application scenarios; (B) The training sets we have now still features different time
durations, range from two seconds to one minute, increasing challenges for the learning
model convergence.
As a solution for these two issues, we designed a new cluster algorithm named
Clustering Based on Density Sort and Valley Point Competition to subdivide the

20
transaction level data into more basic operation level data. The key idea is, one OSN
transaction is a combination of different basic operations. When bots and humans are
performing single operation in OSNs (such as tweeting, clicking like button and making
comment), the flow density is relatively higher than other inactive time. We can identify
legitimate users' and bots' transactions by performing the classification of bot operations
versus human operations. Based on experimental results, it is much easier to differentiate
bot operations from human operations through NetFlow data.
The pseudocode of the algorithm is shown above, which takes one dataset and
radius threshold value r as input. We first extract the flow fingerprint matrix's incoming
and outgoing bps rows out, sum the values from the same column together to generate a
new 1 × 200 matrix. Then take the new matrix as input dataset D, treat the value from
each column as single data point.
Density
For one data point p, there is a dataset D containing all the points within a r radius of p.
Then the density of p is summation of all the D's belonging points' bps values.

21
Potential Point
For a cluster D, its potential point p should be within a r radius of one of D's
belonging point b.
∃b ∈ {x|x ∈ D ∧ dist(x, p) < r}
Valley Point
For point a, if it is the potential point of two or more clusters, then a is the valley
point of the neighboring clusters.
Valley Point Competition
Once some clusters are border by and a valley point appears, we need to make
judgement for how we should label that point. We have three choices here: (1) Combine
all the clusters together and make the point as the combined cluster's belonging; (2)
Combine some of the clusters together and label the point as the combined cluster's
belonging; (3) Do not combine any of them, just assign the valley point to one of the
clusters.
The process of making the choice is called valley point competition. In this
algorithm, if the density of the valley is larger than 50% of its around clusters' center
density, then we combine all the around clusters together and assign the valley point to
the combined cluster. If the density is less than 50% of its around clusters, then we assign
the valley point to the clusters with smallest number of belongings.

22
Figure 6. Subdivision example
Machine Learning
The machine learning module uses operation level data labeled as bot flows and
legitimate flows to train the classification model. The prediction process also input
operation level data to analyze. Instead of outputting the result directly, it enables each
operation level data vote for its transaction level data's identity. This strategy makes the
sensitivity of the detection method can be controlled by setting different passing lines of
voting.
We used keras (F Chollet, 2015) with TensorFlow (M Abadi, 2016) to construct
the learning model. Since it is nonlinear high-dimensional data training, Multilayer
Perceptron (MLP) and Conventional Neural Network (CNN) are used as training
approaches.

23
As stated before, due to the customizability of ToS field, two versions of data are
engaged to separately train two versions of models as a comparison to test the
universality. One is the data involves ToS, another is the data without ToS.

24
CHAPTER V
EVALUATION
We first evaluated the subdivision component to see whether the Clustering Based
on Density Sort and Valley Point Competition algorithm can divide the transaction level
flows into operation level flows correctly.
The algorithm takes one radius threshold parameter r as input, whose unit is pixel
length. Different r values can generate different subdivision results and eventually make
differences to detection outcome. Figure 7 is the line chart that shows the clustering
purity scores with different r values. The horizontal axis represents the values of r and the
vertical axis represents the purity score of the resulted clusters (purity =
1𝑁∑ 𝑚𝑎𝑥𝑗|𝑐𝑖 ∩ 𝑡𝑗|𝑘𝑖=1 , where N is the number of data points, k denotes the number of
clusters, 𝑐𝑖 is a cluster in C, and 𝑡𝑗 is the cluster generated by the algorithm which has the
maximum count for cluster 𝑐𝑖). We can see the algorithm is very sensitive to r parameter,
and optimal results can be generated when r is in the range of 18 to 22. For traffic
generated by bots, the subdivision module works well, can achieve up to 93.58% purity
when r=23, that's because bots' operations mostly utilize API to perform, making the
traffics have very clear flow fingerprint for classification (tend to be short and
concentrate). For legitimate transactions, the clustering result is inferior to bot
transactions. The maximal purity score we can achieve is 78.32% when r=26 and
legitimate transactions are more sensitive to the variation r. One reason is the boundaries
of different operations in legitimate transactions are blurry in flow level data. Almost all
the OSN websites have lots of EventListeners embedded into the HTML to preload the
contents dynamically, which fills in the blanks between operations. In addition, we rely

25
on manual recording to label legitimate transactions, which adds the impreciseness to
evaluation.
Figure 7. Purity scores with different r values
The ultimate goal of subdivision is not precisely partition all the operations,
instead, it is designed to make the data more diacritical to help the machine learning
process. We randomly sampled 100 legitimate transactions and 100 bot transactions, then
recorded the number of operations and average duration times for each transaction after
subdivision. Figure 8 is the scatter plot of the result. All the bot transactions are divided
into relatively shorter operations compared with legitimate flows. Moreover, bots flow
fingerprints' durations are normalized to the range of 0 second to 15 seconds, while
legitimate operations distribute in the range of 0 second to 40 seconds. This procedure
can significantly help the training process.

26
Figure 8. Scatter Diagram for Subdivision
Figure 9 shows the test result for machine learning module with 6 × 200 matrix
data (with incoming and outgoing bps, pps and ToS). The test set contains 675 bot
transactions and 420 legitimate transactions. For both Multilayer Perceptron (MLP) and
Conventional Neural Network (CNN) algorithms, we used 10-fold cross-validation to
check whether the model is overfitting. Since multiple actions had been taken to prevent
the model from overfitting, such as controlling the learning rate η and limit the number of
iterations, the cross-validation accuracy is very similar to the testing accuracy. As we can
see in the figure, with subdivision, the accuracy has an improvement of around 20%. As a
true-or-false classification with the bottom line of 50% accuracy, it is a huge
improvement. For here, CNN achieves the greatest result, with 93.61% of accuracy.

27
Figure 9. Result for 6*200 matrix version
Figure 10. Result for 4*200 matrix version
As stated before, in order to guarantee the universality of BotFlowMon, we used
4 × 200 matrix version data (just with incoming and outgoing bps and pps) to train
another classification model. The result can be seen in figure 10. Surprisingly, the
accuracies only get around 1% lower than the 6 × 200 matrix version. The decrease of
dimensions will reduce the information but also make the model easier to converge,
especially for MLP. Again, CNN gets the best result in this model. The detailed
evaluation score for CNN in these two versions of models can be seen in the table below.
Table 3
Detailed results for CNN
6*200 Matrix 4*200 Matrix

28
Accuracy 0.9361 0.9233 Precision 0.9887 0.9821 Recall 0.9067 0.8919 F1 score 0.9459 0.9348
In real environment, with an accuracy of more than 93%, we can detect most of
bot traffic. Because one bot can create several transaction level flow fingerprints in a
specific time range, only one of the transactions is identified as illegimate, the bot can be
identified. Another concern is false alarm, we want legitimate traffic can 100% pass the
BotFlowMon system. Benefitting from voting mechanism in machine learning module,
we can set a strict passing line to adjust the sensitiveness. As experimented, if a
transaction can be labeled as illegimate only when more than 75% of the operations are
judged as illegimate, there will be no false alarms in this system, but the accuracy will
drop down to 89.56%.

29
CHAPTER VI
CONCLUSION
With the rapid increasing of social bots activities, it becomes more and more
meaningful to develop an efficient social bots detection system. Compared with the
previous methods to limit social bots, BotFlowMon has the following advantages: (1)
Only NetFlow data will be involved to finish the whole detection procedure, which
avoids damaging the privacy of the users; (2) Due to its operating mechanism, this
system is easy to deploy. We only need to mirror NetFlow data from routers to
BotFlowMon system. (3) Have relatively higher accuracy compared with content-based
detection methods.
There are still lots of works need to be done in the future. This detection system
can be transferred into a real-time monitor system, which poses a velocity challenge; the
training and testing set can be further enriched to reinforce the classification model.

30
REFERENCES CITED
Danezis, G., & Mittal, P. (2009, February). SybilInfer: Detecting Sybil Nodes using Social Networks. In NDSS (pp. 1-15).
Ferrara, E. (2015). Manipulation and abuse on social media by emilio ferrara with ching-
man au yeung as coordinator. ACM SIGWEB Newsletter, (Spring), 4. Roesslein, J. (2009). tweepy Documentation. Online] http://tweepy. readthedocs.
io/en/v3, 5. Cresci, S., Di Pietro, R., Petrocchi, M., Spognardi, A., & Tesconi, M. (2015). Fame for
sale: efficient detection of fake Twitter followers. Decision Support Systems, 80, 56-71.
Ferrara, E., Varol, O., Davis, C., Menczer, F., & Flammini, A. (2016). The rise of social
bots. Communications of the ACM, 59(7), 96-104. Ester, M., Kriegel, H. P., Sander, J., & Xu, X. (1996, August). A density-based algorithm
for discovering clusters in large spatial databases with noise. In Kdd (Vol. 96, No. 34, pp. 226-231).
Ratkiewicz, J., Conover, M., Meiss, M. R., Gonçalves, B., Flammini, A., & Menczer, F.
(2011). Detecting and tracking political abuse in social media. ICWSM, 11, 297-304.
Gong, N. Z., Frank, M., & Mittal, P. (2014). Sybilbelief: A semi-supervised learning
approach for structure-based sybil detection. IEEE Transactions on Information Forensics and Security, 9(6), 976-987.
Grier, C., Thomas, K., Paxson, V., & Zhang, M. (2010, October). @ spam: the
underground on 140 characters or less. In Proceedings of the 17th ACM conference on Computer and communications security (pp. 27-37). ACM.
Boshmaf, Y., Muslukhov, I., Beznosov, K., & Ripeanu, M. (2011, December). The
socialbot network: when bots socialize for fame and money. In Proceedings of the 27th annual computer security applications conference (pp. 93-102). ACM.
Bilge, L., Strufe, T., Balzarotti, D., & Kirda, E. (2009, April). All your contacts are
belong to us: automated identity theft attacks on social networks. In Proceedings of the 18th international conference on World wide web (pp. 551-560). ACM.
Gao, H., Hu, J., Wilson, C., Li, Z., Chen, Y., & Zhao, B. Y. (2010, November). Detecting
and characterizing social spam campaigns. In Proceedings of the 10th ACM SIGCOMM conference on Internet measurement (pp. 35-47). ACM.

31
Orsini, C., King, A., Giordano, D., Giotsas, V., & Dainotti, A. (2016, November). BGPStream: a software framework for live and historical BGP data analysis. In Proceedings of the 2016 Internet Measurement Conference (pp. 429-444). ACM.
Sommer, R., & Feldmann, A. (2002, November). NetFlow: Information loss or win?. In
Proceedings of the 2nd ACM SIGCOMM Workshop on Internet measurment (pp. 173-174). ACM.
Wang, G., Mohanlal, M., Wilson, C., Wang, X., Metzger, M., Zheng, H., & Zhao, B. Y.
(2012). Social turing tests: Crowdsourcing sybil detection. arXiv preprint arXiv:1205.3856.
Abadi, M., Agarwal, A., Barham, P., Brevdo, E., Chen, Z., Citro, C., ... & Ghemawat, S.
(2016). Tensorflow: Large-scale machine learning on heterogeneous distributed systems. arXiv preprint arXiv:1603.04467.
Chollet, F. (2015). Keras. Claise, B. (2004). Cisco systems netflow services export version 9. Davis, C. A., Varol, O., Ferrara, E., Flammini, A., & Menczer, F. (2016, April).
Botornot: A system to evaluate social bots. In Proceedings of the 25th International Conference Companion on World Wide Web (pp. 273-274). International World Wide Web Conferences Steering Committee.
Zhang, J., Zhang, R., Zhang, Y., & Yan, G. (2016). The rise of social botnets: Attacks
and countermeasures. IEEE Transactions on Dependable and Secure Computing. Karataş, A., & Şahin, S. A Review on Social Bot Detection Techniques and Research
Directions. Graham, W. (2008). Facebook API developers guide. Infobase Publishing. Hardt, D. (2012). The OAuth 2.0 authorization framework. Al-Zubaide, H., & Issa, A. A. (2011, November). Ontbot: Ontology based chatbot. In
Innovation in Information & Communication Technology (ISIICT), 2011 Fourth International Symposium on (pp. 7-12). IEEE.
Dickerson, J. P., Kagan, V., & Subrahmanian, V. S. (2014, August). Using sentiment to
detect bots on twitter: Are humans more opinionated than bots?. In Advances in Social Networks Analysis and Mining (ASONAM), 2014 IEEE/ACM International Conference on (pp. 620-627). IEEE.

32
Hayashi, T., & Miyazaki, T. (1999). High-speed table lookup engine for IPv6 longest prefix match. In Global Telecommunications Conference, 1999. GLOBECOM'99 (Vol. 2, pp. 1576-1581). IEEE.
Wallace, R. S. (2003). Be Your Own Botmaster: The Step By Step Guide to Creating,
Hosting and Selling Your Own AI Chat Bot On Pandorabots. ALICE AI foundations, Incorporated.