boston massachusetts real estate market data - dwell360
DESCRIPTION
Dwell360 has published this report on the residential real estate market statistics for 2013, 2012, 2011, 2010, 2009, 2008, 2007, 2006, 2005, and 2004 for Boston, Massachusetts. The market statistics include residential sales averages for single family homes, condominiums, and multifamily homes. Review the information presented by the Massachusetts boutique real estate brokerage Dwell360 based in Newton.TRANSCRIPT

Single Family, Condominiums, and Multifamily Homes
Year End 2013
Boston, Massachusetts
Market Repor t

2

3
Table of contents
[email protected] | 617-299-1854
CoNTENTS Back Bay 4 Beacon Hill 10 Charlestown 16 South End 22 South Boston 28 Dorchester 34 Allston 40 Brighton 46 Jamaica Plain 52 Roslindale 58 West Roxbury 62

4
Range
Number of
Listing Sold
Days on
the Market
Average
Sale Price
4 Bed $4,900,000 - $4,900,000 1 289 4,900,000$
5 Bed $6,475,000 - $4,475,000 1 56 6,475,000$
6+ Bed $3,875,000 - $14,500,000 5 309 7,960,000$
Year % Change
Number of
Listing Sold
Days on
the Market
Average
Sale Price
2008 4 235 2,367,250$
2009 115.440% 1 119 5,100,000$
2010 -24.756% 7 199 3,837,429$
2011 16.360% 10 263 4,465,250$
2012 5.880% 14 344 4,727,821$
2013 54.632% 7 270 7,310,714$
Source: MLSPIN, as of 3/4/2014; Town = Boston-Back Bay
Back Bay Statistics
Average Sale Price - Number of Bedrooms - 2013
Historical Average Sale Price - Past 6 Years
Single Family Homes
$2,367,250
$5,100,000
$3,837,429 $4,465,250 $4,727,821
$7,310,714
2008 2009 2010 2011 2012 2013
5
Market stat ist ics
[email protected] | 617-299-1854
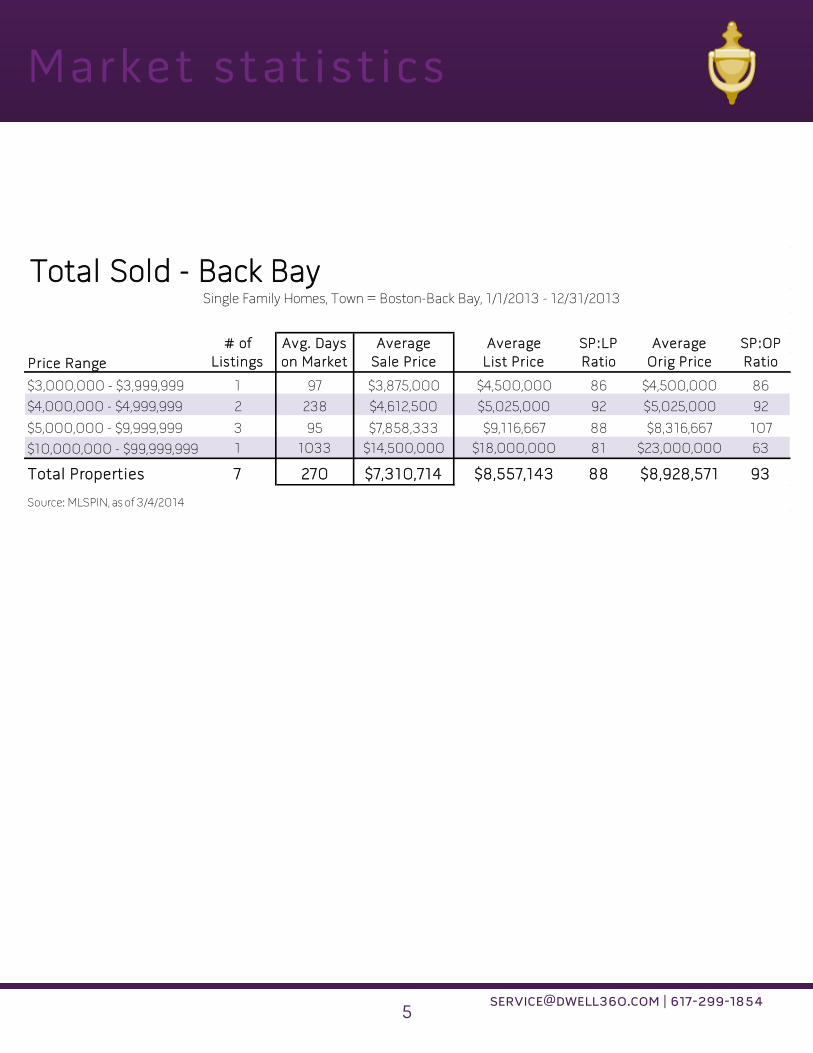
Total Sold - Back BaySingle Family Homes, Town = Boston-Back Bay, 1/1/2013 - 12/31/2013
# of Avg. Days Average Average SP:LP Average SP:OP
Listings on Market Sale Price List Price Ratio Orig Price Ratio
$3,000,000 - $3,999,999 1 97 $3,875,000 $4,500,000 86 $4,500,000 86
$4,000,000 - $4,999,999 2 238 $4,612,500 $5,025,000 92 $5,025,000 92
$5,000,000 - $9,999,999 3 95 $7,858,333 $9,116,667 88 $8,316,667 107
$10,000,000 - $99,999,999 1 1033 $14,500,000 $18,000,000 81 $23,000,000 63
Total Properties 7 270 $7,310,714 $8,557,143 88 $8,928,571 93
Source: MLSPIN, as of 3/4/2014
Price Range

6
Range
Number of
Listing Sold
Days on
the Market
Average
Sale Price
0 Bed $240,000 - $540,000 27 44 351,074$
1 Bed $224,000 - $2,425,000 154 44 570,670$
2 Bed $377,000 - $5,750,000 228 55 1,245,943$
3 Bed $566,000 - $7,000,000 52 107 2,793,110$
4-5 Bed $2,150,500 - $7,817,500 14 124 3,979,321$
Year % Change
Number of
Listing Sold
Days on
the Market
Average
Sale Price
2008 411 104 981,954$
2009 -0.305% 360 118 978,955$
2010 24.715% 448 132 1,220,908$
2011 -7.668% 433 131 1,127,283$
2012 4.862% 543 105 1,182,096$
2013 3.721% 475 59 1,226,083$
Source: MLSPIN, as of 3/4/2014; Town = Boston-Back Bay
Back Bay StatisticsCondominiums
Average Sale Price - Number of Bedrooms - 2013
Historical Average Sale Price - Past 6 Years
$981,954 $978,955
$1,220,908 $1,127,283
$1,182,096 $1,226,083
2008 2009 2010 2011 2012 2013

7
Market stat ist ics
[email protected] | 617-299-1854
Total Sold - Back BayCondominiums, Town = Boston-Back Bay, 1/1/2013 - 12/31/2013
# of Avg. Days Average Average SP:LP Average SP:OP
Listings
on
Market Sale Price List Price Ratio Orig Price Ratio
$200,000 - $249,999 3 61 $236,333 $237,667 100 $237,667 100
$250,000 - $299,999 6 50 $286,500 $289,333 99 $294,333 97
$300,000 - $349,999 20 29 $329,375 $331,845 99 $331,645 99
$350,000 - $399,999 19 55 $369,474 $368,559 101 $370,454 100
$400,000 - $449,999 30 40 $426,243 $428,963 100 $432,283 99
$450,000 - $499,999 25 64 $476,540 $478,700 100 $488,816 99
$500,000 - $599,999 40 39 $542,288 $552,730 98 $553,873 98
$600,000 - $699,999 47 41 $649,077 $646,030 101 $653,202 100
$700,000 - $799,999 35 45 $748,686 $756,340 99 $765,026 98
$800,000 - $899,999 35 42 $854,726 $865,991 99 $880,334 97
$900,000 - $999,999 23 90 $947,783 $962,222 99 $983,830 97
$1,000,000 - $1,499,999 80 58 $1,254,443 $1,275,963 99 $1,314,100 96
$1,500,000 - $1,999,999 47 63 $1,729,681 $1,790,021 97 $1,799,213 97
$2,000,000 - $2,499,999 21 69 $2,237,667 $2,379,571 94 $2,411,714 93
$2,500,000 - $2,999,999 12 92 $2,745,000 $2,821,083 97 $2,858,500 96
$3,000,000 - $3,999,999 16 95 $3,483,594 $3,659,313 95 $3,769,563 93
$4,000,000 - $4,999,999 2 131 $4,512,500 $5,124,500 88 $5,124,500 88
$5,000,000 - $9,999,999 14 176 $6,085,179 $6,580,000 93 $6,617,500 92
Total Properties 475 59 $1,226,083 $1,270,022 98 $1,288,961 97
Source: MLSPIN, as of 3/4/2014
Price Range

8
Range
Number of
Listing Sold
Days on
the Market
Average
Sale Price3-5 Units $1,425,000 - $7,400,000 4 121 3,936,250$
6+ Units $5,607,000 - $7,800,000 2 49 6,703,750$
Year % Change
Number of
Listing Sold
Days on
the Market
Average
Sale Price
2007 3 23 5,610,354$
2008 2.187% 2 53 5,733,050$
2009 -86.046% 1 7 800,000$
2010 163.583% 3 54 2,108,667$
2011 37.587% 4 21 2,901,250$
2012 6.161% 5 76 3,080,000$
2013 89.715% 7 100 5,843,214$
Source: MLSPIN, as of 3/4/2014; Town = Boston-Back Bay
Back Bay StatisticsMultifamily Homes
Average Sale Price - Number of Units in Building - 2013
Historical Average Sale Price - Past 6 Years
$5,610,354 $5,733,050
$800,000
$2,108,667
$2,901,250 $3,080,000
$5,843,214
2007 2008 2009 2010 2011 2012 2013

9
Market stat ist ics
[email protected] | 617-299-1854
Email [email protected] for up-to-date market statistics for your neighborhood.
Multifamily Homes, Town = Boston-Back Bay, 1/1/2013 - 12/31/2013
# of Avg. Days Average Average SP:LP Average SP:OP
Listings on Market Sale Price List Price Ratio Orig Price Ratio
$1,000,000 - $1,499,999 1 6 $1,425,000 $1,550,000 92 $1,550,000 92
$1,500,000 - $1,999,999 0 0 $0 $0 0 $0 0
$2,000,000 - $2,499,999 0 0 $0 $0 0 $0 0
$2,500,000 - $2,999,999 1 31 $2,620,000 $2,850,000 92 $2,850,000 92
$3,000,000 - $3,999,999 0 0 $0 $0 0 $0 0
$4,000,000 - $4,999,999 1 57 $4,300,000 $4,700,000 91 $5,200,000 83
$5,000,000 - $9,999,999 3 162 $6,935,833 $6,998,333 100 $7,265,000 98
$10,000,000 - $99,999,999 1 118 $11,750,000 $13,799,000 85 $13,799,000 85
Total Properties 7 100 $5,843,214 $6,270,571 94 $6,456,286 92
Source: MLSPIN, as of 3/4/2014
Total Sold - Back Bay
Price Range

10
Range
Number of
Listing Sold
Days on
the Market
Average
Sale Price
3 Bed $1,055,000 - $2,725,000 10 68 1,814,750$
4 Bed $2,150,000 - $4,425,000 10 94 3,,004,430
5 Bed $2,110,000 - $5,700,000 6 116 4,023,333$
6 Bed $2,970,000 - $9,300,000 2 371 6,135,000$
Year % Change
Number of
Listing Sold
Days on
the Market
Average
Sale Price
2008 18 167 2,975,056$
2009 -8.159% 19 160 2,732,332$
2010 -3.451% 25 140 2,638,040$
2011 3.697% 31 204 2,735,565$
2012 2.654% 26 212 2,808,173$
2013 7.596% 28 109 3,021,493$
Source: MLSPIN, as of 3/4/2014; Town = Boston-Beacon Hill
Beacon Hill Statistics
Average Sale Price - Number of Bedrooms - 2013
Historical Average Sale Price - Past 6 Years
Single Family Homes
$2,975,056
$2,732,332
$2,638,040
$2,735,565
$2,808,173
$3,021,493
2008 2009 2010 2011 2012 2013

11
Market stat ist ics
[email protected] | 617-299-1854
Total Sold - Beacon HillSingle Family Homes, Town = Boston-Beacon Hill, 1/1/2013 - 12/31/2013
# of Avg. Days Average Average SP:LP Average SP:OP
Listings
on
Market Sale Price List Price Ratio Orig Price Ratio
$1,000,000 - $1,499,999 3 27 $1,246,667 $1,261,667 99 $1,261,667 99
$1,500,000 - $1,999,999 4 93 $1,778,125 $1,911,250 93 $2,075,000 87
$2,000,000 - $2,499,999 5 120 $2,183,000 $2,377,800 92 $2,408,800 91
$2,500,000 - $2,999,999 7 90 $2,722,757 $2,842,857 96 $2,869,286 95
$3,000,000 - $3,999,999 4 108 $3,675,000 $3,811,250 96 $3,886,250 95
$4,000,000 - $4,999,999 2 165 $4,362,500 $4,700,000 93 $4,750,000 92
$5,000,000 - $9,999,999 3 202 $6,783,333 $7,083,333 96 $7,650,000 90
Total Properties 28 109 $3,021,493 $3,182,643 95 $3,293,179 93
Source: MLSPIN, as of 3/4/2014
Price Range

12
Range
Number of
Listing Sold
Days on
the Market
Average
Sale Price
0 Bed $262,500 - $375,000 6 56 310,500$
1 Bed $310,680 - $1,095,000 44 66 533,373$
2 Bed $377,500 - $2,699,000 77 53 873,971$
3 Bed $595,000 - $3,825,000 10 80 1,939,000$
4-5 Bed $1,687,000 - $6,250,000 3 97 3,882,333$
Year % Change
Number of
Listing Sold
Days on
the Market
Average
Sale Price
2008 177 112 684,484$
2009 6.815% 141 116 731,129$
2010 1.299% 136 111 740,626$
2011 3.505% 165 109 766,582$
2012 5.298% 189 85 807,196$
2013 9.430% 140 60 883,316$
Source: MLSPIN, as of 2/10/2014; Town = Boston-Beacon Hill
Beacon Hill StatisticsCondominiums
Average Sale Price - Number of Bedrooms - 2013
Historical Average Sale Price - Past 6 Years
$684,484 $731,129 $740,626 $766,582
$807,196 $883,316
2008 2009 2010 2011 2012 2013
13
Market stat ist ics
[email protected] | 617-299-1854
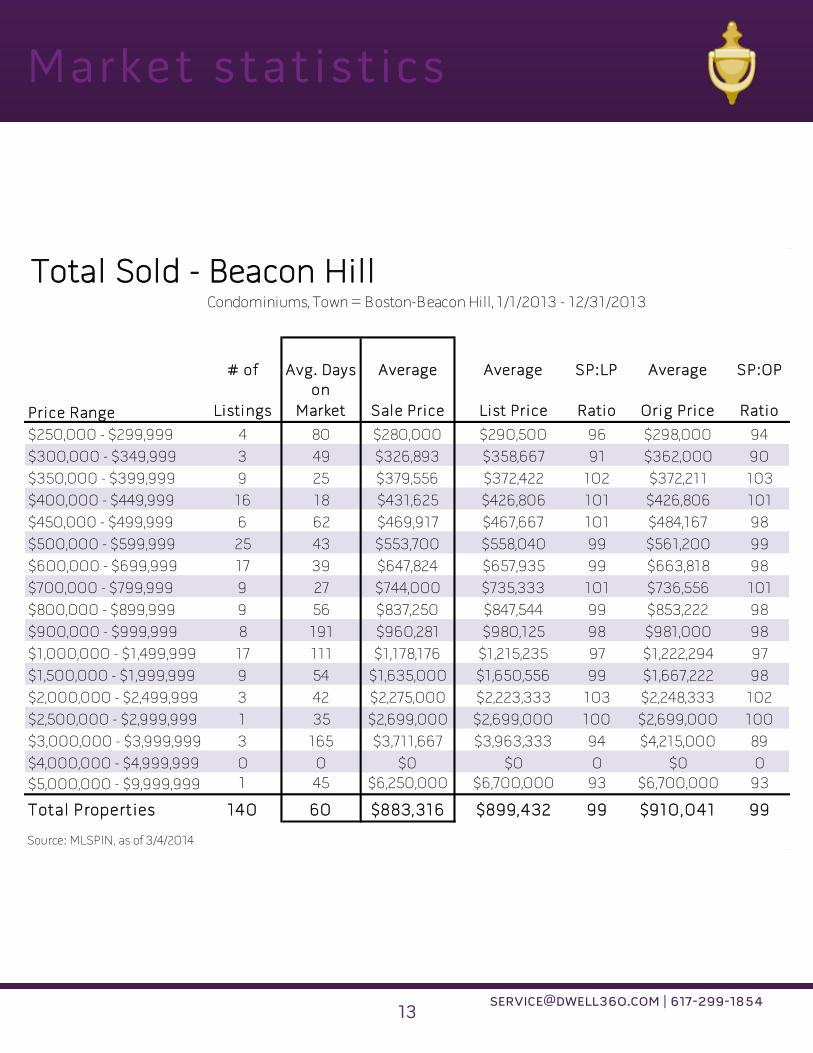
Total Sold - Beacon HillCondominiums, Town = Boston-Beacon Hill, 1/1/2013 - 12/31/2013
# of Avg. Days Average Average SP:LP Average SP:OP
Listings
on
Market Sale Price List Price Ratio Orig Price Ratio
$250,000 - $299,999 4 80 $280,000 $290,500 96 $298,000 94
$300,000 - $349,999 3 49 $326,893 $358,667 91 $362,000 90
$350,000 - $399,999 9 25 $379,556 $372,422 102 $372,211 103
$400,000 - $449,999 16 18 $431,625 $426,806 101 $426,806 101
$450,000 - $499,999 6 62 $469,917 $467,667 101 $484,167 98
$500,000 - $599,999 25 43 $553,700 $558,040 99 $561,200 99
$600,000 - $699,999 17 39 $647,824 $657,935 99 $663,818 98
$700,000 - $799,999 9 27 $744,000 $735,333 101 $736,556 101
$800,000 - $899,999 9 56 $837,250 $847,544 99 $853,222 98
$900,000 - $999,999 8 191 $960,281 $980,125 98 $981,000 98
$1,000,000 - $1,499,999 17 111 $1,178,176 $1,215,235 97 $1,222,294 97
$1,500,000 - $1,999,999 9 54 $1,635,000 $1,650,556 99 $1,667,222 98
$2,000,000 - $2,499,999 3 42 $2,275,000 $2,223,333 103 $2,248,333 102
$2,500,000 - $2,999,999 1 35 $2,699,000 $2,699,000 100 $2,699,000 100
$3,000,000 - $3,999,999 3 165 $3,711,667 $3,963,333 94 $4,215,000 89
$4,000,000 - $4,999,999 0 0 $0 $0 0 $0 0
$5,000,000 - $9,999,999 1 45 $6,250,000 $6,700,000 93 $6,700,000 93
Total Properties 140 60 $883,316 $899,432 99 $910,041 99
Source: MLSPIN, as of 3/4/2014
Price Range

14
Range
Number of
Listing Sold
Days on
the Market
Average
Sale Price
0-5 Units $3,300,000 - $3,300,000 1 194 3,300,000$
6+ Units $8,250,000 - $8,250,000 1 11 8,250,000$
Year % Change
Number of
Listing Sold
Days on
the Market
Average
Sale Price
2008 7 113 2,061,286$
2009 -13.707% 6 39 1,778,750$
2010 57.253% 7 108 2,797,143$
2011 -61.389% 1 11 1,080,000$
2012 106.019% 1 10 2,225,000$
2013 159.551% 2 103 5,775,000$
Source: MLSPIN, as of 3/4/2014; Town = Boston-Beacon Hill
Beacon Hill StatisticsMultifamily Homes
Average Sale Price - Number of Units in Building - 2013
Historical Average Sale Price - Past 6 Years
$2,061,286 $1,778,750
$2,797,143
$1,080,000
$2,225,000
$5,775,000
2008 2009 2010 2011 2012

15
Market stat ist ics
[email protected] | 617-299-1854
Email [email protected] for up-to-date market statistics for your neighborhood.
Multifamily Homes, Town = Boston-Beacon Hill, 1/1/2013 - 12/31/2013
# of Avg. Days Average Average SP:LP Average SP:OP
Listings on Market Sale Price List Price Ratio Orig Price Ratio
$3,000,000 - $3,999,999 1 194 $3,300,000 $3,600,000 92 $3,900,000 85
$4,000,000 - $4,999,999 0 0 $0 $0 0 $0 0
$5,000,000 - $9,999,999 1 11 $8,250,000 $6,750,000 122 $6,750,000 122
Total Properties 2 103 $5,775,000 $5,175,000 107 $5,325,000 103
Source: MLSPIN, as of 3/4/2014
Total Sold - Beacon Hill
Price Range

16
Range
Number of
Listing Sold
Days on
the Market
Average
Sale Price
2 Bed $265,277 - $770,000 13 39 443,906$
3 Bed $300,000 - $1,375,000 39 42 783,099$
4 Bed $600,000 - $1,500,000 16 56 1,002,125$
Year % Change
Number of
Listing Sold
Days on
the Market
Average
Sale Price
2004 64 83 611,138$
2005 12.177% 57 82 685,554$
2006 5.083% 34 141 720,403$
2007 -6.212% 51 130 675,648$
2008 -0.828% 61 99 670,053$
2009 -14.056% 47 140 575,870$
2010 27.076% 64 113 731,795$
2011 -10.290% 50 97 656,494$
2012 10.875% 76 94 727,888$
2013 5.757% 68 45 769,789$
Source: MLSPIN, as of 3/4/2014; Zip Code 02129
Charlestown Statistics
Average Sale Price - Number of Bedrooms - 2013
Historical Average Sale Price - Past 10 Years
Single Family Homes
$611,138 $685,554
$720,403 $675,648 $670,053
$575,870
$731,795 $656,494
$727,888 $769,789
2004 2005 2006 2007 2008 2009 2010 2011 2012 2013

17
Market stat ist ics
[email protected] | 617-299-1854
Total Sold - CharlestownSingle Family Homes, Zip Code 02129, 1/1/2013 - 12/31/2013
# of Avg. Days Average Average SP:LP Average SP:OP
Listings on Market Sale Price List Price Ratio Orig Price Ratio
$250,000 - $299,999 1 3 $265,277 $265,277 100 $265,277 100
$300,000 - $349,999 4 63 $314,375 $331,350 95 $333,225 95
$350,000 - $399,999 2 9 $355,000 $360,000 99 $360,000 99
$400,000 - $449,999 1 11 $442,000 $449,000 98 $449,000 98
$450,000 - $499,999 2 146 $475,000 $487,000 98 $487,000 98
$500,000 - $599,999 6 17 $551,167 $541,317 102 $541,317 102
$600,000 - $699,999 12 53 $638,000 $651,408 98 $653,575 98
$700,000 - $799,999 15 39 $750,333 $756,127 99 $762,793 99
$800,000 - $899,999 8 52 $865,484 $855,375 101 $860,375 101
$900,000 - $999,999 4 14 $955,625 $941,500 102 $943,750 101
$1,000,000 - $1,499,999 12 39 $1,188,042 $1,175,333 101 $1,187,917 100
$1,500,000 - $1,999,999 1 195 $1,500,000 $1,499,000 100 $1,589,000 94
Total Properties 68 45 $769,789 $769,888 100 $776,116 99
Source: MLSPIN, as of 3/4/2014
Price Range

18
Range
Number of
Listing Sold
Days on
the Market
Average
Sale Price
0-1 Bed $198,000 - $727,500 128 41 379,312$
2 Bed $325,000 - $1,375,000 179 40 586,708$
3 Bed $309,900 - $1,640,000 68 57 868,053$
4 Bed $585,000 - $1,475,000 4 31 1,068,500$
Year % Change
Number of
Listing Sold
Days on
the Market
Average
Sale Price
2004 295 75 466,867$
2005 7.086% 264 87 499,947$
2006 -4.127% 221 122 479,315$
2007 4.133% 304 117 499,124$
2008 -5.452% 227 122 471,910$
2009 -5.643% 219 116 445,280$
2010 5.027% 230 118 467,666$
2011 -1.228% 232 108 461,922$
2012 2.006% 334 87 471,187$
2013 21.444% 379 43 572,228$
Source: MLSPIN, as of 3/4/2014; Zip Code 02129
Charlestown StatisticsCondominiums
Average Sale Price - Number of Bedrooms - 2013
Historical Average Sale Price - Past 10 Years
$466,867 $499,947 $479,315 $499,124
$471,910 $445,280 $467,666 $461,922 $471,187
$572,228
2004 2005 2006 2007 2008 2009 2010 2011 2012 2013

19
Market stat ist ics
[email protected] | 617-299-1854
Total Sold - CharlestownCondominiums, Zip Code 02129, 1/1/2013 - 12/31/2013
# of Avg. Days Average Average SP:LP Average SP:OP
Listings on Market Sale Price List Price Ratio Orig Price Ratio
$150,000 - $199,999 1 61 $198,000 $200,000 99 $200,000 99
$200,000 - $249,999 4 92 $237,125 $244,854 97 $271,129 89
$250,000 - $299,999 12 49 $280,533 $283,225 99 $288,300 98
$300,000 - $349,999 26 30 $325,900 $329,550 99 $330,738 99
$350,000 - $399,999 58 43 $373,003 $375,784 99 $378,933 99
$400,000 - $449,999 47 40 $422,096 $424,664 100 $428,134 99
$450,000 - $499,999 36 40 $476,101 $473,060 101 $477,983 100
$500,000 - $599,999 70 37 $548,731 $540,889 102 $543,516 101
$600,000 - $699,999 48 33 $648,696 $637,917 102 $625,516 2231
$700,000 - $799,999 22 49 $746,331 $737,173 101 $742,632 101
$800,000 - $899,999 18 51 $845,364 $844,372 100 $859,150 99
$900,000 - $999,999 6 46 $954,250 $969,333 99 $969,333 99
$1,000,000 - $1,499,999 29 74 $1,212,957 $1,239,893 98 $1,248,897 97
$1,500,000 - $1,999,999 2 119 $1,595,000 $1,672,500 95 $1,747,450 91
Total Properties 379 43 $572,228 $572,422 100 $575,339 369
Source: MLSPIN, as of 3/4/2014
Price Range

20
Range
Number of
Listing Sold
Days on
the Market
Average
Sale Price
2 Units $395,000 - $1,342,500 8 61 870,894$
3-4 Units $812,000 - $1,150,000 2 86 981,000$
Year % Change
Number of
Listing Sold
Days on
the Market
Average
Sale Price
2004 19 86 729,684$
2005 2.824% 21 52 750,291$
2006 26.289% 10 84 947,533$
2007 -28.272% 14 94 679,643$
2008 -23.747% 8 173 518,250$
2009 12.266% 11 188 581,818$
2010 -1.357% 8 41 573,925$
2011 6.034% 9 58 608,553$
2012 67.874% 5 75 1,021,600$
2013* -8.218% 11 65 937,650$
Source: MLSPIN, as of 2/10/2014; Zip Code 02129
*2013 data includes only multifamily properties that had 2 or more units in the building.
Charlestown StatisticsMultifamily Homes
Average Sale Price - Number of Units in Building - 2013*
Historical Average Sale Price - Past 10 Years
$729,684 $750,291
$947,533
$679,643
$518,250 $581,818 $573,925 $608,553
$1,021,600 $937,650
2004 2005 2006 2007 2008 2009 2010 2011 2012 2013*

21
Market stat ist ics
[email protected] | 617-299-1854
Email [email protected] for up-to-date market statistics for your neighborhood.
Multifamily Homes, Zip Code 02129, 1/1/2013 - 12/31/2013*
# of Avg. Days Average Average SP:LP Average SP:OP
Listings on Market Sale Price List Price Ratio Orig Price Ratio
$350,000 - $399,999 1 17 $395,000 $429,900 92 $429,900 92
$400,000 - $449,999 0 0 $0 $0 0 $0 0
$450,000 - $499,999 0 0 $0 $0 0 $0 0
$500,000 - $599,999 2 17 $550,000 $549,450 100 $549,450 100
$600,000 - $699,999 1 71 $651,750 $660,000 99 $699,000 93
$700,000 - $799,999 0 0 $0 $0 0 $0 0
$800,000 - $899,999 2 102 $820,000 $888,500 92 $1,137,000 73
$900,000 - $999,999 0 0 $0 $0 0 $0 0
$1,000,000 - $1,499,999 5 79 $1,305,480 $1,397,780 93 $1,446,780 90
Total Properties 11 65 $937,650 $995,882 95 $1,066,882 90
Source: MLSPIN, as of 3/4/2014
*2013 data includes only multifamily properties that had 2 or more units in the building.
Total Sold - Charlestown
Price Range

22
Range
Number of
Listing Sold
Days on
the Market
Average
Sale Price
2 Bed $1,350,000 - $1,800,000 3 24 1,530,000$
3 Bed $767,500 - $2,670,000 20 28 1,739,881$
4 Bed $1,052,000 - $3,800,000 5 309 7,960,000$
5 Bed $2,422,500 - $3,950,000 5 139 3,331,061$
6 Bed $2,500,000 - $2,750,000 2 117 2,625,000$
Year % Change
Number of
Listing Sold
Days on
the Market
Average
Sale Price
2008 22 96 1,512,874$
2009 5.316% 22 201 1,593,305$
2010 4.236% 28 190 1,660,804$
2011 16.587% 38 108 1,936,280$
2012 0.930% 27 84 1,954,278$
2013 8.703% 39 49 2,124,357$
Source: MLSPIN, as of 3/11/2014; Town = Boston-South End
South End Statistics
Average Sale Price - Number of Bedrooms - 2013
Historical Average Sale Price - Past 6 Years
Single Family Homes
$1,512,874 $1,593,305 $1,660,804
$1,936,280 $1,954,278 $2,124,357
2008 2009 2010 2011 2012 2013

23
Market stat ist ics
[email protected] | 617-299-1854
Total Sold - South EndSingle Family Homes, Boston - South End, 1/1/2013 - 12/31/2013
# of Avg. Days Average Average SP:LP Average SP:OP
Listings on Market Sale Price List Price Ratio Orig Price Ratio
$700,000 - $799,999 1 19 $767,500 $899,000 85 $899,000 85
$800,000 - $899,999 1 25 $869,000 $869,000 100 $869,000 100
$900,000 - $999,999 0 0 $0 $0 0 $0 0
$1,000,000 - $1,499,999 7 48 $1,280,286 $1,332,429 97 $1,360,429 95
$1,500,000 - $1,999,999 13 22 $1,775,702 $1,793,692 99 $1,801,385 99
$2,000,000 - $2,499,999 5 29 $2,258,900 $2,353,000 97 $2,353,000 97
$2,500,000 - $2,999,999 5 80 $2,658,000 $2,807,000 95 $2,887,000 93
$3,000,000 - $3,999,999 7 97 $3,511,829 $3,654,143 96 $3,654,143 96
Total Properties 39 49 $2,124,357 $2,199,795 97 $2,217,641 96
Source: MLSPIN, as of 3/11/2014
Price Range

24
Range
Number of
Listing Sold
Days on
the Market
Average
Sale Price
0 Bed $177,500 - $399,000 6 34 310,825$
1 Bed $201,000 - $1,815,000 193 31 502,460$
2 Bed $191,500 - $2,705,000 292 32 778,639$
3 Bed $583,000 - $3,500,000 86 43 1,525,457$
4 Bed $1,500,000 - $2,272,500 6 32 1,857,917$
Year % Change
Number of
Listing Sold
Days on
the Market
Average
Sale Price
2008 573 92 641,739$
2009 0.550% 456 95 645,268$
2010 -0.468% 502 94 642,250$
2011 3.373% 497 85 663,910$
2012 6.118% 547 67 704,527$
2013 14.072% 583 33 803,669$
Source: MLSPIN, as of 3/11/2014; Town = Boston-South End
South End StatisticsCondominiums
Average Sale Price - Number of Bedrooms - 2013
Historical Average Sale Price - Past 6 Years
$641,739 $645,268 $642,250 $663,910 $704,527
$803,669
2008 2009 2010 2011 2012 2013

25
Market stat ist ics
[email protected] | 617-299-1854
Total Sold - South EndCondominiums, Boston - South End, 1/1/2013 - 12/31/2013
# of Avg. Days Average Average SP:LP Average SP:OP
Listings on Market Sale Price List Price Ratio Orig Price Ratio
$150,000 - $199,999 2 60 $184,500 $194,945 95 $194,945 95
$200,000 - $249,999 2 57 $201,475 $210,975 96 $210,975 96
$250,000 - $299,999 10 65 $282,020 $292,090 97 $299,690 94
$300,000 - $349,999 10 73 $330,016 $336,766 98 $347,166 96
$350,000 - $399,999 25 16 $374,826 $375,390 100 $375,790 100
$400,000 - $449,999 48 32 $428,385 $426,983 100 $429,756 100
$450,000 - $499,999 52 29 $473,442 $470,433 101 $474,838 100
$500,000 - $599,999 107 28 $551,124 $544,579 101 $546,508 101
$600,000 - $699,999 67 31 $646,997 $637,742 102 $638,472 102
$700,000 - $799,999 62 30 $748,495 $740,133 101 $752,005 100
$800,000 - $899,999 44 36 $849,370 $841,068 101 $846,255 101
$900,000 - $999,999 21 29 $948,810 $947,905 100 $962,190 99
$1,000,000 - $1,499,999 81 36 $1,195,323 $1,193,546 100 $1,202,879 100
$1,500,000 - $1,999,999 32 32 $1,697,091 $1,697,000 100 $1,717,031 99
$2,000,000 - $2,499,999 12 43 $2,208,625 $2,239,500 99 $2,247,833 98
$2,500,000 - $2,999,999 4 85 $2,647,500 $2,623,500 102 $2,623,500 102
$3,000,000 - $3,999,999 4 64 $3,212,500 $3,218,750 100 $3,212,500 100
Total Properties 583 33 $803,669 $800,115 101 $806,193 100
Source: MLSPIN, as of 3/11/2014
Price Range

26
Range
Number of
Listing Sold
Days on
the Market
Average
Sale Price
2 Units $910,000 - $2,500,000 5 22 1,900,400$
3-4 Units $1,085,000 - $2,550,000 7 18 1,847,600$
5 Units $1,787,500 - $1,787,500 1 34 1,787,500$
Year % Change
Number of
Listing Sold
Days on
the Market
Average
Sale Price
2008 16 89 1,683,984$
2009 -20.322% 13 102 1,341,770$
2010 11.027% 14 187 1,489,732$
2011 -0.093% 14 70 1,488,348$
2012 1.743% 14 39 1,514,286$
2013 23.047% 13 20 1,863,285$
Source: MLSPIN, as of 3/11/2014; Boston - South End
South End StatisticsMultifamily Homes
Average Sale Price - Number of Units in Building - 2013
Historical Average Sale Price - Past 6 Years
$1,683,984
$1,341,770 $1,489,732 $1,488,348 $1,514,286
$1,863,285
2008 2009 2010 2011 2012 2013

27
Market stat ist ics
[email protected] | 617-299-1854
Email [email protected] for up-to-date market statistics for your neighborhood.
Multifamily Homes, Boston - South End, 1/1/2013 - 12/31/2013
# of Avg. Days Average Average SP:LP Average SP:OP
Listings on Market Sale Price List Price Ratio Orig Price Ratio
$900,000 - $999,999 1 13 $910,000 $899,000 101 $899,000 101
$1,000,000 - $1,499,999 2 15 $1,142,500 $1,124,500 102 $1,124,500 102
$1,500,000 - $1,999,999 4 23 $1,768,375 $1,836,000 96 $1,734,750 104
$2,000,000 - $2,499,999 4 14 $2,226,050 $2,112,250 106 $2,112,250 106
$2,500,000 - $2,999,999 2 36 $2,525,000 $2,300,000 111 $2,300,000 111
Total Properties 13 20 $1,863,285 $1,810,846 103 $1,779,692 105
Source: MLSPIN, as of 3/11/2014
Total Sold - South End
Price Range

28
Range
Number of
Listing Sold
Days on
the Market
Average
Sale Price
2 Bed $285,000 - $819,000 21 22 497,195$
3 Bed $295,000 - $1,210,000 19 22 589,947$
4 Bed $205,000 - $948,000 14 31 630,714$
5 Bed $505,000 - $830,000 3 57 671,333$
6-7 Bed $337,000 - $1,200,000 2 41 768,500$
Year % Change
Number of
Listing Sold
Days on
the Market
Average
Sale Price
2008 40 98 467,595$
2009 -24.870% 46 87 351,304$
2010 25.321% 46 53 440,258$
2011 -6.012% 56 100 413,789$
2012 23.168% 45 65 509,657$
2013 13.174% 59 27 576,798$
Source: MLSPIN, as of 3/11/2014; Boston-South Boston
South Boston Statistics
Average Sale Price - Number of Bedrooms - 2013
Historical Average Sale Price - Past 6 Years
Single Family Homes
$467,595
$351,304
$440,258 $413,789
$509,657
$576,798
2008 2009 2010 2011 2012 2013

29
Market stat ist ics
[email protected] | 617-299-1854
Total Sold - South BostonSingle Family Homes, Boston - South Boston, 1/1/2013 - 12/31/2013
# of Avg. Days Average Average SP:LP Average SP:OP
Listings on Market Sale Price List Price Ratio Orig Price Ratio
$200,000 - $249,999 1 4 $205,000 $199,000 103 $199,000 103
$250,000 - $299,999 2 39 $290,000 $311,950 93 $324,000 90
$300,000 - $349,999 2 51 $336,000 $337,000 100 $344,500 98
$350,000 - $399,999 4 37 $377,250 $395,688 96 $411,000 92
$400,000 - $449,999 8 16 $421,500 $424,863 100 $429,975 99
$450,000 - $499,999 7 24 $469,371 $473,571 99 $476,429 99
$500,000 - $599,999 12 21 $541,667 $525,225 103 $528,058 103
$600,000 - $699,999 9 23 $644,167 $644,667 100 $644,667 100
$700,000 - $799,999 5 15 $765,600 $748,200 102 $748,200 102
$800,000 - $899,999 6 60 $820,667 $832,633 99 $855,150 97
$900,000 - $999,999 1 7 $948,000 $899,000 105 $899,000 105
$1,000,000 - $1,499,999 2 27 $1,205,000 $1,249,500 97 $1,499,500 84
Total Properties 59 27 $576,798 $576,831 100 $590,905 99
Source: MLSPIN, as of 3/11/2014
Price Range

30
Range
Number of
Listing Sold
Days on
the Market
Average
Sale Price
0 Bed $225,000 - $450,000 3 12 310,667$
1 Bed $179,000 - $581,000 132 36 325,571$
2 Bed $249,600 - $900,000 430 31 489,031$
3 Bed $215,770 - $860,000 69 30 605,296$
4 Bed $535,000 - $800,000 3 18 673,333$
Year % Change
Number of
Listing Sold
Days on
the Market
Average
Sale Price
2008 419 98 384,955$
2009 -7.459% 457 114 356,240$
2010 2.905% 487 95 366,588$
2011 4.292% 466 102 382,323$
2012 10.689% 589 71 423,189$
2013 10.537% 637 32 467,780$
Source: MLSPIN, as of 3/11/2014; Boston - South Boston
South Boston StatisticsCondominiums
Average Sale Price - Number of Bedrooms - 2013
Historical Average Sale Price - Past 6 Years
$384,955 $356,240 $366,588 $382,323
$423,189
$467,780
2008 2009 2010 2011 2012 2013

31
Market stat ist ics
[email protected] | 617-299-1854
Total Sold - South BostonCondominiums, Boston - South Boston, 1/1/2013 - 12/31/2013
# of Avg. Days Average Average SP:LP Average SP:OP
Listings on Market Sale Price List Price Ratio Orig Price Ratio
$150,000 - $199,999 2 84 $181,500 $189,950 96 $217,000 84
$200,000 - $249,999 16 42 $232,358 $236,942 98 $244,689 95
$250,000 - $299,999 50 62 $274,896 $277,370 99 $281,134 98
$300,000 - $349,999 64 28 $327,091 $327,196 100 $330,124 99
$350,000 - $399,999 78 26 $376,171 $373,669 101 $371,428 1419
$400,000 - $449,999 105 25 $425,096 $422,364 101 $425,364 100
$450,000 - $499,999 78 29 $470,887 $470,230 100 $472,944 100
$500,000 - $599,999 137 29 $544,746 $544,955 100 $545,481 100
$600,000 - $699,999 66 29 $642,798 $643,703 100 $644,915 100
$700,000 - $799,999 29 46 $733,662 $749,828 98 $750,310 98
$800,000 - $899,999 11 30 $843,636 $856,091 99 $858,818 98
$900,000 - $999,999 1 54 $900,000 $939,000 96 $939,000 96
Total Properties 637 32 $467,780 $468,440 100 $470,170 261
Source: MLSPIN, as of 3/11/2014
Price Range

32
Range
Number of
Listing Sold
Days on
the Market
Average
Sale Price
2 Units $415,000 - $2,500,000 26 25 630,039$
3 Units $557,000 - $965,000 10 41 814,900$
4 Units $950,000 - $1,980,500 2 186 1,465,000$
Year % Change
Number of
Listing Sold
Days on
the Market
Average
Sale Price
2008 43 59 557,394$
2009 -9.622% 47 53 503,764$
2010 20.654% 40 30 607,811$
2011 -2.676% 34 50 591,544$
2012 7.944% 21 73 638,536$
2013 14.003% 39 37 727,949$
Source: MLSPIN, as of 3/11/2014; Boston - South Boston
South Boston StatisticsMultifamily Homes
Average Sale Price - Number of Units in Building - 2013
Historical Average Sale Price - Past 6 Years
$557,394 $503,764
$607,811 $591,544 $638,536
$727,949
2008 2009 2010 2011 2012 2013

33
Market stat ist ics
[email protected] | 617-299-1854
Email [email protected] for up-to-date market statistics for your neighborhood.
Multifamily Homes, Boston - South End, 1/1/2013 - 12/31/2013
# of Avg. Days Average Average SP:LP Average SP:OP
Listings on Market Sale Price List Price Ratio Orig Price Ratio
$400,000 - $449,999 2 84 $430,000 $449,500 96 $439,000 98
$450,000 - $499,999 2 16 $490,000 $504,000 97 $514,000 95
$500,000 - $599,999 10 19 $563,450 $578,188 98 $596,188 95
$600,000 - $699,999 7 12 $631,857 $650,571 99 $657,714 98
$700,000 - $799,999 3 36 $743,833 $809,300 92 $842,967 88
$800,000 - $899,999 9 43 $844,447 $806,111 106 $839,556 103
$900,000 - $999,999 5 24 $936,200 $983,800 96 $983,800 96
$1,000,000 - $1,499,999 0 0 $0 $0 0 $0 0
$1,500,000 - $1,999,999 1 353 $1,980,000 $2,350,000 84 $2,650,000 75
Total Properties 39 37 $727,949 $748,584 99 $772,456 97
Source: MLSPIN, as of 3/11/2014
Total Sold - South Boston
Price Range

34
Range
Number of
Listing Sold
Days on
the Market
Average
Sale Price
1-2 Bed $121,000 - $385,000 11 80 276,415$
3 Bed $121,247 - $510,000 34 58 319,773$
4 Bed $95,000 - $622,000 32 72 374,494$
5 Bed $205,000 - $710,000 19 60 395,574$
6 Bed $153,650 - $515,000 19 80 312,490$
7+ Bed $165,000 - $449,000 6 60 308,000$
Year % Change
Number of
Listing Sold
Days on
the Market
Average
Sale Price
2004 181 81 359,458$
2005 6.981% 163 79 384,550$
2006 -6.891% 153 115 358,050$
2007 -5.369% 140 105 338,825$
2008 -13.015% 164 135 294,726$
2009 -8.604% 143 125 269,367$
2010 -2.760% 125 87 261,933$
2011 7.910% 101 92 282,653$
2012 3.702% 125 97 293,116$
2013 16.158% 121 67 340,478$
Source: MLSPIN, as of 3/4/2014; Zip Codes 02121, 02122, 02124, 02125
Dorchester Statistics
Average Sale Price - Number of Bedrooms - 2013
Historical Average Sale Price - Past 10 Years
Single Family Homes
$359,458 $384,550
$358,050 $338,825
$294,726 $269,367 $261,933
$282,653 $293,116
$340,478
2004 2005 2006 2007 2008 2009 2010 2011 2012 2013

35
Market stat ist ics
[email protected] | 617-299-1854
Total Sold - DorchesterSingle Family Homes, Zip Codes 02121, 02122, 02124, 02125 1/1/2013 - 12/31/2013
# of Avg. Days Average Average SP:LP Average SP:OP
Listings on Market Sale Price List Price Ratio Orig Price Ratio
$50,000 - $99,999 1 578 $95,000 $110,000 86 $110,000 86
$100,000 - $149,999 3 72 $124,416 $129,300 105 $134,667 105
$150,000 - $199,999 9 29 $173,950 $179,028 100 $183,483 98
$200,000 - $249,999 10 144 $224,646 $245,130 93 $269,380 86
$250,000 - $299,999 22 70 $278,620 $286,366 98 $289,552 97
$300,000 - $349,999 21 58 $322,298 $337,257 96 $342,733 94
$350,000 - $399,999 19 67 $369,424 $383,237 97 $389,605 95
$400,000 - $449,999 19 42 $420,288 $425,805 99 $430,011 98
$450,000 - $499,999 5 18 $479,500 $483,000 99 $485,000 99
$500,000 - $599,999 9 53 $520,632 $516,111 101 $516,111 101
$600,000 - $699,999 2 107 $611,000 $624,000 98 $624,000 98
$700,000 - $799,999 1 35 $710,000 $740,000 96 $740,000 96
Total Properties 121 67 $340,478 $350,105 98 $355,846 96
Source: MLSPIN, as of 3/4/2014
Price Range

36
Range
Number of
Listing Sold
Days on
the Market
Average
Sale Price
1 Bed $80,500 - $440,000 26 74 242,663$
2 Bed $78,000 - $625,000 227 56 294,543$
3 Bed $50,000 - $525,000 85 67 292,205$
4 Bed $121,101 - $449,500 11 54 323,309$
5 Bed $330,000 - $330,000 1 111 330,000$
Year % Change
Number of
Listing Sold
Days on
the Market
Average
Sale Price
2004 385 59 250,318$
2005 13.372% 458 81 283,790$
2006 -1.843% 467 106 278,559$
2007 -5.342% 371 128 263,678$
2008 -27.144% 413 109 192,105$
2009 -19.742% 442 91 154,180$
2010 16.129% 374 81 179,048$
2011 6.600% 255 86 190,866$
2012 20.266% 296 102 229,547$
2013 26.826% 350 60 291,126$
Source: MLSPIN, as of 3/4/2014; Zip Code 02132
Dorchester StatisticsCondominiums
Average Sale Price - Number of Bedrooms - 2013
Historical Average Sale Price - Past 10 Years
$250,318
$283,790 $278,559 $263,678
$192,105
$154,180 $179,048 $190,866
$229,547
$291,126
2004 2005 2006 2007 2008 2009 2010 2011 2012 2013

37
Market stat ist ics
[email protected] | 617-299-1854
Total Sold - DorchesterCondominums, Zip Codes 02121, 02122, 02124, 02125 1/1/2013 - 12/31/2013
# of
Avg.
Days Average Average SP:LP Average SP:OP
Listings
on
Market Sale Price List Price Ratio Orig Price Ratio
$50,000 - $99,999 12 103 $80,537 $85,458 95 $86,333 94
$100,000 - $149,999 28 91 $125,359 $128,709 99 $137,582 93
$150,000 - $199,999 24 102 $177,079 $182,542 97 $190,987 93
$200,000 - $249,999 36 91 $225,501 $229,347 98 $235,456 96
$250,000 - $299,999 96 54 $276,210 $279,441 99 $281,146 98
$300,000 - $349,999 62 43 $326,334 $327,916 100 $328,884 99
$350,000 - $399,999 48 37 $373,558 $379,742 98 $382,159 98
$400,000 - $449,999 23 27 $426,991 $428,069 100 $430,065 99
$450,000 - $499,999 14 70 $471,321 $477,543 99 $478,971 98
$500,000 - $599,999 6 67 $554,317 $560,292 99 $572,750 97
$600,000 - $699,999 1 20 $625,000 $649,000 96 $649,000 96
Total Properties 350 60 $291,126 $294,839 99 $298,158 97
Source: MLSPIN, as of 3/10/2014
Price Range

38
Range
Number of
Listing Sold
Days on
the Market
Average
Sale Price
2 Units $154,900 - $703,000 114 50 362,049$
3 Units $145,000 - $640,000 157 58 409,478$
4 Units $229,000 - $625,000 10 79 456,500$
5 Units $664,000 - $664,000 1 37 664,000$
6 Units $295,000 - $930,000 7 85 643,571$
7+ Units $800,000 - $3,900,000 5 77 1,820,000$
Year % Change
Number of
Listing Sold
Days on
the Market
Average
Sale Price
2004 449 50 499,848$
2005 4.053% 538 65 520,106$
2006 -4.990% 381 85 494,155$
2007 -14.441% 269 114 422,794$
2008 -33.864% 367 132 279,620$
2009 -10.255% 355 111 250,944$
2010 16.995% 305 68 293,593$
2011 9.013% 243 64 320,056$
2012 8.718% 279 71 347,959$
2013 21.634% 295 57 423,236$
Source: MLSPIN, as of 3/4/2014; Zip Code 02132
Dorchester StatisticsMultifamily Homes
Average Sale Price - Number of Units in Building - 2013
Historical Average Sale Price - Past 10 Years
$499,848 $520,106
$494,155
$422,794
$279,620 $250,944
$293,593 $320,056
$347,959
$423,236
2004 2005 2006 2007 2008 2009 2010 2011 2012

39
Total Sold - DorchesterMultifamily Homes, Zip Codes 02121, 02122, 02124, 02125 1/1/2013 - 12/31/2013
# of
Avg.
Days Average Average SP:LP Average SP:OP
Listings
on
Market Sale Price List Price Ratio Orig Price Ratio
$100,000 - $149,999 1 203 $145,000 $185,000 78 $229,000 63
$150,000 - $199,999 9 53 $178,428 $175,917 103 $175,917 103
$200,000 - $249,999 26 72 $230,150 $230,100 102 $233,957 101
$250,000 - $299,999 23 55 $274,517 $278,842 100 $283,212 98
$300,000 - $349,999 27 66 $323,811 $330,813 98 $331,516 99
$350,000 - $399,999 53 54 $371,419 $381,963 98 $387,630 97
$400,000 - $449,999 53 42 $425,524 $430,096 99 $434,358 99
$450,000 - $499,999 51 64 $470,015 $475,403 99 $490,403 98
$500,000 - $599,999 36 40 $529,228 $531,994 100 $533,661 99
$600,000 - $699,999 7 23 $638,429 $653,979 98 $653,971 98
$700,000 - $799,999 2 385 $714,000 $745,000 96 $787,500 91
$800,000 - $899,999 2 88 $837,500 $887,000 95 $964,500 87
$900,000 - $999,999 1 18 $930,000 $940,000 99 $940,000 99
$1,000,000 - $1,499,999 1 62 $1,150,000 $1,200,000 96 $1,200,000 96
$1,500,000 - $1,999,999 2 55 $1,625,000 $1,472,500 111 $1,472,500 111
$2,000,000 - $2,499,999 0 0 $0 $0 0 $0 0
$2,500,000 - $2,999,999 0 0 $0 $0 0 $0 0
$3,000,000 - $3,999,999 1 44 $3,900,000 $3,900,000 100 $3,900,000 100
Total Properties 295 57 $423,236 $428,337 99 $434,625 98
Source: MLSPIN, as of 3/10/2014
Price Range
Market stat ist ics
[email protected] | 617-299-1854
Email [email protected] for up-to-date market statistics for your neighborhood.

40
Range
Number of
Listing Sold
Days on
the Market
Average
Sale Price
3-4 Bed $320,000 - $523,000 4 48 480,260$
5+ Bed $410,000 - $700,000 4 18 570,000$
Year % Change
Number of
Listing Sold
Days on
the Market
Average
Sale Price
2004 13 51 426,615$
2005 13.594% 18 55 484,609$
2006 -5.845% 7 44 456,286$
2007 11.986% 4 80 510,975$
2008 -28.103% 8 103 367,375$
2009 18.997% 3 88 437,167$
2010 2.635% 8 78 448,688$
2011 -5.037% 14 97 426,087$
2012 9.852% 9 71 468,067$
2013 12.191% 8 33 525,130$
Source: MLSPIN, as of 3/4/2014; Zip Code 02134
Allston Statistics
Average Sale Price - Number of Bedrooms - 2013
Historical Average Sale Price - Past 10 Years
Single Family Homes
$426,615
$484,609 $456,286
$510,975
$367,375
$437,167 $448,688 $426,087
$468,067
$525,130
2004 2005 2006 2007 2008 2009 2010 2011 2012 2013

41
Market stat ist ics
[email protected] | 617-299-1854
Total Sold - AllstonSingle Family Homes, Zip Code 02134, 1/1/2013 - 12/31/2013
# of Avg. Days Average Average SP:LP Average SP:OP
Listings
on
Market Sale Price List Price Ratio Orig Price Ratio
$350,000 - $399,999 1 160 $360,000 $389,000 93 $399,000 90
$400,000 - $449,999 2 11 $410,000 $429,250 96 $429,250 96
$450,000 - $499,999 0 0 $0 $0 0 $0 0
$500,000 - $599,999 2 38 $535,019 $549,000 97 $549,000 97
$600,000 - $699,999 2 4 $625,500 $573,500 109 $573,500 109
$700,000 - $799,999 1 1 $700,000 $699,000 100 $699,000 100
Total Properties 8 33 $525,130 $523,938 100 $525,188 99
Source: MLSPIN, as of 3/4/2014
Price Range

42
Range
Number of
Listing Sold
Days on
the Market
Average
Sale Price
0 Bed $117,000 - $175,000 4 19 154,125$
1 Bed $127,000 - $385,000 31 33 247,203$
2 Bed $172,000 - $520,000 59 24 344,350$
3+ Bed $245,000 - $485,000 8 27 362,875$
Year % Change
Number of
Listing Sold
Days on
the Market
Average
Sale Price
2004 142 38 273,209$
2005 9.288% 148 46 298,585$
2006 0.067% 112 123 298,784$
2007 -3.663% 109 83 287,840$ 2008 8.145% 80 79 311,285$
2009 -2.130% 83 98 304,655$
2010 -16.176% 76 89 255,375$
2011 13.409% 74 71 289,618$
2012 -8.827% 80 58 264,053$
2013 19.209% 85 27 314,776$
Source: MLSPIN, as of 3/4/2014; Zip Code 02134
Allston StatisticsCondominiums
Average Sale Price - Number of Bedrooms - 2013
Historical Average Sale Price - Past 10 Years
$273,209 $298,585 $298,784 $287,840
$311,285 $304,655
$255,375
$289,618 $264,053
$314,776
2004 2005 2006 2007 2008 2009 2010 2011 2012 2013

43
Market stat ist ics
[email protected] | 617-299-1854
Total Sold - AllstonCondominiums, Zip Code 02134, 1/1/2013 - 12/31/2013
# of Avg. Days Average Average SP:LP Average SP:OP
Listings
on
Market Sale Price List Price Ratio Orig Price Ratio
$100,000 - $149,999 2 24 $122,000 $123,450 99 $127,450 96
$150,000 - $199,999 9 62 $178,600 $181,144 99 $182,256 98
$200,000 - $249,999 17 26 $230,647 $233,229 99 $234,847 98
$250,000 - $299,999 24 20 $276,529 $277,217 100 $277,504 100
$300,000 - $349,999 14 37 $324,955 $322,869 101 $321,536 101
$350,000 - $399,999 20 21 $367,950 $368,225 100 $368,625 100
$400,000 - $449,999 8 14 $418,750 $404,475 104 $404,475 104
$450,000 - $499,999 6 18 $468,667 $456,417 103 $461,500 102
$500,000 - $599,999 2 7 $510,000 $499,450 102 $499,450 102
Total Properties 102 27 $308,818 $307,384 100 $308,092 100
Source: MLSPIN, as of 3/4/2014
Price Range

44
Range
Number of
Listing Sold
Days on
the Market
Average
Sale Price
2 Units $301,500 - $1,250,000 13 22 667,385$
3 Units $690,000 - $1,195,000 7 14 870,000$
Year % Change
Number of
Listing Sold
Days on
the Market
Average
Sale Price
2004 34 67 706,143$
2005 8.742% 32 45 767,875$
2006 -18.210% 27 84 628,046$
2007 3.181% 19 82 648,026$
2008 8.671% 11 70 704,218$
2009 -1.742% 20 69 691,950$
2010 -26.509% 17 158 508,524$
2011 35.709% 18 53 690,111$
2012* 1.748% 20 48 702,175$
2013 5.145% 20 19 738,300$
Source: MLSPIN, as of 3/4/2014; Zip Code 02134
*2012 data includes only multifamily properties that sold for $3,000,000 or less.
Allston StatisticsMultifamily Homes
Average Sale Price - Number of Units in Building - 2013
Historical Average Sale Price - Past 10 Years
$706,143 $767,875
$628,046 $648,026 $704,218 $691,950
$508,524
$690,111 $702,175 $738,300
2004 2005 2006 2007 2008 2009 2010 2011 2012* 2013

45
Market stat ist ics
[email protected] | 617-299-1854
Total Sold - AllstonMultifamily Homes, Zip Code 02134, 1/1/2013 - 12/31/2013
# of Avg. Days Average Average SP:LP Average SP:OP
Listings on Market Sale Price List Price Ratio Orig Price Ratio
$300,000 - $349,999 1 55 $301,500 $324,900 93 $379,900 79
$350,000 - $399,999 0 0 $0 $0 0 $0 0
$400,000 - $449,999 1 4 $435,000 $449,000 97 $449,000 97
$450,000 - $499,999 1 4 $485,000 $499,000 97 $499,000 97
$500,000 - $599,999 1 16 $540,000 $549,000 98 $549,000 98
$600,000 - $699,999 6 35 $664,750 $660,817 101 $655,817 102
$700,000 - $799,999 4 9 $777,500 $708,750 110 $708,750 110
$800,000 - $899,999 2 19 $818,000 $837,000 98 $852,000 96
$900,000 - $999,999 2 8 $912,500 $925,000 99 $925,000 99
$1,000,000 - $1,499,999 2 4 $1,222,500 $1,222,500 100 $1,222,500 100
Total Properties 20 19 $738,300 $729,540 101 $732,290 101
Source: MLSPIN, as of 3/4/2014
Price Range
Email [email protected] for up-to-date market statistics for your neighborhood.

46
Range
Number of
Listing Sold
Days on
the Market
Average
Sale Price
2-3 Bed $260,000 - $750,000 24 34 477,682$
4 Bed $360,800 - $650,000 9 34 557,687$
5 Bed $525,000 - $730,000 2 48 627,500$
6+ Bed $545,000 - $575,000 2 38 560,000$
Year % Change
Number of
Listing Sold
Days on
the Market
Average
Sale Price
2004 56 46 474,540$
2005 7.196% 54 79 508,689$
2006 -10.146% 36 74 457,075$
2007 4.169% 43 99 476,130$
2008 0.259% 22 91 477,364$
2009 -12.940% 30 54 415,594$
2010 1.133% 28 97 420,304$
2011 -4.926% 23 87 399,600$
2012 16.309% 33 44 464,770$
2013 9.665% 37 35 509,691$
Source: MLSPIN, as of 3/4/2014; Zip Code 02135
Brighton Statistics
Average Sale Price - Number of Bedrooms - 2013
Historical Average Sale Price - Past 10 Years
Single Family Homes
$474,540 $508,689
$457,075 $476,130 $477,364
$415,594 $420,304 $399,600
$464,770
2004 2005 2006 2007 2008 2009 2010 2011 2012

47
Market stat ist ics
[email protected] | 617-299-1854
Total Sold - BrightonSingle Family Homes, Zip Code 02135, 1/1/2013 - 12/31/2013
# of Avg. Days Average Average SP:LP Average SP:OP
Listings
on
Market Sale Price List Price Ratio Orig Price Ratio
$250,000 - $299,999 1 22 $260,000 $199,000 131 $199,000 131
$300,000 - $349,999 0 0 $0 $0 0 $0 0
$350,000 - $399,999 2 69 $368,088 $387,000 95 $392,000 94
$400,000 - $449,999 10 39 $425,650 $428,920 99 $432,610 98
$450,000 - $499,999 5 47 $469,300 $468,200 101 $473,400 100
$500,000 - $599,999 12 26 $551,032 $552,800 100 $554,467 100
$600,000 - $699,999 5 35 $633,400 $636,780 100 $640,780 99
$700,000 - $799,999 2 6 $740,000 $704,000 105 $704,000 105
Total Properties 37 35 $509,691 $508,884 101 $511,935 100
Source: MLSPIN, as of 3/4/2014
Price Range

48
Range
Number of
Listing Sold
Days on
the Market
Average
Sale Price
0 Bed $139,500 - $218,000 11 29 180,427$
1 Bed $127,500 - $400,000 129 24 244,417$
2 Bed $185,000 - $559,000 162 32 341,211$
3 Bed $270,000 - $795,000 43 33 452,615$
4-5 Bed $290,888 - $675,000 9 48 428,738$
Year % Change
Number of
Listing Sold
Days on
the Market
Average
Sale Price
2004 551 37 264,833$
2005 8.096% 513 46 286,273$
2006 -0.959% 393 87 283,527$
2007 -2.669% 358 73 275,961$
2008 2.433% 274 86 282,675$
2009 -4.380% 233 75 270,294$
2010 -0.494% 257 83 268,958$
2011 -4.864% 248 91 255,877$
2012 5.049% 277 55 268,797$
2013 17.821% 354 29 316,700$
Source: MLSPIN, as of 3/4/2014; Zip Code 02135
Brighton StatisticsCondominiums
Average Sale Price - Number of Bedrooms - 2013
Historical Average Sale Price - Past 10 Years
$264,833 $286,273 $283,527 $275,961 $282,675
$270,294 $268,958 $255,877
$268,797
$316,700
2004 2005 2006 2007 2008 2009 2010 2011 2012 2013

49
Market stat ist ics
[email protected] | 617-299-1854
Total Sold - BrightonCondominiums, Zip Code 02135, 1/1/2013 - 12/31/2013
# of Avg. Days Average Average SP:LP Average SP:OP
Listings on Market Sale Price List Price Ratio Orig Price Ratio
$100,000 - $149,999 2 9 $133,500 $141,250 95 $141,250 95
$150,000 - $199,999 24 39 $178,129 $180,454 99 $183,368 97
$200,000 - $249,999 77 20 $229,083 $227,686 101 $228,479 100
$250,000 - $299,999 74 34 $272,536 $272,845 100 $274,698 100
$300,000 - $349,999 67 31 $321,222 $313,606 103 $314,838 102
$350,000 - $399,999 50 30 $373,707 $369,318 101 $371,730 101
$400,000 - $449,999 25 24 $415,726 $415,904 100 $416,500 100
$450,000 - $499,999 15 31 $466,754 $471,699 99 $473,633 99
$500,000 - $599,999 10 47 $533,020 $536,280 99 $541,190 99
$600,000 - $699,999 7 38 $650,821 $656,557 99 $669,286 97
$700,000 - $799,999 3 8 $758,333 $752,333 101 $752,333 101
Total Properties 354 29 $316,700 $314,977 101 $316,823 100
Source: MLSPIN, as of 3/4/2014
Price Range

50
Range
Number of
Listing Sold
Days on
the Market
Average
Sale Price
2 Units $400,000 - $1,500,000 30 37 720,688$
3 Units $690,500 - $1,275,000 8 10 912,063$
4-5 Units $820,000 - $1,300,000 4 28 1,090,750$
Year % Change
Number of
Listing Sold
Days on
the Market
Average
Sale Price
2004 64 42 685,138$
2005 3.033% 72 51 705,921$
2006 -8.698% 70 83 644,519$
2007 2.339% 40 88 659,594$
2008 -3.364% 38 98 637,405$
2009 -9.272% 28 73 578,307$
2010 3.362% 40 60 597,748$
2011 13.534% 29 89 678,649$
2012 4.676% 52 42 710,383$
2013 11.543% 42 31 792,384$
Source: MLSPIN, as of 3/4/2014; Zip Code 02135
Brighton StatisticsMultifamily Homes
Average Sale Price - Number of Units in Building - 2013
Historical Average Sale Price - Past 10 Years
$685,138 $705,921 $644,519 $659,594 $637,405
$578,307 $597,748
$678,649 $710,383
$792,384
2004 2005 2006 2007 2008 2009 2010 2011 2012 2013

51
Market stat ist ics
[email protected] | 617-299-1854
Email [email protected] for up-to-date market statistics for your neighborhood.
Total Sold - BrightonMultifamily Homes, Zip Code 02135, 1/1/2013 - 12/31/2013
# of Avg. Days Average Average SP:LP Average SP:OP
Listings
on
Market Sale Price List Price Ratio Orig Price Ratio
$400,000 - $449,999 2 50 $422,500 $444,900 95 $449,900 94
$450,000 - $499,999 1 159 $455,000 $499,000 91 $499,000 91
$500,000 - $599,999 4 25 $585,000 $581,975 101 $606,975 97
$600,000 - $699,999 10 33 $653,700 $654,990 100 $659,840 99
$700,000 - $799,999 10 26 $731,913 $730,670 100 $736,670 100
$800,000 - $899,999 5 11 $813,200 $809,580 101 $809,580 101
$900,000 - $999,999 2 65 $960,000 $969,000 99 $974,000 99
$1,000,000 - $1,499,999 7 18 $1,185,429 $1,146,429 106 $1,153,571 106
$1,500,000 - $1,999,999 1 40 $1,500,000 $1,595,000 94 $1,595,000 94
Total Properties 42 31 $792,384 $789,384 101 $796,612 100
Source: MLSPIN, as of 3/4/2014
Price Range

52
Range
Number of
Listing Sold
Days on
the Market
Average
Sale Price
2 Bed $121,000 - $385,000 10 80 285,056$
3 Bed $121,247 - $510,000 34 58 319,773$
4 Bed $95,000 - $622,000 32 72 374,494$
5 Bed $205,000 - $710,000 19 60 395,574$
6+ Bed $153,650 - $515,000 25 75 311,412$
Year % Change
Number of
Listing Sold
Days on
the Market
Average
Sale Price
2004 78 52 576,024$
2005 1.749% 80 61 586,098$
2006 -0.450% 84 97 583,463$
2007 -4.277% 76 88 558,507$
2008 5.100% 60 78 586,992$
2009 -4.130% 73 74 562,748$
2010 6.190% 61 72 597,584$
2011 6.143% 49 91 634,296$
2012 -5.972% 70 49 596,419$
2013 19.999% 74 49 715,695$
Source: MLSPIN, as of 3/4/2014; Zip Code 02130
Jamaica Plain Statistics
Average Sale Price - Number of Bedrooms - 2013
Historical Average Sale Price - Past 10 Years
Single Family Homes
$576,024 $586,098 $583,463 $558,507 $586,992 $562,748
$597,584 $634,296
$596,419
$715,695
2004 2005 2006 2007 2008 2009 2010 2011 2012 2013

53
Market stat ist ics
[email protected] | 617-299-1854
Total Sold - Jamaica PlainSingle Family Homes, Zip Code 02130, 1/1/2013 - 12/31/2013
# of Avg. Days Average Average SP:LP Average SP:OP
Listings
on
Market Sale Price List Price Ratio Orig Price Ratio
$300,000 - $349,999 1 45 $300,000 $319,900 94 $319,900 94
$350,000 - $399,999 4 225 $367,250 $355,975 104 $389,675 96
$400,000 - $449,999 9 26 $425,000 $416,644 102 $416,644 102
$450,000 - $499,999 6 18 $473,667 $465,533 102 $465,533 102
$500,000 - $599,999 16 38 $546,375 $535,163 102 $540,731 101
$600,000 - $699,999 14 26 $654,857 $641,700 102 $649,986 101
$700,000 - $799,999 6 65 $723,983 $724,300 100 $728,317 99
$800,000 - $899,999 3 8 $848,000 $806,333 105 $806,333 105
$900,000 - $999,999 4 17 $949,500 $918,000 104 $918,000 104
$1,000,000 - $1,499,999 7 84 $1,157,071 $1,116,857 104 $1,126,857 103
$1,500,000 - $1,999,999 2 30 $1,837,500 $1,712,000 108 $1,899,500 99
$2,000,000 - $2,499,999 2 125 $2,077,500 $2,247,450 93 $2,247,450 93
Total Properties 74 49 $715,695 $702,796 102 $713,728 101
Source: MLSPIN, as of 3/4/2014
Price Range

54
Range
Number of
Listing Sold
Days on
the Market
Average
Sale Price
0-1 Bed $150,000 - $630,000 69 31 258,206$
2 Bed $160,000 - $685,000 221 31 371,462$
3 Bed $210,000 - $1,050,000 128 33 504,628$
4 Bed $403,500 - $1,310,000 8 33 629,125$
5-6 Bed $505,000 - $1,285,000 7 45 747,929$
Year % Change
Number of
Listing Sold
Days on
the Market
Average
Sale Price
2004 437 46 337,917$
2005 2.979% 497 49 347,982$
2006 -0.188% 404 85 347,329$
2007 7.802% 432 78 374,426$
2008 -1.597% 325 90 368,446$
2009 -5.363% 322 87 348,685$
2010 1.175% 325 78 352,781$
2011 -1.071% 303 86 349,004$
2012 4.227% 384 68 363,755$
2013 11.281% 433 32 404,790$
Source: MLSPIN, as of 3/4/2014; Zip Code 02132
Jamaica Plain StatisticsCondominiums
Average Sale Price - Number of Bedrooms - 2013
Historical Average Sale Price - Past 10 Years
$337,917 $347,982 $347,329
$374,426 $368,446
$348,685 $352,781 $349,004
$363,755
$404,790
2004 2005 2006 2007 2008 2009 2010 2011 2012 2013

55
Market stat ist ics
[email protected] | 617-299-1854
Total Sold - Jamaica PlainCondominiums, Zip Code 02130, 1/1/2013 - 12/31/2013
# of Avg. Days Average Average SP:LP Average SP:OP
Listings on Market Sale Price List Price Ratio Orig Price Ratio
$150,000 - $199,999 16 39 $171,450 $174,238 98 $178,025 97
$200,000 - $249,999 35 27 $228,127 $227,330 101 $229,541 100
$250,000 - $299,999 50 34 $273,700 $271,574 101 $274,154 100
$300,000 - $349,999 85 23 $326,889 $321,389 102 $321,379 102
$350,000 - $399,999 66 34 $373,420 $368,711 101 $371,150 101
$400,000 - $449,999 50 30 $426,231 $418,292 102 $422,172 101
$450,000 - $499,999 43 43 $473,256 $459,053 103 $462,498 103
$500,000 - $599,999 42 37 $545,551 $531,598 103 $655,431 100
$600,000 - $699,999 25 36 $642,460 $630,535 102 $640,139 101
$700,000 - $799,999 13 27 $746,308 $734,831 102 $734,831 102
$800,000 - $899,999 2 17 $817,000 $769,450 106 $769,450 106
$900,000 - $999,999 3 36 $937,667 $905,667 104 $905,667 104
$1,000,000 - $1,499,999 3 89 $1,215,000 $1,214,667 100 $1,281,333 96
Total Properties 433 32 $404,790 $397,628 102 $412,433 101
Source: MLSPIN, as of 3/4/2014
Price Range

56
Range
Number of
Listing Sold
Days on
the Market
Average
Sale Price
2 Units $335,000 - $1,700,000 22 31 758,159$
3 Units $395,000 - $1,590,000 22 17 813,367$
4 Units $455,000 - $1,600,000 3 20 1,134,667$
5 Units - - - -
6 Units $1,435,000 - $1,505,000 2 19 1,470,000$
Year % Change
Number of
Listing Sold
Days on
the Market
Average
Sale Price
2004 68 43 611,878$
2005 -0.429% 63 51 609,254$
2006 13.027% 48 78 688,620$
2007 -13.726% 53 81 594,103$
2008 -11.500% 42 81 525,779$
2009 -10.308% 27 113 471,584$
2010 15.842% 31 49 546,290$
2011 12.780% 32 44 616,106$
2012 5.852% 53 54 652,163$
2013 28.044% 49 23 835,053$
Source: MLSPIN, as of 2/10/2014; Zip Code 02132
Jamaica Plain StatisticsMultifamily Homes
Average Sale Price - Number of Units in Building - 2013
Historical Average Sale Price - Past 10 Years
$611,878 $609,254
$688,620
$594,103 $525,779
$471,584 $546,290
$616,106 $652,163
$835,053
2004 2005 2006 2007 2008 2009 2010 2011 2012

57
Market stat ist ics
[email protected] | 617-299-1854
Email [email protected] for up-to-date market statistics for your neighborhood.
Multifamily Homes, Zip Code 02130, 1/1/2013 - 12/31/2013
# of Avg. Days Average Average SP:LP Average SP:OP
Listings on Market Sale Price List Price Ratio Orig Price Ratio
$300,000 - $349,999 1 92 $335,000 $349,900 96 $369,000 91
$350,000 - $399,999 1 0 $395,000 $799,000 49 $799,000 49
$400,000 - $449,999 0 0 $0 $0 0 $0 0
$450,000 - $499,999 2 25 $470,000 $465,000 102 $465,000 102
$500,000 - $599,999 8 21 $557,875 $535,525 105 $543,138 104
$600,000 - $699,999 9 25 $640,556 $610,733 106 $618,511 105
$700,000 - $799,999 6 30 $736,764 $690,000 107 $695,000 107
$800,000 - $899,999 8 12 $843,000 $779,738 109 $779,738 109
$900,000 - $999,999 4 26 $959,125 $911,500 105 $911,500 105
$1,000,000 - $1,499,999 6 22 $1,270,583 $1,191,317 109 $1,191,317 109
$1,500,000 - $1,999,999 4 23 $1,598,750 $1,343,500 129 $1,343,500 129
Total Properties 49 23 $835,053 $783,786 107 $787,459 107
Source: MLSPIN, as of 3/4/2014
Total Sold - Jamaica Plain
Price Range

58
Range
Number of
Listing Sold
Days on
the Market
Average
Sale Price
1-2 Bed $227,650 - $350,000 8 44 289,706$
3 Bed $220,000 - $603,000 57 34 389,001$
4 Bed $198,000 - $730,888 45 55 434,456$
5 Bed $180,000 - $705,000 16 44 461,500$
6 Bed $425,000 - $555,000 2 95 490,000$
Year % Change
Number of
Listing Sold
Days on
the Market
Average
Sale Price
2003 154 59 346,478$
2004 13.461% 187 48 393,119$
2005 0.636% 153 53 395,621$
2006 -3.157% 126 86 383,131$
2007 1.088% 140 103 387,301$
2008 -5.086% 101 91 367,601$
2009 -8.377% 96 72 336,808$
2010 0.453% 105 83 338,335$
2011 -1.891% 87 99 331,938$
2012 23.341% 128 44 409,416$
Source: MLSPIN, as of 3/4/2014; Zip Code 02131
Roslindale Statistics
Average Sale Price - Number of Bedrooms - 2013
Historical Average Sale Price - Past 10 Years
Single Family Homes
$346,478
$393,119 $395,621 $383,131 $387,301 $367,601
$336,808 $338,335 $331,938
$409,416
2003 2004 2005 2006 2007 2008 2009 2010 2011 2012

59
Market stat ist ics
[email protected] | 617-299-1854
Total Sold - RoslindaleSingle Family Homes, Zip Code 02131, 1/1/2013 - 12/31/2013
# of Avg. Days Average Average SP:LP Average SP:OP
Listings on Market Sale Price List Price Ratio Orig Price Ratio
$150,000 - $199,999 2 12 $189,000 $212,450 90 $212,450 90
$200,000 - $249,999 4 147 $228,413 $235,550 97 $258,475 89
$250,000 - $299,999 16 83 $274,775 $284,697 97 $297,113 93
$300,000 - $349,999 18 55 $325,847 $334,617 98 $341,328 96
$350,000 - $399,999 17 15 $372,235 $374,141 100 $383,553 98
$400,000 - $449,999 27 43 $418,456 $421,481 100 $426,811 98
$450,000 - $499,999 17 39 $471,000 $465,512 102 $469,976 101
$500,000 - $599,999 21 25 $539,892 $527,633 103 $529,819 102
$600,000 - $699,999 4 17 $611,250 $570,950 108 $570,950 108
$700,000 - $799,999 2 28 $717,944 $729,450 98 $729,450 98
Total Properties 128 44 $409,416 $409,550 100 $416,088 98
Source: MLSPIN, as of 3/4/2014
Price Range

60
Range
Number of
Listing Sold
Days on
the Market
Average
Sale Price
1 Bed $104,000 - $302,500 11 58 185,338$
2 Bed $95,000 - $557,000 98 59 286,708$
3 Bed $209,000 - $480,500 38 54 328,847$
4-5 Bed $115,000 - $470,000 5 44 368,900$
Year % Change
Number of
Listing Sold
Days on
the Market
Average
Sale Price
2004 165 49 299,019$
2005 3.218% 172 66 308,641$
2006 -9.943% 137 99 277,953$
2007 8.718% 105 94 302,186$
2008 -11.803% 97 103 266,519$
2009 -7.021% 131 101 247,806$
2010 2.964% 105 91 255,151$
2011 0.256% 95 120 255,803$
2012 -3.564% 91 93 246,687$
2013 18.616% 152 57 292,611$
Source: MLSPIN, as of 3/4/2014; Zip Code 02131
Roslindale StatisticsCondominiums
Average Sale Price - Number of Bedrooms - 2013
Historical Average Sale Price - Past 10 Years
$299,019 $308,641
$277,953 $302,186
$266,519 $247,806 $255,151 $255,803 $246,687
$292,611
2004 2005 2006 2007 2008 2009 2010 2011 2012 2013

61
Market stat ist ics
[email protected] | 617-299-1854
Total Sold - RoslindaleSingle Family Homes, Zip Code 02131, 1/1/2013 - 12/31/2013
# of Avg. Days Average Average SP:LP Average SP:OP
Listings on Market Sale Price List Price Ratio Orig Price Ratio
$150,000 - $199,999 2 12 $189,000 $212,450 90 $212,450 90
$200,000 - $249,999 4 147 $228,413 $235,550 97 $258,475 89
$250,000 - $299,999 16 83 $274,775 $284,697 97 $297,113 93
$300,000 - $349,999 18 55 $325,847 $334,617 98 $341,328 96
$350,000 - $399,999 17 15 $372,235 $374,141 100 $383,553 98
$400,000 - $449,999 27 43 $418,456 $421,481 100 $426,811 98
$450,000 - $499,999 17 39 $471,000 $465,512 102 $469,976 101
$500,000 - $599,999 21 25 $539,892 $527,633 103 $529,819 102
$600,000 - $699,999 4 17 $611,250 $570,950 108 $570,950 108
$700,000 - $799,999 2 28 $717,944 $729,450 98 $729,450 98
Total Properties 128 44 $409,416 $409,550 100 $416,088 98
Source: MLSPIN, as of 3/4/2014
Price Range

62
Range
Number of
Listing Sold
Days on
the Market
Average
Sale Price
2 Units $320,000 - $690,000 22 46 465,541$
3 Units $510,000 - $740,000 14 30 581,571$
Year % Change
Number of
Listing Sold
Days on
the Market
Average
Sale Price
2004 51 41 504,808$
2005 4.667% 80 54 528,367$
2006 -4.783% 61 62 503,093$
2007 -7.516% 49 98 465,282$
2008 -24.273% 50 141 352,346$
2009 -7.535% 51 78 325,797$
2010 10.565% 41 55 360,217$
2011 2.741% 44 72 370,092$
2012 9.281% 50 79 404,442$
2013 26.264% 36 40 510,664$
Source: MLSPIN, as of 3/4/2014; Zip Code 02131
Roslindale StatisticsMultifamily Homes
Average Sale Price - Number of Units in Building - 2012
Historical Average Sale Price - Past 10 Years
$504,808 $528,367
$503,093 $465,282
$352,346 $325,797
$360,217 $370,092 $404,442
$510,664
2004 2005 2006 2007 2008 2009 2010 2011 2012 2013

63
Market stat ist ics
[email protected] | 617-299-1854
Multifamily Homes, Zip Code 02131, 1/1/2013 - 12/31/2013
# of Avg. Days Average Average SP:LP Average SP:OP
Listings
on
Market Sale Price List Price Ratio Orig Price Ratio
$300,000 - $349,999 1 44 $320,000 $325,000 98 $325,000 98
$350,000 - $399,999 8 57 $385,300 $400,825 96 $410,950 94
$400,000 - $449,999 4 7 $411,000 $425,500 97 $425,500 97
$450,000 - $499,999 2 100 $465,000 $499,000 93 $524,450 89
$500,000 - $599,999 13 45 $547,231 $547,969 100 $549,123 100
$600,000 - $699,999 7 14 $650,500 $622,257 105 $622,257 105
Total Properties 36 40 $510,664 $514,056 99 $518,136 98
Source: MLSPIN, as of 3/4/2014
Total Sold - Roslindale
Price Range
Email [email protected] for up-to-date market statistics for your neighborhood.

64
Range
Number of
Listing Sold
Days on
the Market
Average
Sale Price
1-2 Bed $219,500 - $380,000 25 40 317,140$
3 Bed $210,000 - $753,800 135 48 423,659$
4 Bed $225,000 - $890,000 69 59 499,290$
5-6 Bed $350,000 - $875,000 13 89 575,746$
Year % Change
Number of
Listing Sold
Days on
the Market
Average
Sale Price
2004 231 53 446,518$
2005 7.916% 215 65 481,866$
2006 -11.732% 220 94 425,332$
2007 2.946% 239 92 437,864$
2008 -6.773% 183 79 408,207$
2009 -1.191% 197 84 403,344$
2010 7.386% 195 80 433,135$
2011 -4.317% 189 80 414,437$
2012 0.794% 238 86 417,728$
2013 5.277% 251 51 439,773$
Source: MLSPIN, as of 02/28/2014; Zip Code 02132
West Roxbury Statistics
Average Sale Price - Number of Bedrooms - 2013
Historical Average Sale Price - Past 10 Years
Single Family Homes
$446,518
$481,866
$425,332
$437,864
$408,207 $403,344
$433,135
$414,437 $417,728
$439,773
2004 2005 2006 2007 2008 2009 2010 2011 2012 2013

65
Market stat ist ics
[email protected] | 617-299-1854
Total Sold - West RoxburySingle Family Homes, Zip Code 02132, 1/1/2013 - 12/31/2013
# of Avg. Days Average Average SP:LP Average SP:OP
Listings
on
Market Sale Price List Price Ratio Orig Price Ratio
$200,000 - $249,999 5 90 $224,900 $231,680 97 $271,680 90
$250,000 - $299,999 12 93 $273,333 $279,617 98 $288,292 96
$300,000 - $349,999 39 61 $324,478 $328,544 99 $332,956 98
$350,000 - $399,999 48 37 $372,569 $377,835 99 $382,148 98
$400,000 - $449,999 50 51 $424,210 $425,708 100 $433,346 98
$450,000 - $499,999 29 51 $473,934 $475,300 100 $481,710 99
$500,000 - $599,999 45 36 $545,556 $547,209 100 $550,567 99
$600,000 - $699,999 16 73 $648,113 $650,681 100 $656,556 99
$700,000 - $799,999 4 46 $746,200 $766,475 97 $766,725 97
$800,000 - $899,999 3 39 $860,500 $859,000 100 $871,000 99
Total Properties 251 51 $439,773 $443,069 99 $449,177 98
Source: MLSPIN, as of 02/28/2014
Price Range

66
Range
Number of
Listing Sold
Days on
the Market
Average
Sale Price
1 Bed $85,500 - $289,000 28 100 190,616$
2 Bed $140,000 - $440,000 46 76 267,470$
3 Bed $265,000 - $602,000 8 64 436,313$
4 Bed $335,900 - $698,000 6 49 460,650$
Year % Change
Number of
Listing Sold
Days on
the Market
Average
Sale Price
2004 88 49 266,063$
2005 8.890% 96 60 289,717$
2006 -4.865% 62 101 275,621$
2007 -2.182% 72 116 269,607$
2008 1.411% 66 132 273,412$
2009 -5.326% 85 129 258,849$
2010 0.379% 52 117 259,829$
2011 -4.432% 61 100 248,314$
2012 10.321% 118 91 273,942$
2013 -0.878% 88 81 271,537$
Source: MLSPIN, as of 2/10/2014; Zip Code 02132
West Roxbury StatisticsCondominiums
Average Sale Price - Number of Bedrooms - 2013
Historical Average Sale Price - Past 10 Years
$266,063
$289,717
$275,621 $269,607
$273,412
$258,849 $259,829
$248,314
$273,942 $271,537
2004 2005 2006 2007 2008 2009 2010 2011 2012 2013

67
Market stat ist ics
[email protected] | 617-299-1854
Total Sold - West RoxburyCondominiums, Zip Code 02132, 1/1/2013 - 12/31/2013
# of Avg. Days Average Average SP:LP Average SP:OP
Listings
on
Market Sale Price List Price Ratio Orig Price Ratio
$50,000 - $99,999 1 80 $85,500 $94,000 91 $99,000 86
$100,000 - $149,999 7 78 $121,857 $134,343 91 $138,514 88
$150,000 - $199,999 23 127 $168,641 $173,161 98 $178,396 96
$200,000 - $249,999 8 68 $229,688 $232,600 99 $236,725 97
$250,000 - $299,999 18 82 $274,328 $281,289 98 $289,961 95
$300,000 - $349,999 14 42 $323,979 $328,221 99 $329,357 98
$350,000 - $399,999 7 48 $373,057 $377,871 99 $386,729 97
$400,000 - $449,999 3 56 $431,333 $439,633 98 $439,633 98
$450,000 - $499,999 3 32 $465,667 $466,000 100 $466,000 100
$500,000 - $599,999 2 111 $582,250 $599,900 97 $599,900 97
$600,000 - $699,999 2 65 $650,000 $684,000 95 $689,500 94
Total Properties 88 81 $271,537 $278,023 97 $282,939 96
Source: MLSPIN, as of 2/10/2014
Price Range

68
Range
Number of
Listing Sold
Days on
the Market
Average
Sale Price
2 Units $353,000 - $665,000 17 65 492,647$
3 Units $480,000 - $664,500 4 66 556,594$
Year % Change
Number of
Listing Sold
Days on
the Market
Average
Sale Price
2004 25 40 506,552$
2005 10.149% 40 59 557,964$
2006 -7.937% 30 79 513,681$
2007 -3.914% 24 99 493,578$
2008 -10.247% 14 119 443,000$
2009 -4.325% 18 115 423,839$
2010 9.181% 20 92 462,750$
2011 -7.230% 18 72 429,294$
2012 1.595% 22 68 436,142$
2013 15.748% 21 65 504,827$
Source: MLSPIN, as of 2/10/2014; Zip Code 02132
West Roxbury StatisticsMultifamily Homes
Average Sale Price - Number of Units in Building - 2013
Historical Average Sale Price - Past 10 Years
$506,552
$557,964 $513,681 $493,578
$443,000 $423,839 $462,750
$429,294 $436,142
$504,827
2004 2005 2006 2007 2008 2009 2010 2011 2012 2013

69
Market stat ist ics
[email protected] | 617-299-1854
Email [email protected] for up-to-date market statistics for your neighborhood.
Multifamily Homes, Zip Code 02132, 1/1/2013 - 12/31/2013
# of Avg. Days Average Average SP:LP Average SP:OP
Listings
on
Market Sale Price List Price Ratio Orig Price Ratio
$350,000 - $399,999 2 201 $356,500 $374,500 96 $379,500 94
$400,000 - $449,999 3 139 $412,000 $439,000 94 $482,633 86
$450,000 - $499,999 5 26 $468,600 $450,560 105 $450,560 105
$500,000 - $599,999 7 45 $537,411 $538,943 100 $541,800 100
$600,000 - $699,999 4 24 $636,875 $590,825 109 $590,825 109
Total Properties 21 65 $504,827 $497,843 102 $505,505 100
Source: MLSPIN, as of 2/10/2014
Total Sold - West Roxbury
Price Range

70
www.Dwell360.com [email protected]
617-299-1854
Dwell360 46 Austin Street Suite 302 Newton, MA 02460
Trust. Knowledge. Experience.
You want an agent who cares – We are experienced real estate agents who use professional marketing tools. We have neighborhood insight and are current with local market conditions. We know the inventory, have opinions about each property, are confident negotiators, and care about our clients – because buying and selling a home is a big deal!