book fao, farm_management
TRANSCRIPT
About the Farm Management Field Guide
About the Farm Management Field Guide The National Project Coordinator, Lamipeti Havea, and the FAO Consultant Euan Flemming developed a field manual for the use by Future Farmer Groups in the period September to November 2003. The manual is for use in the decentralized workshops for training farmers in farm management, conducting demonstrations and developing. The material presented at the Training of Trainers Workshop is being supplemented by additional material developed during the field trips we conducted in the final two weeks of my visit. The manual contains 11 modules that are closely based on material in the FAO Analytical Toolbox that is currently being prepared for publication. It also makes use of the material in the Farm Management Manual published by the Ministry of Agriculture, Forestry and Food (2000). The modules are:
1. Farming systems in Tonga; 2. Farm records; 3. Preparing background information on farm enterprises; 4. Calculating enterprise gross margin analysis; 5. Partial budgeting; 6. Scheduling labour activities; 7. Cash-flow budgeting; 8. Demonstrations; 9. Contract farming; 10. Whole-farm planning; 11. Participatory rural appraisal methods.
Each module commences with an introductory page that sets the scene and goals, prescribes expected outcomes and suggested duration of the session, and details the methods to be taught and outputs to be achieved by trainees. This page is followed by a mini lecture covering the concepts and material to be learnt and an example applying the method. The mini lecture section is kept brief and simple. The main part of the module is a set of exercises for small groups. Most exercises are based on four case studies that reflect different degrees of commercialization and intercropping arrangements in Tongan agriculture. These case studies are taken from examples of farming systems that are described in the second module of the manual:
1. Predominantly subsistence paper mulberry-based farming system, typical of smallholder agriculture in Ha’apai.
2. Semi-subsistence root crops-based farming system with some vegetables sold in the local market.
3. Predominantly commercial vanilla-based farming system intercropped with subsistence and commercial root crops and vegetables.
4. Predominantly commercial squash-based farming system, intercropped with kava and root crops.
The Farm Management Training Manual 1
Module 1: Farming Systems in Tonga
Module 1
Farming Systems in
Tonga
The Farm Management Training Manual 2
Module 1: Farming Systems in Tonga
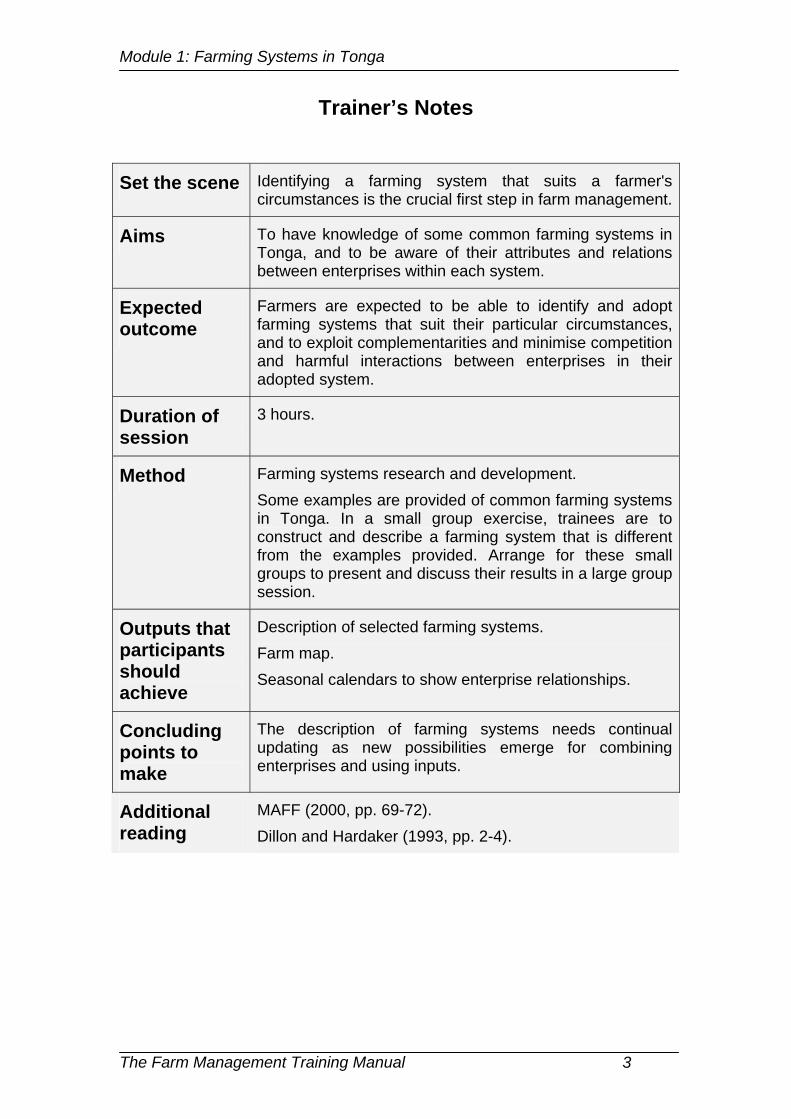
Trainer’s Notes
Set the scene Identifying a farming system that suits a farmer's circumstances is the crucial first step in farm management.
Aims To have knowledge of some common farming systems in Tonga, and to be aware of their attributes and relations between enterprises within each system.
Expected outcome
Farmers are expected to be able to identify and adopt farming systems that suit their particular circumstances, and to exploit complementarities and minimise competition and harmful interactions between enterprises in their adopted system.
Duration of session
3 hours.
Method Farming systems research and development. Some examples are provided of common farming systems in Tonga. In a small group exercise, trainees are to construct and describe a farming system that is different from the examples provided. Arrange for these small groups to present and discuss their results in a large group session.
Outputs that participants should achieve
Description of selected farming systems. Farm map. Seasonal calendars to show enterprise relationships.
Concluding points to make
The description of farming systems needs continual updating as new possibilities emerge for combining enterprises and using inputs.
Additional reading
MAFF (2000, pp. 69-72). Dillon and Hardaker (1993, pp. 2-4).
The Farm Management Training Manual 3
Module 1: Farming Systems in Tonga
Mini Lecture
Intercropping in Farming Systems
According to MAFF (2000, p. 69):
The traditional agricultural systems of Tonga involve intercropping with various crop sequences, and also incorporate fallow periods. These systems developed to ensure a stable and productive environment on farms.
Advantages of intercropping cited by MAFF (2000, p. 69) include:
a) less insect and pest damage
b) more efficient utilization of sunlight
c) higher biomass production per area
d) better protection from rain and wind damage
e) more mulch and less weeds
f) high diversity of outputs
g) higher security of yields and returns.
MAFF (2000, p. 69) warned of the dangers of losing these advantages by
recent trends towards machinery use, monocropping and reduced fallow
periods. These trends are closely associated with the growing
commercialization of farming operations.
Types of Farming Systems
1. Predominantly subsistence root crops-based farming system
Length of the production cycle: 5 years, commencing in July.
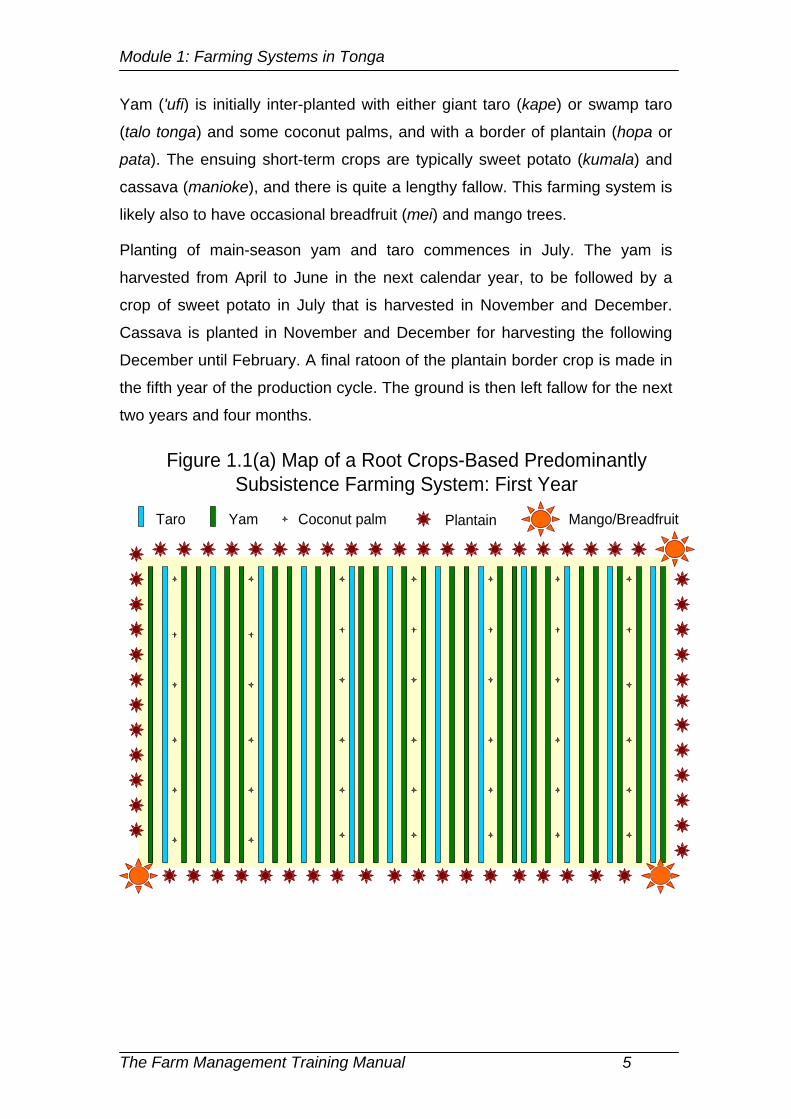
A farm map for this farming system for the first year of the production cycle is
shown in Figure 1.1(a) and the seasonal calendar for the full production cycle
is presented in Figure 1.1(b). Few purchased inputs other than machinery hire
are used to produce these crops and there is a heavy reliance on family
labour. Consumption of produce is mainly within the household, with some
coconuts fed to scavenging animals.
The Farm Management Training Manual 4
Module 1: Farming Systems in Tonga
Yam ('ufi) is initially inter-planted with either giant taro (kape) or swamp taro
(talo tonga) and some coconut palms, and with a border of plantain (hopa or
pata). The ensuing short-term crops are typically sweet potato (kumala) and
cassava (manioke), and there is quite a lengthy fallow. This farming system is
likely also to have occasional breadfruit (mei) and mango trees.
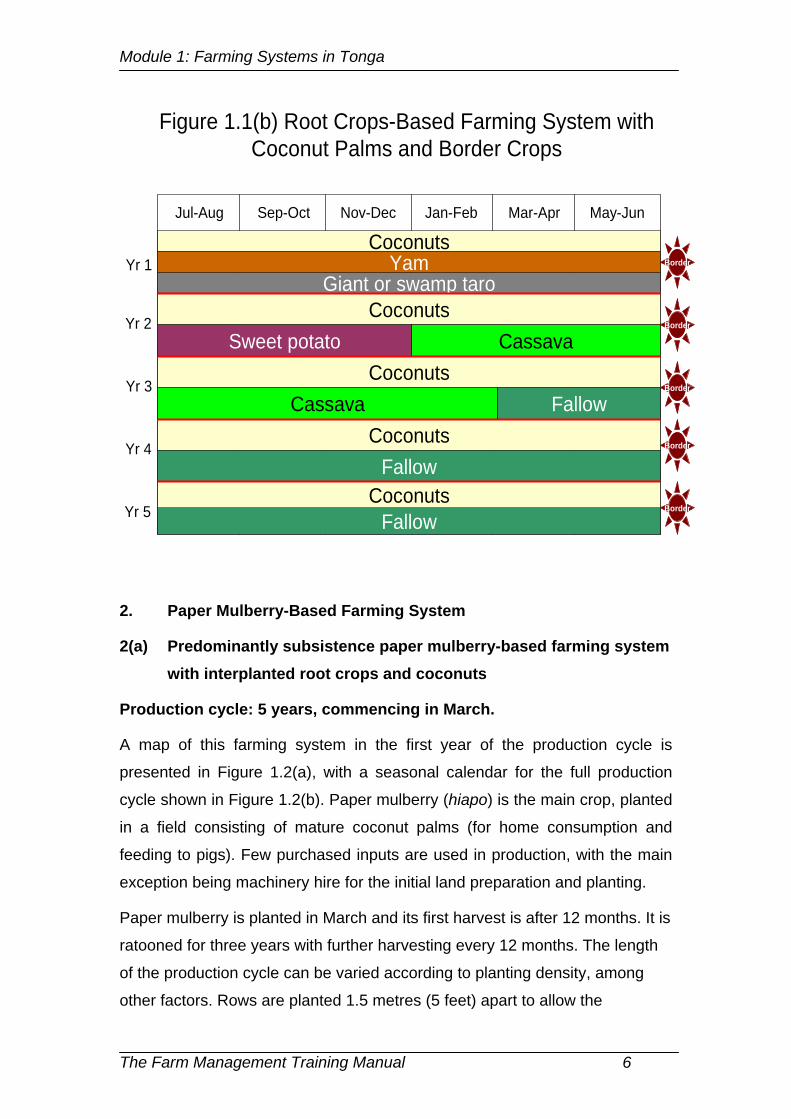
Planting of main-season yam and taro commences in July. The yam is
harvested from April to June in the next calendar year, to be followed by a
crop of sweet potato in July that is harvested in November and December.
Cassava is planted in November and December for harvesting the following
December until February. A final ratoon of the plantain border crop is made in
the fifth year of the production cycle. The ground is then left fallow for the next
two years and four months.
Figure 1.1(a) Map of a Root Crops-Based Predominantly Subsistence Farming System: First Year
Coconut palmYamTaro Plantain Mango/Breadfruit
The Farm Management Training Manual 5
Module 1: Farming Systems in Tonga
Figure 1.1(b) Root Crops-Based Farming System with Coconut Palms and Border Crops
Mar-Apr May-JunJul-Aug Sep-Oct Nov-Dec Jan-Feb
Coconuts
Giant or swamp taro
Yr 5
Yr 3
Yr 2
Yr 1
Coconuts
Fallow
Yr 4
Yam
Sweet potatoCoconuts
Coconuts
CassavaCoconuts
Fallow
Fallow
Cassava
Border
Border
Border
Border
Border
2. Paper Mulberry-Based Farming System
2(a) Predominantly subsistence paper mulberry-based farming system with interplanted root crops and coconuts
Production cycle: 5 years, commencing in March.
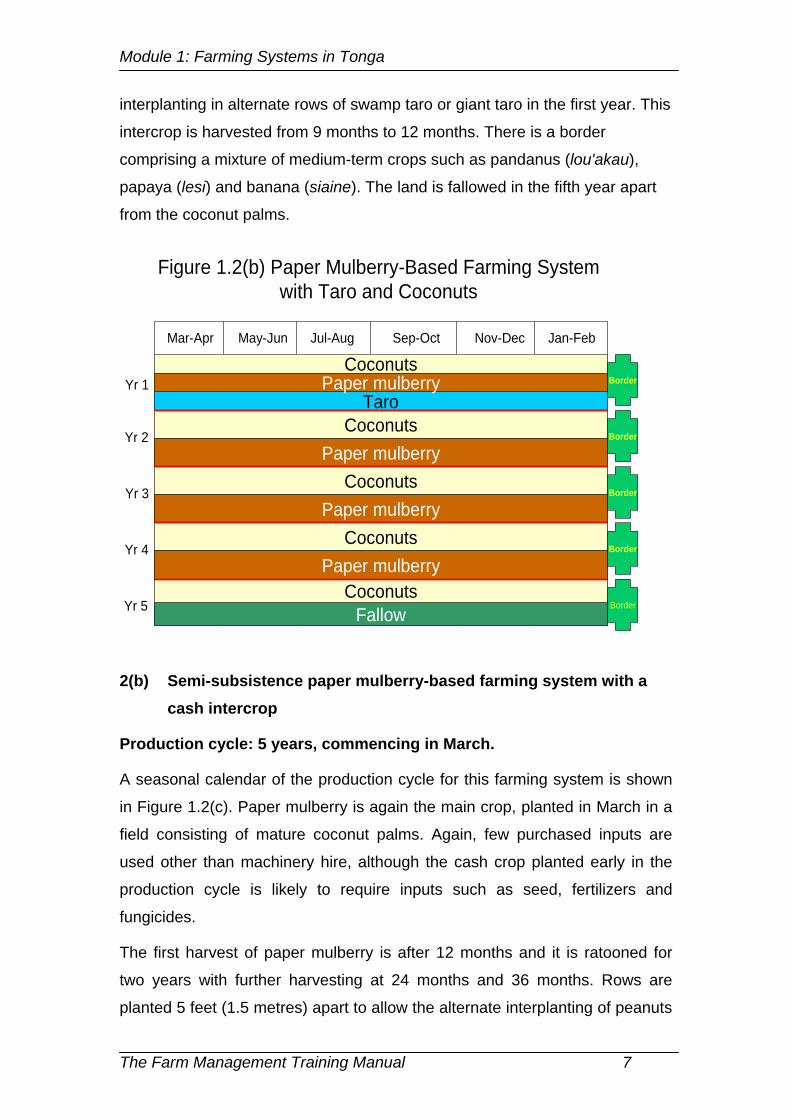
A map of this farming system in the first year of the production cycle is
presented in Figure 1.2(a), with a seasonal calendar for the full production
cycle shown in Figure 1.2(b). Paper mulberry (hiapo) is the main crop, planted
in a field consisting of mature coconut palms (for home consumption and
feeding to pigs). Few purchased inputs are used in production, with the main
exception being machinery hire for the initial land preparation and planting.
Paper mulberry is planted in March and its first harvest is after 12 months. It is
ratooned for three years with further harvesting every 12 months. The length
of the production cycle can be varied according to planting density, among
other factors. Rows are planted 1.5 metres (5 feet) apart to allow the
The Farm Management Training Manual 6
Module 1: Farming Systems in Tonga
interplanting in alternate rows of swamp taro or giant taro in the first year. This
intercrop is harvested from 9 months to 12 months. There is a border
comprising a mixture of medium-term crops such as pandanus (lou'akau),
papaya (lesi) and banana (siaine). The land is fallowed in the fifth year apart
from the coconut palms.
Figure 1.2(b) Paper Mulberry-Based Farming System with Taro and Coconuts
Mar-Apr May-Jun Jul-Aug Sep-Oct Nov-Dec Jan-Feb
Coconuts
Taro
Yr 5
Yr 3
Yr 2
Yr 1
Coconuts
Fallow
Yr 4
Paper mulberry
Paper mulberryCoconuts
Coconuts
Paper mulberryCoconuts
Paper mulberry
Border
Border
Border
Border
Border
2(b) Semi-subsistence paper mulberry-based farming system with a cash intercrop
Production cycle: 5 years, commencing in March.
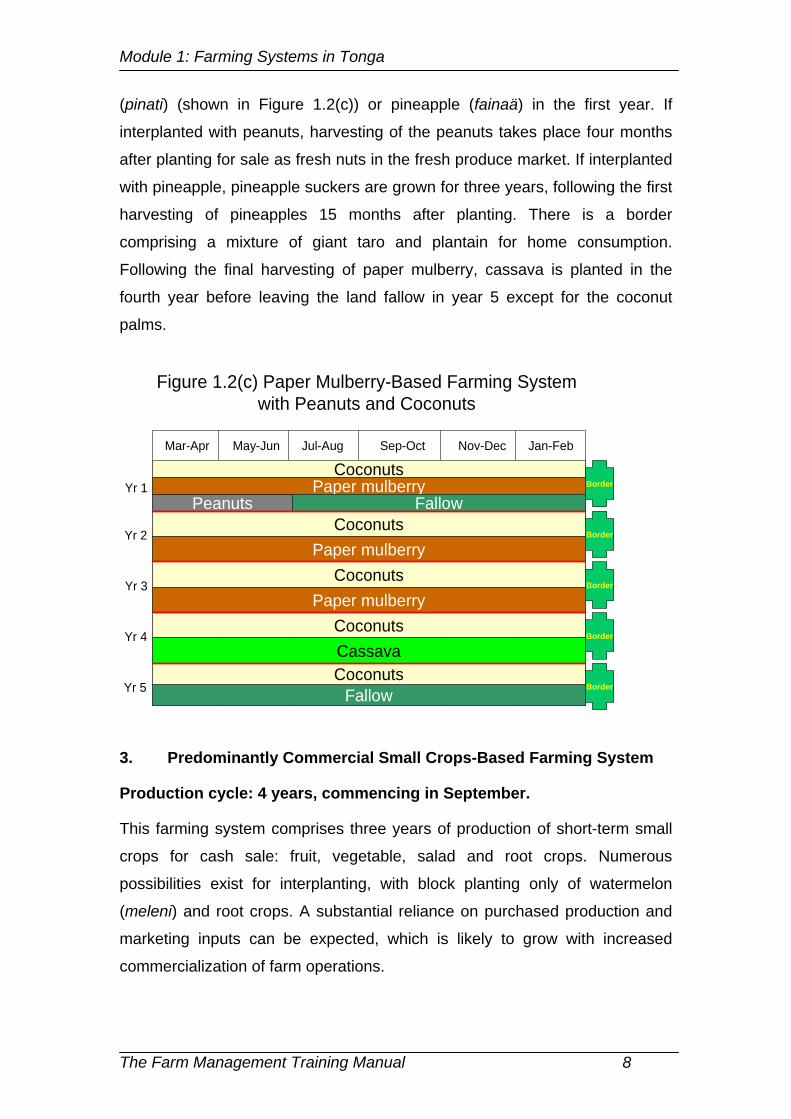
A seasonal calendar of the production cycle for this farming system is shown
in Figure 1.2(c). Paper mulberry is again the main crop, planted in March in a
field consisting of mature coconut palms. Again, few purchased inputs are
used other than machinery hire, although the cash crop planted early in the
production cycle is likely to require inputs such as seed, fertilizers and
fungicides.
The first harvest of paper mulberry is after 12 months and it is ratooned for
two years with further harvesting at 24 months and 36 months. Rows are
planted 5 feet (1.5 metres) apart to allow the alternate interplanting of peanuts
The Farm Management Training Manual 7
Module 1: Farming Systems in Tonga
(pinati) (shown in Figure 1.2(c)) or pineapple (fainaä) in the first year. If
interplanted with peanuts, harvesting of the peanuts takes place four months
after planting for sale as fresh nuts in the fresh produce market. If interplanted
with pineapple, pineapple suckers are grown for three years, following the first
harvesting of pineapples 15 months after planting. There is a border
comprising a mixture of giant taro and plantain for home consumption.
Following the final harvesting of paper mulberry, cassava is planted in the
fourth year before leaving the land fallow in year 5 except for the coconut
palms.
Figure 1.2(c) Paper Mulberry-Based Farming System with Peanuts and Coconuts
Mar-Apr May-Jun Jul-Aug Sep-Oct Nov-Dec Jan-Feb
Coconuts
Peanuts
Yr 5
Yr 3
Yr 2
Yr 1
Coconuts
Fallow
Yr 4
Paper mulberry
Paper mulberryCoconuts
Coconuts
Paper mulberryCoconutsCassava
FallowBorder
Border
Border
Border
Border
3. Predominantly Commercial Small Crops-Based Farming System
Production cycle: 4 years, commencing in September.
This farming system comprises three years of production of short-term small
crops for cash sale: fruit, vegetable, salad and root crops. Numerous
possibilities exist for interplanting, with block planting only of watermelon
(meleni) and root crops. A substantial reliance on purchased production and
marketing inputs can be expected, which is likely to grow with increased
commercialization of farm operations.
The Farm Management Training Manual 8
Module 1: Farming Systems in Tonga
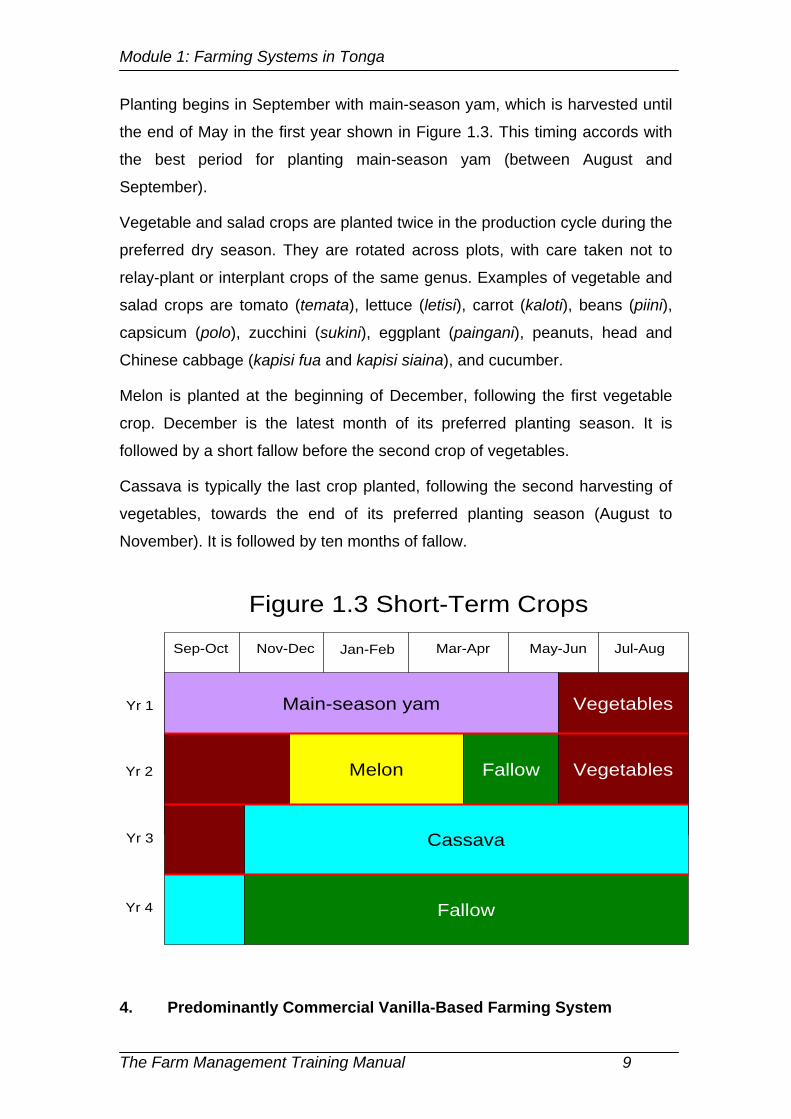
Planting begins in September with main-season yam, which is harvested until
the end of May in the first year shown in Figure 1.3. This timing accords with
the best period for planting main-season yam (between August and
September).
Vegetable and salad crops are planted twice in the production cycle during the
preferred dry season. They are rotated across plots, with care taken not to
relay-plant or interplant crops of the same genus. Examples of vegetable and
salad crops are tomato (temata), lettuce (letisi), carrot (kaloti), beans (piini),
capsicum (polo), zucchini (sukini), eggplant (paingani), peanuts, head and
Chinese cabbage (kapisi fua and kapisi siaina), and cucumber.
Melon is planted at the beginning of December, following the first vegetable
crop. December is the latest month of its preferred planting season. It is
followed by a short fallow before the second crop of vegetables.
Cassava is typically the last crop planted, following the second harvesting of
vegetables, towards the end of its preferred planting season (August to
November). It is followed by ten months of fallow.
Figure 1.3 Short-Term Crops
Sep-Oct Nov-Dec Jan-Feb Mar-Apr May-Jun Jul-Aug
Melon
Yr 3
Yr 2
Yr 1 Main-season yam Vegetables
Cassava
Fallow Vegetables
FallowYr 4
4. Predominantly Commercial Vanilla-Based Farming System
The Farm Management Training Manual 9
Module 1: Farming Systems in Tonga
Vanilla is intercropped in rows of 3 metres (10 feet) in a production cycle
lasting a period that is dictated by the length of productive life of the vanilla.
This period is assumed to be 15 years but could vary significantly from this
length according to economic circumstances and the age-yield profile of the
vanilla. Various intercropping options are available but we will consider two:
small crops and kava (kava tonga).
Interplanting is considered an important risk-management strategy because
fluctuating export prices can result in periods of low prices during which
growers are tempted to pull out the vanilla plants, as has happened in recent
years. Intercropping allows the grower to continue to maintain the plants
during these periods, while concentrating cash-earning efforts on the
intercrops, and take advantage of the upturn in export prices when it occurs.
Little is needed in the way of purchased inputs in vanilla production other than
the planting material. However, management and labour inputs are very
important to ensure a good-quality product with good yields.
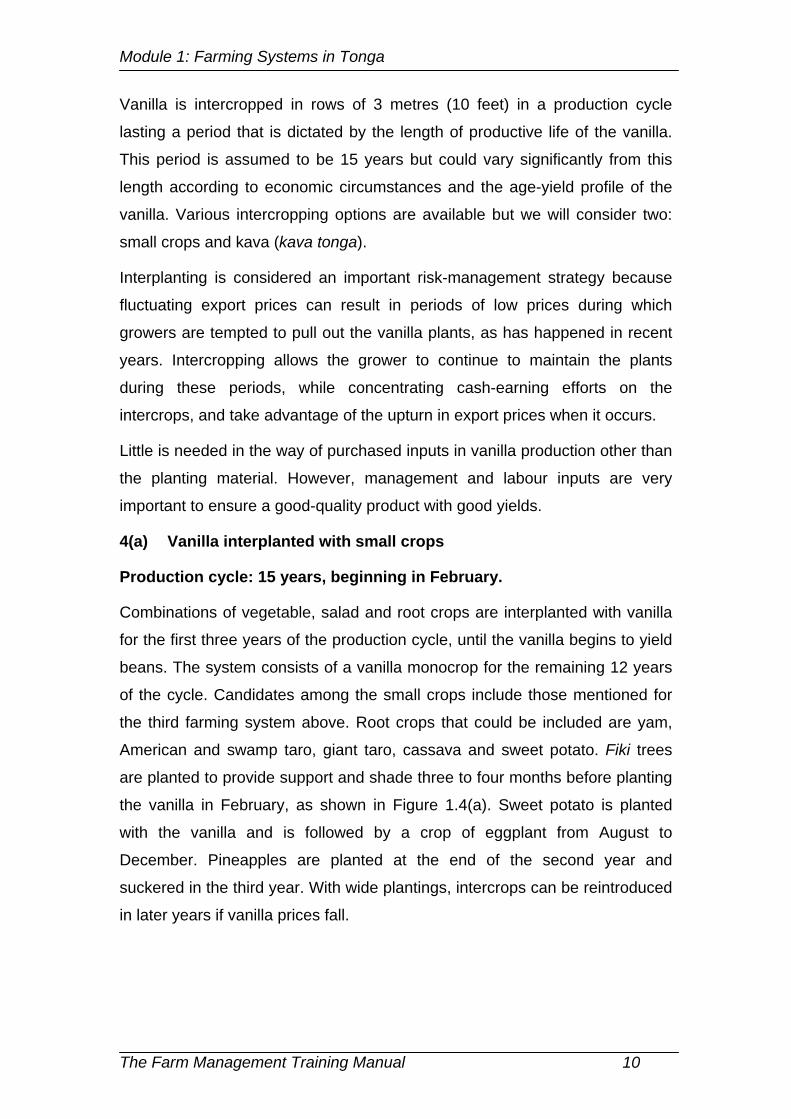
4(a) Vanilla interplanted with small crops
Production cycle: 15 years, beginning in February.
Combinations of vegetable, salad and root crops are interplanted with vanilla
for the first three years of the production cycle, until the vanilla begins to yield
beans. The system consists of a vanilla monocrop for the remaining 12 years
of the cycle. Candidates among the small crops include those mentioned for
the third farming system above. Root crops that could be included are yam,
American and swamp taro, giant taro, cassava and sweet potato. Fiki trees
are planted to provide support and shade three to four months before planting
the vanilla in February, as shown in Figure 1.4(a). Sweet potato is planted
with the vanilla and is followed by a crop of eggplant from August to
December. Pineapples are planted at the end of the second year and
suckered in the third year. With wide plantings, intercrops can be reintroduced
in later years if vanilla prices fall.
The Farm Management Training Manual 10
Module 1: Farming Systems in Tonga
Figure 1.4(a) Vanilla-Based Farming System
Feb-Mar Apr-May Jun-Jul Aug-Sep Oct-Nov Dec-Jan
Vanilla
Sweet potato
Pineapple
Eggplant
Yr 4to
Yr 15
Yr 3
Yr 2
Yr 1
Vanilla
Pineapple
Vanilla
Vanilla
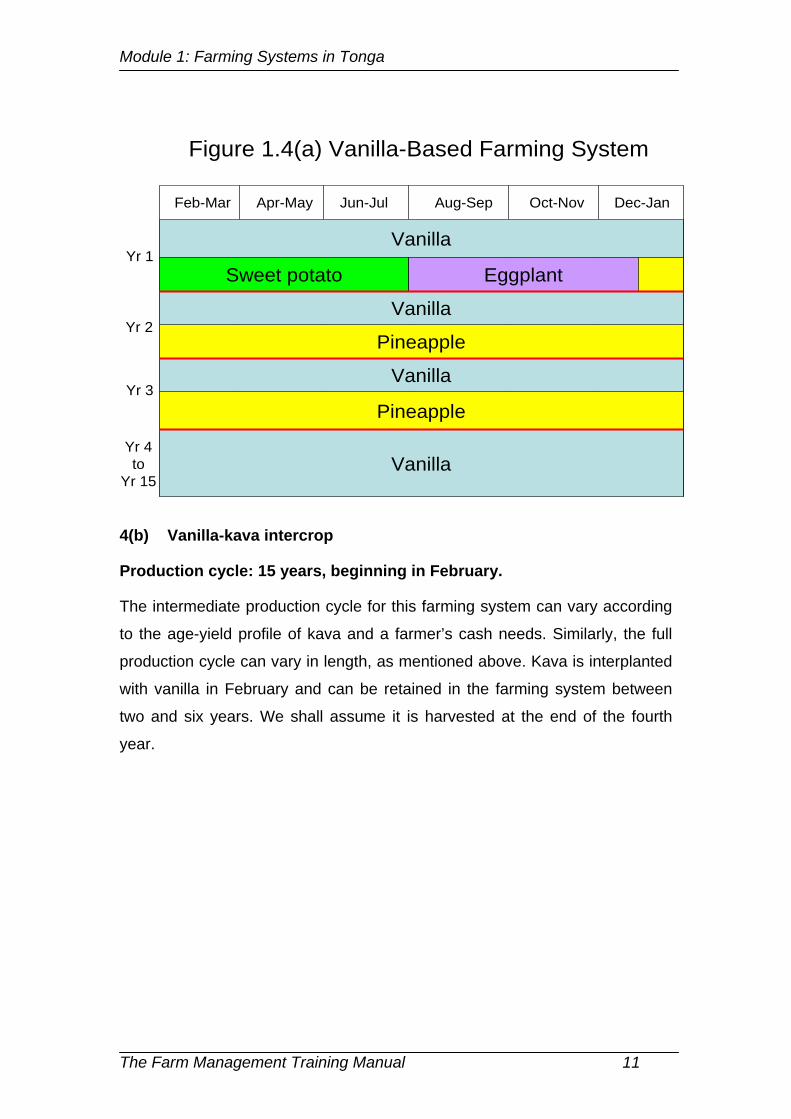
4(b) Vanilla-kava intercrop
Production cycle: 15 years, beginning in February.
The intermediate production cycle for this farming system can vary according
to the age-yield profile of kava and a farmer’s cash needs. Similarly, the full
production cycle can vary in length, as mentioned above. Kava is interplanted
with vanilla in February and can be retained in the farming system between
two and six years. We shall assume it is harvested at the end of the fourth
year.
The Farm Management Training Manual 11
Module 1: Farming Systems in Tonga
Figure 1.4(b) Vanilla-Based Farming System
Feb-Mar Apr-May Jun-Jul Aug-Sep Oct-Nov Dec-Jan
VanillaKava
Yr 5to
Yr 15
Yr 3
Yr 2
Yr 1
Vanilla
Vanilla
Vanilla
Kava
Kava
VanillaKava
Yr 4
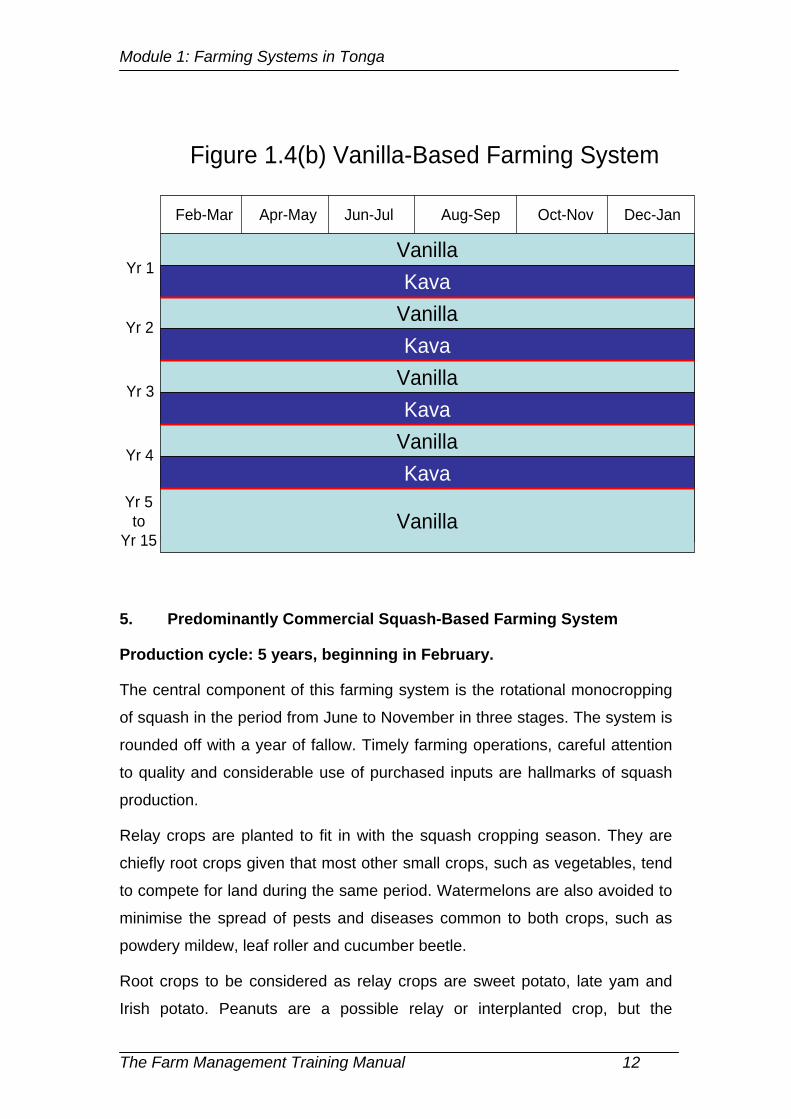
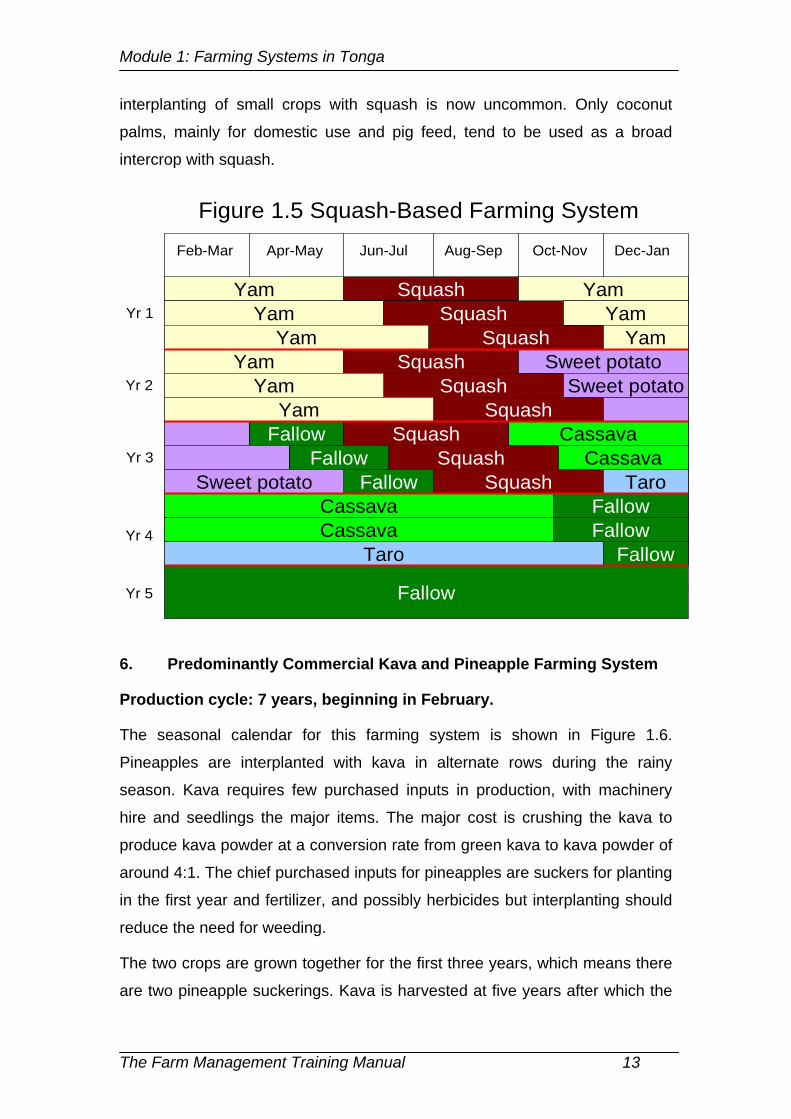
5. Predominantly Commercial Squash-Based Farming System
Production cycle: 5 years, beginning in February.
The central component of this farming system is the rotational monocropping
of squash in the period from June to November in three stages. The system is
rounded off with a year of fallow. Timely farming operations, careful attention
to quality and considerable use of purchased inputs are hallmarks of squash
production.
Relay crops are planted to fit in with the squash cropping season. They are
chiefly root crops given that most other small crops, such as vegetables, tend
to compete for land during the same period. Watermelons are also avoided to
minimise the spread of pests and diseases common to both crops, such as
powdery mildew, leaf roller and cucumber beetle.
Root crops to be considered as relay crops are sweet potato, late yam and
Irish potato. Peanuts are a possible relay or interplanted crop, but the
The Farm Management Training Manual 12
Module 1: Farming Systems in Tonga
interplanting of small crops with squash is now uncommon. Only coconut
palms, mainly for domestic use and pig feed, tend to be used as a broad
intercrop with squash.
Figure 1.5 Squash-Based Farming System
Feb-Mar Apr-May Jun-Jul Aug-Sep Oct-Nov Dec-Jan
CassavaYr 3
Yr 2
Yr 1Yam Squash
Fallow
Cassava
Fallow
FallowYr 4
Yam SquashSquashYam
Yam
Yam Squash Sweet potato
Squash
SquashSquash
SquashSquash
CassavaFallow
CassavaTaro
Taro
Sweet potatoYam
Fallow
Yam
Fallow
YamYam
Sweet potato
FallowYr 5
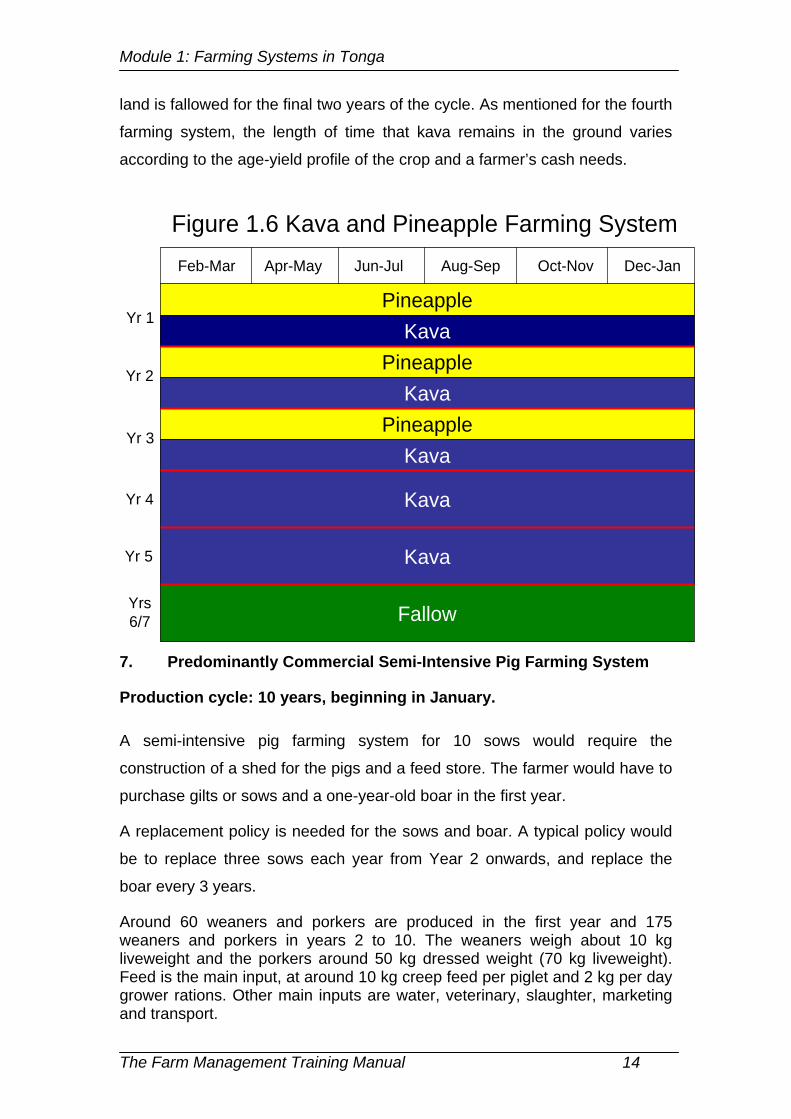
6. Predominantly Commercial Kava and Pineapple Farming System
Production cycle: 7 years, beginning in February.
The seasonal calendar for this farming system is shown in Figure 1.6.
Pineapples are interplanted with kava in alternate rows during the rainy
season. Kava requires few purchased inputs in production, with machinery
hire and seedlings the major items. The major cost is crushing the kava to
produce kava powder at a conversion rate from green kava to kava powder of
around 4:1. The chief purchased inputs for pineapples are suckers for planting
in the first year and fertilizer, and possibly herbicides but interplanting should
reduce the need for weeding.
The two crops are grown together for the first three years, which means there
are two pineapple suckerings. Kava is harvested at five years after which the
The Farm Management Training Manual 13
Module 1: Farming Systems in Tonga
land is fallowed for the final two years of the cycle. As mentioned for the fourth
farming system, the length of time that kava remains in the ground varies
according to the age-yield profile of the crop and a farmer’s cash needs.
Figure 1.6 Kava and Pineapple Farming SystemFeb-Mar Apr-May Jun-Jul Aug-Sep Oct-Nov Dec-Jan
PineappleKava
Yr 5
Yr 3
Yr 2
Yr 1
Pineapple
PineappleKava
Kava
Kava
Yr 4 Kava
Yrs 6/7 Fallow
7. Predominantly Commercial Semi-Intensive Pig Farming System
Production cycle: 10 years, beginning in January.
A semi-intensive pig farming system for 10 sows would require the
construction of a shed for the pigs and a feed store. The farmer would have to
purchase gilts or sows and a one-year-old boar in the first year.
A replacement policy is needed for the sows and boar. A typical policy would
be to replace three sows each year from Year 2 onwards, and replace the
boar every 3 years.
Around 60 weaners and porkers are produced in the first year and 175 weaners and porkers in years 2 to 10. The weaners weigh about 10 kg liveweight and the porkers around 50 kg dressed weight (70 kg liveweight). Feed is the main input, at around 10 kg creep feed per piglet and 2 kg per day grower rations. Other main inputs are water, veterinary, slaughter, marketing and transport.
The Farm Management Training Manual 14
Module 1: Farming Systems in Tonga
Small Group Exercise: Farming System
This exercise requires trainees to develop their own farming system for an 8-
acre farm, or part thereof, which is representative of Tongan agriculture. They
need to think about the complimentarily, competition and unsuitability between
enterprises.
Once the system has been defined for a production cycle, trainees are to
complete the following tasks:
1. Construct a farm map for the first year
Construct a seasonal calendar for the length of the production cycle.
The Farm Management Training Manual 15
Module 2: Keeping Farm Records
Module 2
Keeping Farm Records
The Farm Management Training Manual 16
Module 2: Keeping Farm Records
Trainer’s Notes
Set the scene A major obstacle to the use of farm management methods by smallholders in Tonga has been an absence of records on inputs used and their cost, and outputs obtained and the prices received for them. Encouragement of record-keeping can help to remove this obstacle.
Aim Identify farm records required for modern farm management.
Expected outcome
Farmers are expected to be able to enter basic farm records, and understand the importance of these records and how they are to be used to make farm management decisions.
Duration of session
3 hours.
Method Demonstrate the main forms needed and show how they are structured. Get trainees to form small groups and enter sample data that can be used in later sessions on budgeting. Arrange for these small groups to present and discuss their results in a large group session.
Outputs that participants should achieve
Plot history form. Form containing background information on an enterprise. Labour activity form. Input use form. Non-traded output and input price information form. Crops harvested and sold form. Cash book.
Concluding points to make
Farm records enable farmers to make better decisions, particularly when they are developing commercial activities. The number and complexity of the records depends on how commercialized the farmer is.
Additional reading
MAFF (2000). FAO (2004).
The Farm Management Training Manual 17
Module 2: Keeping Farm Records
Mini Lecture
Types of Information Requiring Records
A farmer needs to gather more information on becoming more involved in
commercial farming. The need to keep farm records increases as a result.
There are seven types of forms that a farmer may use to help make farm
management decisions.
Plot history form
Plot history forms are kept for each identifiable area of land owned by the
farmer. They should contain information on area, soil quality, drainage, slope,
erosion and other forms of degradation, fallow periods, crops grown and
livestock grazed on the plot, and past incidence of pests and diseases.
2. Form containing background information on an enterprise
Each of this type of form contains background information on an enterprise of
interest and use to the farmer. This information is updated for each production
cycle.
New background information is needed for new crops. Three examples follow
of background information on two new enterprises: capsicum and eggplant.
They are being considered by a farmer who, until now, has grown traditional
crops mainly for household consumption.
a) What is the export status of the two new crops?
Capsicums used to be a significant export to New Zealand prior to problems
faced by exporters some 15 years ago caused by fruit fly found in a
consignment of watermelons. The export of capsicums to New Zealand was
banned because capsicums are a potential fruit fly host. Vegetable exports
have since been reintroduced with the recent signing of a quarantine protocol
with New Zealand and the introduction of high-temperature forced-air (HTFA)
treatment of exported vegetables. However, capsicum exports have not yet
resumed because suitable HTFA treatment has not been available. Eggplant
has potential as an export crop. The farmer would need to know the export
status of products, how they should be presented for export and associated
costs, and marketing procedures needed to secure an export contract.
The Farm Management Training Manual 18
Module 2: Keeping Farm Records
b) Greater use of purchased inputs
Capsicums and eggplants both require more purchased inputs than the
traditional crops that the farmer is growing. The farmer would first need to
know what these inputs are. Examples are fertilizers, insecticides and
fungicides. He would also need to know how much to use, when and what the
cost would be.
c) Prices of new outputs produced
What price is the farmer going to receive for capsicums and eggplants sold in
the local market? Information is needed on local market prices for the crops
and any marketing costs incurred in getting produce to the market.
Alternatively, if the farmer expects to sell to a buyer who comes to the farm,
the farm-gate price must be known. Both are seasonal crops and so the
farmer would need to know how their prices are going to vary over the year.
Details on types of background information and for which enterprises are
provided in Module 3.
3. Labour activity form
A labour activity form contains information on the amount of labour used and
when, type of labour (hired or family, adult or child, male or female) and in
which enterprise it is used. Labour inputs would need to be split between the
enterprises involved where they are used on a plot with intercropping or mixed
cropping,. The information needs to be completed each time labour is used in
an enterprise. The use made of this information is shown in Module 6.
4. Input use form
This form contains information on the use of inputs other than labour. It should
contain information on how much of the input is used and when. This
information needs to be recorded on the form each time an input is used. It is
used when calculating gross margins in Module 4.
The Farm Management Training Manual 19
Module 2: Keeping Farm Records
5. Non-traded output and input price information form
Information on prices of non-traded outputs and inputs should be completed at
the end of each production cycle. The purpose of this form is to collect
information to value inputs and outputs for which no price information is
available. This information is also used to calculate gross margins in Module
4.
6. Crops harvested and sold form
This form contains two sets of information. The first set of information is on the
type of crop harvested, the number of units and the average weight of each
unit. The second set of information is on the number of units of the crop that
are sold, their average weight and the price received per unit for the produce
sold. Once again, this information is used to calculate gross margins in
Module 4.
7. Cash book
A seventh farm record that is important for keeping track of cash balances is a
cash book. This would contain some of the information collected on the forms
listed above. However, it also enables the farmer to estimate all non-farm
cash flows that need to be included in a cash flow budget. The preparation of
this budget is the subject of Module 7.
Examples of entries for the various forms described above are shown in the
exercise.
Source of information to be recorded
The farmer should be able to update the plot history information at the end of
each year. A map of the farm is helpful in dividing the farm into plots. MAFF
personnel should be able to help the farmer assess soil quality and identify
land problems such as erosion and pest and disease attacks that occur on
each plot.
The farmer is also the most likely source of background information on
enterprises, to be updated at the end of each year. The Farm Management
Manual (MAFF 2000) provides the farmer with general information on
The Farm Management Training Manual 20
Module 2: Keeping Farm Records
enterprises that can be adapted to suit circumstances on the farm. MAFF
should be able to provide updated market prices for products sold and costs
of the main inputs used, supplemented by cash book entries. It is desirable
that one family member takes responsibility for recording cash transactions on
a regular basis. Typical sources for entries are bank accounts, receipts and
invoices.
Individual family members can record on a regular basis the hours they work
on different enterprise and the quantities of inputs they used. The farmer
would normally be the person who keeps records on hired labour.
At the end of each production period, MAFF personnel should be able to
provide information on the range of prices of inputs and outputs that are not
traded by the farmer.
The Farm Management Training Manual 21
Module 2: Keeping Farm Records
Small Group Exercise: Keeping Records
This exercise requires trainees to enter a sample of different types of
information on appropriate farm record forms. First, some background
information is provided on crop production. The farm family consists of a
farmer, his wife and a son aged 16. The family has produced taro, bananas
and coconuts for a long time, and all family members know the production
practices well for these enterprises. Few purchased inputs are used on these
crops. The farmer has now decided to grow capsicum and eggplant that family
members sell in the local market and, hopefully at some stage, in the export
market.
During the year, the farmer produced 750 kg of capsicum from 0.3 acres,
1700 kg of eggplant from 0.2 acres, 2400 kg of first-ratoon bananas from 0.3
acres and 3200 kg of American taro from 0.8 acres. All of the capsicum and
eggplant, and 400 kg of bananas, were sold in the market. Coconut palms
produce 500 nuts per year. All taro and coconuts were consumed in the
household.
Labour activity form/Input use form
Examples follow of labour tasks and inputs used, to be entered on the
appropriate farm record forms. The entry for the first example needs special
consideration. There is usually a driver included with the hire of machinery but
the cost of providing the driver is included in the overall hiring cost. Therefore,
it is best to make a single entry as an input use rather than making separate
entries for input use and labour use.
• On 5 June 2003, the farmer hired machinery for two hours for
ploughing and disk harrowing to prepare half an acre for planting
capsicum and eggplant. The hire rate was T$40 per hour. (Assume that
1.2 hours are to be allocated to the capsicum enterprise and 0.8 hours
to the eggplant enterprise.)
• On 10 June, the farmer and his son took six hours between them to
broadcast 75 kg of NPK 8:33:18 and 200 kg of chicken manure over
the area to be planted to capsicum and eggplant. They lightly worked
The Farm Management Training Manual 22
Module 2: Keeping Farm Records
the fertilizer into the soil before planting. The chicken manure was not
purchased but obtained from relatives in the village.
• On 17 June, the farmer and his son spent six hours each planting a 20-
gram packet of capsicum seed.
• On 18 June, the farmer and his son spent three hours each planting
half a 20-gram packet of capsicum seed.
• On 19 June, the farmer and his son spent planted 50 grams of eggplant
seed, taking five hours each.
• On 7 July, the farmer’s wife spent 2 hours collecting mature coconuts.
• On 9 July, the farmer hired 1 hour of casual labour to harvest six
bunches of bananas. The labourer was paid T$5. The farmer’s wife
sold five of the bunches at the market on the next day, taking her six
hours and costing T$7 in marketing inputs.
• On 19 July, the farmer and his son applied 25 kg of urea along the
rows of eggplant and capsicum, taking two hours each.
• On 5 September, the farmer’s son spent two hours harvesting 50 kg of
capsicum.
• On 18 September, the farmer’s son spent an hour harvesting 60 kg of
eggplant.
• On 26 September, the farmer spent an hour harvesting a basket of
American taro.
Crops harvested and sold form
Examples follow of individual crops harvested and sold, to be entered on the
appropriate farm record form:
• Five bunches of bananas were sold on 10 July for T$0.60 per kg. One
remaining bunch was kept for consumption in the household and by
relatives. (Assume each bunch weighs 13 kg on average.)
The Farm Management Training Manual 23
Module 2: Keeping Farm Records
• On 7 July, four baskets of mature nuts were harvested for household
use. (Assume that one basket is equal to 15 kg and one nut is equal to
1.13 kg.)
• On 5 September, 50 kg of capsicum were harvested and sold for
T$2.30 per kg.
• An amount of 60 kg of eggplant was sold for T$1.80 per kg on 18
September.
• One basket of American taro was harvested on 26 September for home
use. (Assume that one basket weighs 15 kg.)
Non-traded input and output prices form
At year end, the following information on prices is to be recorded on the
appropriate farm record form for examples of non-traded inputs used and
outputs harvested:
• American taro prices per basket averaged T$8.55 during the year.
They varied from T$7.20 to T$10.20.
• Mature nuts had an average price of T$0.30 each during the year,
varying from a low of T$0.21 to a high of T$0.47.
• Family labour was valued at T$3.00 per hour throughout the year.
• Chicken manure was valued between T$3.50 per 50 kg bag and
T$5.00 per 50 kg bag during the year. The average price was T$4.00
per 50 kg bag.
Other cash transactions for entry in the cash book
Some cash book entries can already be made using the above information.
They are the hiring of labour for harvesting bananas, and the sales of
capsicum, eggplant and bananas. In addition, other entries are needed for the
following cash transactions:
• The following purchases of household goods were made: 6 May
T$41.50; 3 June T$54.20; 5 July T$38.60; 9 August T$31.30.
• 200 kg of NPK 8:33:18 were bought on 30 May for T$200.
The Farm Management Training Manual 24
Module 2: Keeping Farm Records
• On 8 June, purchases were made of two 20-gram packets of capsicum
seed, costing T$65 each, and two 25-gram packets of eggplant seed,
costing T$65 each.
• 100 kg of urea were bought on 10 July for T$90.
• Remittances of T$70 were received on 8 August.
Tasks
Enter the examples of cash transactions, labour activities, inputs, outputs, and
input and output prices on the farm record forms.
The Farm Management Training Manual 25

Module 4: Preparing Background Information on Enterprise
Module 3
Preparing Background
Information on
Enterprise
The Farm Management Training Manual 26
Module 4: Preparing Background Information on Enterprise
Trainer’s Notes
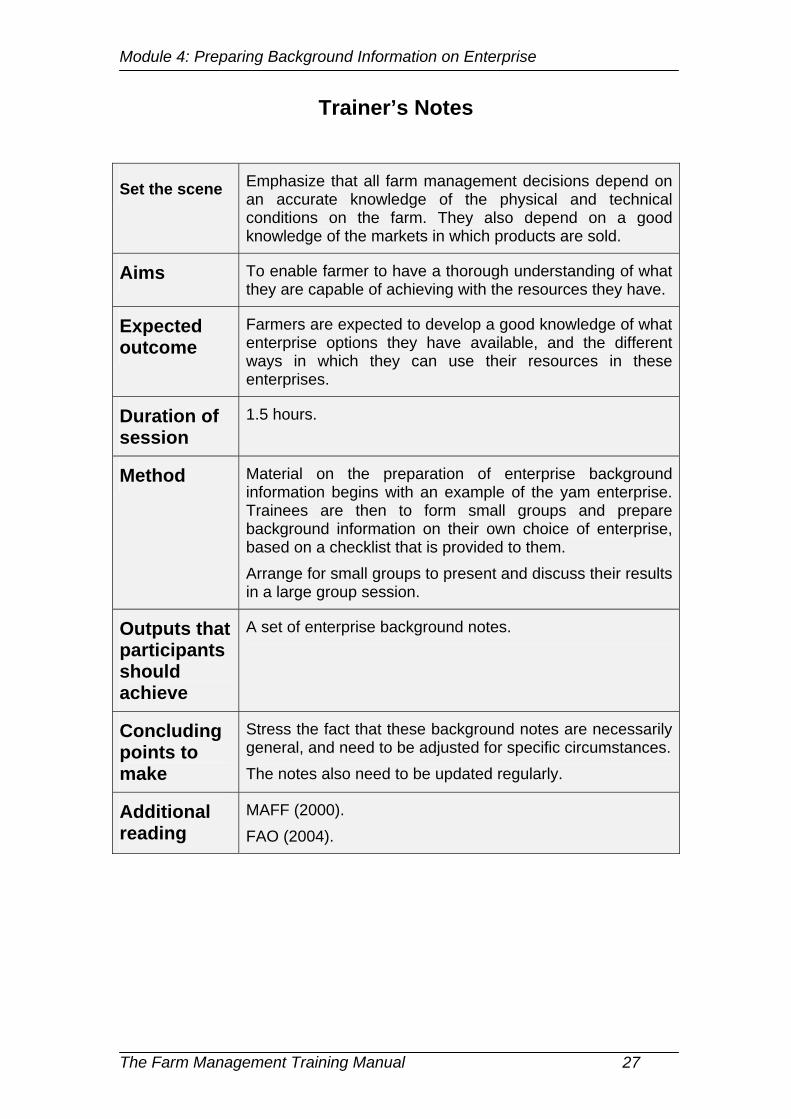
Set the scene Emphasize that all farm management decisions depend on an accurate knowledge of the physical and technical conditions on the farm. They also depend on a good knowledge of the markets in which products are sold.
Aims To enable farmer to have a thorough understanding of what they are capable of achieving with the resources they have.
Expected outcome
Farmers are expected to develop a good knowledge of what enterprise options they have available, and the different ways in which they can use their resources in these enterprises.
Duration of session
1.5 hours.
Method Material on the preparation of enterprise background information begins with an example of the yam enterprise. Trainees are then to form small groups and prepare background information on their own choice of enterprise, based on a checklist that is provided to them. Arrange for small groups to present and discuss their results in a large group session.
Outputs that participants should achieve
A set of enterprise background notes.
Concluding points to make
Stress the fact that these background notes are necessarily general, and need to be adjusted for specific circumstances.The notes also need to be updated regularly.
Additional reading
MAFF (2000). FAO (2004).
The Farm Management Training Manual 27
Module 4: Preparing Background Information on Enterprise
Mini Lecture
Accurate technical information about how farmers operate their enterprises is
the basis for any form of financial analysis in farm management.
The technical and financial information needed to make commercial farm
decisions takes many different forms. The best way to demonstrate this is to
use an example, and to have some practice at completing forms for different
enterprises in Tonga.
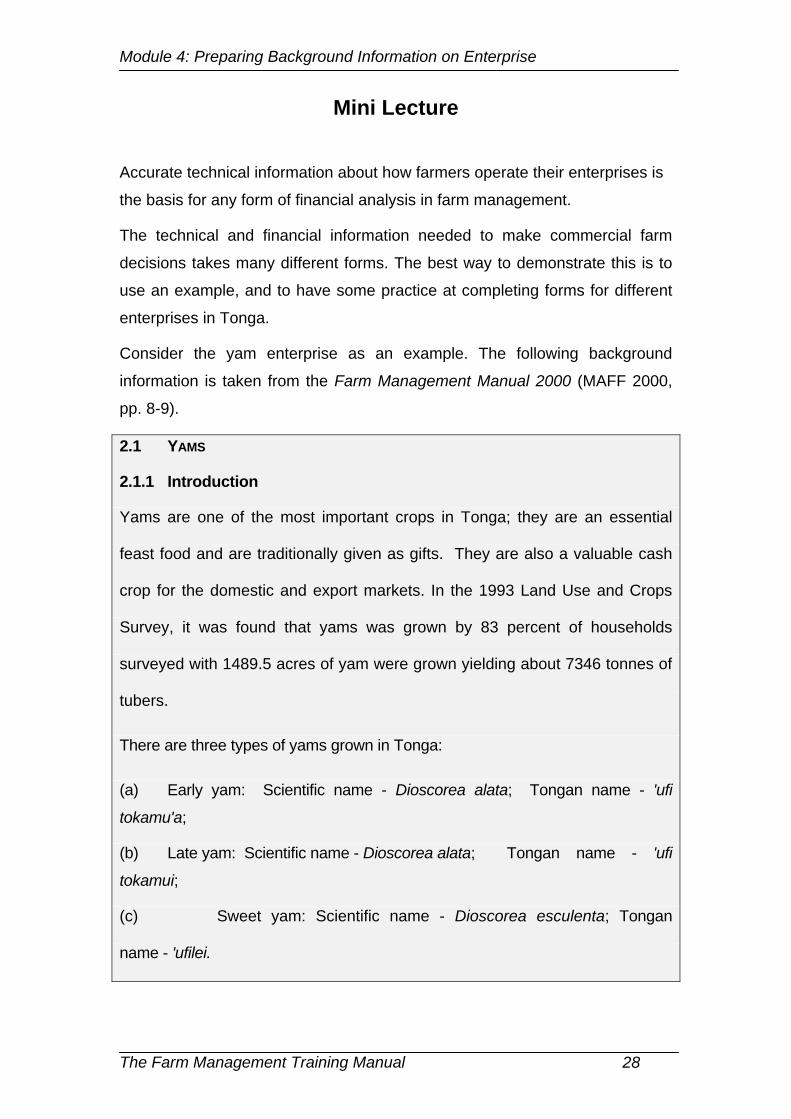
Consider the yam enterprise as an example. The following background
information is taken from the Farm Management Manual 2000 (MAFF 2000,
pp. 8-9).
2.1 YAMS
2.1.1 Introduction
Yams are one of the most important crops in Tonga; they are an essential
feast food and are traditionally given as gifts. They are also a valuable cash
crop for the domestic and export markets. In the 1993 Land Use and Crops
Survey, it was found that yams was grown by 83 percent of households
surveyed with 1489.5 acres of yam were grown yielding about 7346 tonnes of
tubers.
There are three types of yams grown in Tonga:
(a) Early yam: Scientific name - Dioscorea alata; Tongan name - 'ufi
tokamu'a;
(b) Late yam: Scientific name - Dioscorea alata; Tongan name - 'ufi
tokamui;
(c) Sweet yam: Scientific name - Dioscorea esculenta; Tongan
name - 'ufilei.
The Farm Management Training Manual 28
Module 4: Preparing Background Information on Enterprise
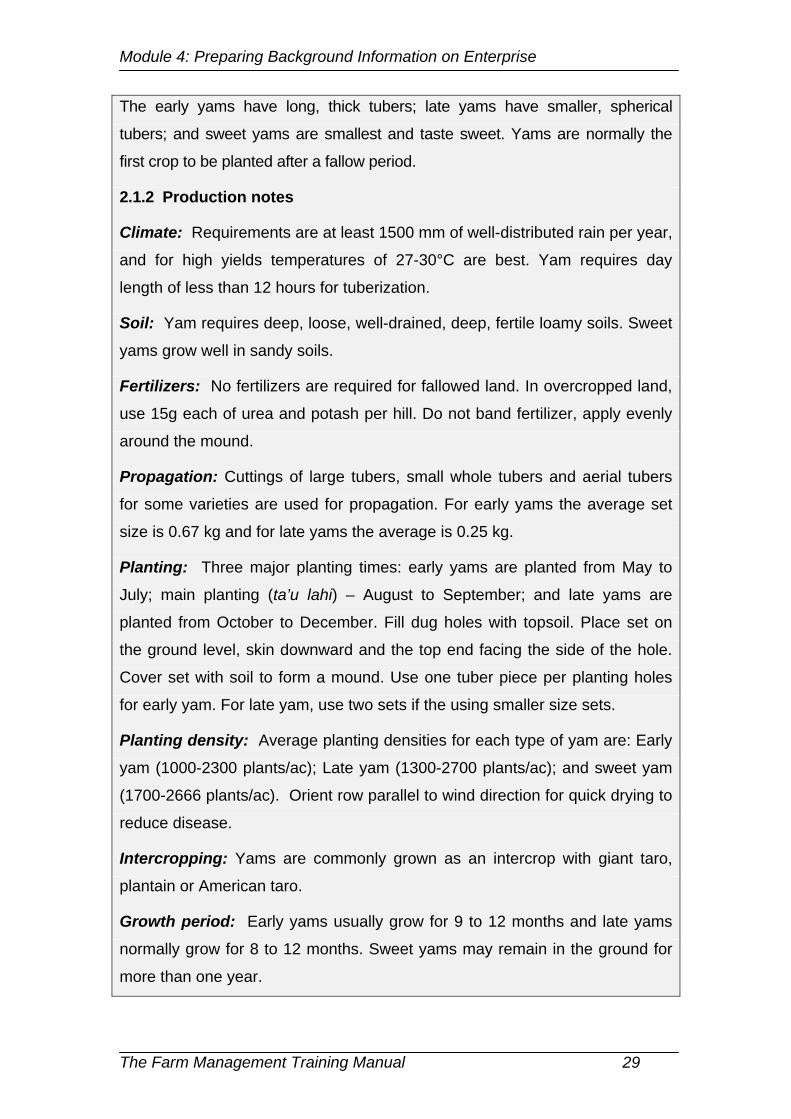
The early yams have long, thick tubers; late yams have smaller, spherical
tubers; and sweet yams are smallest and taste sweet. Yams are normally the
first crop to be planted after a fallow period.
2.1.2 Production notes
Climate: Requirements are at least 1500 mm of well-distributed rain per year,
and for high yields temperatures of 27-30°C are best. Yam requires day
length of less than 12 hours for tuberization.
Soil: Yam requires deep, loose, well-drained, deep, fertile loamy soils. Sweet
yams grow well in sandy soils.
Fertilizers: No fertilizers are required for fallowed land. In overcropped land,
use 15g each of urea and potash per hill. Do not band fertilizer, apply evenly
around the mound.
Propagation: Cuttings of large tubers, small whole tubers and aerial tubers
for some varieties are used for propagation. For early yams the average set
size is 0.67 kg and for late yams the average is 0.25 kg.
Planting: Three major planting times: early yams are planted from May to
July; main planting (ta’u lahi) – August to September; and late yams are
planted from October to December. Fill dug holes with topsoil. Place set on
the ground level, skin downward and the top end facing the side of the hole.
Cover set with soil to form a mound. Use one tuber piece per planting holes
for early yam. For late yam, use two sets if the using smaller size sets.
Planting density: Average planting densities for each type of yam are: Early
yam (1000-2300 plants/ac); Late yam (1300-2700 plants/ac); and sweet yam
(1700-2666 plants/ac). Orient row parallel to wind direction for quick drying to
reduce disease.
Intercropping: Yams are commonly grown as an intercrop with giant taro,
plantain or American taro.
Growth period: Early yams usually grow for 9 to 12 months and late yams
normally grow for 8 to 12 months. Sweet yams may remain in the ground for
more than one year.
The Farm Management Training Manual 29
Module 4: Preparing Background Information on Enterprise
Disease and pest control: Yams can be affected by insects such as the
rose beetle and caterpillars, and by land diseases such as seed piece rot,
yam tuber rot, anthracnose, and stem rot and leaf spot diseases. Nematodes:
Use fallowed land. Rose beetles and caterpillars: spray weekly with Sevin, 1
tablespoon per gallon. Anthracnose: use resistant varieties or spray fortnightly
yam either with Benlate, ½ tablespoon, or weekly with Mancozeb, 2
tablespoons, per 5 litres or spray them alternately to prevent anthracnose
developing resistance to Benlate. Tuber scales: dip for 10 minutes in
Perfekthion, 1 teaspoon per 5 litres. Tuber rots: dip sets for 10 minutes in
Benlate (½ tablespoon) or Mancozeb (1 tablespoon) plus Sevin (½
tablespoon) and Agral (1 teaspoon) per 5 litres. Sand and ash are used also.
Weeding: Hoe every two weeks. Hoeing during dry times provides a dry soil
mulch which reduces evaporation losses.
Storage: Yams store better than other root crops and can be kept for 3 to 6
months if kept in a well-ventilated cool store. Careful harvest and post-harvest
handling will also ensure longer storage life.
2.1.3 Marketing notes
Yams are the most expensive of the root crops. The average prices at Talamahu Market from 1994-1999 were early yam (T$1.97/kg); late yam (T$1.20/kg); and sweet yam (T$0.87/kg). About 361 tonnes of yams were exported annually during this period. 2.1.4 Economics of yam production
See budgets for the production of early, late and sweet yam on the following
pages.
The Farm Management Training Manual 30
Module 4: Preparing Background Information on Enterprise
Small Group Exercise: Preparation of Background Information for an Enterprise
The aim of the exercise on preparing background information for enterprises
is to enable trainees to understand what information they should collect in
order to make good decisions when managing the operations of that
enterprise. Arrange trainees into small groups and ask them to select a farm
enterprise. They are to provide background information on their selected
enterprise.
Separate checklists are provided below for background information on crop
and livestock enterprises. Depending on the nature of the enterprise,
additional headings might need to be added to the checklist and some of
those included might be ignored. No model answer is provided for this
exercise. Trainers can refer to MAFF (2000) for background information on
the enterprises that trainees choose.
Checklist for Background Information on a Crop Enterprise
1. Types/varieties
2. Production notes
Climatic suitability
Soil suitability
Fertilizer requirements
Propagation
Planting times
Planting methods
Planting density
Intercropping
Growth period
Disease and pest control
The Farm Management Training Manual 31
Module 4: Preparing Background Information on Enterprise
Weeding
Harvesting methods
Storage
Yields
3. Marketing notes
Marketing outlets
Transport needs
Packaging needs
Prices and price variability
Checklist for Livestock Enterprise Background Information
1. Reproduction
Breeds
Selection of breeding stock
Breeding/mating:
Weight of breeding stock at puberty
Age of breeding stock at puberty
Oestrus cycle
Heat period
Gestation period
Breeding interval
Offspring per breeding cycle
Birth weight of offspring
Mortality rate
Offspring weaned per breeding cycle
Offspring weaned per breeding stock per year
The Farm Management Training Manual 32
Module 4: Preparing Background Information on Enterprise
Average breeding life
Replacement rate of breeding stock
2. Growth
Age at weaning
Weight at weaning
Proportion sold as weaners
Non-livestock products sold
Sale weight
Age at sale
Post-weaning mortality rate
Weight of cull breeding stock
3. Feeding
Feeding requirements
Feed quality
Feed mix
Rations
Feed costs
Feed supply
4. Management
Management skills needed
Pasture management
Housing
Water supply
The Farm Management Training Manual 33
Module 4: Preparing Background Information on Enterprise
Hygiene
Special requirements during pregnancy
Disease and parasite control
5. Processing and Marketing
Slaughtering needs
Market outlets
Transport needs
Packaging needs
The Farm Management Training Manual 34
Module 4: Calculating Enterprise Gross Margins
Module 4
Calculating Enterprise
Gross Margins
The Farm Management Training Manual 35
Module 4: Calculating Enterprise Gross Margins
Trainer’s Notes
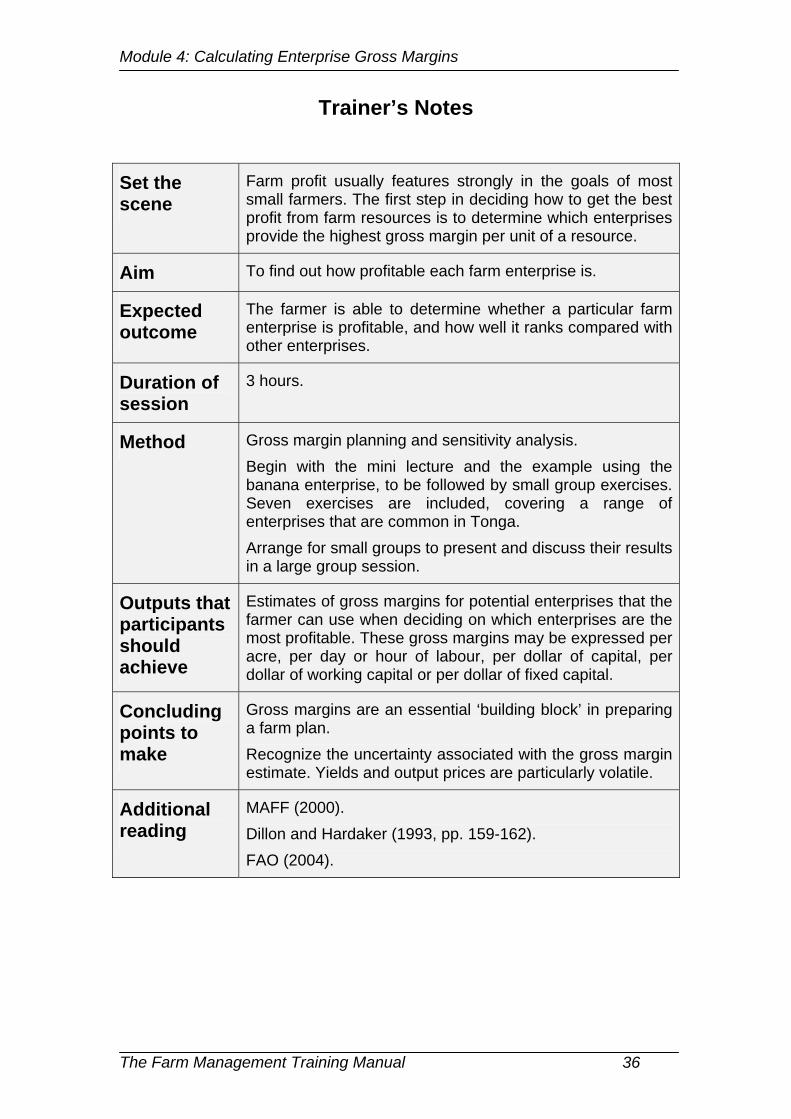
Set the scene
Farm profit usually features strongly in the goals of most small farmers. The first step in deciding how to get the best profit from farm resources is to determine which enterprises provide the highest gross margin per unit of a resource.
Aim To find out how profitable each farm enterprise is.
Expected outcome
The farmer is able to determine whether a particular farm enterprise is profitable, and how well it ranks compared with other enterprises.
Duration of session
3 hours.
Method Gross margin planning and sensitivity analysis. Begin with the mini lecture and the example using the banana enterprise, to be followed by small group exercises. Seven exercises are included, covering a range of enterprises that are common in Tonga. Arrange for small groups to present and discuss their results in a large group session.
Outputs that participants should achieve
Estimates of gross margins for potential enterprises that the farmer can use when deciding on which enterprises are the most profitable. These gross margins may be expressed per acre, per day or hour of labour, per dollar of capital, per dollar of working capital or per dollar of fixed capital.
Concluding points to make
Gross margins are an essential ‘building block’ in preparing a farm plan. Recognize the uncertainty associated with the gross margin estimate. Yields and output prices are particularly volatile.
Additional reading
MAFF (2000). Dillon and Hardaker (1993, pp. 159-162). FAO (2004).
The Farm Management Training Manual 36
Module 4: Calculating Enterprise Gross Margins
Mini Lecture
Definitions
The gross margin of a farm enterprise is the gross income from output
produced minus the cost of variable inputs used to produce that output.
The gross income of an enterprise is the value of all outputs produced in that
enterprise. For each output, it is calculated as the farm-gate price of the
output multiplied by the quantity produced. Valuing output can cause
problems in situations where the price paid to the farmer is not available.
However, a local market price or export price may be available. In these
cases, marketing costs must be calculated and deducted to obtain a farm-gate
price. The form of the output for which there is an available price might be
different from that which the farmer sells. In the broiler enterprise, price is
quoted in dressed weight while the output is measured before dressing takes
place. In addition, not all quantities are recorded in the same units. They may
be in kilograms, bags or baskets, for example. It is important to have a means
of converting all quantities to a common unit, usually kilograms or tonnes. The
Talamahu Market Reports provide average weights in kilograms for common
trade units.
Variable costs are the sum of costs of inputs that vary with the level of
production in the enterprise. Each variable cost is calculated by multiplying the
price the farmer pays for the input by the quantity of the input used in the
enterprise. Some common examples are seed and other planting materials,
feed, veterinary supplies, fertilizers, chemicals and biological agents to control
pests, diseases and weeds, packing material, transport and hired casual
labour.
A fixed cost is estimated by multiplying the quantity of the fixed input by the
price paid for it. Examples of fixed inputs are rents, licences and costs
associated with the upkeep of fixed assets such as buildings, plant and
machinery. A fixed input is distinguished from a variable input in that it does
not vary with the level of production of the enterprise. Repairs to machinery
are a fixed cost but machinery hire is a variable cost because the amount of
time a machine is hired varies with the level of production.
The Farm Management Training Manual 37
Module 4: Calculating Enterprise Gross Margins
The treatment of family labour is difficult when deciding on variable and fixed
costs. It depends on how easy it is for family members to switch from farming
to other activities from one day to the next. In most cases, family labour inputs
are best treated as fixed inputs and their costs excluded from the calculation
of a gross margin even though they can be varied to some extent, according
to access to alternative income-earning possibilities. Ask trainees to calculate
gross margin per hour of family labour used, considering family labour as a
fixed cost. The solutions to the exercises also contain estimates of the value
of family labour inputs, with gross margins calculated after subtracting this
value from gross income in addition to other variable costs. A gross margin
calculated in this way would be used when it is assumed family labour is a
variable input.
Stress to the trainees that there is always some uncertainty about the
accuracy of the information used in estimating a gross margin because we are
dealing with future events. Therefore, it is always wise to do some sensitivity
analysis. This means we calculate how much a gross margin changes when
there is a change in the values used to calculate it.
Which enterprises to choose for calculating gross margins?
Most farmers in Tonga have many enterprises to choose from to include in
their farm plan. It would take a lot of work to calculate gross margins for all of
them. Fortunately, the Farm Management Manual produced by MAFF (2000)
covers the important crop and livestock enterprises in Tonga and the gross
margin budgets presented in the manual can provide a good guide. Farmers
should concentrate on calculating gross margins for those enterprises that
best suit their resources and circumstances, and use the estimates in the
manual as a starting point.
Steps in gross margin planning Explain to trainees that the main purpose of gross margins is to compare the
profitability of different enterprises to get the best profit from the resources
available. This assumes all enterprises use fixed inputs to about the same
The Farm Management Training Manual 38
Module 4: Calculating Enterprise Gross Margins
degree. Gross margins have to be expressed in a consistent way for all
enterprises. It is usual to express them for one acre per year, as done below.
However, there is no hard-and-fast rule on which resource should be used as
the basis for getting the highest gross margin. It depends on what the farmer
thinks is the most limiting resource. In some cases, a comparison of gross
margins per acre might not be appropriate. An intensive broiler enterprise, for
example, might use little land but be a heavy user of capital. In this situation, it
would be wise to compare gross margins per dollar invested in the enterprise.
Then again, gross margins per unit of various resources can all be used,
leaving the farmer to make a choice between the different measures. In all
cases, it is good practice to calculate gross margin per labour unit (hour or
day, for example) because labour is an important input in all enterprises in
Tonga.
There is also a problem of different lengths of the production cycle of
enterprises. In the exercises that follow in which gross margins are calculated
for one acre of land, different crops are in the ground for different lengths of
time and so the gross margins for the crops cannot be directly compared. In
Module 8, trainees get experience in compiling a farm plan consisting of a
number of enterprises with different production periods. At this stage, they will
simply calculate gross margins per acre for the length of the production cycle
of each enterprise.
Assuming one acre of land, which is the most limiting resource, the method of
gross margin planning follows six steps:
1. Prepare the background information on enterprises that potentially
could be grown on the farm (discussed in Module 3).
2. Prepare an inventory of available resources on the farm that can be
used in production of the enterprises identified in Step 1.
3. Obtain data on input and output quantities and prices for each
enterprise.
4. Calculate gross income from the enterprise for one acre.
The Farm Management Training Manual 39
Module 4: Calculating Enterprise Gross Margins
5. Identify and calculate the costs of variable inputs used to produce the
output from one acre.
6. Subtract variable costs from gross income to obtain gross margin per
acre.
Gross Margin Example: Banana Enterprise
While a banana plant remains in the ground for a few ratoons, we will ignore
the ratoons and calculate the gross margin for the first year only. Calculation
is based on one acre.
Output is estimated to be 8.5 tonnes per acre and the price received by the
farmer is forecast to be T$0.60 per kilogram. Because the price is in
kilograms, we must put output in the same units (8,500 kg). Therefore, gross
income is calculated as 8,500 kg multiplied by T$0.60, which equals T$5,100.
As there is only one output in this enterprise, the value of T$5,100 is also
gross income.
There are seven variable inputs used in the production of the bananas in their
first year:
• 3 hours of machinery hire for ploughing and slashing, costing T$40 per
hour
• 1 hour of machinery hire for disk harrowing, costing T$40 per hour
• 660 suckers used as planting material, costing T$0.10 each
• 200 kg of NPK 8:33:18, costing T$1.00 per kg
• 200 kg of urea, costing T$0.90 per kg
• 140 propping sticks, costing T$0.20 each
• Marketing cost of T$30 per tonne.
The price is multiplied by the quantity in each case to calculate the variable
costs.
The following details are provided on family labour inputs per acre. Forty
hours are spent preparing the planting material, 70 hours planting and
The Farm Management Training Manual 40
Module 4: Calculating Enterprise Gross Margins
replanting, 40 hours weeding, 20 hours propping, 15 hours applying fertilizers
and 100 hours harvesting.
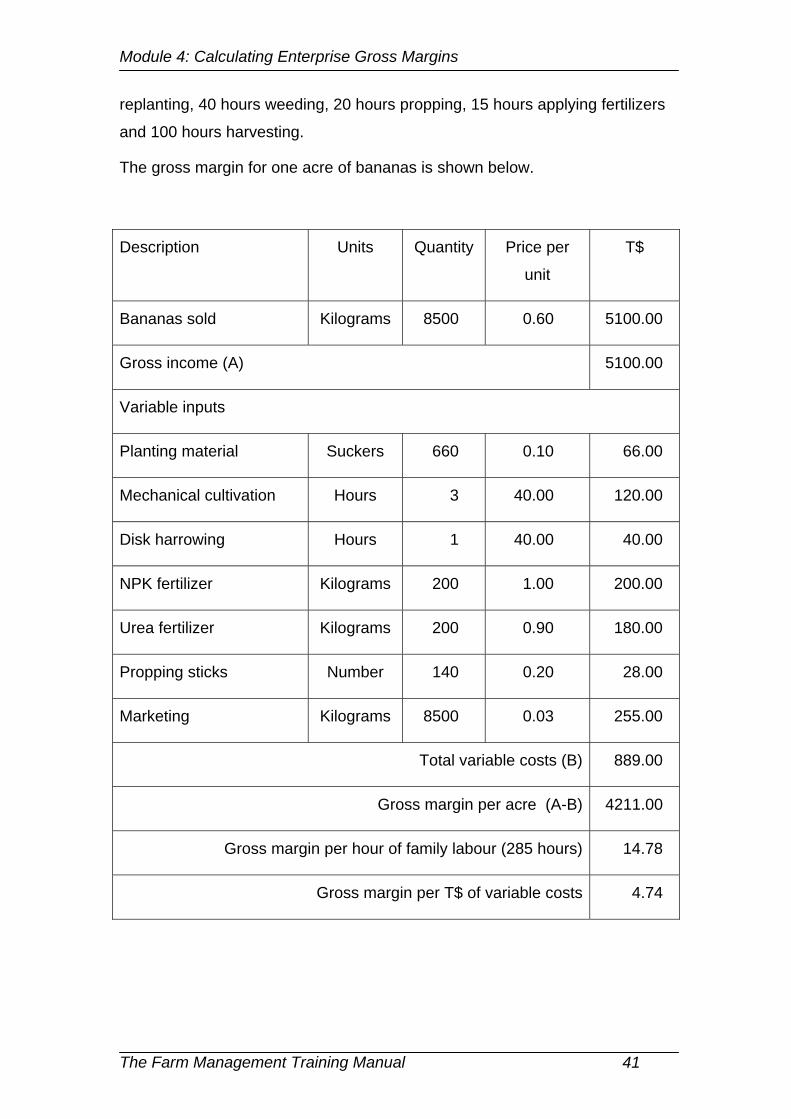
The gross margin for one acre of bananas is shown below.
Description Units Quantity Price per
unit
T$
Bananas sold Kilograms 8500 0.60 5100.00
Gross income (A) 5100.00
Variable inputs
Planting material Suckers 660 0.10 66.00
Mechanical cultivation Hours 3 40.00 120.00
Disk harrowing Hours 1 40.00 40.00
NPK fertilizer Kilograms 200 1.00 200.00
Urea fertilizer Kilograms 200 0.90 180.00
Propping sticks Number 140 0.20 28.00
Marketing Kilograms 8500 0.03 255.00
Total variable costs (B) 889.00
Gross margin per acre (A-B) 4211.00
Gross margin per hour of family labour (285 hours) 14.78
Gross margin per T$ of variable costs 4.74
The Farm Management Training Manual 41
Module 4: Calculating Enterprise Gross Margins
Small Group Exercise: Calculating Gross Margins Seven enterprises have been chosen for calculating gross margins. Allocate
one enterprise to each group. The groups are to calculate the gross margin for
the enterprise assigned to them, using the information provided.
Task 1 Identifying variable inputs
Before they begin to calculate gross margins, each group is to suggest which
variable inputs they would include for the enterprise that they have been
assigned. There is no single correct answer for this task because farmers may
apply different inputs according to their different situations. For example, a
farmer on very fertile soils might apply no fertilizer whereas a farmer on poor
soils may need to apply several fertilizers for the same crop enterprise.
Task 2 Calculating gross margins
Trainees are to begin by calculating gross income. Gross income is the sum
of revenues obtained from all outputs in the enterprise. There will usually be
only one but, in some cases, there might be more than one. In the final
exercise, semi-intensive broiler, for example, poultry manure is sold as well as
the broilers themselves.
Explain that gross revenue is calculated by multiplying the price per unit of
output by the quantity produced. As mentioned in Module 2, all outputs should
be valued regardless of their final destination. Trainees should value unsold
output at the same price that is used for output that is sold.
Ask trainees how they would decide which values to vary when undertaking a
sensitivity analysis. Two things should influence their choice. First, ask them
to think about which factors are most critical to their profit. The most common
examples are output prices and yields, and these are the variables that tend
to get used in the exercises. Other possibilities are prices of key inputs.
Second, choose those factors whose values vary a lot and are uncertain.
Again, yields and prices of the main output are often difficult to forecast. On
the other hand, you usually have a better idea of the prices and quantities of
farm inputs used.
The Farm Management Training Manual 42
Module 4: Calculating Enterprise Gross Margins
Calculations
Each group is to perform the following calculations, except for the semi-
intensive broiler enterprise:
• Total gross margin per acre for the production period.
• Gross margin per dollar of variable cost.
• Gross margin per hour of family labour.
An additional calculation for groups that select the kava or paper mulberry
enterprise is the gross margin in each year.
Groups choosing the semi-intensive broiler enterprise are to calculate the total
gross margin for the production period, gross margin per bird sold and gross
margin per dollar of fixed capital.
Check that all groups have managed to estimate gross income successfully
before continuing to calculate variable costs.
The Farm Management Training Manual 43
Module 4: Calculating Enterprise Gross Margins
Enterprise 1 Sweet potato
Outputs
Five tonnes of sweet potato tubers are produced on an acre of land. Four
tonnes of tubers are sold in Talamahu market at T$0.60 per kilogram and the
farm household consumes the other tonne.
Variable inputs
Production inputs
A total of 10,000 vine tip cuttings are planted in mounds. Each cutting is
estimated to have a value of T$0.02.
The farmer hires machinery for ploughing, slashing and ridging that costs
T$40 per hour. The first ploughing/slashing takes 1.5 hours and the second
ploughing also takes 1.5 hours. Ridging takes 1 hour.
The farmer controls for sweet potato scab by applying 1.8 kg of the fungicide,
Manzate 200 80% WP. Also, 9 litres of the insecticide, Diazinon 20% EC, are
used to prevent infestation of the sweet potato weevil. Manzate costs the
farmer T$20 per kg and Diazinon costs T$35 per litre. Mistblower operations
take place on three occasions costing T$4 each time.
The following details are provided on family labour inputs per acre. Twenty
hours are spent preparing planting material, 60 hours planting, 100 hours
weeding, 40 hours mounding, 24 hours spraying and 50 hours harvesting.
Marketing inputs
It costs T$42.50 to sell each tonne of tubers sold in Talamahu market.
The Farm Management Training Manual 44
Module 4: Calculating Enterprise Gross Margins
Enterprise 2 Watermelon
Outputs
The output of watermelons on an acre of land is estimated to be 12 tonnes.
None is to be retained for consumption by the household. Ten tonnes are to
be sold for export to New Zealand and the remaining 2 tonnes are to be sold
in Talamahu market. The export price is T$1.00 per kg. The farmer expects to
sell watermelons destined for Talamahu market at T$0.80 per kg.
Variable inputs
Production inputs
The farmer uses 1 kg of watermelon seeds per acre, costing T$120 per
kilogram.
The farmer hires machinery for ploughing, slashing and disk harrowing that
costs T$40 per hour. The first ploughing/slashing takes 1.5 hours and the
second ploughing also takes 1.5 hours. The disk harrowing takes 1 hour.
Two fertilizer applications are recommended. The farmer applies 200 kg of
NPK 8:33:18, at a cost of T$1.00 per kg, and 80 kg of urea are applied at a
cost of T$0.90 per kg.
The farmer applies 2 kg of the fungicide, Manzate 200 80% WP, one litre each
of Afugan and Agral, and 0.4 litre of Punch. One litre each is used of the
insecticides, Malathion and Perfekthion, in addition to 1 kg of Snail Away. The
costs of the chemicals to the farmer are T$20 per kg for Manzate, T$45 per
litre for Malathion, T$42 per litre for Perfekthion, T$120 per litre for Afugan,
T$8 per litre for Agral and T$280 per litre for Punch. Snail Away costs T$13
per kg. Mistblower operations cost T$4 and take place on 10 occasions.
The following details are provided on family labour requirements. Planting
takes 40 hours; fertilizer application takes 20 hours; spraying takes 30 hours;
weeding takes 60 hours; watering and mulching take 55 hours; and harvesting
takes 60 hours.
Marketing inputs. The marketing costs charged by the exporter are T$0.35 per
kg. It costs T$0.25 to sell each tonne of watermelons in Talamahu market.
The Farm Management Training Manual 45
Module 4: Calculating Enterprise Gross Margins
Enterprise 3 Tomato
Outputs
The output of tomatoes on an acre of land is estimated to be 7.5 tonnes. None
is to be retained for consumption by the household and all is to be sold in
Talamahu market. The farmer expects to receive T$2.00 per kg.
Variable inputs
Production inputs
The farmer uses three 20-gram packets of tomato seeds per acre. Each
packet of seed is estimated to cost T$20.
The farmer hires machinery for ploughing, slashing and disk harrowing that
costs T$40 per hour. The first ploughing/slashing takes 1.5 hours and the
second ploughing also takes 1.5 hours. The disk harrowing takes 1 hour.
Three fertilizers are applied: chicken manure (600 kg); NPK 8:33:18 (150 kg);
and urea (100 kg). Their costs are T$0.10/kg, T$1.00/kg and T$0.90/kg,
respectively.
Staking of the tomatoes requires a total of 8900 stakes per acre. Each stake is
valued at T$0.05.
The farmer applies 0.5 kg of the fungicide, Benlate 50% WP, which costs
T$85 per kg. Three kilograms of the fungicide, Manzate 200 80% WP, are
used at a cost of T$20 per kg. Two litres of the insecticide, Malathion, are
applied to control for leaf rollers, leaf miners and cucumber beetles, at a cost
of T$45 per litre. Mistblower operations cost T$4 and take place on 10
occasions.
The following family labour requirements are provided. Planting takes 106
hours; pruning takes 40 hours; fertilizing takes 12 hours; spraying takes 40
hours; weeding takes 150 hours; watering and mulching take 100 hours; and
harvesting takes 240 hours.
Marketing inputs
It costs an average of T$0.04 to sell each kilogram of tomatoes in Talamahu market.
The Farm Management Training Manual 46
Module 4: Calculating Enterprise Gross Margins
Enterprise 4 Squash
Outputs
The output of squash on an acre of land is estimated to be 3.5 tonnes. All of
the output is to be sold for export to Japan. The price received by the farmer is
T$0.60 per kg.
Variable inputs
Production inputs
The farmer uses 0.5 kg of squash seeds per acre. Each kilogram of seed is
estimated to cost T$240.
The farmer hires machinery for ploughing, slashing, disk harrowing and
ripping that costs T$40 per hour. The first ploughing/slashing takes 3.5 hours.
The disk harrowing takes 1 hour, as does the ripping.
Nitrophoska is applied at the rate of 6 litres, costing T$5.50 per litre. A total of
200 kg of NPK 8:33:18 are applied, at a cost of T$1.00 per kg, and 80 kg of
urea are applied at a cost of T$0.90 per kg.
The farmer applies 1 kg of the fungicide, Manzate 200 80% WP, 1 litre each of
Afugan and Agral, and 0.4 litre of Punch. One litre each of the insecticides,
Malathion 50% EC, Perfekthion, is applied to control for leaf miners, leaf
rollers and cucumber beetles. The costs of the chemicals to the farmer are
T$20 per kg for Manzate, T$45 per litre for Malathion, T$42 per litre for
Perfekthion, T$120 per litre for Afugan, T$8 per litre for Agral and T$280 per
litre for Punch. Mistblower operations take place on 15 occasions and cost
T$4 per operation.
The family labour requirements are 40 hours for planting, 20 hours for
fertilizing, 50 hours for spraying, 30 hours for weeding, 50 hours for harvesting
and 15 hours for processing and packing.
Marketing inputs
The farmer spends T$40 per tonne to get the squash prepared for the
exporter.
The Farm Management Training Manual 47
Module 4: Calculating Enterprise Gross Margins
Enterprise 5 Kava
Output
The output of green kava is 8.6 tonnes per acre. All is to be harvested in year
5 and sold in the domestic market in powder form. The conversion rate from
green kava to kava powder is 4:1.The price received for 1 kilogram of kava
powder is T$20.
Variable inputs
Production inputs
The farmer uses 1800 seedlings per acre in year 1. Each seedling is
estimated to cost T$1.50.
The farmer applies 0.5 litres of Diazinon 20% EC in each of the first three
years at a cost of T$35 per litre.
The following family labour requirements are provided. Land preparation and
planting take 130 hours in the first year. Maintenance takes 250 hours in the
first year and 400 hours in each year from the second to the fourth year. In the
fifth year, harvesting takes 230 hours, processing and packing into kava
powder takes 430 hours, and selling the kava powder takes 70 hours.
Processing inputs
Crushing costs in year 5 are T$375 per tonne of green kava.
Marketing inputs
The marketing costs are T$300 in year 5.
The Farm Management Training Manual 48
Module 4: Calculating Enterprise Gross Margins
Enterprise 6 Paper Mulberry
Output
A farmer grows paper mulberry in Ha'apai in a four-year production cycle, with
380 bundles of sticks harvested in year 2, 500 bundles in year 3 and 500
bundles also in year 4. One bundle is equal to 20 sticks. The skin is taken off
the stick and each skin is sold in Nuku'alofa for an average price of T$4.00.
Variable inputs
Production inputs
In the first year of the production cycle, the farmer plants 2600 suckers per
acre, worth T$0.30 each, and hires machinery to cultivate the land for three
hours, costing T$40 per hour.
Only family labour is used in production, processing and marketing. Land
preparation and planting take 60 hours in the first year. Maintenance takes
100 hours in the first year and 60 hours in each year from the second to the
fourth year. Weeding takes 30 hours in each of the first three years and 20
hours in the fourth year. Harvesting takes 60 hours in year 2 and 100 hours in
each of years 3 and 4. Four hours of labour are needed to take the skins of a
bundle of 20 sticks.
Marketing inputs
The non-labour cost of marketing 100 skins is T$8.20. Marketing also requires
70 hours of family labour in each year from the second to the fourth year.
The Farm Management Training Manual 49
Module 4: Calculating Enterprise Gross Margins
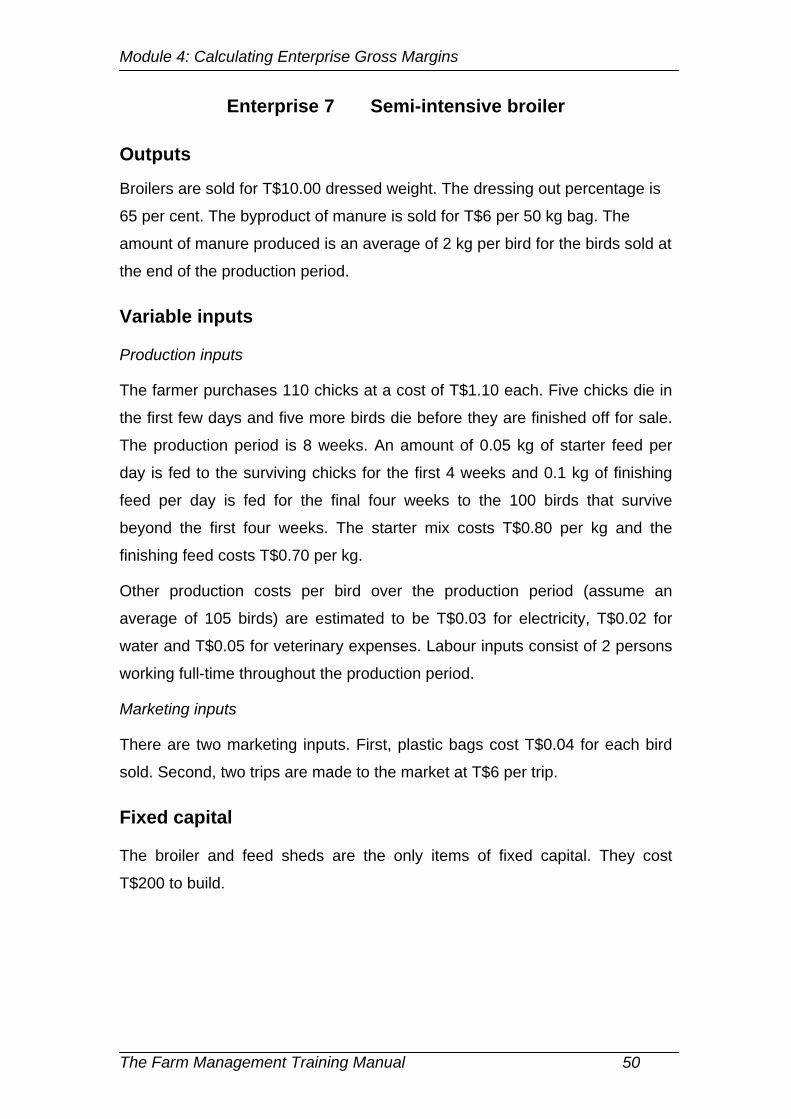
Enterprise 7 Semi-intensive broiler
Outputs
Broilers are sold for T$10.00 dressed weight. The dressing out percentage is
65 per cent. The byproduct of manure is sold for T$6 per 50 kg bag. The
amount of manure produced is an average of 2 kg per bird for the birds sold at
the end of the production period.
Variable inputs
Production inputs
The farmer purchases 110 chicks at a cost of T$1.10 each. Five chicks die in
the first few days and five more birds die before they are finished off for sale.
The production period is 8 weeks. An amount of 0.05 kg of starter feed per
day is fed to the surviving chicks for the first 4 weeks and 0.1 kg of finishing
feed per day is fed for the final four weeks to the 100 birds that survive
beyond the first four weeks. The starter mix costs T$0.80 per kg and the
finishing feed costs T$0.70 per kg.
Other production costs per bird over the production period (assume an
average of 105 birds) are estimated to be T$0.03 for electricity, T$0.02 for
water and T$0.05 for veterinary expenses. Labour inputs consist of 2 persons
working full-time throughout the production period.
Marketing inputs
There are two marketing inputs. First, plastic bags cost T$0.04 for each bird
sold. Second, two trips are made to the market at T$6 per trip.
Fixed capital
The broiler and feed sheds are the only items of fixed capital. They cost
T$200 to build.
The Farm Management Training Manual 50

Module 5: Partial Budgeting
Module 5
Partial Budgeting
The Farm Management Training Manual 51
Module 5: Partial Budgeting
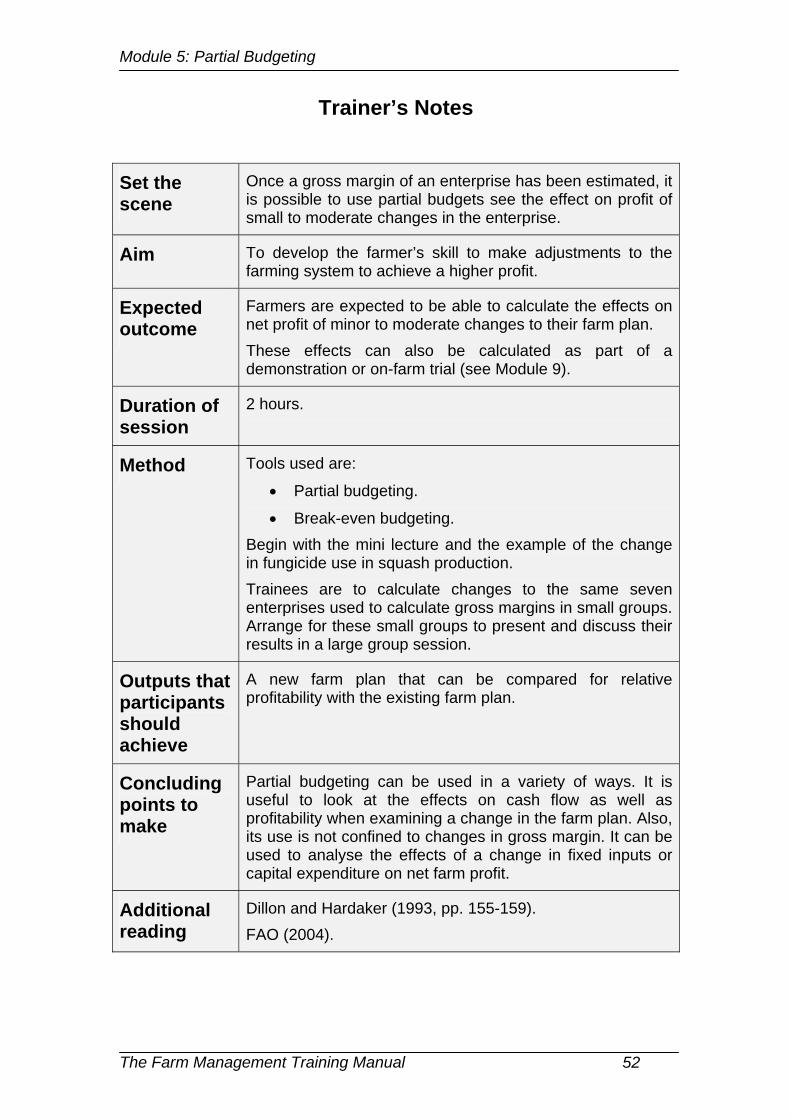
Trainer’s Notes
Set the scene
Once a gross margin of an enterprise has been estimated, it is possible to use partial budgets see the effect on profit of small to moderate changes in the enterprise.
Aim To develop the farmer’s skill to make adjustments to the farming system to achieve a higher profit.
Expected outcome
Farmers are expected to be able to calculate the effects on net profit of minor to moderate changes to their farm plan. These effects can also be calculated as part of a demonstration or on-farm trial (see Module 9).
Duration of session
2 hours.
Method Tools used are:
• Partial budgeting.
• Break-even budgeting. Begin with the mini lecture and the example of the change in fungicide use in squash production. Trainees are to calculate changes to the same seven enterprises used to calculate gross margins in small groups. Arrange for these small groups to present and discuss their results in a large group session.
Outputs that participants should achieve
A new farm plan that can be compared for relative profitability with the existing farm plan.
Concluding points to make
Partial budgeting can be used in a variety of ways. It is useful to look at the effects on cash flow as well as profitability when examining a change in the farm plan. Also, its use is not confined to changes in gross margin. It can be used to analyse the effects of a change in fixed inputs or capital expenditure on net farm profit.
Additional reading
Dillon and Hardaker (1993, pp. 155-159). FAO (2004).
The Farm Management Training Manual 52
Module 5: Partial Budgeting
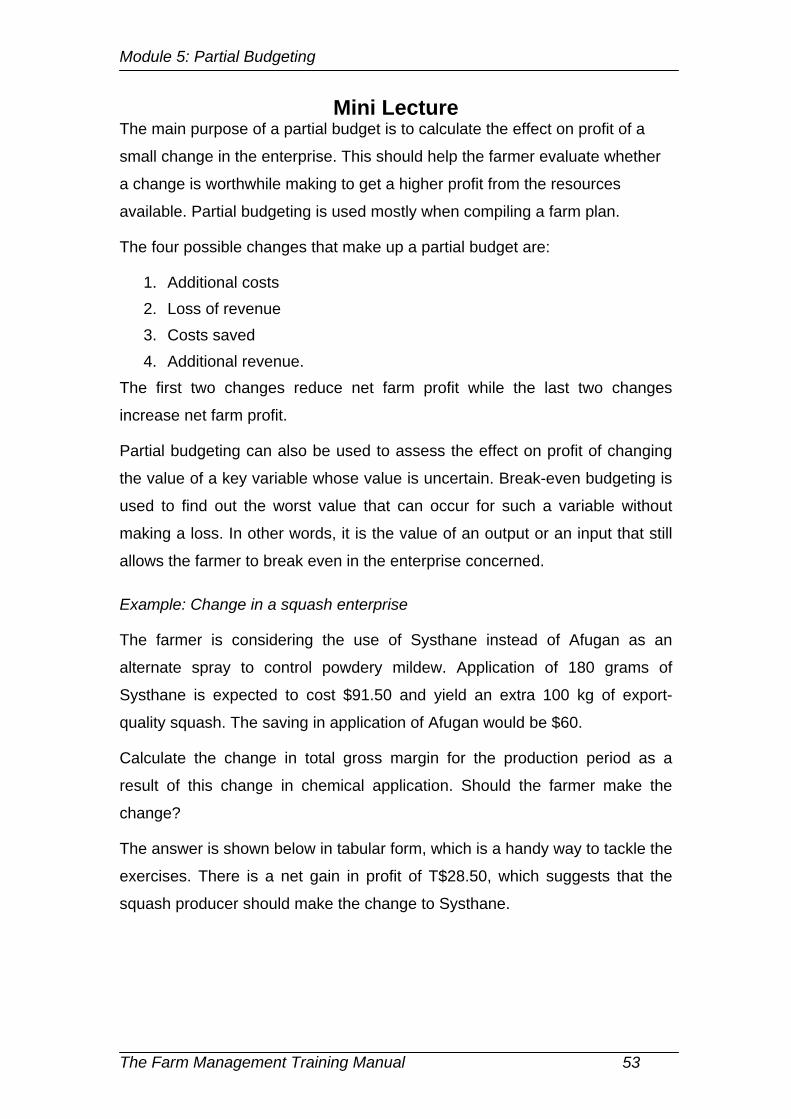
Mini Lecture The main purpose of a partial budget is to calculate the effect on profit of a
small change in the enterprise. This should help the farmer evaluate whether
a change is worthwhile making to get a higher profit from the resources
available. Partial budgeting is used mostly when compiling a farm plan.
The four possible changes that make up a partial budget are:
1. Additional costs 2. Loss of revenue 3. Costs saved 4. Additional revenue.
The first two changes reduce net farm profit while the last two changes
increase net farm profit.
Partial budgeting can also be used to assess the effect on profit of changing
the value of a key variable whose value is uncertain. Break-even budgeting is
used to find out the worst value that can occur for such a variable without
making a loss. In other words, it is the value of an output or an input that still
allows the farmer to break even in the enterprise concerned.
Example: Change in a squash enterprise
The farmer is considering the use of Systhane instead of Afugan as an
alternate spray to control powdery mildew. Application of 180 grams of
Systhane is expected to cost $91.50 and yield an extra 100 kg of export-
quality squash. The saving in application of Afugan would be $60.
Calculate the change in total gross margin for the production period as a
result of this change in chemical application. Should the farmer make the
change?
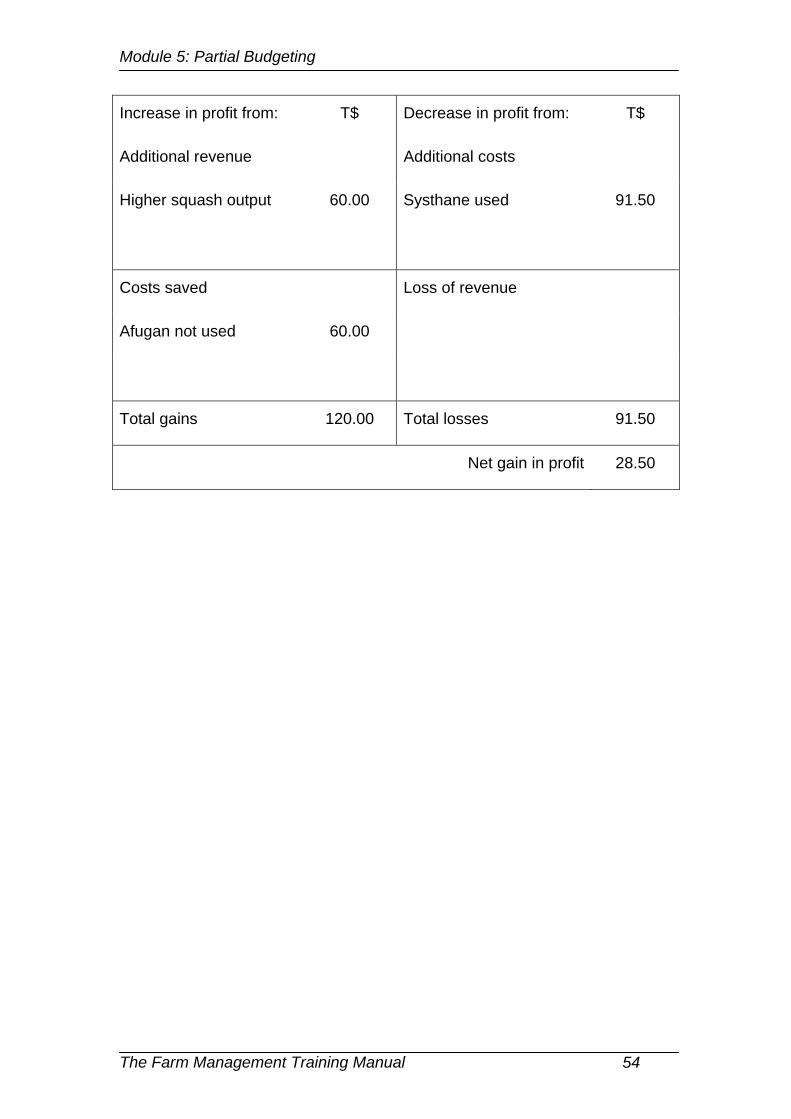
The answer is shown below in tabular form, which is a handy way to tackle the
exercises. There is a net gain in profit of T$28.50, which suggests that the
squash producer should make the change to Systhane.
The Farm Management Training Manual 53
Module 5: Partial Budgeting
Increase in profit from: T$ Decrease in profit from: T$
Additional revenue Additional costs
Higher squash output 60.00 Systhane used 91.50
Costs saved Loss of revenue
Afugan not used 60.00
Total gains 120.00 Total losses 91.50
Net gain in profit 28.50
The Farm Management Training Manual 54
Module 5: Partial Budgeting
Small Group Exercise: Calculating Partial Budgets
Form the trainees into the same small groups that calculated gross margins
and assign the same enterprise that the group chose in the gross margins
exercise. The following information on changes to the farm plan for each
enterprise is provided to calculate the partial budget.
Start by explaining to trainees the main purpose of a partial budget. Inform
them that they get experience in using them in Module 8 when compiling a
farm plan.
Normally, a farmer would evaluate the effect on the farm plan of a single
change at a time. This is the case in some exercises. In others, trainees are
asked to make two separate changes so that they have experience in
calculating all four types of effects on profit.
Ask all groups to start by identifying any additional costs and then to calculate
them. Check that all groups have managed to calculate them successfully
before continuing. Do the same for calculation of revenue lost, then costs
saved and, finally, additional revenue.
The Farm Management Training Manual 55
Module 5: Partial Budgeting
Enterprise 1 Sweet potato
Task 1
The farmer has decided no longer to apply any of the fungicide, Manzate 200
80% WP. The effect is to reduce the yield of tubers of sweet potato produced
from 5 tonnes per acre to 4.8 tonnes per acre.
Calculate the change in total gross margin for the production period as a
result of not applying Manzate. Should the farmer make the change?
Task 2
The farmer uses hired labour for land preparation instead of hiring machinery
for ploughing, slashing and ridging. Hired labour is to be employed for 10 days
and the wage paid is T$24 per day. There is no effect on any other farm
operation or on the output of tubers.
Calculate the change in total gross margin for the production period as a
result of changing from machinery hire to labour hire. Should the farmer make
the change?
Enterprise 2 Watermelon
Task
The farmer has decided to use a new, better-tasting variety of watermelon that
is preferred in the export market. Its seeds cost an extra T$20 per kg. Yield is
expected to be 400 kg per acre lower, which leads to a reduction in the
amount supplied to the domestic market while leaving the export volume
unchanged. On the other hand, the price of export watermelons is expected to
be 5 seniti per kg higher. The price of melons sold in the domestic market is
not expected to change. The new variety needs 50 kg NPK 8:33:18 less than
the existing variety.
Calculate the change in total gross margin for the production period as a
result of this change in seed variety. Should the farmer make the change?
The Farm Management Training Manual 56
Module 5: Partial Budgeting
Enterprise 3 Tomato
Task 1
The farmer is thinking about an increase in the planting density that would
result in the use of one additional 20 g packet of seeds per acre. This move
would result in additional costs of T$150 for stakes, T$20 for chicken manure,
T$35 for NPK 8:33:18, T$20 for Urea, T$30 for Manzate, T$25 for Malathion,
T$12 for mistblower operation and T$10 for marketing. In addition, the farmer
would have to hire 4 days of labour at T$25 per day. Yield is expected to
increase to 7.75 tonnes per acre.
Calculate the change in total gross margin for the production period as a
result of this change in planting density. Should the farmer make the change?
Task 2
The farmer has decided to hire labour to supply tomatoes to Talamahu market
rather than pay the current marketing costs. She estimates that she would
need to pay wages of T$25 per day for 12 days.
Calculate the change in total gross margin for the production period as a
result of this change in marketing practice. Should the farmer make the
change?
Enterprise 4 Squash
Task
The farmer is concerned that monocropping squash is making the enterprise
more prone to pests and diseases. Rather than apply more chemicals, he is
deciding whether to plant a mix of crops on an acre of land currently planted
to squash, with 0.3 acres planted to sweet potato and 0.2 acres planted to
cassava leaving the remaining 0.5 acres in squash. The land used for squash
production is to remain in fallow for the rest of the year. This change would
lead to a decline in the squash yield to 3.0 tonnes per acre. The additional
revenue earned from sweet potato would be T$700 and the additional costs
would be T$300. The additional revenue earned from cassava would be
T$550 and the additional costs would be T$140.
The Farm Management Training Manual 57
Module 5: Partial Budgeting
Calculate the change in total gross margin for the production period as a
result of the move to mixed cropping. Should the farmer make the change?
Enterprise 5 Kava
Task 1
The farmer decides to harvest the acre of kava at the end of Year 4 rather
than Year 5. The yield is expected to be 2 tonnes of kava powder. Crushing
costs are expected to fall by T$225, Diazinon will not be applied in Year 3 and
marketing costs should decline by T$20. In the fifth year, he plants bananas
on the acre previously planted to kava, earning a gross margin after family
labour cost of $3227.
Calculate the change in total gross margin for the production period as a
result of the earlier harvesting date. Should the farmer make the change?
Task 2
Return to the original gross margin budget. Now, the farmer is thinking about
applying NPK fertilizer at a cost of T$100 in each of the first four years. Yield
is anticipated to increase to 2175 kg of kava powder per acre when the kava
is harvested in Year 5. No other changes are expected.
Calculate the change in total gross margin for the production period as a
result of applying NPK. Should the farmer make the change?
Enterprise 6 Paper mulberry
Task 1
The farmer decides to sell the paper mulberry sticks to a local wholesaler in
Pangai prior to removing the skins, rather than do the processing herself and
travel to Nuku’alofa to sell the skins. A bundle of 20 sticks are to be sold for
T$40. The farmer gets a job in town working the same number of hours she
previously took to remove and market the skins. The wage is T$4 per hour.
Calculate the change in total gross margin for the production period as a
result of not processing and marketing the final product. Should the farmer
make the change?
The Farm Management Training Manual 58
Module 5: Partial Budgeting
Task 2
The farmer is thinking about interplanting swamp taro in alternate rows with
paper mulberry in the first year of production. The additional revenue from
swamp taro is expected to be T$2380 per acre and the additional production
and marketing costs are expected to be T$580 per acre. Paper mulberry
output is expected to decline by 400 skins and T$50 of marketing costs would
be saved. There would be a net reduction of 1500 hours worked by family
labour. One-third of this time is to be spent in casual labour employment at
T$3.40 per hour.
Calculate the change in total gross margin for the production period as a
result of interplanting swamp taro in the first year. Should the farmer make the
change?
Enterprise 7 Semi-intensive broiler
Task 1
The farmer decides to change to a new finishing feed mix. It costs an
additional 20 seniti per kg but each bird is expected to sell for 50 seniti more.
Calculate the change in total gross margin for the production period as a
result of using the new feed mix. Should the farmer make the change?
Task 2
The farmer is thinking about not using veterinary inputs. As a result, she
expects two more birds to die: one in the first few days after purchase and one
during the finishing period. Assume there are no changes in marketing costs
or the amount of manure produced.
Calculate the change in total gross margin for the production period as a
result of not using veterinary inputs. Should the farmer make the change?
The Farm Management Training Manual 59

Module 6: Scheduling Labour Activities
Module 6
Scheduling Labour
Activities
The Farm Management Training Manual 60
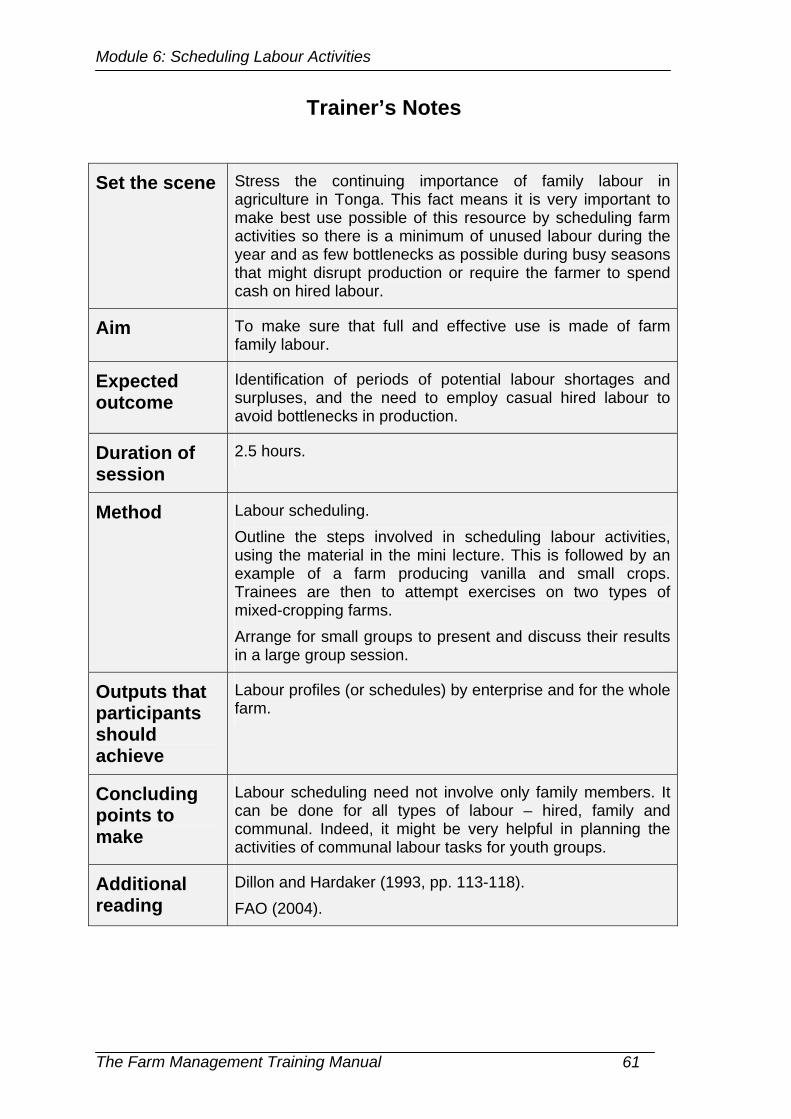
Module 6: Scheduling Labour Activities
Trainer’s Notes
Set the scene Stress the continuing importance of family labour in agriculture in Tonga. This fact means it is very important to make best use possible of this resource by scheduling farm activities so there is a minimum of unused labour during the year and as few bottlenecks as possible during busy seasons that might disrupt production or require the farmer to spend cash on hired labour.
Aim To make sure that full and effective use is made of farm family labour.
Expected outcome
Identification of periods of potential labour shortages and surpluses, and the need to employ casual hired labour to avoid bottlenecks in production.
Duration of session
2.5 hours.
Method Labour scheduling. Outline the steps involved in scheduling labour activities, using the material in the mini lecture. This is followed by an example of a farm producing vanilla and small crops. Trainees are then to attempt exercises on two types of mixed-cropping farms. Arrange for small groups to present and discuss their results in a large group session.
Outputs that participants should achieve
Labour profiles (or schedules) by enterprise and for the whole farm.
Concluding points to make
Labour scheduling need not involve only family members. It can be done for all types of labour – hired, family and communal. Indeed, it might be very helpful in planning the activities of communal labour tasks for youth groups.
Additional reading
Dillon and Hardaker (1993, pp. 113-118). FAO (2004).
The Farm Management Training Manual 61
Module 6: Scheduling Labour Activities
Mini Lecture The scheduling of labour among enterprises is important for smallholders wishing
to increase their profits because labour, especially family labour, is one of the two
most important resources available to the farmer (the other being the land itself).
For effective labour scheduling, it helps to prepare a labour profile. A labour
profile shows the seasonal labour requirements of each enterprise and of the
farm as a whole. The time interval chosen can vary from days to years but for
most purposes a month or a quarter is sufficient. Labour requirements and
availability are usually measured in hours or days. Monthly profiles of hours of
labour required and available are used in the example and exercises that follow.
There are five steps to follow to construct a labour profile:
1. Calculate the total number of hours or days required to conduct each
enterprise.
2. Divide the total number of hours/days required for each enterprise into
monthly or quarterly intervals.
3. Calculate the total number of hours/days required by all enterprises in
each month/quarter.
4. Calculate the number of hours/days that household members are available
during each month/quarter.
5. Subtract the required number of hours from the number of hours of
available labour. For any month/quarter, there is a labour surplus if the
figure is positive and a labour deficit if the figure is negative.
Example: Vanilla-Based Mixed Cropping Farm
Consider a smallholder who is growing 1 acre of vanilla, now in its fifth year, and
plans to grow 1 acre of early yams, to be planted in June and July, and half an
acre of pineapples, to be planted in March. There are 3 acres in fallow. Labour
requirements for each enterprise are shown in hours on a monthly basis in the
third to fifth columns of the labour profile presented in the Table 6.1. The total
monthly labour requirement is shown in the sixth column. Total labour availability
is shown in the second last column and the balance between labour requirement
and availability is shown as a surplus (+) or deficit (-) in the final column.
The Farm Management Training Manual 62
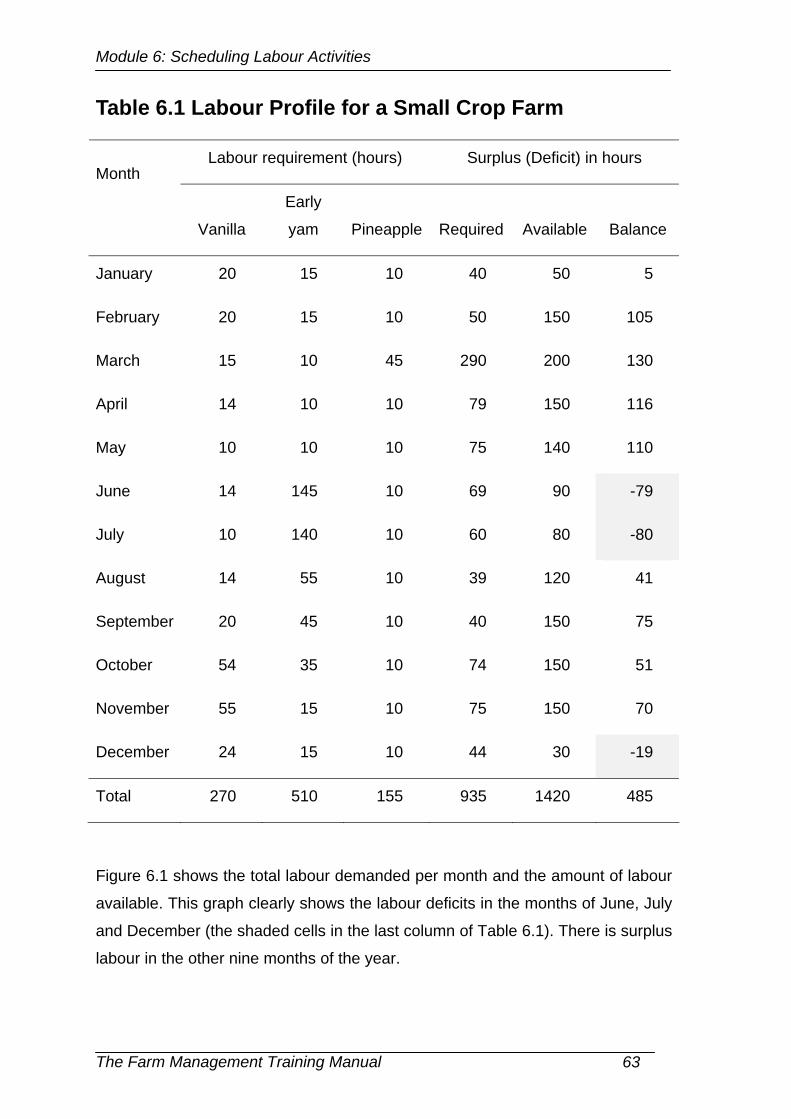
Module 6: Scheduling Labour Activities
Table 6.1 Labour Profile for a Small Crop Farm
Labour requirement (hours) Surplus (Deficit) in hours Month
Vanilla
Early
yam Pineapple Required Available Balance
January 20 15 10 40 50 5
February 20 15 10 50 150 105
March 15 10 45 290 200 130
April 14 10 10 79 150 116
May 10 10 10 75 140 110
June 14 145 10 69 90 -79
July 10 140 10 60 80 -80
August 14 55 10 39 120 41
September 20 45 10 40 150 75
October 54 35 10 74 150 51
November 55 15 10 75 150 70
December 24 15 10 44 30 -19
Total 270 510 155 935 1420 485
Figure 6.1 shows the total labour demanded per month and the amount of labour
available. This graph clearly shows the labour deficits in the months of June, July
and December (the shaded cells in the last column of Table 6.1). There is surplus
labour in the other nine months of the year.
The Farm Management Training Manual 63
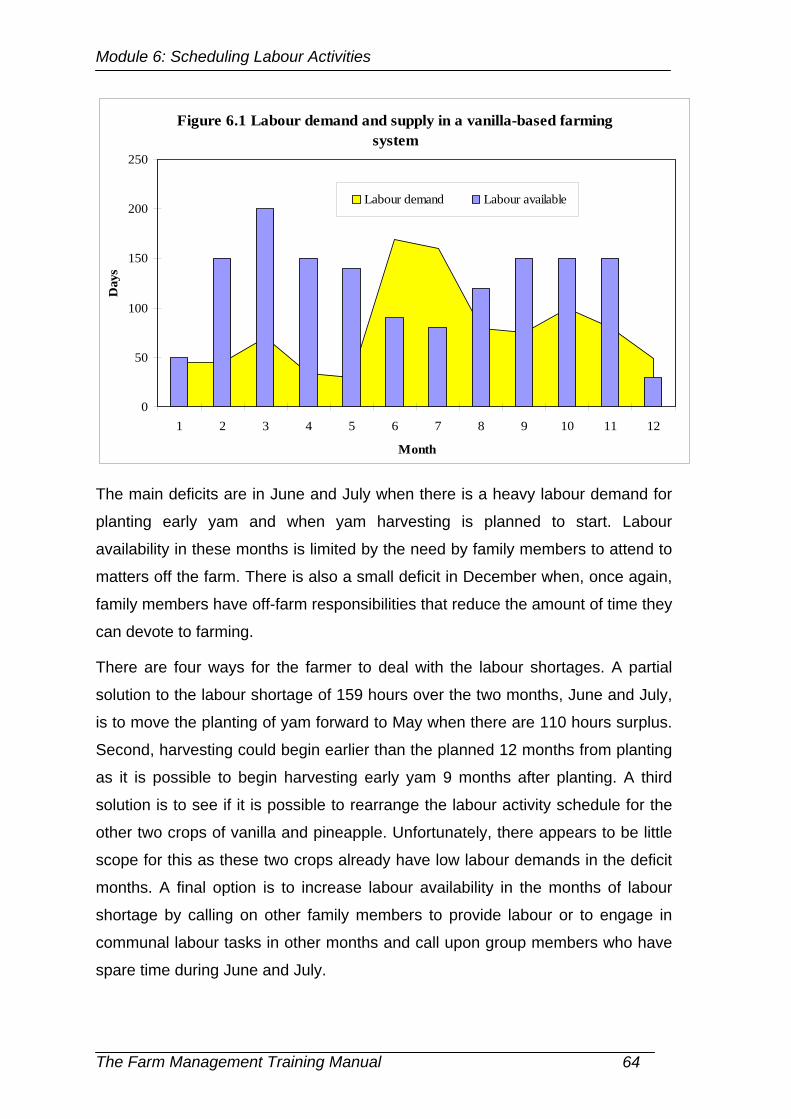
Module 6: Scheduling Labour Activities
Figure 6.1 Labour demand and supply in a vanilla-based farming system
0
50
100
150
200
250
1 2 3 4 5 6 7 8 9 10 11 12
Month
Day
s
Labour demand Labour available
The main deficits are in June and July when there is a heavy labour demand for
planting early yam and when yam harvesting is planned to start. Labour
availability in these months is limited by the need by family members to attend to
matters off the farm. There is also a small deficit in December when, once again,
family members have off-farm responsibilities that reduce the amount of time they
can devote to farming.
There are four ways for the farmer to deal with the labour shortages. A partial
solution to the labour shortage of 159 hours over the two months, June and July,
is to move the planting of yam forward to May when there are 110 hours surplus.
Second, harvesting could begin earlier than the planned 12 months from planting
as it is possible to begin harvesting early yam 9 months after planting. A third
solution is to see if it is possible to rearrange the labour activity schedule for the
other two crops of vanilla and pineapple. Unfortunately, there appears to be little
scope for this as these two crops already have low labour demands in the deficit
months. A final option is to increase labour availability in the months of labour
shortage by calling on other family members to provide labour or to engage in
communal labour tasks in other months and call upon group members who have
spare time during June and July.
The Farm Management Training Manual 64
Module 6: Scheduling Labour Activities
Note that there is a lot of surplus labour in February, March, April and May. If
labour is obtained to cover the shortfalls in June and July, it might be possible to
plant extra crops on the fallow land from February to May providing the
enterprises require only small amounts of labour in the period from June to
August and in December. Unfortunately, the planting time for most vegetables in
Tonga is from June to October. But other crops can be planted year-round or are
best planted during periods that overlap with the time that surplus labour is
available. For example, the recommended planting period is from January to April
for kava, year-round but best from November to March for bananas, and year-
round but best from March to July for sweet potato (MAFF 2000).
The Farm Management Training Manual 65
Module 6: Scheduling Labour Activities
Small Group Exercises: Scheduling Labour
Exercise 1: Case Study Mixed Cropping Farm with Squash, Kava, Tomato and Root Crops
A farmer is producing five crops on 8.25 acres of land: squash; kava; sweet
potato; cassava; and tomatoes. You are provided with the following information
on labour availability in the farm household and the labour requirements of each
enterprise.
Labour availability
The amount of family labour available in hours each month is as follows:
Jan Feb Mar Apr May Jun Jul Aug Sep Oct Nov Dec
140 230 230 230 230 190 190 230 230 230 220 60
Labour requirements
Three acres will be left fallow over the next year, and will be grazed by a few
animals. Tending the animals is expected to require 5 hours of labour every
month. There will be some general farming demands on the farmer’s time, as
follows (in hours):
Jan Feb Mar Apr May Jun Jul Aug Sep Oct Nov Dec
10 10 60 40 20 10 10 10 10 50 15 10
Five crops are to be grown during the year. One acre of squash will be planted in
August. It will require 55 hours of labour in August, 50 hours in September and 85
hours in October.
Half an acre of kava is to be planted in March while 1.5 acres have been planted
in the past. Of these 1.5 acres, half an acre is 2 years old, half an acre is 4 years
old and half an acre is in its sixth year and is about to be harvested. Total labour
requirements in hours for the 2 acres are as follows:
Jan Feb Mar Apr May Jun Jul Aug Sep Oct Nov Dec
110 110 155 65 80 80 70 55 70 80 110 110
The Farm Management Training Manual 66
Module 6: Scheduling Labour Activities
The preparation of sweet potato cuttings is to begin for planting 1.5 acres in
March and April. Harvesting is to take place in September. The schedule for
labour requirements in hours is as follows:
Jan Feb Mar Apr May Jun Jul Aug Sep Oct Nov Dec
0 0 50 110 60 60 40 16 110 0 0 0 One-quarter of an acre is to be allotted to tomato plants in July, and the tomatoes
are to be harvested in October. The labour requirements are 31 hours in July, 30
hours each in August and September, and 80 hours in October.
Cassava is to be planted in November on 0.5 acres of the land that was planted
to sweet potato earlier in the year. There is also 0.5 acres already in the ground
at the start of the year that will be harvested towards the end of the year. The
schedule for labour requirements in hours is as follows:
Jan Feb Mar Apr May Jun Jul Aug Sep Oct Nov Dec
15 10 10 8 6 4 4 5 6 10 40 42
Tasks
1. Prepare a labour profile for the year.
2. Identify the main periods of labour surplus and labour shortage.
3. Describe how the farmer can make better use of family labour, assuming it is
impossible to get family members to work any more hours or to get any hired
labour in December.
The Farm Management Training Manual 67
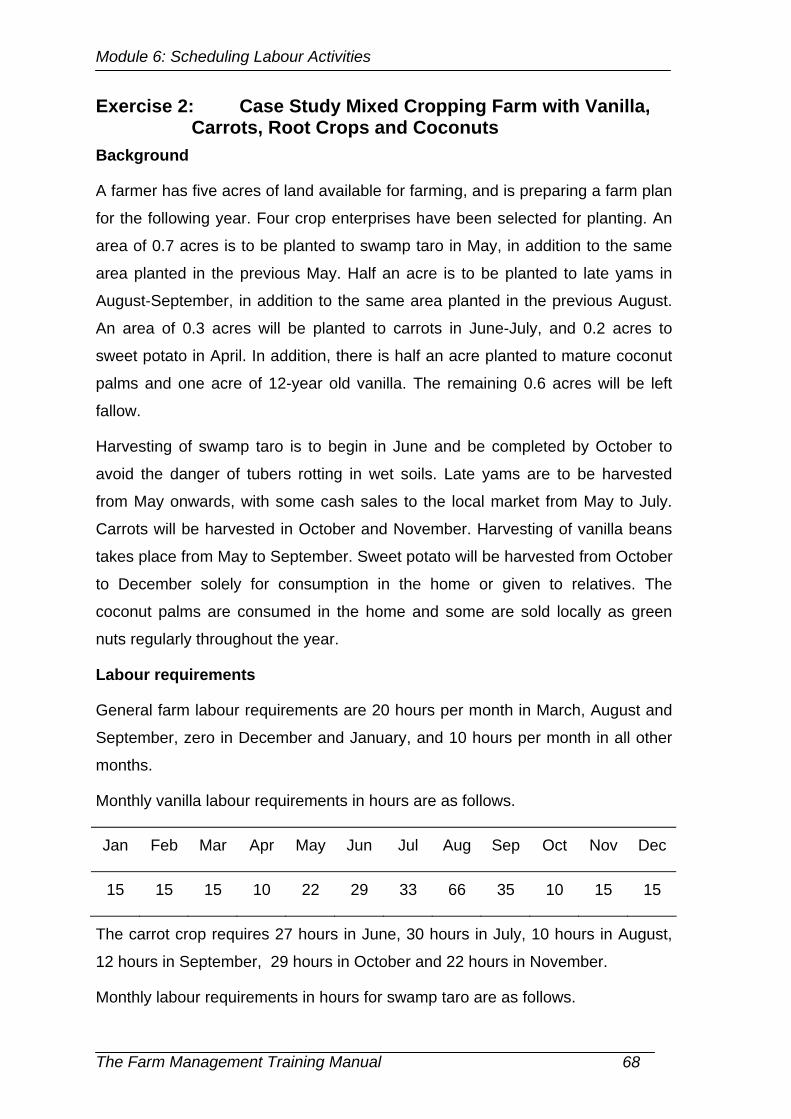
Module 6: Scheduling Labour Activities
Exercise 2: Case Study Mixed Cropping Farm with Vanilla, Carrots, Root Crops and Coconuts
Background
A farmer has five acres of land available for farming, and is preparing a farm plan
for the following year. Four crop enterprises have been selected for planting. An
area of 0.7 acres is to be planted to swamp taro in May, in addition to the same
area planted in the previous May. Half an acre is to be planted to late yams in
August-September, in addition to the same area planted in the previous August.
An area of 0.3 acres will be planted to carrots in June-July, and 0.2 acres to
sweet potato in April. In addition, there is half an acre planted to mature coconut
palms and one acre of 12-year old vanilla. The remaining 0.6 acres will be left
fallow.
Harvesting of swamp taro is to begin in June and be completed by October to
avoid the danger of tubers rotting in wet soils. Late yams are to be harvested
from May onwards, with some cash sales to the local market from May to July.
Carrots will be harvested in October and November. Harvesting of vanilla beans
takes place from May to September. Sweet potato will be harvested from October
to December solely for consumption in the home or given to relatives. The
coconut palms are consumed in the home and some are sold locally as green
nuts regularly throughout the year.
Labour requirements
General farm labour requirements are 20 hours per month in March, August and
September, zero in December and January, and 10 hours per month in all other
months.
Monthly vanilla labour requirements in hours are as follows.
Jan Feb Mar Apr May Jun Jul Aug Sep Oct Nov Dec
15 15 15 10 22 29 33 66 35 10 15 15
The carrot crop requires 27 hours in June, 30 hours in July, 10 hours in August,
12 hours in September, 29 hours in October and 22 hours in November.
Monthly labour requirements in hours for swamp taro are as follows.
The Farm Management Training Manual 68

Module 6: Scheduling Labour Activities
Jan Feb Mar Apr May Jun Jul Aug Sep Oct Nov Dec
20 20 15 20 40 27 30 30 30 28 20 20
Monthly labour requirements in hours for late yams are as follows.
Jan Feb Mar Apr May Jun Jul Aug Sep Oct Nov Dec
16 12 5 5 13 10 10 70 60 20 15 20
Sweet potato has no labour requirements in January or February, but needs 4
hours in March and 12 hours in April. Requirements are 7 hours in each of the
next 4 months, then 6 hours in September, 3 hours in each of October and
November, and 4 hours in December.
Labour requirements for the coconuts enterprise are 4 hours per month
throughout the year. For breadfruit, they are 2 hours per month from May to
September.
Tasks
1. Prepare a labour profile for the year.
2. Identify the main periods of labour surplus and labour shortage.
3. Describe how the farmer can make better use of family labour, assuming it is
impossible to get family members to work any more hours or to get any hired
labour in December.
The Farm Management Training Manual 69

Module 7: Cash-Flow Budgeting
Module 7
Cash-Flow Budgeting
The Farm Management Training Manual 70
Module 7: Cash-Flow Budgeting
Trainer’s Notes
Set the scene Start the session by describing how greater participation in commercial agriculture means that farmers have to pay more attention to cash flows. Preparing cash flow budgets is also important for going to the bank to ask for a loan to finance farming operations. This means keeping track of how much cash is available for farming and other activities from one period to the next.
Aim Identify possible future cash deficits and surpluses.
Expected outcome
Farmers should know how to calculate their net cash flow position for any period in which they are interested, and be able to present a cash flow budget when applying for a loan.
Duration of session
3 hours.
Method Start by identifying the different components of a cash flow budget, outlined in the mini lecture. The cash transactions reported in Module 2 are then entered in an exercise. Get trainees to prepare three cash flow budgets. The first exercise involves the preparation of an annual farm plan for which quarterly cash flows are calculated. In the second exercise, the farmer is building a semi-intensive broiler operation and is preparing an annual cash flow budget on a monthly basis. In the third exercise, time intervals are in years for a long-term piggery development. Arrange for small groups to present and discuss their results in a large group session.
Outputs that participants should achieve
A detailed cash book, with summaries of cash receipts and payments for each period.
Concluding points to make
The length of the selected time interval depends on the purpose of the budget. Cash flow budgets are an integral part of development budgets used for making major changes to the farm plan.
Additional reading
Dillon and Hardaker (1993, pp. 82-84). FAO (2004).
The Farm Management Training Manual 71
Module 7: Cash-Flow Budgeting
Mini Lecture Cash flow analysis is important in farm management for two main reasons:
• It provides information on income and expenditure that can be used to
assess how profitable a farm has been (or is expected to be) in a given
period.
• It enables sound management of the financial side of the farm business,
ensuring that the farmer has sufficient liquidity to meet his or her
obligations.
The concept of cash flow is best described through various cash flow measures,
represented in four rows in Figure 7.1. The first row shows how to derive the net
cash flow of the farm as the total receipts from farming operations minus the total
payments made to undertake these operations. This equation can be expressed
for different periods, from a week to many years. The choice of period depends
on what information the farmer wants from the analysis. A farm plan for the next
year might need a cash flow budget with quarterly intervals. Annual intervals are
likely to be used to plan the introduction of a new long-term enterprise, such as a
tree crop or intensive livestock enterprise.
Where a farmer has borrowed money to conduct these farming operations,
details are needed on how much has been borrowed during the period of analysis
and how much has been paid to the lender in interest and principal repaid. These
transactions are shown in the second row. The result is called farm cash surplus.
The net receipts from other (non-farm) household cash transactions are added to
the farm cash surplus to obtain household net cash income. We include
household receipts and payments in addition to farm cash flows in the third row of
the diagram to reflect the fact that the household and the farm business are
usually highly integrated in Tonga.
The household net cash income is added to the opening cash balance for the
period to calculate the closing cash balance for that period. This is shown in the
final row of Figure 7.1.
The Farm Management Training Manual 72
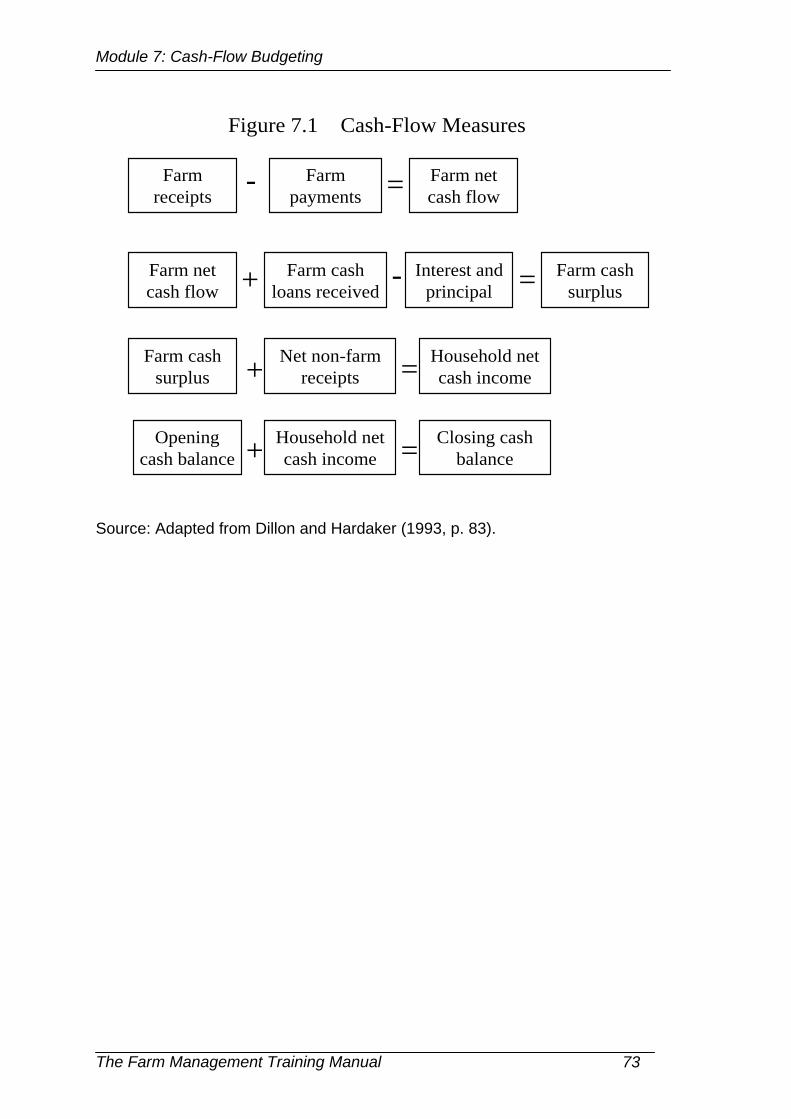
Module 7: Cash-Flow Budgeting
Figure 7.1 Cash-Flow Measures
Farm receipts
Interest and principal
Farm net cash flow
Farm payments
Farm cash loans received
Household net cash income
Farm net cash flow
Opening cash balance
Farm cash surplus
Closing cash balance
-
-
=
=
=
+
+
Farm cash surplus + Net non-farm
receipts = Household net cash income
Source: Adapted from Dillon and Hardaker (1993, p. 83).
The Farm Management Training Manual 73
Module 7: Cash-Flow Budgeting
Example: Preparing a Cash-Flow Budget
Consider the following cash transactions reported in Module 2, and assume that
the opening balance on 1 May is T$560. Prepare a monthly cash flow profile from
May to September:
• Household goods are purchased as follows (rounded to whole dollars for
convenience): 6 May T$42; 3 June T$54; 5 July T$39; 9 August T$31.
• 200 kg of NPK 8:33:18 are bought on 30 May for T1.00 per kg.
• Two 20-gram packets of capsicum seed are purchased on 8 June for
T$65.
• Two 25-gram packets of eggplant seed are purchased on 8 June for T$65.
• 100 kg of urea are bought on 10 July for T$0.90 per kg.
• Remittances of T$70 were received on 8 August.
• On 5 June 2003, the farmer hired machinery for 1 hour at a rate of T$40
per hour.
• On 9 July, the farmer hired 1 hour of casual labour to harvest 83 kg of
bananas. The labourer was paid T$5. The farmer’s wife sold 5 bunches at
T$7.80 per bunch on the next day, incurring marketing costs of T$7.
• On 5 September, 50 kg of capsicum were harvested and sold for T$2.30
per kg.
• An amount of 60 kg of eggplant was sold on 18 September for T$1.80 per
kg.
Begin by entering the opening balance of T$560 at the top of the column for May.
There are no farm receipts for May but there are some NPK fertilizer costs of
T$200 (200 kg at T$1.00 per kg). This figure is entered in the May column of the
fertilizer row. The only other cash transaction in May is for living expenses of
T$42. This amount is entered in the May column and living expenses row.
It is now possible to calculate the rows for the various totals for May. Total farm
receipts are zero; total farm payments are T$200; and net farm receipts are
therefore -T$200 (T$0 minus T$200). Total non-farm receipts are zero; total non-
The Farm Management Training Manual 74
Module 7: Cash-Flow Budgeting
farm payments are T$42; and therefore net non-farm receipts are –T$42 (T$0
minus T$42). The closing cash balance is the sum of the opening cash balance
(T$560), the net farm receipts (-T$200) and the net non-farm receipts (-T$42),
which equals T$318. Household net cash income is the sum of net farm receipts
(-T$200) and net non-farm receipts (-T$42), which equals –T$242.
The same procedure is followed for the next four months, with the closing cash
balance of T$318 from May carried forward as the opening cash balance in June.
Note that a cash deficit occurs from June to August, signaling to the farmer that
action has to be taken to make changes to the farm business or obtain a loan in
order to avoid this situation occurring.
The Farm Management Training Manual 75
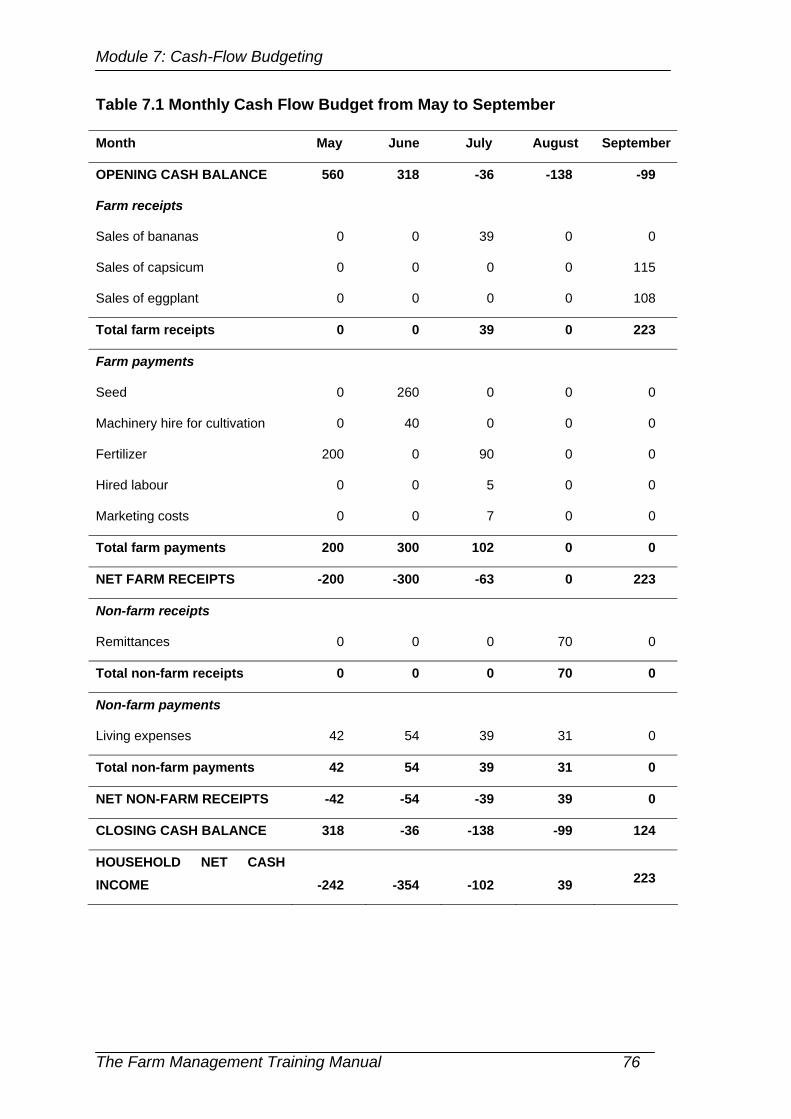
Module 7: Cash-Flow Budgeting
Table 7.1 Monthly Cash Flow Budget from May to September
Month May June July August September
OPENING CASH BALANCE 560 318 -36 -138 -99
Farm receipts
Sales of bananas 0 0 39 0 0
Sales of capsicum 0 0 0 0 115
Sales of eggplant 0 0 0 0 108
Total farm receipts 0 0 39 0 223
Farm payments
Seed 0 260 0 0 0
Machinery hire for cultivation 0 40 0 0 0
Fertilizer 200 0 90 0 0
Hired labour 0 0 5 0 0
Marketing costs 0 0 7 0 0
Total farm payments 200 300 102 0 0
NET FARM RECEIPTS -200 -300 -63 0 223
Non-farm receipts
Remittances 0 0 0 70 0
Total non-farm receipts 0 0 0 70 0
Non-farm payments
Living expenses 42 54 39 31 0
Total non-farm payments 42 54 39 31 0
NET NON-FARM RECEIPTS -42 -54 -39 39 0
CLOSING CASH BALANCE 318 -36 -138 -99 124
HOUSEHOLD NET CASH INCOME -242 -354 -102 39 223
The Farm Management Training Manual 76
Module 7: Cash-Flow Budgeting
Small Group Exercises: Cash Flow Budgeting
Exercise 1: Case Study Mixed Cropping Farm with Vanilla, Carrots, Root Crops and Coconuts
The farmer grows six crops covering five acres on his eight-acre farm: taro,
yams, sweet potato, carrots, coconuts and vanilla. He also has a breadfruit tree.
Carrots and vanilla are solely cash crops while some taro, yams and coconuts in
excess of family needs are sold in the local market. Sweet potato and breadfruit
are only for home consumption by the family and relatives.
The farmer makes the following cash sales during the year:
Vanilla: T$350 in May; T$450 in June; T$500 in July; T$600 in August;
T$200 in September.
Carrots: September T$80; October T$500; November T$700; December T$750. Taro: July T$130; August T$220; September T$150
Yams: June T$150; July T$50.
Green nuts: T$15 per month.
The farmer has to pay T$165 in February for his share of extensions to the
cooperatively owned shed for curing vanilla. He receives T$40 in the second
quarter and T$60 in the third quarter from the sale of vanilla beans by the
cooperative.
The Farm Management Training Manual 77
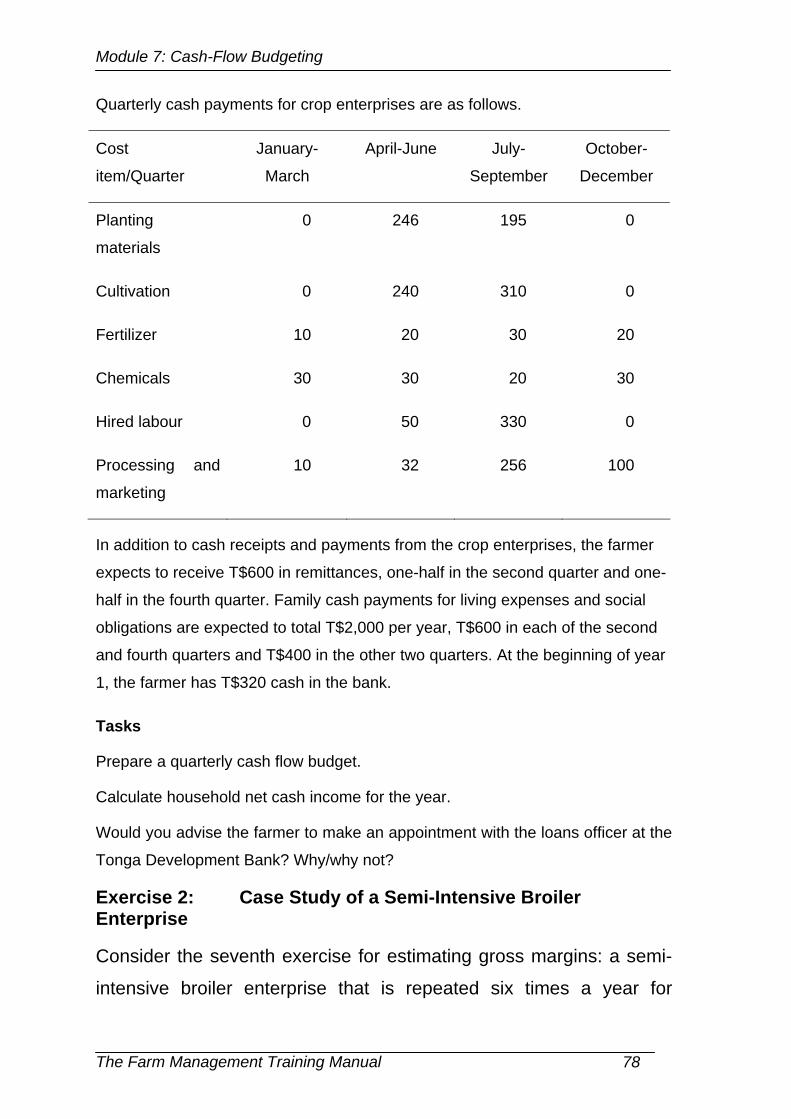
Module 7: Cash-Flow Budgeting
Quarterly cash payments for crop enterprises are as follows.
Cost
item/Quarter
January-
March
April-June July-
September
October-
December
Planting
materials
0 246 195 0
Cultivation 0 240 310 0
Fertilizer 10 20 30 20
Chemicals 30 30 20 30
Hired labour 0 50 330 0
Processing and
marketing
10 32 256 100
In addition to cash receipts and payments from the crop enterprises, the farmer
expects to receive T$600 in remittances, one-half in the second quarter and one-
half in the fourth quarter. Family cash payments for living expenses and social
obligations are expected to total T$2,000 per year, T$600 in each of the second
and fourth quarters and T$400 in the other two quarters. At the beginning of year
1, the farmer has T$320 cash in the bank.
Tasks
Prepare a quarterly cash flow budget.
Calculate household net cash income for the year.
Would you advise the farmer to make an appointment with the loans officer at the
Tonga Development Bank? Why/why not?
Exercise 2: Case Study of a Semi-Intensive Broiler Enterprise Consider the seventh exercise for estimating gross margins: a semi-
intensive broiler enterprise that is repeated six times a year for
The Farm Management Training Manual 78
Module 7: Cash-Flow Budgeting
production cycles of two months, beginning on 1 January. The
opening cash balance is T$800. The farmer has to spend $450 in
June to replace the poultry shed.
One hundred broilers are each sold for T$10.00 dressed weight at the
end of each production cycle. The byproduct of manure is sold for
T$6 per 50 kg bag at the end of each cycle. An average of 2 kg of
manure is produced per bird sold.
At the beginning of each production cycle, the farmer purchases 110 chicks at a
cost of T$1.10 each. Six 25-kg bags of starter feed are purchased at the start of
each cycle at a cost of T$20.00 per bag. At the beginning of the second month of
the production cycle, 14 20-kg bags of finishing feed are purchased at a cost of
T$14.00 per bag.
Other production cash costs per month are estimated to be T$3 for electricity,
T$2 for water and T$5 for veterinary expenses. All labour inputs are provided by
family members who are unpaid. Marketing costs comprise plastic bags costing
T$4 in every second month and transport costs of T$12 in every second month.
Family members earn the following cash wages on neighbouring farms during the
vegetable-growing season: T$75 in July; T$64 in August; and T$102 in
September. Cash living expenses are T$250 in January, T$120 per month from
February to June and August to October, T$270 in July, T$180 in November and
T$370 in December.
Tasks
Prepare an annual cash flow budget using monthly time intervals.
Would you advise the farmer to make an appointment with the loans officer at the
Tongan Development Bank or the savings officer at the Credit Union? Why/why
not?
Exercise 3: Case Study Development of a Semi-Intensive Piggery
This exercise is based on a 10-year planning period for a farmer who plans to
build a piggery for 10 sows. The cost of the shed is estimated to be T$6000 and
The Farm Management Training Manual 79
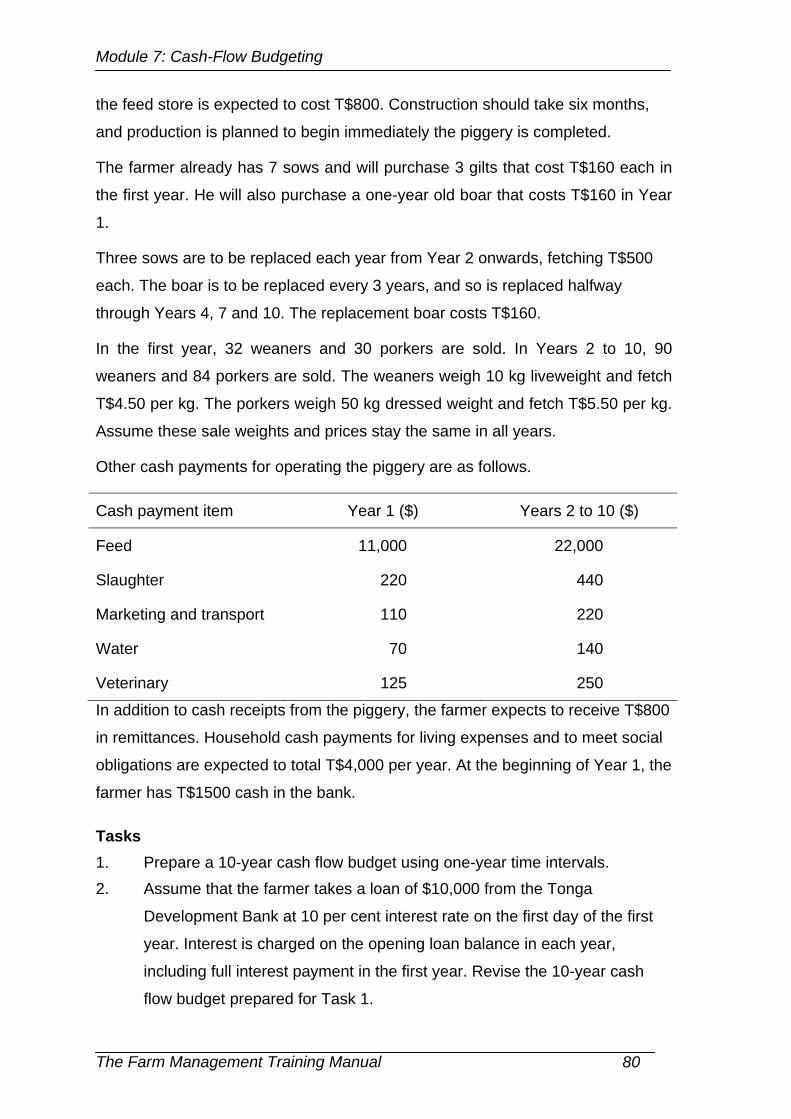
Module 7: Cash-Flow Budgeting
the feed store is expected to cost T$800. Construction should take six months,
and production is planned to begin immediately the piggery is completed.
The farmer already has 7 sows and will purchase 3 gilts that cost T$160 each in
the first year. He will also purchase a one-year old boar that costs T$160 in Year
1.
Three sows are to be replaced each year from Year 2 onwards, fetching T$500
each. The boar is to be replaced every 3 years, and so is replaced halfway
through Years 4, 7 and 10. The replacement boar costs T$160.
In the first year, 32 weaners and 30 porkers are sold. In Years 2 to 10, 90
weaners and 84 porkers are sold. The weaners weigh 10 kg liveweight and fetch
T$4.50 per kg. The porkers weigh 50 kg dressed weight and fetch T$5.50 per kg.
Assume these sale weights and prices stay the same in all years.
Other cash payments for operating the piggery are as follows.
Cash payment item Year 1 ($) Years 2 to 10 ($)
Feed 11,000 22,000
Slaughter 220 440
Marketing and transport 110 220
Water 70 140
Veterinary 125 250
In addition to cash receipts from the piggery, the farmer expects to receive T$800
in remittances. Household cash payments for living expenses and to meet social
obligations are expected to total T$4,000 per year. At the beginning of Year 1, the
farmer has T$1500 cash in the bank.
Tasks 1. Prepare a 10-year cash flow budget using one-year time intervals. 2. Assume that the farmer takes a loan of $10,000 from the Tonga
Development Bank at 10 per cent interest rate on the first day of the first
year. Interest is charged on the opening loan balance in each year,
including full interest payment in the first year. Revise the 10-year cash
flow budget prepared for Task 1.
The Farm Management Training Manual 80
Module 8: Whole –Farm Planning
Module 8
Whole-Farm Planning
The Farm Management Training Manual 81
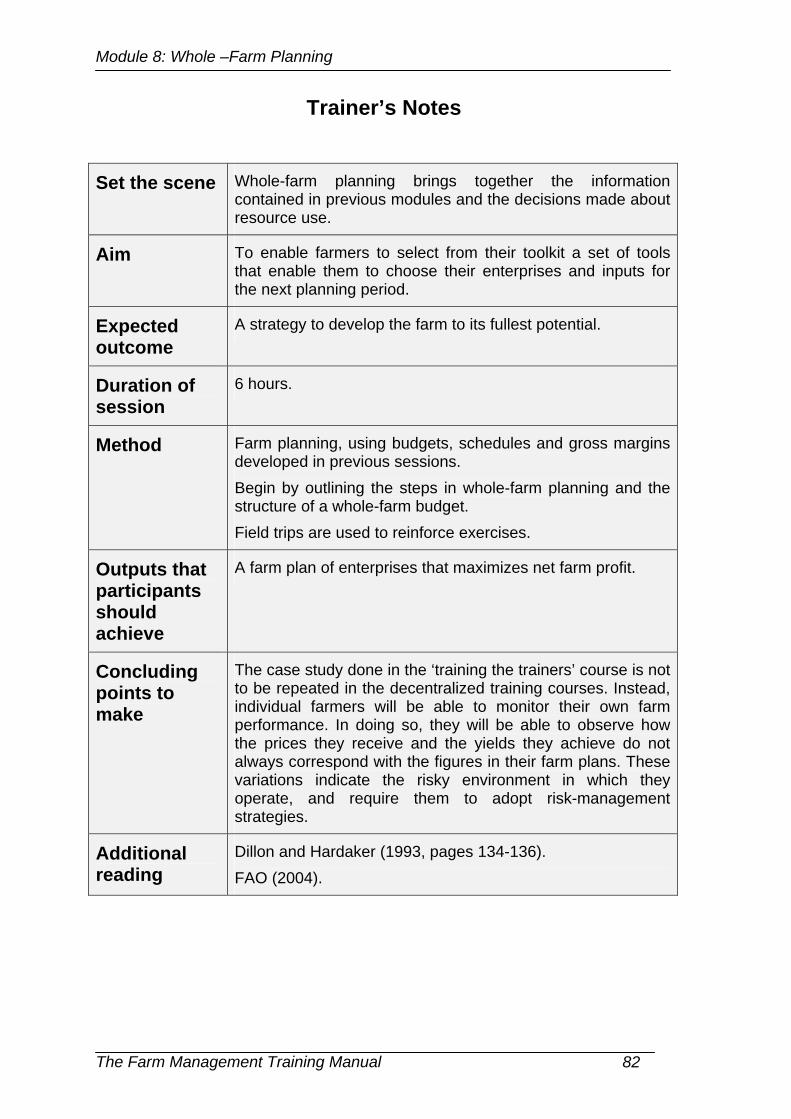
Module 8: Whole –Farm Planning
Trainer’s Notes
Set the scene Whole-farm planning brings together the information contained in previous modules and the decisions made about resource use.
Aim To enable farmers to select from their toolkit a set of tools that enable them to choose their enterprises and inputs for the next planning period.
Expected outcome
A strategy to develop the farm to its fullest potential.
Duration of session
6 hours.
Method Farm planning, using budgets, schedules and gross margins developed in previous sessions. Begin by outlining the steps in whole-farm planning and the structure of a whole-farm budget. Field trips are used to reinforce exercises.
Outputs that participants should achieve
A farm plan of enterprises that maximizes net farm profit.
Concluding points to make
The case study done in the ‘training the trainers’ course is not to be repeated in the decentralized training courses. Instead, individual farmers will be able to monitor their own farm performance. In doing so, they will be able to observe how the prices they receive and the yields they achieve do not always correspond with the figures in their farm plans. These variations indicate the risky environment in which they operate, and require them to adopt risk-management strategies.
Additional reading
Dillon and Hardaker (1993, pages 134-136). FAO (2004).
The Farm Management Training Manual 82
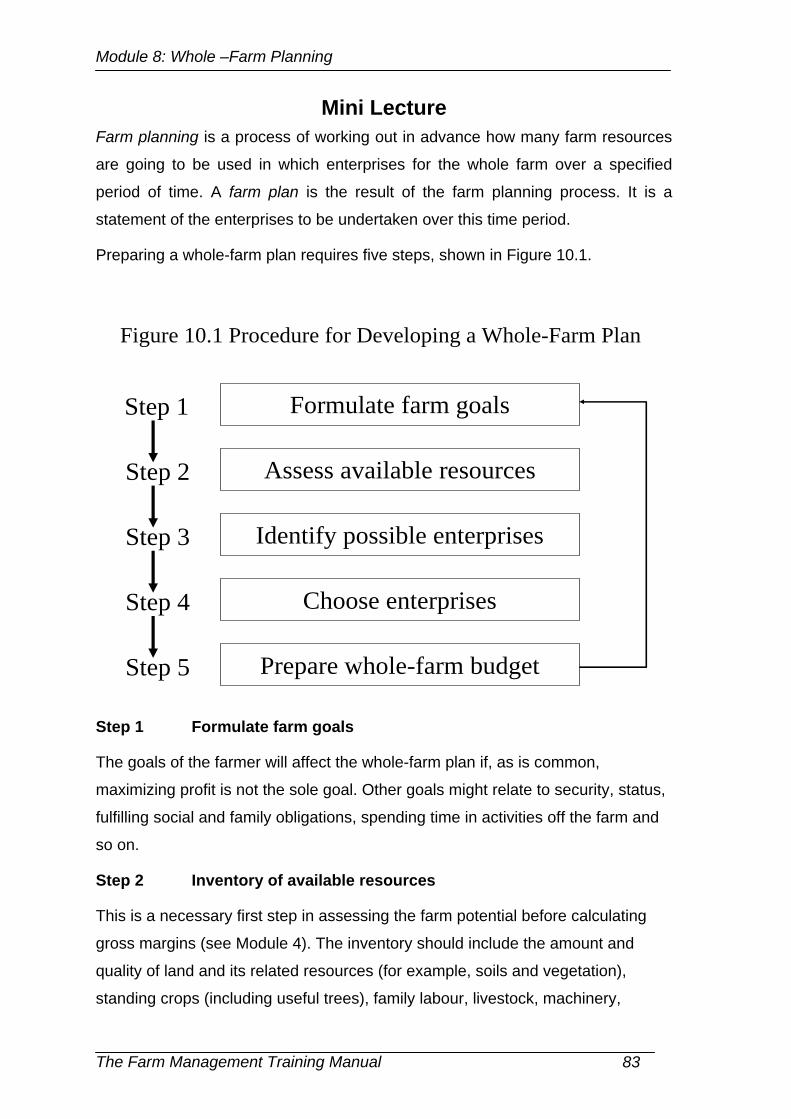
Module 8: Whole –Farm Planning
Mini Lecture Farm planning is a process of working out in advance how many farm resources
are going to be used in which enterprises for the whole farm over a specified
period of time. A farm plan is the result of the farm planning process. It is a
statement of the enterprises to be undertaken over this time period.
Preparing a whole-farm plan requires five steps, shown in Figure 10.1.
Figure 10.1 Procedure for Developing a Whole-Farm Plan
Formulate farm goals
Choose enterprises
Assess available resources
Identify possible enterprises
Prepare whole-farm budget
Step 1
Step 2
Step 3
Step 4
Step 5
Step 1 Formulate farm goals
The goals of the farmer will affect the whole-farm plan if, as is common,
maximizing profit is not the sole goal. Other goals might relate to security, status,
fulfilling social and family obligations, spending time in activities off the farm and
so on.
Step 2 Inventory of available resources
This is a necessary first step in assessing the farm potential before calculating
gross margins (see Module 4). The inventory should include the amount and
quality of land and its related resources (for example, soils and vegetation),
standing crops (including useful trees), family labour, livestock, machinery,
The Farm Management Training Manual 83
Module 8: Whole –Farm Planning
buildings, off-farm financial investments, cash on hand and in the bank, and
financial liabilities.
Step 3 Identify possible enterprises
This step has been discussed in Module 4.
Step 4 Estimate gross margins and choose enterprises
The first part of this step has also been discussed in Module 4. The second part
requires the farmer first to choose the enterprise that gives the highest benefits.
Enter as much of this enterprise in the farm plan as resources or other
constraints allow. For example, presume that squash is the most desirable
enterprise from the farmer’s point of view. However, he might only get an export
contract for 12 tonnes and is therefore restricted to putting a limit of 1 acre on this
enterprise. Enterprises would be added to the farm plan until it is not possible to
add any more without reducing the total benefits that the farmer receives from
production. Partial budgeting, labour scheduling and cash flow budgeting help the
farmer to change the enterprise mix until maximum benefits are obtained.
Step 5 Prepare the whole-farm budget
In this last planning step, information on the chosen enterprises is put into the
budget to calculate net farm earnings. This information is in two parts.
The first part is the information on the areas and gross margins per acre of the
enterprises. They are multiplied by each other to obtain the total gross margin for
the farm. This means information on variable costs is automatically included.
Note that the budgets for crop enterprises are expressed on a per acre basis.
Budgets for livestock enterprises may be expressed on a per animal basis or per
pen of animals.
The second part is the information on fixed costs, which has not been included in
the gross margins. Fixed costs are added to obtain total fixed costs. This amount
is then subtracted from the aggregate of the enterprise gross margins to obtain
net farm earnings.
The Farm Management Training Manual 84
Module 8: Whole –Farm Planning
Whole-Farm Planning Example: A Mixed-Enterprise Farm
Consider a farmer producing capsicum, eggplant, bananas and American taro,
similar to the situation described in the cash flow budgeting exercise in Module 7.
During the year, the farmer intends to grow and sell 750 kg of capsicum from 0.3
acres, 1700 kg of eggplant from 0.2 acres and 3200 kg of American taro corms
from 0.8 acres. In addition to the taro corms, 500 bundles of taro leaves are
produced and sold.
The capsicum and eggplant are to be sold at the farm gate for T$2.30 and T$1.80
per kg, respectively. The taro corms are valued at T$0.85 and the leaves are
valued at T$1.20 per bundle. An established area of 0.3 acres of bananas is now
in its second year and first ratoon. It is expected to produce 2400 kilograms
during the year that is sold in the market or consumed at home. All bananas are
to be valued at T$0.60.
Now to the inputs. All quantities are expressed on a per acre basis. Inputs per
acre to be used in capsicum production are: one and a half 20-gram packets of
seed, costing T$65 per packet; four hours of machinery hire, costing T$40 per
hour; 150 kg of NPK 8:33:18, costing T1.00 per kg; 50 kg of urea, costing T$0.90
per kg; 400 kg of chicken manure, costing T$0.08 per kg; 5 kg of manzate costing
T$25 per kg; one and a half litres of Perfekthion, costing T$40 per litre; and one
and a half kilograms of copper oxychloride, costing T$30 per kg. The cost of
mistblower operations is T$30 per acre.
Inputs used per acre of eggplant production are expected to be: two 25-gram
packets of seed, costing T$65 per packet; three hours of machinery hire, costing
T$40 per hour; 150 kg of NPK 8:33:18, costing T1.00 per kg; 50 kg of urea,
costing T$0.90 per kg; 400 kg of chicken manure, costing T$0.08; and 4 kg of
manzate costing, T$25 per kg. The cost of mistblower operations is T$30 per
acre.
Inputs per acre of banana production are estimated as: 100 kg of NPK 8:33:18,
costing T1.00 per kg; 100 kg of urea, costing T$0.90 per kg; 60 kg of muriate of
The Farm Management Training Manual 85
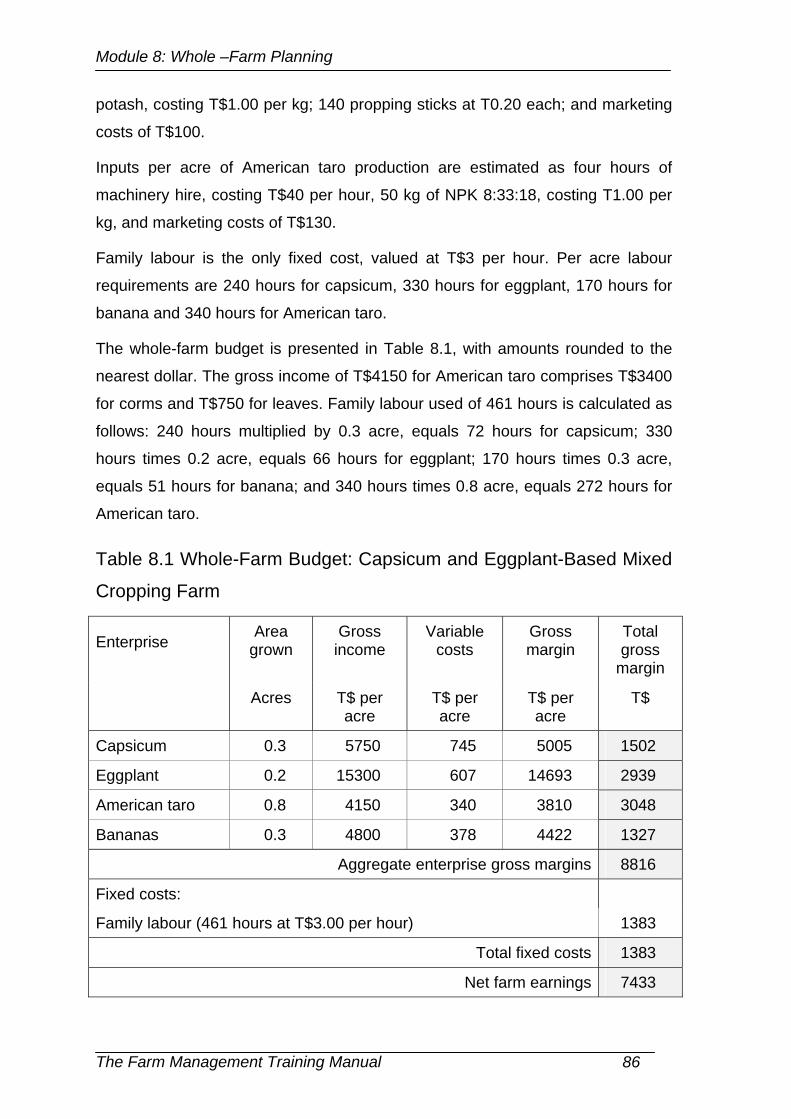
Module 8: Whole –Farm Planning
potash, costing T$1.00 per kg; 140 propping sticks at T0.20 each; and marketing
costs of T$100.
Inputs per acre of American taro production are estimated as four hours of
machinery hire, costing T$40 per hour, 50 kg of NPK 8:33:18, costing T1.00 per
kg, and marketing costs of T$130.
Family labour is the only fixed cost, valued at T$3 per hour. Per acre labour
requirements are 240 hours for capsicum, 330 hours for eggplant, 170 hours for
banana and 340 hours for American taro.
The whole-farm budget is presented in Table 8.1, with amounts rounded to the
nearest dollar. The gross income of T$4150 for American taro comprises T$3400
for corms and T$750 for leaves. Family labour used of 461 hours is calculated as
follows: 240 hours multiplied by 0.3 acre, equals 72 hours for capsicum; 330
hours times 0.2 acre, equals 66 hours for eggplant; 170 hours times 0.3 acre,
equals 51 hours for banana; and 340 hours times 0.8 acre, equals 272 hours for
American taro.
Table 8.1 Whole-Farm Budget: Capsicum and Eggplant-Based Mixed
Cropping Farm
Area grown
Gross income
Variable costs
Gross margin
Total gross
margin Enterprise
Acres T$ per acre
T$ per acre
T$ per acre
T$
Capsicum 0.3 5750 745 5005 1502
Eggplant 0.2 15300 607 14693 2939
American taro 0.8 4150 340 3810 3048
Bananas 0.3 4800 378 4422 1327
Aggregate enterprise gross margins 8816
Fixed costs:
Family labour (461 hours at T$3.00 per hour) 1383
Total fixed costs 1383
Net farm earnings 7433
The Farm Management Training Manual 86
Module 8: Whole –Farm Planning
Small Group Exercise 1: Mixed Cropping Farm Based on Vanilla
Trainees are to reconsider the example of the case study mixed cropping farm
used in the labour scheduling and cash flow budgeting exercises. The farmer has
selected six crop enterprises: swamp taro, late yams, sweet potato, carrots,
coconuts and vanilla. He also has one mature breadfruit tree. Carrots and vanilla
are solely cash crops while some taro, yams and coconuts in excess of family
needs are sold in the local market. Breadfruit and sweet potato are only for home
consumption by the family and relatives.
The farmer already has allotted 1 acre to 12-year-old vanilla from which he
produces 262 kg of green beans that are sold to the village cooperative, earning
T$2100 per acre. He expects to spend 16 seniti per kilogram on marketing costs,
the only variable input, amounting to T$42.
The farmer plans to grow one-third of an acre of carrots, yielding 1.2 tonnes and
earning T$6090 per acre. Variable costs are estimated to be T$1290 per acre.
Two-thirds of an acre is to be assigned to swamp taro, earning T$3600 per acre.
Out of the total production of taro, T$500 worth is to be sold in the local market
and the rest is consumed by the family and in feasts. Variable costs are an
estimated T$580.
Half an acre is to be planted to yams, worth T$7000 in output per acre. Cash
sales are expected to be T$200 and the rest is consumed or given away to
relatives. Variable costs are an estimated T$760 per acre.
There is half an acre of coconuts that yields 500 nuts per year of which T$180 of
nuts are sold regularly throughout the year from the half-acre. The remaining
nuts, worth T$45, are consumed in the household. Variable costs (mainly
marketing costs) are estimated at T$80 per acre for the year. (Note that the
output figures refer to the yield of nuts from half an acre but the variable costs are
for an acre!)
Sweet potato occupies just 0.2 acres of land, producing 1 tonne. An acre of
sweet potato is estimated to have a value of T$2800 with variable costs per acre
of T$700.
The Farm Management Training Manual 87
Module 8: Whole –Farm Planning
Finally, the breadfruit tree yields 100 fruit between December and April that have
an average weight of 2.5 kg. The average value is estimated at T$0.50 per kg.
The farmer has to pay of T$165 in April for his share of extensions to the
cooperatively owned shed for curing vanilla. An amount of T$8 is to be included
for depreciation of the shed in the current year. Depreciation of existing farm
assets is calculated to be T$32 per year. Interest is expected to be incurred on a
small loan at T$12 for the year.
Family labour is treated as a fixed cost. A total of 1213 hours of family labour are
used during the year. All family labour is to be valued at T$3 per hour.
The farmer is concerned about signs of degradation to his land and plans to
leave 1.8 acres fallow in the coming year.
Task
Prepare a whole-farm budget for the coming year using the above information.
The Farm Management Training Manual 88
Module 8: Whole –Farm Planning
Small Group Exercise 2: Kava and Pineapple Farm
This exercise shows how net farm profit can vary from year to year as the farmer
goes through different phases in the production cycle of medium-term crops. In
this case, it is useful to look at the whole-farm budgets for individual years as well
as for the whole production cycle. Because there is very little income in the first
year of the cycle, it makes more sense to combine the whole-farm budget for the
first two years.
Pineapples are interplanted with kava in alternate rows on two acres for four
years. The output of green kava is 7.2 tonnes per acre. All is to be harvested in
Year 4 and sold to a wholesaler/processor for T$3.50 per kilogram of green kava.
Pineapples are first harvested 15 months after planting, and again at 27 months
and 49 months. Yields are 2.6 tonnes per acre for the first harvesting, 5 tonnes
per acre for the second harvesting and 3.6 tonnes per acre for the final
harvesting. All sales are to the domestic market at a price of T$2 per kilogram.
The costs of marketing the pineapples are T$280 in Year 2, T$550 in Year 2 and
T$390 in Year 4.
A total of 430 hours of family labour are used for kava and pineapple production
during the first year. The hours used in later years are 320 hours in Year 2, 390
hours in Year 3 and 510 hours in Year 4. All family labour is to be valued at
T$3.20 per hour and treated as a fixed cost. It is the only fixed cost.
Machinery is hired in the first year for three hours per acre at T$40 per hour to
prepare the land for planting kava seedlings that cost T$2600 per acre and
pineapple suckers that cost T$450 per acre. The cost of the machinery hire is to
be split evenly between kava and pineapple production. There is no other
variable input applied to kava. The inputs for pineapple production are 40 kg of
NPK8:33:18 per acre each year, costing T$1.00 per kg, and 5 litres of hormone
spray applied per acre in each of the first three years, costing T$50 per litre.
Mature coconut palms are on another three acres of land that is otherwise fallow
throughout the period. The average yield is 500 nuts per acre valued at T$0.38
each. Ten hours of family labour is the only input each year, valued at T3.20 per
hour.
The Farm Management Training Manual 89

Module 8: Whole –Farm Planning
Tasks
Prepare the following whole-farm budgets using the above information:
• a combined budget for the first two years;
• a budget for Year 3;
• a budget for Year 4; and
• a budget for the whole four years.
The Farm Management Training Manual 90

Module 9: Demonstrations
Module 9
Demonstrations
The Farm Management Training Manual 91
Module 9: Demonstrations
Trainer’s Notes
Set the scene Begin by outlining the approach to be followed in this session, explaining that there is a classroom session but the main action with demonstrations occurs on the farm or in the market.
Aims Identify innovations that may enable farmers to achieve their goals more easily.
Expected outcome
Farmers develop knowledge of new commercial options made available by the introduction of new enterprises, improved production technologies or new marketing opportunities. By the end of a demonstration, farmers will be able to use successfully the innovation that was demonstrated.
Duration of session
3 hours for classroom material. 4 hours for on-farm demonstration.
Method An on-farm demonstration is to be conducted in the field. A format is provided for the effective conduct of farm demonstrations and a list of recommendations is provided for the adoption and adaptation of improved technologies and other innovations. Trainees are to undertake an exercise on questions about farmer adoption prior to an on-farm demonstration. They are also required to think about what sorts of changes they would be able to advise farmers to expect on adopting a particular innovation. Finally, form trainees into teams to imagine that they have to design and conduct a demonstration of their own choice. They are asked to perform a number of tasks. Arrange for small groups to present and discuss their results in large group sessions.
Outputs that participants should achieve
Higher rates of adoption of innovations that can improve incomes of farmers. Adoption is also expected to be more rapid.
Concluding points to make
Stress that demonstrations need not be confined to farmers’ fields. They can take place wherever there is something new to show farmers that may help them improve the operations and profits.
The Farm Management Training Manual 92
Module 9: Demonstrations
Mini Lecture
Definition
A demonstration is a training method used in agriculture in which their
participation is used to enable farmers to learn about an innovation. An
innovation is a new (hopefully improved) way of doing things or new product. The
demonstrator and the farmer share experiences during the demonstration. Most
demonstrations involve a number of steps that are first shown and performed by
the demonstrator and then followed by the farmers under the guidance of the
demonstrator. Getting farmers to perform these steps is important in making
them open to considering and taking up the innovation being demonstrated.
Demonstrations need not be a one-off event. A number of demonstrations may
be mounted over time as conditions change. Demonstration effects can be
present for years.
The most usual formal source of a demonstration is new information that comes
from an on-farm trial. However, there are many possible sources of material for
demonstrations.
Checklist Details for Demonstrations
This checklist for demonstration is based on the assumption that the target
farmers are members of youth groups in Tonga.
1. The aim of the demonstration and the target farmers
The aim of an on-farm demonstration should be formulated as the first step in
undertaking it. In general terms, it is to make known to interested members of a
young farmers group the opportunity to benefit from an innovation, and the likely
impacts on their farming operations.
Which members of a young farmers group should attend a demonstration? It
depends on the nature of the innovation and the farming interests of individual
members. A clear description of the planned demonstration to farmers in advance
would enable them to make up their minds whether it is something in which they
would be interested.
2. Details from on-farm trials
The Farm Management Training Manual 93
Module 9: Demonstrations
The demonstrator should be aware of any on-farm trials to which the innovation
has been subjected. Control plots and trial plots prepared in the trial are a
common source of material for a demonstration, providing information on the
innovation that needs to be disseminated to farmers. The control plot in an on-
farm trial refers to an existing way of doing things against which an innovation
can be compared through a trial plot.
Note that the control might not be a plot but some other existing arrangement.
For example, the demonstration of a new crop might involve an economic
comparison with an existing crop in the farming system. In this case, the
demonstration could be a comparison of gross margins, or it might be a
comparison between an existing domestic marketing channel and a new export
marketing channel.
3. The technical work plan for implementing the demonstration
A technical work plan is critical to the success of a demonstration and should
include a test run. Information is to be provided in the plan on labour and
materials to be used, activities to be undertaken, and timing of the various steps
to be followed.
The Farm Management Training Manual 94
Module 9: Demonstrations
4. Cooperating farmers
A demonstration can be demanding of the demonstrator’s time during certain
phases. Farmers already familiar with the innovation being demonstrated (they
may have participated in an on-farm trial) could be co-opted to help out during
busy periods.
5. Selection of suitable sites for the demonstration.
In some situations, the resources of farmers attending the demonstration might
be quite different. For example, farmers on atoll soils are likely to have production
conditions different from those of farmers on fertile volcanic soils. It would be
wise the select individual sites for, say, a fertilizer demonstration that reflect these
different production conditions.
6. Installation of measuring equipment
Measuring equipment is often needed to carry out the steps in a demonstration. It
enables demonstrators to show the results of applying an innovation or to
compare effects of an innovation with those of the control. It should be tested
beforehand to ensure it is in good working order and easily accessed by farmers.
7. Training
Training material should be prepared before a demonstration to explain to
farmers how to apply the improvement on their farms. Also, steps should be
taken to ensure that assistance is available after the demonstration for farmers
who wish to apply the innovation. MAFF personnel have an important role to play
here.
8. Provision of information before, during and after on-farm testing
Information on tests of the innovation should be made available at the
demonstration. In particular, data are needed before, during and after on-farm
trials that were previously conducted, to show the effects of a change in the way
of doing things on the farm. Information is needed on the effects on labour use
and cash flow, social, cultural and environmental effects, and especially to carry
out step 11 below.
9. Financial analysis
The Farm Management Training Manual 95
Module 9: Demonstrations
Demonstrators should make available to farmers a summary of any analysis of
the effects of the innovation on farm profit (such as gross margin analyses and
partial profit budgets). Where relevant, profit analyses should be available from
on-farm trials or market testing that is completed prior to the demonstration.
10. Implementation
Begin the demonstration by briefly setting the scene. Check if any farmers have
previously applied the innovation, and find out what the results were.
Get each farmer to undertake all the steps in the demonstration successfully. An
interactive approach is often crucial to the success of a demonstration.
11. Evaluation of problems encountered
The outcome of this step could be to repeat the demonstration in a more effective
manner or to identify new demonstrations that need to be planned for the future.
It is also crucial to the final step.
12. Revision
In many instances, a demonstration shows the need for revision. This revision
could be of the innovation itself, or of the technology underlying the innovation. A
revised budget might be needed, reflecting changes that need to be made when
undertaking future demonstrations. Finally, farmers might need to make
adjustments to their farm plans in light of what they have learnt from the
demonstration.
Types of Innovations
The different types of innovations that could be demonstrated are listed below.
The source of these innovations could be on the farm, from research and
extension activities, or from advances made in the private sector.
1. Improve the way of producing an existing output with existing inputs.
Example: Use hedgerows on slopes to conserve land resources.
2. Use a new input. Example: Hire machinery to replace labour cultivating
land.
3. Modify an existing input. Example: New watermelon seed variety.
4. Introduce a new enterprise. Example: Vanilla, Japanese taro.
The Farm Management Training Manual 96
Module 9: Demonstrations
5. Change the mix of existing enterprises. Example: New intercropping, alley
cropping.
6. Change the timing of a farming operation. Example: Integrated pest
management.
7. Improve the quality of an existing product. Example: Squash exports to
Japan.
8. Use a new marketing opportunity for an existing product. Example: Export of
nonu leaves and fruit.
9. Use a new way of promoting an existing product. Example: Get an organic
product certificate, use HTFA for disease-free exports.
10. Use by the farmer of a new processing method before selling an output.
Example: Replace smoke-drying of copra with solar drying.
11. Use a new way of extending the shelf life of an output. Example: Packaging
of vegetables.
12. Change market relations. Example: contract farming.
These examples are ‘looking back’. The key to future successful innovation is to
‘look forward’ - to anticipate profitable new innovations. Ask trainees what current
and likely future innovations can be added to the above list?
The Farm Management Training Manual 97

Module 9: Demonstrations
Small Group Exercise on the Implications of an Innovation for Farmers: A Case Study of Squash
Consider the situation in the late 1980s when squash was first introduced to
smallholders as a potentially profitable export crop. An on-farm demonstration is
to be conducted for potential growers and you have the benefit of hindsight! You
are to provide growers with information on how squash production would affect
their farming system if they were to adopt the crop. How would you answer the
following questions?
1. What change can I expect in my net farm profit?
2. Will there be any change to my labour schedule during the squash-growing
season?
3. If I grow squash, will it change my net cash flow?
4. Do I need to learn any new management skills to grow squash?
5. Will I have to reorganize my farming operations?
6. Will it cause any changes in the structure of my farm?
7. Will it have any social or cultural impacts on me and my family?
The Farm Management Training Manual 98
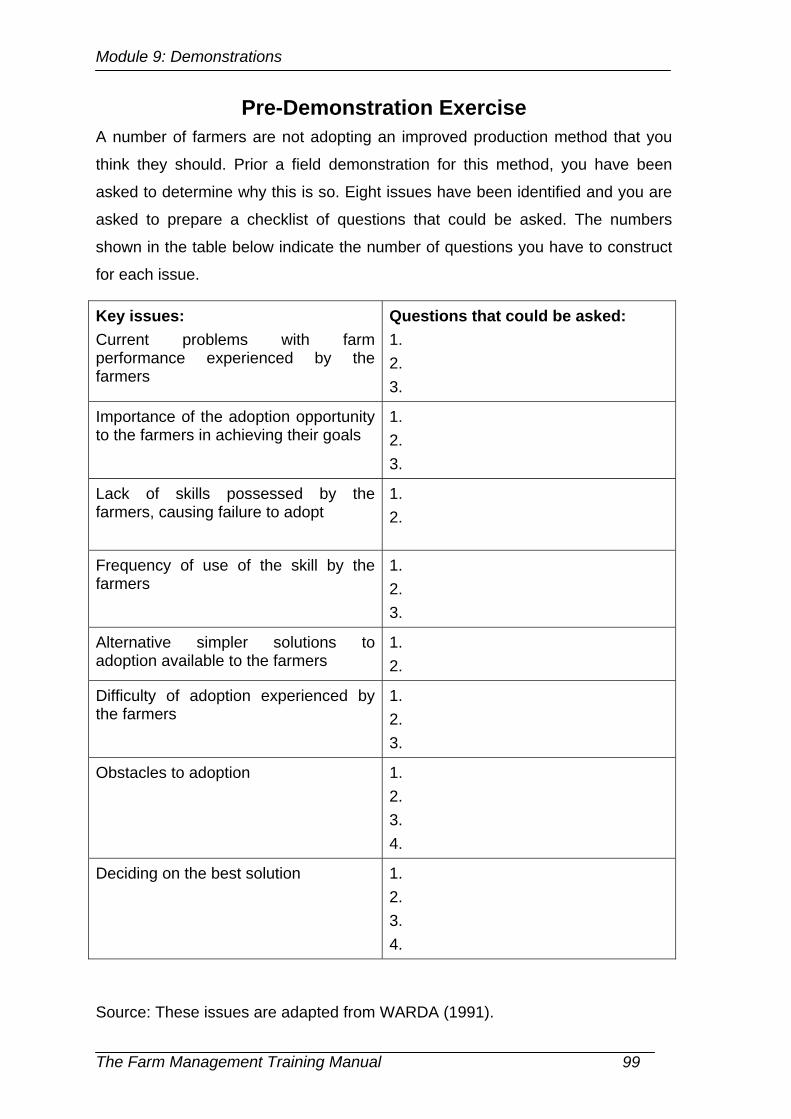
Module 9: Demonstrations
Pre-Demonstration Exercise A number of farmers are not adopting an improved production method that you
think they should. Prior a field demonstration for this method, you have been
asked to determine why this is so. Eight issues have been identified and you are
asked to prepare a checklist of questions that could be asked. The numbers
shown in the table below indicate the number of questions you have to construct
for each issue.
Key issues: Current problems with farm performance experienced by the farmers
Questions that could be asked: 1. 2. 3.
Importance of the adoption opportunity to the farmers in achieving their goals
1. 2. 3.
Lack of skills possessed by the farmers, causing failure to adopt
1. 2.
Frequency of use of the skill by the farmers
1. 2. 3.
Alternative simpler solutions to adoption available to the farmers
1. 2.
Difficulty of adoption experienced by the farmers
1. 2. 3.
Obstacles to adoption 1. 2. 3. 4.
Deciding on the best solution 1. 2. 3. 4.
Source: These issues are adapted from WARDA (1991).
The Farm Management Training Manual 99

Module 9: Demonstrations
Group Practical Demonstration of an Improved Technology
Arrange for trainees to undertake a demonstration. The demonstration is to be
undertaken by them in two phases:
1. Conduct of the demonstration in the field by the trainees.
2. Evaluation of the demonstration.
The following guidelines are provided.
Phase 1 Demonstration in the field
Arrange the materials needed.
Set the scene (5 minutes).
Describe the innovation (10 minutes).
Ask the following questions:
• Has anybody used this innovation before?
• What were the results? Why?
• How many others would like to use the innovation?
Performance of demonstration (about 2 hours, but varies according to the nature
of the demonstration).
Demonstrate the task, which all farmers should perform.
[Detail here the steps involved in the demonstration]
Phase 2 Evaluation
Did the farmers perform the tasks correctly?
Questions to ask a sample of farmers:
• Was it easy to perform the tasks?
• Can you recall all the steps you undertook?
• Was there any task you found difficult to perform?
• Is the innovation something you could learn to apply?
The Farm Management Training Manual 100

Module 9: Demonstrations
• Do you think you will try to learn and apply the innovation?
• How will you [insert some difficult task] on your own farm?
• What will you use to help you do this task?
• Where will you obtain this innovation?
Questions for the demonstrator:
• What was the most difficult task to perform?
• How did you find the interactive part of the demonstration?
• Would you do anything differently next time you conduct a demonstration?
• How much time do you think you would take to conduct a similar
demonstration in the future?
Questions for the extension officer supervising the demonstration:
• How different was this demonstration from previous demonstrations you
have conducted?
• Did the demonstrator stick to the outline of the demonstration?
• Did the demonstrator make the demonstration interactive?
The Farm Management Training Manual 101

Module 9: Demonstrations
Small Group Discussion on Demonstration Tasks Form trainees into small teams. Each team is to imagine that they have to design
and conduct a demonstration of their own choice. They are to perform the
following tasks.
Tasks
Outline the tasks of the demonstration.
State the goal or goals of the demonstration.
Write down how you would perform the preliminary steps.
Write down how you would perform the operational steps.
Write down how you would evaluate the demonstration. What questions would
you want answered?
The Farm Management Training Manual 102
Module 11: Contract Farming
Module 10
Contract Farming
The Farm Management Training Manual 103
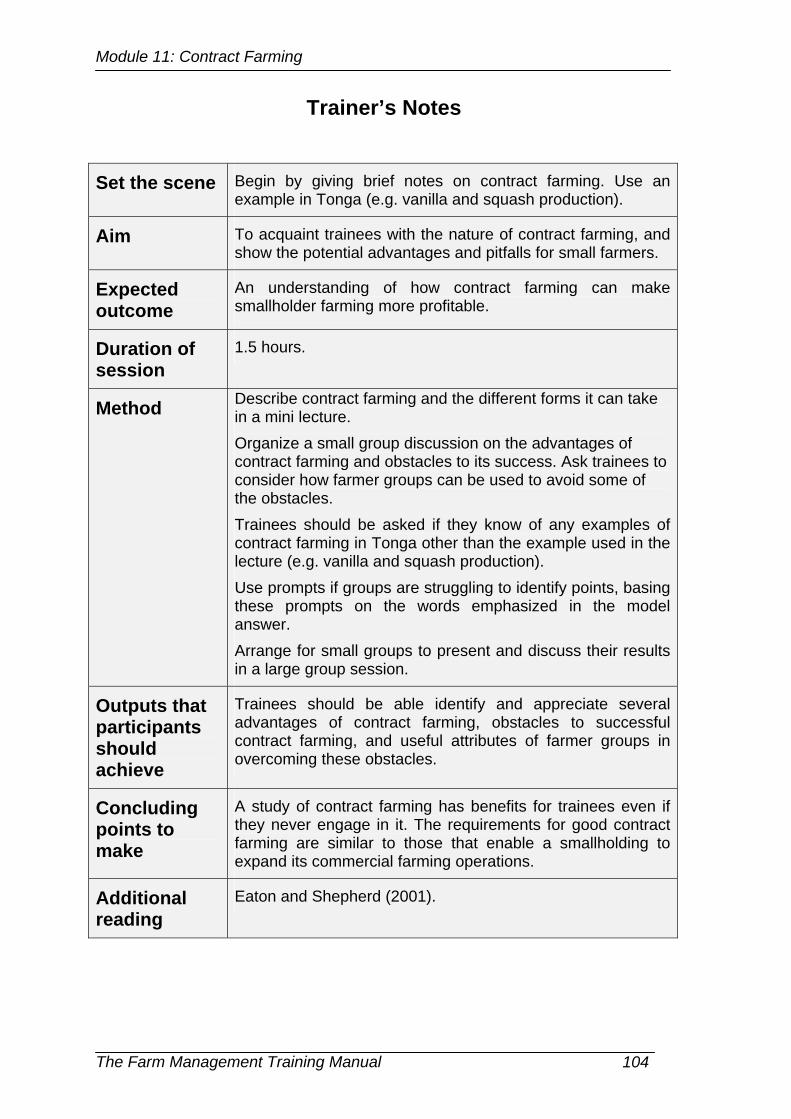
Module 11: Contract Farming
Trainer’s Notes
Set the scene Begin by giving brief notes on contract farming. Use an example in Tonga (e.g. vanilla and squash production).
Aim To acquaint trainees with the nature of contract farming, and show the potential advantages and pitfalls for small farmers.
Expected outcome
An understanding of how contract farming can make smallholder farming more profitable.
Duration of session
1.5 hours.
Method Describe contract farming and the different forms it can take in a mini lecture. Organize a small group discussion on the advantages of contract farming and obstacles to its success. Ask trainees to consider how farmer groups can be used to avoid some of the obstacles. Trainees should be asked if they know of any examples of contract farming in Tonga other than the example used in the lecture (e.g. vanilla and squash production). Use prompts if groups are struggling to identify points, basing these prompts on the words emphasized in the model answer. Arrange for small groups to present and discuss their results in a large group session.
Outputs that participants should achieve
Trainees should be able identify and appreciate several advantages of contract farming, obstacles to successful contract farming, and useful attributes of farmer groups in overcoming these obstacles.
Concluding points to make
A study of contract farming has benefits for trainees even if they never engage in it. The requirements for good contract farming are similar to those that enable a smallholding to expand its commercial farming operations.
Additional reading
Eaton and Shepherd (2001).
The Farm Management Training Manual 104
Module 11: Contract Farming
Mini Lecture
Definition
Contract farming is defined by FAO (1998, p. 1) as:
… an agreement between farmers and processing and/or marketing firms for the production and supply of agricultural products under forward agreements, frequently at predetermined prices. The arrangement also invariably involves the purchaser in providing a degree of production support. The basis of such an arrangement is to provide a specific commodity in quantities and at quality standards determined by the purchaser and a commitment on the part of the company to support the farmer’s production and to purchase the commodity.
Types of contract farming
Eaton and Shepherd (2001) outline a number of different types of contract
farming. Contracts can vary in terms of the parties to them, the requirements
stipulated in them, and the practical arrangements that are followed in their
implementation.
The Farm Management Training Manual 105
Module 11: Contract Farming
Small Group Exercise
Form trainees into small discussion groups to complete the following
three tasks.
Tasks
1. Ask trainees to identify the advantages of contract farming.
2. Ask trainees to identify obstacles to contract farming
3. Now, ask trainees how farmer groups could help to overcome the
obstacles identified above.
As a guide to the number of points that could be expected, the model answer
contains seven, eight and ten points for Tasks 1, 2 and 3, respectively.
The Farm Management Training Manual 106
Module 11: Participatory Rural Appraisal Methods
Module 11
Participatory Rural Appraisal Methods
The Farm Management Training Manual 107
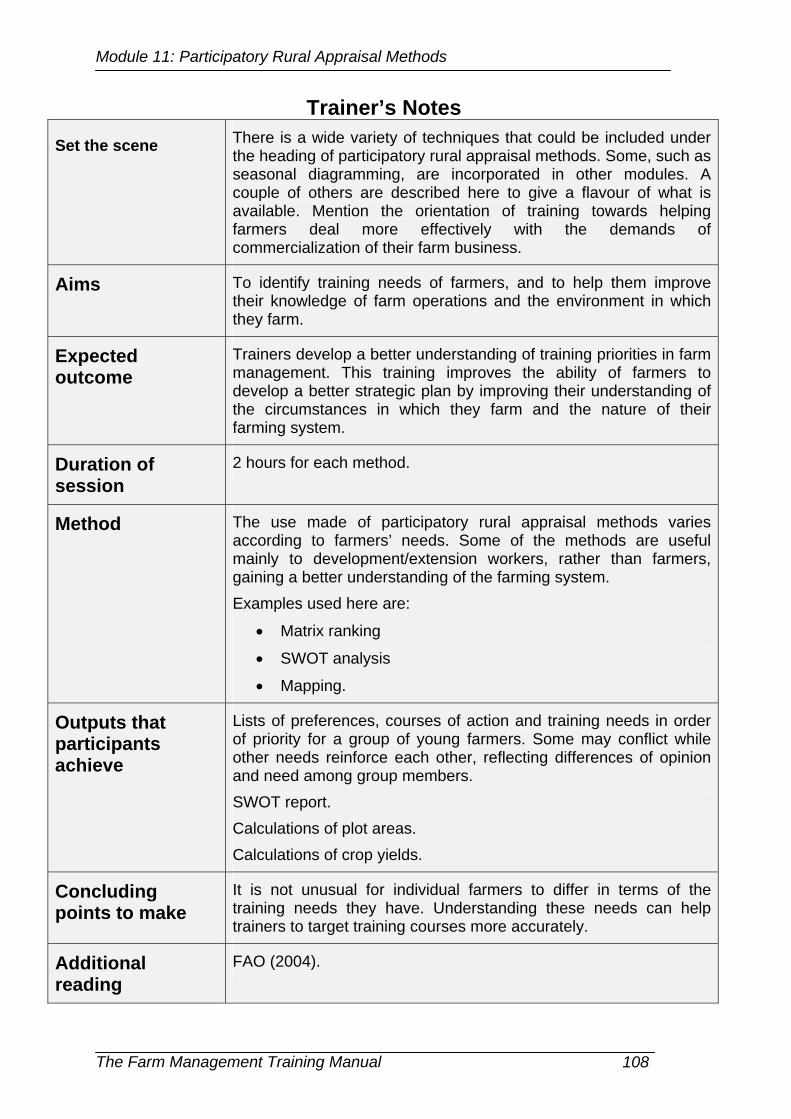
Module 11: Participatory Rural Appraisal Methods
Trainer’s Notes Set the scene There is a wide variety of techniques that could be included under
the heading of participatory rural appraisal methods. Some, such as seasonal diagramming, are incorporated in other modules. A couple of others are described here to give a flavour of what is available. Mention the orientation of training towards helping farmers deal more effectively with the demands of commercialization of their farm business.
Aims To identify training needs of farmers, and to help them improve their knowledge of farm operations and the environment in which they farm.
Expected outcome
Trainers develop a better understanding of training priorities in farm management. This training improves the ability of farmers to develop a better strategic plan by improving their understanding of the circumstances in which they farm and the nature of their farming system.
Duration of session
2 hours for each method.
Method The use made of participatory rural appraisal methods varies according to farmers’ needs. Some of the methods are useful mainly to development/extension workers, rather than farmers, gaining a better understanding of the farming system. Examples used here are:
• Matrix ranking
• SWOT analysis
• Mapping.
Outputs that participants achieve
Lists of preferences, courses of action and training needs in order of priority for a group of young farmers. Some may conflict while other needs reinforce each other, reflecting differences of opinion and need among group members. SWOT report. Calculations of plot areas. Calculations of crop yields.
Concluding points to make
It is not unusual for individual farmers to differ in terms of the training needs they have. Understanding these needs can help trainers to target training courses more accurately.
Additional reading
FAO (2004).
The Farm Management Training Manual 108
Module 11: Participatory Rural Appraisal Methods
Mini Lecture
The material covered in this lecture is on the use of participatory rural appraisal
methods for two purposes. The first purpose is to:
• understand current attitudes to the adoption of innovations and farm
record-keeping and use of farm management methods by young farmers
• identify and prioritize the training needs of future farming groups.
The second purpose is to give examples of participatory rural appraisal methods
that young farmers can use when planning their production activities. One such
useful method is direct measurement. Examples include measuring the area of a
plot of land or indirectly measuring output from a plot of land.
A plot can be divided into right-angle triangles and trapeziums.1 The areas of
these shapes are then measured in a straightforward manner. To measure the
area of a plot with an unusual shape, draw the longest diagonal of the plot. Divide
the area into right-angled triangles and trapeziums. The area of the triangle is its
height multiplied by its length divided by 2. The area of the trapezium is its
height multiplied by the sum of its two lengths divided by 2. Add together all the
areas of the triangles and trapeziums to obtain the total area of the plot.
Draw the longest diagonal of the plot and use pegs to mark out square areas at
equal distance along the diagonal. The size of the squares should be 4m x 4m for
root crops other than sweet potato and 2m x 2m for sweet potato and non-root
crops. The number of squares depends on plot size: 5 squares for areas a
quarter acre or more; 4 squares for areas an eighth of an acre but less than a
quarter of an acre; and 3 squares for areas below an eighth of an acre.
For each of the crops, count the number of plants in the squares and find the
average number per square. Use the figure for each crop to calculate the number
of its plants. From each square, select two plants of the main crop closest to each
of the diagonals of the square. Harvest the two plants and calculate the average
weight of each of them. Calculate the total weight of the main crop by multiplying
1 This section draws heavily on FAO (2004).
The Farm Management Training Manual 109
Module 11: Participatory Rural Appraisal Methods
the number of plants for each plot by the average weight per plant from that plot,
and express it per acre. Repeat for other crops if desired.
Another useful method is SWOT analysis, which helps farmers understand:
• their strengths and weaknesses
• the farming opportunities available, especially those that enable them to
commercialize their activities
• the threats they face to the viability of their farming activities, and the
implications of these threats for the farm household.
The Farm Management Training Manual 110
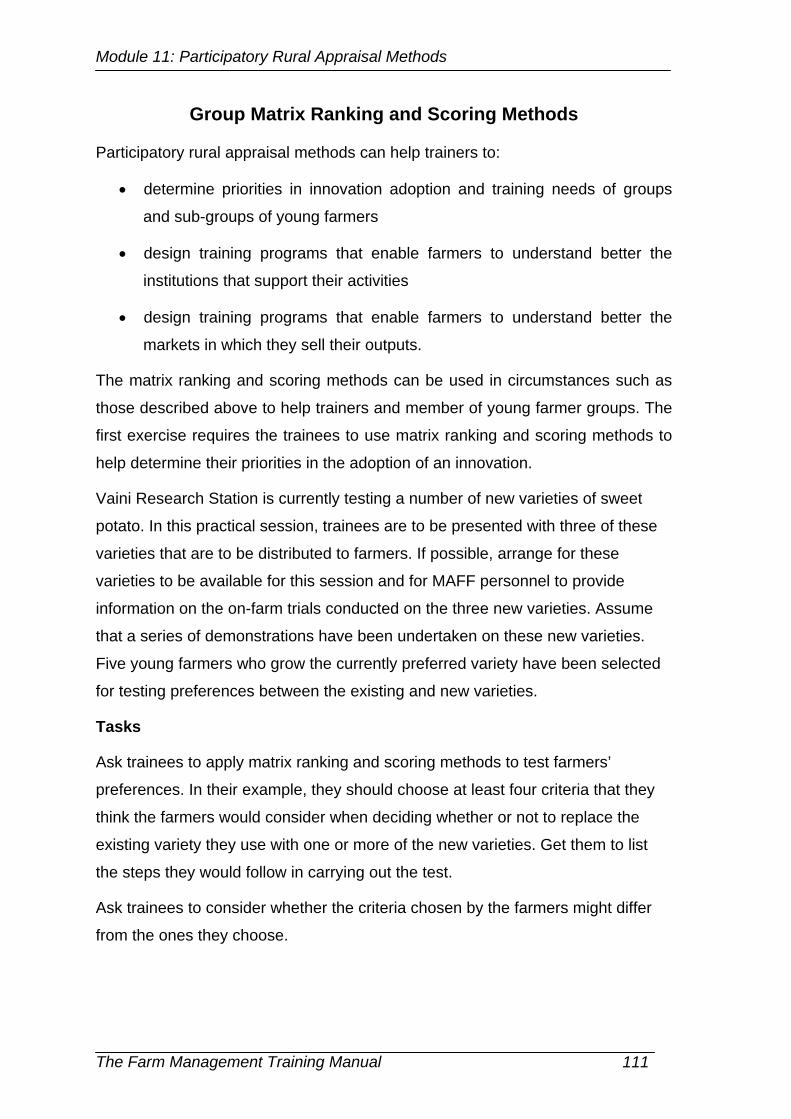
Module 11: Participatory Rural Appraisal Methods
Group Matrix Ranking and Scoring Methods
Participatory rural appraisal methods can help trainers to:
• determine priorities in innovation adoption and training needs of groups
and sub-groups of young farmers
• design training programs that enable farmers to understand better the
institutions that support their activities
• design training programs that enable farmers to understand better the
markets in which they sell their outputs.
The matrix ranking and scoring methods can be used in circumstances such as
those described above to help trainers and member of young farmer groups. The
first exercise requires the trainees to use matrix ranking and scoring methods to
help determine their priorities in the adoption of an innovation.
Vaini Research Station is currently testing a number of new varieties of sweet
potato. In this practical session, trainees are to be presented with three of these
varieties that are to be distributed to farmers. If possible, arrange for these
varieties to be available for this session and for MAFF personnel to provide
information on the on-farm trials conducted on the three new varieties. Assume
that a series of demonstrations have been undertaken on these new varieties.
Five young farmers who grow the currently preferred variety have been selected
for testing preferences between the existing and new varieties.
Tasks
Ask trainees to apply matrix ranking and scoring methods to test farmers’
preferences. In their example, they should choose at least four criteria that they
think the farmers would consider when deciding whether or not to replace the
existing variety they use with one or more of the new varieties. Get them to list
the steps they would follow in carrying out the test.
Ask trainees to consider whether the criteria chosen by the farmers might differ
from the ones they choose.
The Farm Management Training Manual 111
Module 11: Participatory Rural Appraisal Methods
Small Group Exercises In the first exercise, trainees are required to estimate the area of a plot. In the
second exercise, they are asked to estimate the numbers of plants of three crops
that grow in a plot of land, and use the results to estimate crop yields.
1. Measuring plot area
Consider the following example of an irregularly shaped plot of land on a tax
allotment, shown in Figure 10.1. There are six areas to be measured: triangle
Abb; trapezium BCcb; trapezium CDdc; triangle Ded; triangle AfF; and triangle
FfE.
Present trainees with the following map of a plot of land. They should measure
the area using trapeziums and right-angle triangles.
Triangle Abb = (Ab/2)*(Bb)
Trapezium BCcb = (cb/2)*(Bb+Cc)
Trapezium CDdc = (cd/2)*(Cc+Dd)
Triangle Ded = (dE/2)*(Dd)
Triangle AfF = (Af/2)*(Ff)
Triangle FfE = (fE/2)*(Ff).
The lengths of the different lines on the map are: AE 50 m; AB 33.3 m; BC 14.2
m; CD 11.0 m; DE 6.0 m; EF 41.1m; FA 23.0m; Bb 18.8 m; Cc 8.9 m; Dd 3.5 m;
Af 15.2 m; Ff 20.0 m; fb 11.7 m; bc 9.6 m; cd 10.3 m; and dE 3.2 m.
The Farm Management Training Manual 112
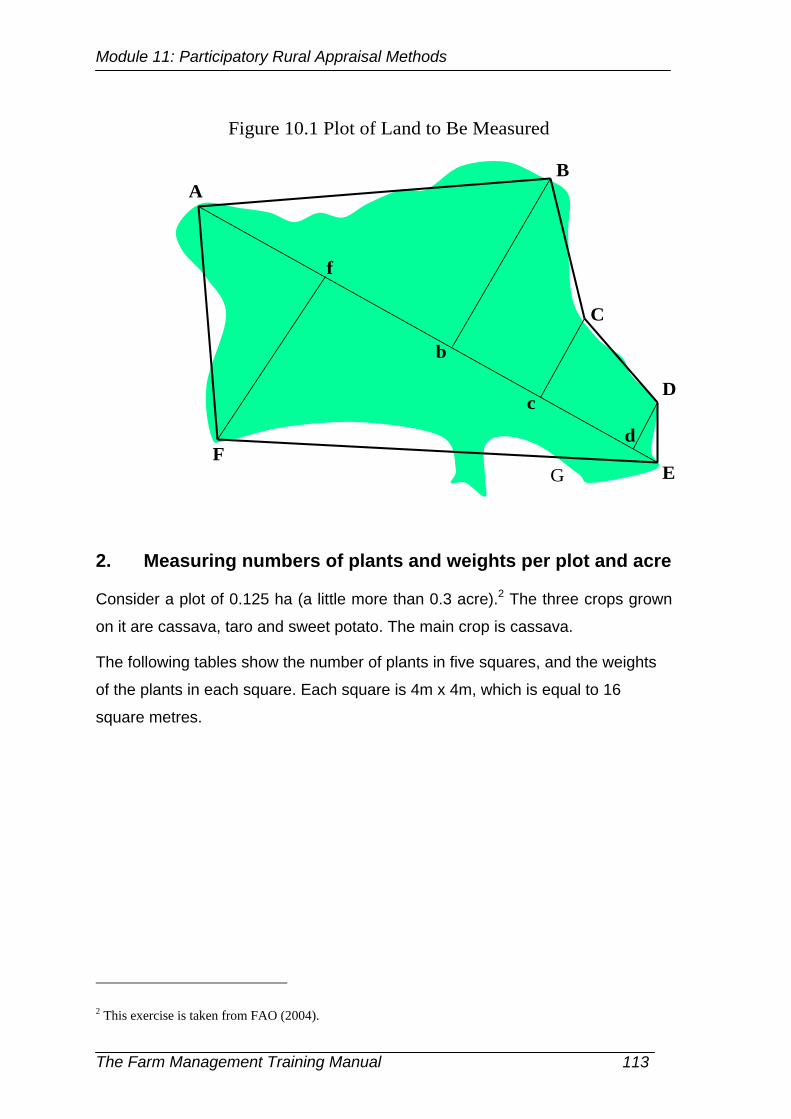
Module 11: Participatory Rural Appraisal Methods
Figure 10.1 Plot of Land to Be Measured
AB
C
D
EF
d
c
f
b
G
2. Measuring numbers of plants and weights per plot and acre
Consider a plot of 0.125 ha (a little more than 0.3 acre).2 The three crops grown
on it are cassava, taro and sweet potato. The main crop is cassava.
The following tables show the number of plants in five squares, and the weights
of the plants in each square. Each square is 4m x 4m, which is equal to 16
square metres.
2 This exercise is taken from FAO (2004).
The Farm Management Training Manual 113
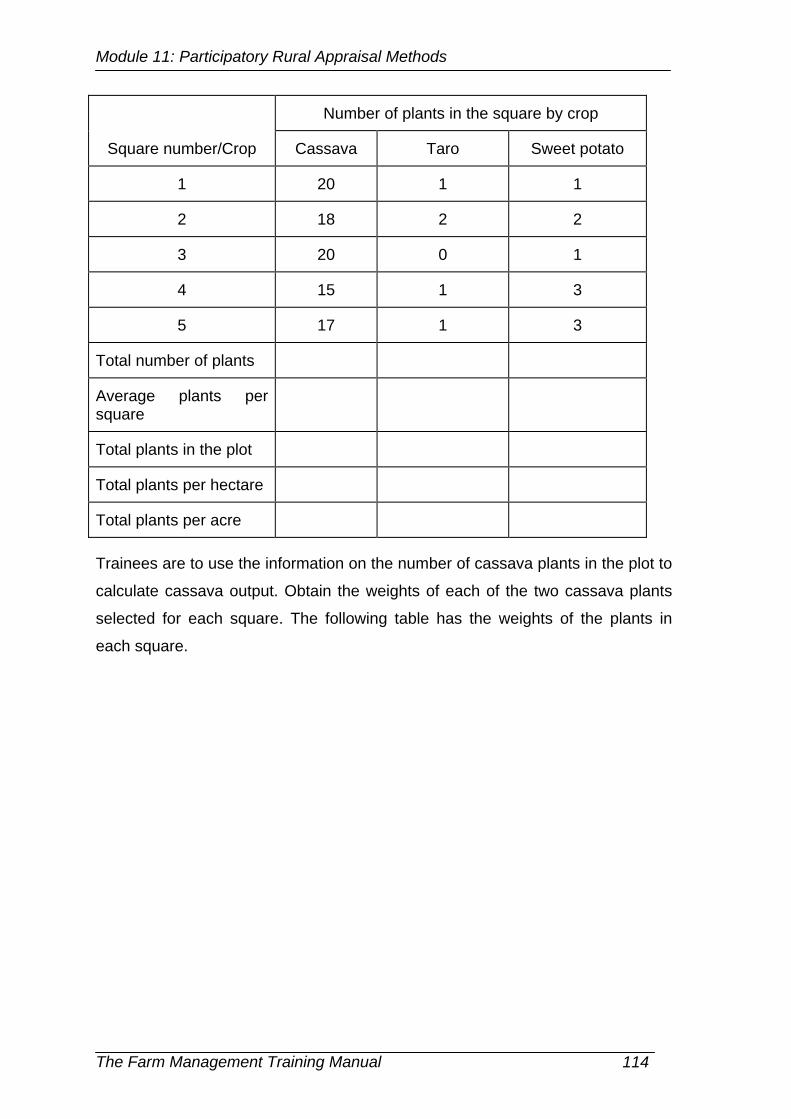
Module 11: Participatory Rural Appraisal Methods
Number of plants in the square by crop
Square number/Crop Cassava Taro Sweet potato
1 20 1 1
2 18 2 2
3 20 0 1
4 15 1 3
5 17 1 3
Total number of plants
Average plants per square
Total plants in the plot
Total plants per hectare
Total plants per acre
Trainees are to use the information on the number of cassava plants in the plot to
calculate cassava output. Obtain the weights of each of the two cassava plants
selected for each square. The following table has the weights of the plants in
each square.
The Farm Management Training Manual 114
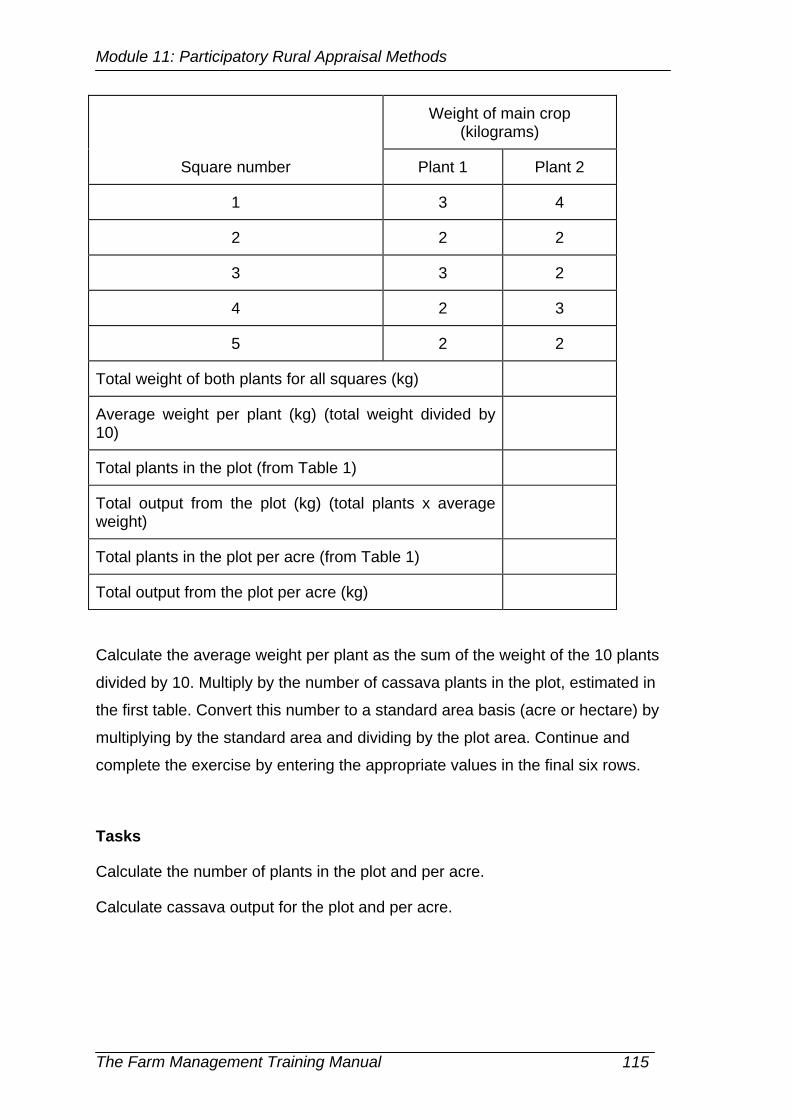
Module 11: Participatory Rural Appraisal Methods
Weight of main crop (kilograms)
Square number Plant 1 Plant 2
1 3 4
2 2 2
3 3 2
4 2 3
5 2 2
Total weight of both plants for all squares (kg)
Average weight per plant (kg) (total weight divided by 10)
Total plants in the plot (from Table 1)
Total output from the plot (kg) (total plants x average weight)
Total plants in the plot per acre (from Table 1)
Total output from the plot per acre (kg)
Calculate the average weight per plant as the sum of the weight of the 10 plants
divided by 10. Multiply by the number of cassava plants in the plot, estimated in
the first table. Convert this number to a standard area basis (acre or hectare) by
multiplying by the standard area and dividing by the plot area. Continue and
complete the exercise by entering the appropriate values in the final six rows.
Tasks
Calculate the number of plants in the plot and per acre.
Calculate cassava output for the plot and per acre.
The Farm Management Training Manual 115
Module 11: Participatory Rural Appraisal Methods
Small Group Discussion: SWOT Analysis Consider a group of 30 young farmers, where each member has access to 5
acres (2 hectares) of land and a labour force of himself or herself, a brother aged
16 and a younger child who goes to school and helps on the farm occasionally.
Each farmer currently grows crops mainly for household consumption and sells
small surpluses in the market. The group is thinking about growing one of two
commercial crops new to Tonga that the extension officers have been
recommending.
The first crop is a new variety of taro that has a higher yield than existing varieties
but which was found to be more susceptible to pests in on-farm trials conducted
in a nearby village. In market trials conducted in New Zealand, the variety was
found to be preferred to existing varieties by some Polynesian consumers there.
The second is a perennial food export crop that a few large farmers have just
started to grow for export to Europe. It takes four years before any substantial
yields are achieved. The large farmers are growing the crop organically and plan
to get a certificate to sell the crop in Europe as an organic food.
Outline the items that you would include in a SWOT analysis for the group, under
the headings of strengths, weaknesses, opportunities and threats.
The Farm Management Training Manual 116
Module 11: Participatory Rural Appraisal Methods
References
Dillon, J.L. and Hardaker, J.B. (1993), Farm Management Research for Small
Farmer Development, Food and Agriculture Organization of the United
Nations, Rome.
Eaton. C. and Shepherd, A.W. (2001), Contract Farming, Agricultural Services
Bulletin 145, Food and Agriculture Organization of the United Nations,
Rome.
FAO (2004), “No Gud Bisnes Bagarup”: Helping Small Farmers in the Pacific to
Make Wise Farm Management Decisions—An Analytical Tool Box, Food
and Agriculture Organization of the United Nations, Apia.
MAFF (2000), Farm Management Manual 2000, Ministry of Agriculture, Forestry
and Food, Nuku’alofa.
WARDA (1991), Training the Trainers Manual, West African Rice Development
Association, Abidjan.
The Farm Management Training Manual 117