bone marrow cells detection: a technique for the
TRANSCRIPT

1
Bone marrow cells detection: A technique for the microscopic image analysis
Haichao Cao1*, Hong Liu2, Enmin Song3
123 Huazhong University of Science and Technology, Hong Shan District, Wuhan, Hubei, China * [email protected]
Abstract: In the detection of myeloproliferative, the number of cells in each type of bone marrow cells (BMC) is an important parameter for the evaluation. In this study, we propose a new counting method, which also consists of three modules including localization, segmentation and classification. The localization of BMC is achieved from a color transformation enhanced BMC sample image and stepwise averaging method (SAM). In the nucleus segmentation, both SAM and Otsu’s method will be applied to obtain a weighted threshold for segmenting the patch into nucleus and non-nucleus. In the cytoplasm segmentation, a color weakening transformation, an improved region growing method and the K-Means algorithm are used. The connected cells with BMC will be separated by the marker-controlled watershed algorithm. The features will be extracted for the classification after the segmentation. In this study, the BMC are classified using the SVM, Random Forest, Artificial Neural Networks, Adaboost and Bayesian Networks into five classes including one outlier, namely, neutrophilic split granulocyte, neutrophilic stab granulocyte, metarubricyte, mature lymphocytes and the outlier (all other cells not listed). Our experimental results show that the best average recognition rate is 87.49% for the SVM.
Key words: color transformation; stepwise averaging method; marker-controlled watershed; machine learning; classification
1. Introduction
Bone marrow cells (BMC) detection is an important
approach for the discovery and diagnosis of leukaemia and
other blood-related diseases. Currently, there are many
studies about for segmentation and detection of white blood
cells in peripheral blood, but few studies on BMC. Due to
the fat and dense distribution in the bone marrow, it is
difficult for the pathological detection. Traditional BMC
detection methods require that the human eye carefully
observe the bone marrow samples under the microscope
classifies and counts the BMC manually. These manual
detection methods are not only time-consuming, but also
easily lead to human errors. With the development of image
processing technology, some advanced detection techniques
have been used for the diagnosis of microscopic images.
However, an accurate detection of BMC is still a very
difficult task due to some factors such as different staining
methods and lighting condition, which can make a variety of
microscopic images. To deal with the complexity of BMC
images, we propose a detection strategy which consists on a
combination of colour transformation, region growing [1],
K-Means clustering [2], watershed algorithm [3] and
machine learning [4].
In the past decade, many solutions have been
proposed for segmenting white blood cells in peripheral
blood. In [5], the authors proposed a novel segmentation
scheme which detects well on regular cells. However, it
cannot be applied to the larger connected cells. In [6], the
authors proposed a clustering method based on rough set for
leukocyte segmentation. In [7], the authors proposed the
stepwise merging rules and gradient vector flow snake
method for leukocyte segmentation. It works well under the
condition of normal staining. However, the processing time
is very slow. In [8], a computer-aided segmentation method
which is based on Otsu’s method [9] for segmenting
leukocyte was proposed. In [10], the authors proposed the
Yager's fuzzy method which processes three channel images
of R, G and B to obtain three segmented images. These
three-segmented images are merged to obtain the final
segmentation result. In [11], the authors proposed an
automatic segmentation method based on the intuitionistic
fuzzy divergence based thresholding which is robust even in
the influence of noise. However, it performs poor for the
low staining and weak edge information. In [12], the authors
used Atanassov's intuitionistic fuzzy sets [13, 14] and
interval Type II fuzzy sets theory to carry out the
segmentation of blood leukocyte images. Compared with
other algorithms, it is more effective when used on the
segmentation of an image containing more than one cell. In
[15], the authors adopted an unsupervised segmentation of
leukocytes images using thresholding neighborhood valley-
emphasis and deconvolution techniques to separate
methylene blue and eosin in Giemsa stained images for
processing. In [16], the authors developed a new leukocyte
segmentation method based on intuitionistic fuzzy
divergence to achieve the robust segmentation performance.
In [17], the authors proposed a novel method for leukocyte
image segmentation, which is based on feed forward neural
network with random weights. In [3], the authors proposed a
new algorithm to segment normal cells and leukaemia cells
in peripheral blood and bone marrow. The algorithm models
the color and shape characteristics of white blood cells by
two transformations, which are used in the marker-
controlled watershed algorithm. In [18], the authors
proposed a method based on Gram-Schmidt
Orthogonalization along with a snake algorithm to segment
nucleus and cytoplasm of the cells.
Of course, some solutions have also been proposed
for classifying white blood cells in peripheral blood. The
method proposed in [19] for an automatic leucocyte
recognition is based on a fuzzy divergence technique. In
[20], the authors integrate Fisher linear discriminant pre-
processing with feedforward neural networks for classifying
cultured cells in the bright field. In [21], the authors
proposed a new detection algorithm based on fuzzy cellular

2
neural network which combines the advantages of threshold
segmentation followed by mathematical morphology and
fuzzy logic method. In [22], Boosting-based method is used
for automatic detection of leukocytes in blood smear images.
In [23], the authors proposed a white blood cell automatic
counting system based on mathematical models, principal
component analysis, and neural networks. In [24], naïve
Bayes classifiers are employed to sort the cells into
eosinophil, lymphocyte, monocyte and neutrophil. In [25],
the authors derive more precise regional boundaries by
using the gradient-based region growing method and
classify the regions using the fuzzy and non-fuzzy
techniques based on the features of shape, size, color, and
texture. In [26], the authors proposed a computer-aided
diagnostic method for the diagnosis of myeloma cells.
Our contributions in this work are summarized as
follows:
1) To the best of our knowledge, we first proposed
a strategy for various types of white blood cells
detection in bone marrow images.
2) We propose a novel thresholding method and
two color transformation methods.
3) We propose to integrate thresholding method,
color transformation, region growing, K-Means
clustering, watershed algorithm, and machine
learning for cell detection.
The organization of the paper is structured as follows:
Section 2 outlines the theoretical concepts of BMC
localization, segmentation, feature extraction, and
classification. Section 3 gives our experimental results and
discussion. The conclusion then follows.
2. Materials and methods
This paper presents a new method for the detection of
BMC. It consists of localization, segmentation, feature
extraction and classification. We only consider five types of
BMC in our detection, namely, neutrophilic split
granulocyte, neutrophilic stab granulocyte, metarubricyte,
mature lymphocytes and the outlier (cells not listed). The
flow chart of the proposed method is shown in Fig.1.
2.1. Localization of BMC
As shown in Fig.2, BMC samples usually contain a
large number of mature red blood cells and impurities. How
to accurately isolate BMC from bone marrow samples is a
problem in the classification of BMC. To identify the
location of BMC, we design a color transformation,
stepwise averaging method and two-stage locating operation.
Fig. 2. Localization of BMC in bone marrow samples
2.1.1 Color transformation In general, after Wright's staining [27, 28] of the
BMC, the color of nucleus is dark purple, which is darker
than that of cytoplasm and mature red blood cells. The BMC
image is usually stored in the RGB (Red-Green-Blue)
format. In order to enhance the contrast between the nucleus
of BMC and other cell tissues, it is necessary to convert
from RGB to Hue-Saturation-Intensity (HSI). Our
experiments show that the gray value of BMC nucleus is
lower than non-nucleus pixels in the green channel, and the
gray value distribution of BMC nucleus is the highest
compared with non-nucleus pixels in the Hue (H)
component. Similarly, it is also true for the Saturation (S)
component. According to this observation, we can derive a
color transformation for the BMC as shown in Eq. (1).
In Eq. (1), IH (x, y), IS (x, y) and IG (x, y) represent the
gray values of a pixel in the coordinate (x, y) in the H
channel, S channel and G channel, respectively. Parameters
w1, w2, w3 are real values in [0, 1] that can be adjusted to
experimental results. In this study, the value of w1, w2, w3 is
0.4, 0.6, and 1.0.
1 2
3
( , ) ( , ), ( , ) 0
* ( , )( , ) (1)
255, ( , ) 0
H SG
GHSG
G
I x y I x yI x y
I x yI x y
I x y
BMCSample image
Color enhancement
(S-2.1.1)
SAM algorithm(A-0)
Cell ROILocating
cytoplasm(A-2)
Post-processing(F-3d) Nucleus
Color weakening(S-2.2.2a)
Obtaining BMC mask
(A-5)Cytoplasm
Feature extraction(S-2.3.1)
Machine learning
(R-4)
Cell category
BMC localization BMC segmentation BMC classification
Feature selection
(R-29)
Locating Nucleus
(A-1)
Two-stage threshold(A-3)
Obtaining non-BMC mask
(A-4)
Fig. 1. Flow chart of proposed BMC detection method. Note that, "A-n" denotes algorithm n; "S-c" denotes section c; "R-
p" denotes references p; "F-i" denotes figure i.
3
The image obtained by Eq. (1) is called the Hue,
Saturation, and Green color enhancement image (HSG). In
contrast to the image in each of H, S, and G channels, the
color enhancement image significantly highlights the region
of BMC nucleus.
2.1.2 Stepwise averaging method The stepwise averaging method (SAM) is a
threshold-based segmentation algorithm. The algorithm
works the best if the proportion of non-target areas is larger
than the target area. The algorithm takes the average gray
value of the image as a threshold. If the gray value of the
pixel is smaller than the threshold, it will be unchanged.
Otherwise, the gray value of the pixel is set to 0. We can
obtain an image after this processing; Secondly, process the
image obtained in the previous step in the same way until
the mean of the image does not change. Theoretically, the
final mean value obtained is the gray value of the
background in the bone marrow microscopic image. The
background can be removed from the image by using the
final mean value. Using this method, we can obtain the gray
value of mature red blood cells, the cytoplasm of BMC and
the nuclei of BMC in bone marrow microscopic images. The
threshold of segmenting the BMC nucleus can be obtained,
and the mask image of BMC nucleus can be obtained
according to this threshold.
In the practical application, SAM algorithm flow is
shown in Algorithm 0.
Algorithm 0
Input: An enhanced BMC image using the color
transformation, initial parameter Ti = 0 and a
number of iterations IT=1.
Output: A mask image.
S1: Calculate the average gray value of the pixels
with the gray value greater than Ti in the HSG
image, denoted as Tj.
S2: Calculate the average gray value of the pixels
with the gray value which is less than Tj but
greater than Ti in the HSG image, denoted as Tk.
S3: Set Ti = Tk and IT = IT + 1. If IT = 4, stop.
Otherwise, repeat Steps 1 and 2.
S4: The four average gray values will be obtained for
the background, the mature red blood cells, the
BMC cytoplasm and the BMC nuclei. Then, use
the average gray value of BMC cytoplasm and
nuclei for a rough initial segmentation to obtain a
mask image. If a pixel value is less than the
average value, it is set 0. Otherwise, it will be set
to 255. The mask image obtained will contain the
BMC nuclei.
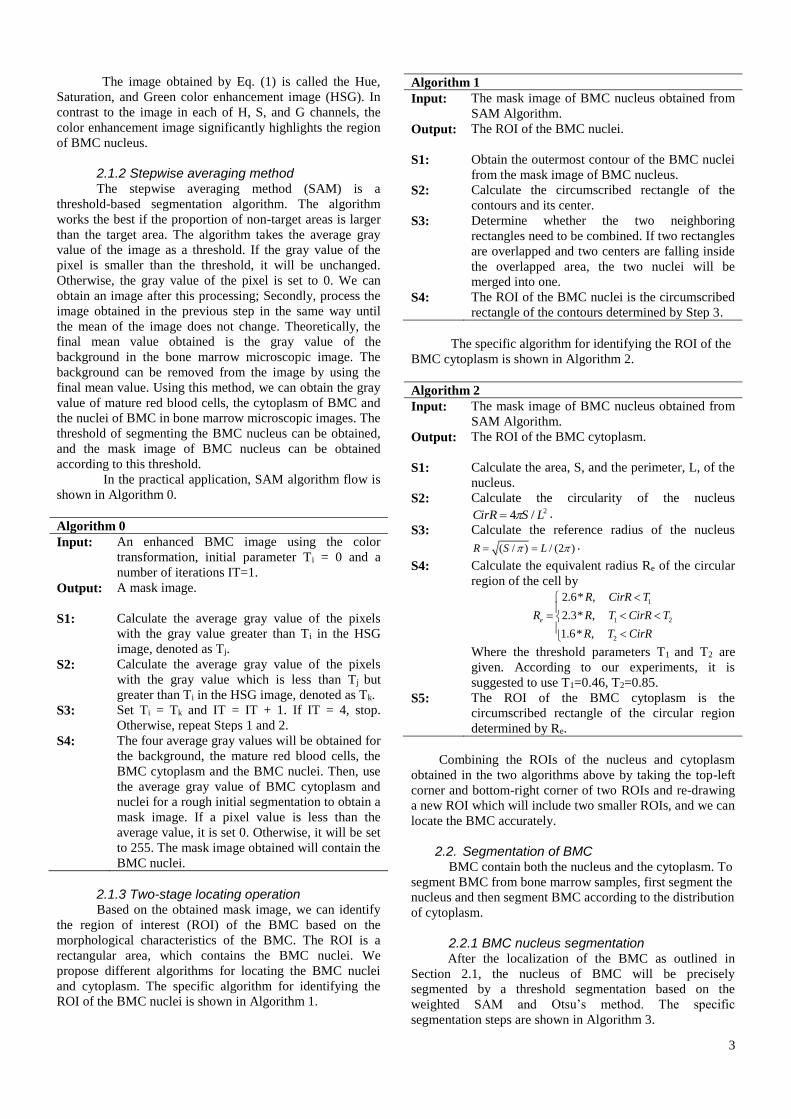
2.1.3 Two-stage locating operation Based on the obtained mask image, we can identify
the region of interest (ROI) of the BMC based on the
morphological characteristics of the BMC. The ROI is a
rectangular area, which contains the BMC nuclei. We
propose different algorithms for locating the BMC nuclei
and cytoplasm. The specific algorithm for identifying the
ROI of the BMC nuclei is shown in Algorithm 1.
Algorithm 1
Input: The mask image of BMC nucleus obtained from
SAM Algorithm.
Output: The ROI of the BMC nuclei.
S1: Obtain the outermost contour of the BMC nuclei
from the mask image of BMC nucleus.
S2: Calculate the circumscribed rectangle of the
contours and its center.
S3: Determine whether the two neighboring
rectangles need to be combined. If two rectangles
are overlapped and two centers are falling inside
the overlapped area, the two nuclei will be
merged into one.
S4:
The ROI of the BMC nuclei is the circumscribed
rectangle of the contours determined by Step 3.
The specific algorithm for identifying the ROI of the
BMC cytoplasm is shown in Algorithm 2.
Algorithm 2
Input: The mask image of BMC nucleus obtained from
SAM Algorithm.
Output: The ROI of the BMC cytoplasm.
S1: Calculate the area, S, and the perimeter, L, of the
nucleus.
S2: Calculate the circularity of the nucleus 2/4 LSCirR .
S3: Calculate the reference radius of the nucleus
( / ) / (2 )R S L .
S4: Calculate the equivalent radius Re of the circular
region of the cell by
1
1 2
2
2.6* ,
2.3* ,
1.6* ,
e
R CirR T
R R T CirR T
R T CirR
Where the threshold parameters T1 and T2 are
given. According to our experiments, it is
suggested to use T1=0.46, T2=0.85.
S5: The ROI of the BMC cytoplasm is the
circumscribed rectangle of the circular region
determined by Re.
Combining the ROIs of the nucleus and cytoplasm
obtained in the two algorithms above by taking the top-left
corner and bottom-right corner of two ROIs and re-drawing
a new ROI which will include two smaller ROIs, and we can
locate the BMC accurately.
2.2. Segmentation of BMC BMC contain both the nucleus and the cytoplasm. To
segment BMC from bone marrow samples, first segment the
nucleus and then segment BMC according to the distribution
of cytoplasm.
2.2.1 BMC nucleus segmentation After the localization of the BMC as outlined in
Section 2.1, the nucleus of BMC will be precisely
segmented by a threshold segmentation based on the
weighted SAM and Otsu’s method. The specific
segmentation steps are shown in Algorithm 3.

4
Algorithm 3
Input: The ROIs (i.e. a patch) of BMC sample image,
mask image and HSG image.
Output: The BMC nucleus.
S1: Subtract the mask image from the HSG image to
obtain a new HSG image (we call the HSG-M
image) without the BMC nuclei and Obtain the
ROI of the new HSG image based on the same
ROI of the BMC.
S2: Perform SAM on the ROI of the HSG-M image
to obtain the gray values of background, mature
red blood cells, cytoplasm and nucleus, which is
represented as bT, rT, cT and kT respectively.
S3: Perform the Otsu’s method on the ROI of HSG-
M to obtain the auxiliary threshold wT.
S4: Calculate the initial weighted threshold, T, using
the thresholds obtained from the SAM and
Otsu’s method with wTcTT *)1(* . In
our experiments, 5.0 .
S5: Based on threshold T, segment the HSG-M to
obtain the initial BMC nucleus in the ROI. Then,
apply the SAM to the HSG-M and obtained
initial BMC nucleus to obtain a more accurate
threshold of the BMC nucleus, i.e. TcTrTb ,,
Tkand . We can then recalculate a new
threshold of T (from Step 4) using the
formula TkTcT **)-1( .
S6: Segment the HSG-M to obtain the nucleus image
using thresholdT .
Experimental results of algorithm 3 applied to a
patch is shown in Fig.3. In this Fig.3, (a) shows the ROI
region of BMC; (b) the corresponding color enhanced
transformation; (c) the output of Algorithm 3, a BMC
nucleus image that may contain impurities; (d) the output of
Algorithm 3 is post-processed to obtain an impurity-free
BMC nucleus image.
2.2.2 BMC cytoplasm segmentation Due to the complex background in the bone marrow
sample image, we have defined a color weakened
transformation to highlight the color characteristics of BMC.
This transformation can effectively distinguish the non-
BMC region from other regions. Then, the non-BMC region
is removed and the BMC cytoplasm is segmented. The steps
for the segmentation are shown in Algorithm 4 and 5.
In algorithm 4, the structure of the color weakened
transformation image BSG, the BMC cell texture image
TeIg, the BMC cytoplasmic white particle image CWPIg
and the seed point selection of region growing will be
described later in detail.
Algorithm 4
Input: The ROIs (i.e. a patch) of BMC sample image;
the BMC nucleus obtained from Algorithm 3.
Output: The non-BMC mask.
S1: The nucleus is removed from the BSG image and
the threshold, TB, is obtained using the Otsu’s
method. If the gray level of a pixel is less than
TB, it is assigned into the non-BMC region.
S2: Obtain the background and mature red blood cell
regions with uniform gray distribution based on
the image, TeIg, and assigned into the non-BMC
region.
S3: According to the number of connected regions in
the image CWPIg, it is judged whether the color
of the nucleus and cytoplasm of BMC is
consistent. If the color is the same, it is
considered that the pixel in the image BSG with
the gray value equal to zero belongs to the non-
BMC region.
S4: The boundary point on the circumcircle of the
BMC nucleus and the pixel in the non-BMC
region determined as the seed point were used to
grow the region, and the results were assigned
into the non-BMC region.
S5: The non-BMC mask is the union of the non-
BMC regions obtained in the above four steps.
In algorithm 5, the structure of the color weakened
transformation image BSG will be described later in detail.
Algorithm 5
Input: The non-BMC mask obtained from Algorithm 4.
Output: The BMC mask.
S1: In the image BSG, the value of pixels in the non-
BMC region are set to 0; Image BSG is then
segmented into three categories using the K-
(a) (b) (c) (d)
Fig. 3. (a) the ROI region of BMC; (b) the corresponding color enhanced transformation; (c) the output of Algorithm 3, a
BMC nucleus image that may contain impurities; (d) the output of Algorithm 3 is post-processed to obtain an impurity-free
BMC nucleus image.

5
Means algorithm, the clustered result image,
KMImg.
S2: In the image KMImg, the smallest average gray
values are eliminated, and finally the largest
connected area is selected as the initial BMC
mask image, PdgMask.
S3: According to the pole in the image PdgMask to
determine whether the occurrence of adhesion.
S4: If the BMC and the surrounding BMC or mature
red blood cells were connected, the marker-
controlled watershed algorithm will be applied,
to obtain more accurate cell boundaries.
S5: The BMC mask is the region enclosed by the cell
boundaries determined by Step 4.
Using algorithm 4 and 5, Fig.4 and 5, respectively,
shows the BMC nucleus and cytoplasm of the same and
different color, a segmentation result of BMC cytoplasm. In
Fig.4, (a) shows the ROI of BMC (large lymphocytes) after
BMC localization; (b) shows the region image of the non-
BMC; (c) represents the clustered image; (d) represents the
average gray value in the clustered image is relatively large
two categories as the image PdgMask; (e) represents the
maximum connected region in the image PdgMask; (f)
represents the pole image; (g) represents the non-BMC
marker image; (h) represents the BMC marker image; (i)
represents the use of watershed to obtain the image; (j)
represents the final BMC boundary image; In Fig.5, (a)
shows the ROI of BMC (neutrophilic segmented
granulocyte) after BMC localization; The meaning of (b-j) is
the same as Fig. 4 (b-j).
The method of generating a transformation image, a
texture image, a particle image, and a watershed initial
marker will be described in detail below.
(a) Transformation image
It has been observed that there is a great contrast
between the foreground and the background in the blue
(a) (b) (c) (d) (e)
(f) (g) (h) (i) (j)
Fig. 4. (a) the ROI of BMC (large lymphocytes) after BMC localization; (b) the region image of the non-BMC; (c) the
clustered image; (d) the average gray value in the clustered image is relatively large two categories as the image
PdgMask; (e) the maximum connected region in the image PdgMask; (f) the pole image; (g) the non-BMC marker image;
(h) the BMC marker image; (i) the use of watershed to obtain the image; (j) the final BMC boundary image.
(a) (b) (c) (d) (e)
(f) (g) (h) (i) (j)
Fig. 5. (a) The ROI of BMC (neutrophilic split granulocyte) after BMC localization; the meaning of (b-j) is the same as
Fig. 4 (b-j).

6
channel of BMC images, and the brightness of BMC is
darker than other cells in the green channel of BMC images.
In order to make full use of these color features in the
algorithm, a new gray-scale mapping of bone marrow
microscopic images is obtained by using the color
weakening transformation shown in Eq. (2). The Eq. (2) has
the same meaning as the Eq. (1).
( , ) { ( , ) ( , )} (1- ) {255 ( , )}
( , ), ( , ) 0 (2) ( , )
0, otherwise
B G G
BSG
V x y I x y I x y I x y
V x y V x yI x y
In equation (2), the values of parameters can be
set according to whether the BMC nucleus and cytoplasm
are consistent. If the color is inconsistent, =0.5 , otherwise
=1 . The image obtained by Eq. (2) is called the Blue and
Green color weakening image (BSG).
In Fig.6, the first line and second line, respectively,
shows the same and different color of the BMC nucleus and
cytoplasm, the effect of the color weakened transformation
image BSG. (a), (b), (c) and (d) correspond to the original
image, the blue channel image IB, the green channel image
IG and the image BSG, respectively.
(b) Texture image
In non-BMC region set, the connected mature red
blood cells with BMC are very difficult to remove, but they
also have a commonality. It was observed that the
distribution of gray values of mature red blood cells was
more uniform than that of BMC in most of the bone marrow
samples. In order to better remove mature red blood cells,
this paper presents the method of generating bone marrow
texture images according to the characteristics, and uses
gray variance to characterize the texture features of cells.
That is, the gray value of the current pixel point is replaced
by the variance value of the eight neighborhood gray value
of the current pixel. The formal description is shown in the
formula (3).
Where Var(S) represents the variance function of the
set S, and w and h represent the length and width of the
neighborhood, respectively. Note that in order to increase
the speed of acquiring the texture image, the image BSG in
the equation (3) is an image after the background is removed.
After obtaining the texture image TeIg, if the average gray
value of the connected region is zero and its area is greater
than a given threshold, it is treated as part of the non-BMC
region and recorded as an NWIg image. The image
acquisition process is shown in Fig.7, where (a), (b), (c) and
(d) correspond to the original ROI image, the image BSG,
the image TeIg, and the image NWIg, respectively.
(c) Particle image
If the color difference of the BMC nucleus and
cytoplasm is obvious, there will be white particles on the
BMC cytoplasm, which is called the particle image in the
BMC cytoplasm. We can estimate whether the color of the
BMC nucleus and cytoplasm is consistent according to the
number of particles. If the color is consistent, the number of
particles contained in the cytoplasm is small, otherwise the
number of particles is high.
otherwise
TANWIgConIgConIgNum
BSGZoNumLDNA
sD
N
i
i
,0
& ,1)(
) ( 1
(4)
The binarized image BSGZo is obtained by
binarizing the image BSG with a threshold of zero. If the
connected region in the image BSGZo does not intersect the
image NWIg and the connected region area AD is greater
than the set threshold Ts, it is treated as part of the
cytoplasmic white particle image CWPIg. The number of
( , ) { ( + , + ), ,..., , ,..., }TeIg BSGI x y Var I x i y j i w w j h h (3)
(a) (b) (c) (d)
Fig. 6. (a), (b), (c) and (d) correspond to the original image, the blue channel image IB, the green channel image IG and
the image BSG, respectively.

7
particles in the image CWPIg is calculated as (4):
Here, BSGZoi represents the i-th connected region of
the image BSGZo, and Num (ConIg) is a function of
determining whether the image ConIg is a white particle of
the BMC cytoplasm. If white particle is present, returns 1;
otherwise, returns 0.
Fig.8 show the formation of image CWPIg, (a), (b),
(c) and (d) correspond to the original ROI image, the image
BSG, the image BSGZo and the image CWPIg, respectively.
(d) Watershed initial mark
Whether the current BMC are connected with the
surrounding cells is determined by whether the number of
poles on the image PdgMask contour is more than two. If
more than two, the BMC and other cells have occurred
adhesion. In the process of finding the pole, the choice of
starting point has a certain impact on the determination of
the pole. In order to make generally appear as an increasing
trend, the steps of selecting the contour starting point are
shown in Algorithm 6.
Algorithm 6
Input: The contour of the image PdgMask, the number
L of pixels in the cell contour, the center O of the
nucleus, and the move step Sp = 0.
Output: The starting point of the contour.
S1: Select the contour point pc with the smallest
distance from the center O as the initial contour
starting point.
S2: Determine whether the connection between the
contour point pc and the center O has two
intersections with the contour. If so, the pc can
be the starting point of the contour and the
program is terminated. Otherwise, Sp = Sp + 1,
the program continues to perform step three.
S3: Update the contour point pc = 2Sp % L, where
the symbol '%' indicates the modulo operators.
S4: Jump to step two.
In the process of reducing adhesion, if there are
multiple adhesions, that is, BMC is connected with multiple
mature red blood cells or other non-central BMC, the total
number of poles on the contour of BMC will exceed three.
At this point, it is necessary to determine that the two poles
corresponding to the cells need to be split. However, the
actual pole is often not in pairs, there will be some extra
pole, this makes it difficult to determine the pole pairs that
need to be split, so it is difficult to determine precisely the
poles that need to be split at the beginning. In order not to
miss pole pair any need to split, this paper uses the method
of quickly traversing all possible pole pairs which may need
to be split, and then determine the necessity of the division
by the increasement of the circularity of the BMC mask
after splitting, so as to determine the pole pairs that need to
be split.
Before applying the watershed algorithm, first
determine the initial mark set of foreground and background
objectives, the method is shown as follows. After finding the
pole pair that needs to be split, the position distance
(Euclidean distance) of the current pole pairs is used as the
long axis, and takes a third of its length as a short axis, and
then draw a black ellipse in each pair of poles corresponding
to the region, and fill it with pixels with a gray scale of zero.
The center of the ellipse is the midpoint of each pole pair.
Then, the region that is not connected with the central
nucleus, which is used as the seed point of the non-BMC,
and the remainder region is used as the seed point of the
(a) (b) (c) (d)
Fig. 7. (a), (b), (c) and (d) correspond to the original ROI image, the image BSG, the image TeIg, and the image NWIg,
respectively.
(a) (b) (c) (d)
Fig. 8. (a), (b), (c) and (d) correspond to the original ROI image, the image BSG, the image BSGZo and the image CWPIg,
respectively.
8
BMC. Finally, the watershed algorithm with marker control
is used to obtain the mask image of BMC.
2.3. Classification of BMC
The key steps of BMC classifying are extraction and
selection [29] of the BMC features. The whole process of
BMC classifying is described in detail below.
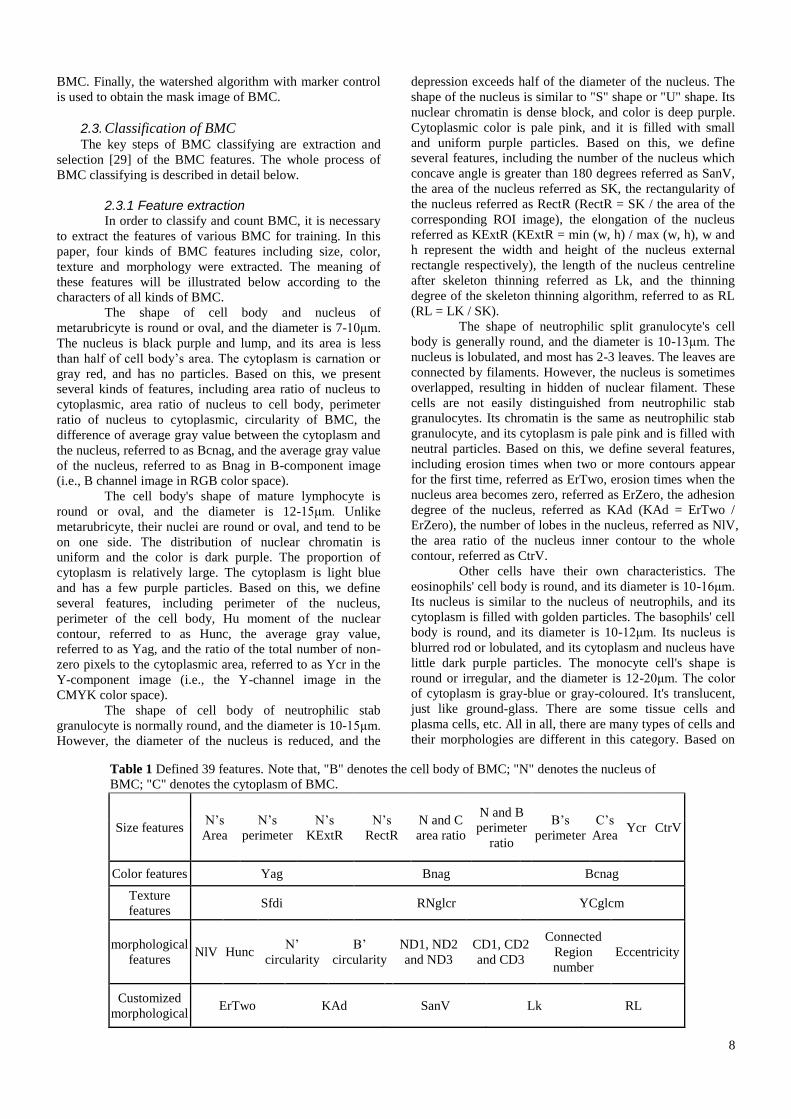
2.3.1 Feature extraction In order to classify and count BMC, it is necessary
to extract the features of various BMC for training. In this
paper, four kinds of BMC features including size, color,
texture and morphology were extracted. The meaning of
these features will be illustrated below according to the
characters of all kinds of BMC.
The shape of cell body and nucleus of
metarubricyte is round or oval, and the diameter is 7-10μm.
The nucleus is black purple and lump, and its area is less
than half of cell body’s area. The cytoplasm is carnation or
gray red, and has no particles. Based on this, we present
several kinds of features, including area ratio of nucleus to
cytoplasmic, area ratio of nucleus to cell body, perimeter
ratio of nucleus to cytoplasmic, circularity of BMC, the
difference of average gray value between the cytoplasm and
the nucleus, referred to as Bcnag, and the average gray value
of the nucleus, referred to as Bnag in B-component image
(i.e., B channel image in RGB color space).
The cell body's shape of mature lymphocyte is
round or oval, and the diameter is 12-15μm. Unlike
metarubricyte, their nuclei are round or oval, and tend to be
on one side. The distribution of nuclear chromatin is
uniform and the color is dark purple. The proportion of
cytoplasm is relatively large. The cytoplasm is light blue
and has a few purple particles. Based on this, we define
several features, including perimeter of the nucleus,
perimeter of the cell body, Hu moment of the nuclear
contour, referred to as Hunc, the average gray value,
referred to as Yag, and the ratio of the total number of non-
zero pixels to the cytoplasmic area, referred to as Ycr in the
Y-component image (i.e., the Y-channel image in the
CMYK color space).
The shape of cell body of neutrophilic stab
granulocyte is normally round, and the diameter is 10-15μm.
However, the diameter of the nucleus is reduced, and the
depression exceeds half of the diameter of the nucleus. The
shape of the nucleus is similar to "S" shape or "U" shape. Its
nuclear chromatin is dense block, and color is deep purple.
Cytoplasmic color is pale pink, and it is filled with small
and uniform purple particles. Based on this, we define
several features, including the number of the nucleus which
concave angle is greater than 180 degrees referred as SanV,
the area of the nucleus referred as SK, the rectangularity of
the nucleus referred as RectR (RectR = SK / the area of the
corresponding ROI image), the elongation of the nucleus
referred as KExtR (KExtR = min (w, h) / max (w, h), w and
h represent the width and height of the nucleus external
rectangle respectively), the length of the nucleus centreline
after skeleton thinning referred as Lk, and the thinning
degree of the skeleton thinning algorithm, referred to as RL
(RL = LK / SK).
The shape of neutrophilic split granulocyte's cell
body is generally round, and the diameter is 10-13μm. The
nucleus is lobulated, and most has 2-3 leaves. The leaves are
connected by filaments. However, the nucleus is sometimes
overlapped, resulting in hidden of nuclear filament. These
cells are not easily distinguished from neutrophilic stab
granulocytes. Its chromatin is the same as neutrophilic stab
granulocyte, and its cytoplasm is pale pink and is filled with
neutral particles. Based on this, we define several features,
including erosion times when two or more contours appear
for the first time, referred as ErTwo, erosion times when the
nucleus area becomes zero, referred as ErZero, the adhesion
degree of the nucleus, referred as KAd (KAd = ErTwo /
ErZero), the number of lobes in the nucleus, referred as NlV,
the area ratio of the nucleus inner contour to the whole
contour, referred as CtrV.
Other cells have their own characteristics. The
eosinophils' cell body is round, and its diameter is 10-16μm.
Its nucleus is similar to the nucleus of neutrophils, and its
cytoplasm is filled with golden particles. The basophils' cell
body is round, and its diameter is 10-12μm. Its nucleus is
blurred rod or lobulated, and its cytoplasm and nucleus have
little dark purple particles. The monocyte cell's shape is
round or irregular, and the diameter is 12-20μm. The color
of cytoplasm is gray-blue or gray-coloured. It's translucent,
just like ground-glass. There are some tissue cells and
plasma cells, etc. All in all, there are many types of cells and
their morphologies are different in this category. Based on
Table 1 Defined 39 features. Note that, "B" denotes the cell body of BMC; "N" denotes the nucleus of
BMC; "C" denotes the cytoplasm of BMC.
Size features N’s
Area
N’s
perimeter
N’s
KExtR
N’s
RectR
N and C
area ratio
N and B
perimeter
ratio
B’s
perimeter
C’s
Area Ycr CtrV
Color features Yag Bnag Bcnag
Texture
features Sfdi RNglcr YCglcm
morphological
features NlV Hunc
N’
circularity
B’
circularity
ND1, ND2
and ND3
CD1, CD2
and CD3
Connected
Region
number
Eccentricity
Customized
morphological ErTwo KAd SanV Lk RL
9
this, we define some features, including the fractal
dimension information of S component (S channel image of
HSV color space), referred as Sfdi, three optical densities of
the nucleus -- ND1, ND2 and ND3, and three gray-level co-
occurrence matrices extracted according to the R component
of the nucleus (i.e. the R - channel image in the RGB color
space), referred as RNglcr. Similarly, the three optical
density characteristics CD1, CD2 and CD3 of the cytoplasm
were extracted, and the three gray-level co-occurrence
matrices were extracted according to the Y component of
the cytoplasm, referred to as YCglcm.
In order to classify BMC accurately, 39 different
features were selected according to the characters of all
kinds of BMC, as shown in Table 1.
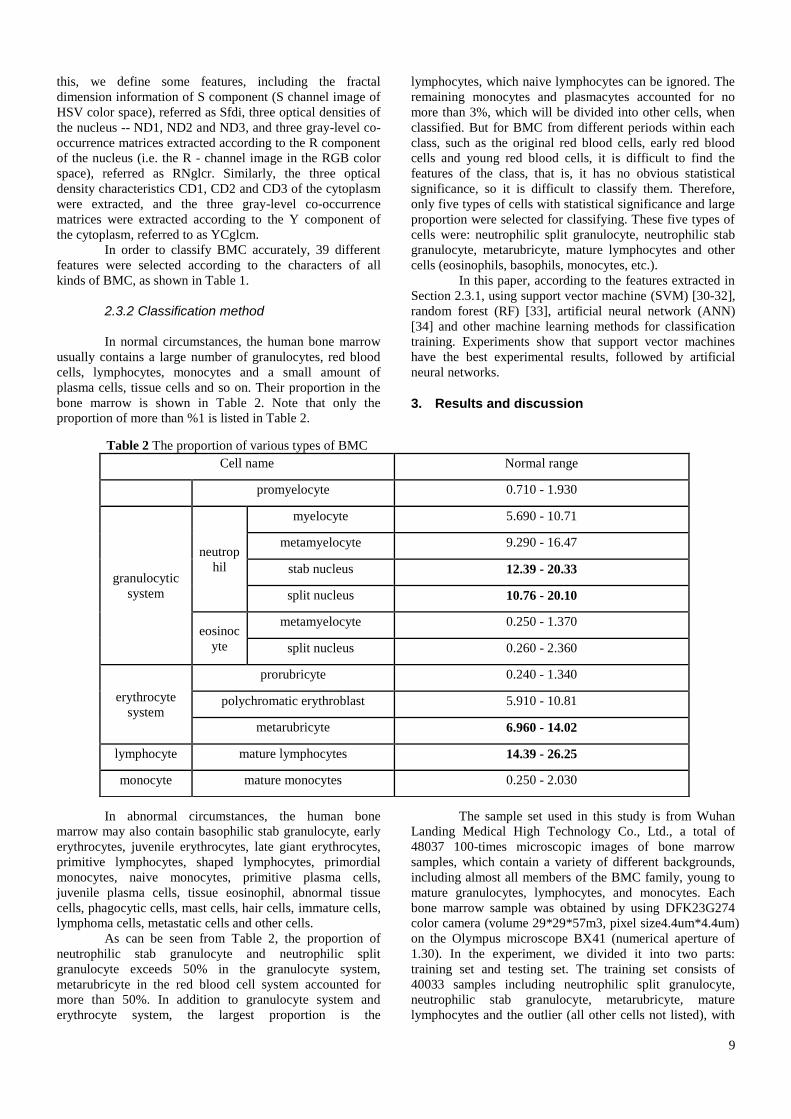
2.3.2 Classification method In normal circumstances, the human bone marrow
usually contains a large number of granulocytes, red blood
cells, lymphocytes, monocytes and a small amount of
plasma cells, tissue cells and so on. Their proportion in the
bone marrow is shown in Table 2. Note that only the
proportion of more than %1 is listed in Table 2.
In abnormal circumstances, the human bone
marrow may also contain basophilic stab granulocyte, early
erythrocytes, juvenile erythrocytes, late giant erythrocytes,
primitive lymphocytes, shaped lymphocytes, primordial
monocytes, naive monocytes, primitive plasma cells,
juvenile plasma cells, tissue eosinophil, abnormal tissue
cells, phagocytic cells, mast cells, hair cells, immature cells,
lymphoma cells, metastatic cells and other cells.
As can be seen from Table 2, the proportion of
neutrophilic stab granulocyte and neutrophilic split
granulocyte exceeds 50% in the granulocyte system,
metarubricyte in the red blood cell system accounted for
more than 50%. In addition to granulocyte system and
erythrocyte system, the largest proportion is the
lymphocytes, which naive lymphocytes can be ignored. The
remaining monocytes and plasmacytes accounted for no
more than 3%, which will be divided into other cells, when
classified. But for BMC from different periods within each
class, such as the original red blood cells, early red blood
cells and young red blood cells, it is difficult to find the
features of the class, that is, it has no obvious statistical
significance, so it is difficult to classify them. Therefore,
only five types of cells with statistical significance and large
proportion were selected for classifying. These five types of
cells were: neutrophilic split granulocyte, neutrophilic stab
granulocyte, metarubricyte, mature lymphocytes and other
cells (eosinophils, basophils, monocytes, etc.).
In this paper, according to the features extracted in
Section 2.3.1, using support vector machine (SVM) [30-32],
random forest (RF) [33], artificial neural network (ANN)
[34] and other machine learning methods for classification
training. Experiments show that support vector machines
have the best experimental results, followed by artificial
neural networks.
3. Results and discussion
The sample set used in this study is from Wuhan
Landing Medical High Technology Co., Ltd., a total of
48037 100-times microscopic images of bone marrow
samples, which contain a variety of different backgrounds,
including almost all members of the BMC family, young to
mature granulocytes, lymphocytes, and monocytes. Each
bone marrow sample was obtained by using DFK23G274
color camera (volume 29*29*57m3, pixel size4.4um*4.4um)
on the Olympus microscope BX41 (numerical aperture of
1.30). In the experiment, we divided it into two parts:
training set and testing set. The training set consists of
40033 samples including neutrophilic split granulocyte,
neutrophilic stab granulocyte, metarubricyte, mature
lymphocytes and the outlier (all other cells not listed), with
Table 2 The proportion of various types of BMC Cell name Normal range
promyelocyte 0.710 - 1.930
granulocytic
system
neutrop
hil
myelocyte 5.690 - 10.71
metamyelocyte 9.290 - 16.47
stab nucleus 12.39 - 20.33
split nucleus 10.76 - 20.10
eosinoc
yte
metamyelocyte 0.250 - 1.370
split nucleus 0.260 - 2.360
erythrocyte
system
prorubricyte 0.240 - 1.340
polychromatic erythroblast 5.910 - 10.81
metarubricyte 6.960 - 14.02
lymphocyte mature lymphocytes 14.39 - 26.25
monocyte mature monocytes 0.250 - 2.030

10
the corresponding samples 2747, 10129, 9890, 5724 and
11543, respectively. The testing set contains 8004 samples,
including neutrophilic split granulocyte, neutrophilic stab
granulocyte, metarubricyte, mature lymphocytes and the
outlier with corresponding samples, 549, 2025, 1978, 1144
and 2308, respectively.
In this paper, we compare the SVM-based method
[26], RF-based method [25], ANN-based method [23],
Adaboost-based method [22] and Nbayes-based method [24].
Table 3 shows the recognition rates for the various
classifiers.
It can be concluded that the SVM classifier's
classification performance is significantly better than the
other four classifiers from Table 3. Among them, the
classification accuracy of neutrophilic split granulocyte and
other cells is much better than other classifiers, and their
classification accuracy is 87.43% and 99.22% respectively.
Therefore, we finally adopted the SVM classifier for bone
marrow cells detection. In the experiment, the relevant
parameters of SVM are shown in Table 4.
4. Conclusion
Based on the transformed images, the impurities in
the bone marrow microscopic image are removed by region
growing and other method, the candidate mask was selected
by K-Means clustering, and the connected cells were split
by the watershed algorithm. Therefore, a fast and accurate
BMC segmentation algorithm was proposed. Then, machine
learning was used to classify and count the BMC, and
compared with support vector machine, random forest,
artificial neural network, enhanced learning, and Bayesian
classifier.
In the future work, we will make further
improvement for the case of cell adhesion, such as the
gradient image obtained by Sobel operator and canny
operator for obtaining the edges on the gradient image. If the
missing contour exists, theoretically we can find a more
natural BMC boundary. Then, under the precondition of
obtaining more samples, we try to use the supervised
machine learning method to segment the complex BMC to
improve the robustness of the algorithm. If the mass sample
can be obtained, we will try to use the deep learning
methods for classification and identification.
5. Acknowledgements
This work was supported by the National Natural
Science Foundation of China (Grant Nos. 61370179 and
Grant Nos. 61370181). Author would like to acknowledge
Zhongnan Hospital of Wuhan University and Wuhan
Landing Medical High-Tech Company, limited for
providing the test samples. In particular, the author would
like to thank the reviewers for their constructive comments
in improving the quality of the manuscript.
6. References
[1] K. A. Abuhasel, C. Fatichah, and A. M. Iliyasu, "A
commixed modified Gram-Schmidt and region
growing mechanism for white blood cell image
segmentation," in 2015 IEEE 9th International
Symposium on Intelligent Signal Processing (WISP)
Proceedings, 2015, pp. 1-5.
[2] C. Zhang, X. Xiao, X. Li, Y.-J. Chen, W. Zhen, J.
Chang, et al. (2014, 2014). White blood cell
segmentation by color-space-based k-means
clustering. Sensors (Basel, Switzerland) 14(9),
16128-16147.
[3] S. Arslan, E. Ozyurek, and C. Gunduz-Demir, "A
color and shape based algorithm for segmentation
of white blood cells in peripheral blood and bone
marrow images," Cytometry Part A, vol. 85, pp.
480–490, 2014.
[4] M. I. Jordan and T. M. Mitchell, "Machine learning:
Trends, perspectives, and prospects," Science (New
York, N.Y.), vol. 349, pp. 255-260, 2015/07// 2015.
[5] L. W. Hao, W. X. Hong, and C. L. Hu, "A Novel
Auto-Segmentation Scheme for Colored Leukocyte
Images," in International Conference on Pervasive
Computing Signal Processing & Applications, 2010,
pp. 916-919.
[6] S. Mohapatra, D. Patra, and K. Kumar, "Blood
microscopic image segmentation using rough sets,"
in Image Information Processing (ICIIP), 2011
International Conference on, 2011, pp. 1-6.
[7] B. C. Ko, J. W. Gim, and J. Y. Nam, "Automatic
white blood cell segmentation using stepwise
merging rules and gradient vector flow snake,"
Micron, vol. 42, pp. 695–705, 2011.
[8] D. C. Huang, K. D. Hung, and Y. K. Chan, "A
computer assisted method for leukocyte nucleus
Table 3 Shows the recognition rates for the various classifiers. Note that, NSTG denotes neutrophilic split granulocyte,
NSBG denotes neutrophilic stab granulocyte, MBE denotes metarubricyte, MLS denotes mature lymphocytes, OCS
denotes other Cells and ARR denotes average recognition rate.
NSTG NSBG MBE MLS OCS ARR
SVM-based method [26] 87.43% 87.06% 81.24% 82.52% 99.22% 87.49%
RF-based method [25] 33.15% 83.31% 87.66% 49.21% 74.00% 65.47%
ANN-based method [23] 51.91% 81.73% 83.67% 62.85% 73.31% 70.69%
Adaboost-based method [22] 46.81% 75.51% 82.05% 50.44% 71.75% 65.31%
Nbayes-based method [24] 63.21% 51.85% 37.16% 81.56% 34.23% 53.60%
Table 4 SVM related parameters
svm_type kernel_type degree gamma coef0 C nu p max_iter
C_SVC RBF 10.0 0.09 1.0 10.0 0.5 1.0 1000

11
segmentation and recognition in blood smear
images," Journal of Systems & Software, vol. 85,
pp. 2104-2118, 2012.
[9] N. Otsu, "A Threshold Selection Method from
Gray-Level Histograms," IEEE Transactions on
Systems, Man, and Cybernetics, vol. 9, pp. 62-66,
1979.
[10] M. Ghosh, C. Chakraborty, and A. K. Ray, "Yager's
measure based fuzzy divergence for microscopic
color image segmentation," in Medical Informatics
and Telemedicine, 2013, pp. 13 - 16.
[11] A. Jati, G. Singh, R. Mukherjee, M. Ghosh, A.
Konar, C. Chakraborty, et al., "Automatic
leukocyte nucleus segmentation by intuitionistic
fuzzy divergence based thresholding," Micron, vol.
58, pp. 55-65, 2014.
[12] T. Chaira, "Accurate segmentation of leukocyte in
blood cell images using Atanassov's intuitionistic
fuzzy and interval Type II fuzzy set theory," Micron,
vol. 61, pp. 1-8, 2014.
[13] K. T. Atanassov, "Intuitionistic Fuzzy Sets," Fuzzy
Sets & Systems, vol. 20, pp. 87-96, 1986.
[14] K. Atanassov and G. Gargov, "Interval valued
intuitionistic fuzzy sets," Fuzzy Sets and Systems,
vol. 31, pp. 343-349, 1989/07/20/ 1989.
[15] T. A. A. Tosta, A. F. d. Abreu, B. A. N. Travençolo,
M. Z. d. Nascimento, and L. A. Neves,
"Unsupervised Segmentation of Leukocytes Images
Using Thresholding Neighborhood Valley-
Emphasis," in 2015 IEEE 28th International
Symposium on Computer-Based Medical Systems,
2015, pp. 93-94.
[16] H. Danyali, M. S. Helfroush, and Z. Moshavash,
"Robust leukocyte segmentation in blood
microscopic images based on intuitionistic fuzzy
divergence," in 2015 22nd Iranian Conference on
Biomedical Engineering (ICBME), 2015, pp. 275-
280.
[17] F. Cao, J. Lu, C. Jianjun, Z. Zhenghua, J. Zhao, and
C. Guoqiang, "Leukocyte image segmentation
using feed forward neural networks with random
weights," in 2015 11th International Conference on
Natural Computation (ICNC), 2015, pp. 736-742.
[18] S. H. Rezatofighi and H. Soltanian-Zadeh,
"Automatic recognition of five types of white blood
cells in peripheral blood," Comput Med Imaging
Graph, vol. 35, pp. 333-343, 2011.
[19] M. Ghosh, D. Das, C. Chakraborty, and A. K. Ray,
"Automated leukocyte recognition using fuzzy
divergence," Micron, vol. 41, pp. 840-6, 2010.
[20] X. Long, W. L. Cleveland, and Y. L. Yao, "A new
preprocessing approach for cell recognition," IEEE
Transactions on Information Technology in
Biomedicine, vol. 9, pp. 407-412, 2005.
[21] S. Wang and W. Min, "A new detection algorithm
(NDA) based on fuzzy cellular neural networks for
white blood cell detection," IEEE Transactions on
Information Technology in Biomedicine A
Publication of the IEEE Engineering in Medicine
& Biology Society, vol. 10, pp. 5-10, 2006.
[22] Z. Shtadel'mann and I. N. Spiridonov, "A boosting-
based method for automatic detection of leukocytes
in blood smear images," Meditsinskaia tekhnika, pp.
35-37, 2012 Jul-Aug 2012.
[23] S. Nazlibilek, D. Karacor, T. Ercan, M. H. Sazli, O.
Kalender, and Y. Ege, "Automatic segmentation,
counting, size determination and classification of
white blood cells," Measurement, vol. 55, pp. 58-65,
2014.
[24] J. Prinyakupt and C. Pluempitiwiriyawej,
"Segmentation of white blood cells and comparison
of cell morphology by linear and naïve Bayes
classifiers," BioMedical Engineering OnLine, vol.
14, pp. 1-19, 2015.
[25] P. Ghosh, D. Bhattacharjee, and M. Nasipuri,
"Blood smear analyzer for white blood cell
counting: A hybrid microscopic image analyzing
technique," Applied Soft Computing, vol. 46, pp.
629-638, 2016.
[26] Z. Saeedizadeh, A. Mehri Dehnavi, A. Talebi, H.
Rabbani, O. Sarrafzadeh, and A. Vard, "Automatic
recognition of myeloma cells in microscopic
images using bottleneck algorithm, modified
watershed and SVM classifier," Journal of
microscopy, vol. 261, pp. 46-56, 2016.
[27] S. Maruyama, "Comparative study on the
influences of the sunlight upon the peroxidase,
dopa melanase, glycogen, and Wright's stainings of
human blood cells. 15. Report of histochemical
study of peroxidase," Okajimas folia anatomica
Japonica, vol. 25, pp. 189-193, 1953.
[28] H. S. Tubiash, "A rapid, permanent Wright's
staining method for chromosomes and cell nuclei,"
American journal of veterinary research, vol. 22,
pp. 807-810, 1961.
[29] H. T. Madhloom, S. A. Kareem, and H. Ariffin, "A
Robust Feature Extraction and Selection Method
for the Recognition of Lymphocytes versus Acute
Lymphoblastic Leukemia," in 2012 International
Conference on Advanced Computer Science
Applications and Technologies (ACSAT), 2012, pp.
330-335.
[30] P. H. Chen, C. J. Lin, and B. Schölkopf, "A tutorial
on ν ‐ support vector machines," Applied
Stochastic Models in Business & Industry, vol. 21,
pp. 111-136, 2005.
[31] K. R. Muller, S. Mika, G. Ratsch, K. Tsuda, and B.
Scholkopf, "An introduction to kernel-based
learning algorithms," IEEE Transactions on Neural
Networks, vol. 12, pp. 181-201, 2001.
[32] V. D. Sánchez A, "Advanced support vector
machines and kernel methods," Neurocomputing,
vol. 55, pp. 5-20, 2003.
[33] A. Criminisi, J. Shotton, and E. Konukoglu,
"Decision Forests: A Unified Framework for
Classification, Regression, Density Estimation,
Manifold Learning and Semi-Supervised
Learning," vol. 7, pp. 81-227, 2011.
[34] R. Chellappa, K. Fukushima, A. K. Katsaggelos, S.
Y. Kung, Y. Lecun, N. M. Nasrabadi, et al., "Guest
Editorial Applications Of Artificial Neural
Networks To Image Processing," IEEE
Transactions on Image Processing, vol. 7, pp.
1093-1096, 1998.