board of directors - genentech of directors j. richard munro ... ¥ genentech and idec...
TRANSCRIPT

66
Actimmune, Activase, Herceptin, Nutropin, Nutropin AQ, Protropin and Pulmozyme are
registered trademarks, Neuleze and Nutropin Depot are trademarks and SPOC is a
service mark of Genentech, Inc. HercepTest is a trademark of Genentech, Inc. that is
licensed to DAKO A/S. Cancer Survival Toolbox, Building Skills that Work for You
is a trademark of the National Coalition for Cancer Survivorship. Retavase is a
registered trademark of Centocor, Inc. Rituxan is a registered trademark of IDEC
Pharmaceuticals Corporation. XenoMouse is a trademark of Abgenix, Inc. Xubix is a
trademark of Hoffmann-La Roche, Inc.
Copyright © 1999, Genentech, Inc.
BOARD OF DIRECTORS
J. Richard MunroChairman of the Board,Genentech, Inc.
Herbert W. Boyer, Ph.D.Professor Emeritus of Biochemistryand Biophysics, University of California,San Francisco, and Chairman of the Board,Allergan, Inc., a technology-driven globalhealthcare company
Franz B. Humer, Ph.D.Chief Executive OfficerHead of the Pharmaceuticals Division,F. Hoffmann-La Roche, Ltd.,a research-based healthcare company
Jonathan K.C. Knowles, Ph.D.President of Global Research,F. Hoffmann-La Roche, Ltd., a research-based healthcare company
Arthur D. Levinson, Ph.D.President and Chief Executive Officer,Genentech, Inc.
Linda Fayne LevinsonPrincipal,Global Retail Partners, L.P.,a private equity investment fund
Donald L. MurfinGeneral Partner,Chemicals and MaterialsEnterprise Associates, L.P.,a venture capital firm
John T. Potts, Jr., M.D.Distinguished Jackson Professor ofClinical Medicine,Harvard Medical School,and Director of Research,Massachusetts General Hospital
C. Thomas Smith, Jr.President and Chief Executive Officer,VHA, Inc., a national alliancerepresenting 1,800 community-ownedhealthcare organizations
David S. Tappan, Jr.Retired Chairman and ChiefExecutive Officer,Fluor Corporation, an international engineering and construction company

OFFICERS
Arthur D. Levinson, Ph.D.*President and Chief Executive Officer
William D. Young*Chief Operating Officer
Louis J. Lavigne, Jr.*Executive Vice Presidentand Chief Financial Officer
Susan D. Desmond-Hellmann, M.D., M.P.H.*Senior Vice President — Developmentand Chief Medical Officer
Dennis J. Henner, Ph.D.*Senior Vice President — Research
Judith A. Heyboer*Senior Vice President —Human Resources
Stephen G. Juelsgaard* Senior Vice President, GeneralCounsel and Secretary
W. Robert Arathoon, Ph.D.Vice President — Process Sciences
Joffre B. Baker, Ph.D.Vice President — Research Discovery
J. Joseph Barta Vice President — Quality
John G. Curd, M.D.Vice President — Clinical Development
Stephen G. Dilly, M.D., Ph.D.Vice President — Medical Affairs
David A. EbersmanVice President — Product Development
Robert L. Garnick, Ph.D.Vice President — Regulatory Affairs
Bradford S. GoodwinVice President — Finance
Paula M. Jardieu, Ph.D.Vice President — PharmacologicalSciences
Edmon R. JenningsVice President — Corporate Development
Sean A. Johnston, Ph.D. Vice President — Intellectual Property
Cynthia J. LaddVice President — Corporate Lawand Assistant Secretary
Walter K. MooreVice President — Government Affairs
James P. PanekVice President — Manufacturing,Engineering and Facilities
Kimberly J. PopovitsVice President — Sales
Nicholas J. SimonVice President — Business and CorporateDevelopment
David C. Stump, M.D.Vice President — Clinical Research andGenentech Fellow
John M. WhitingController
* Member of Executive Committee
STAFF SCIENTISTS
Thomas A. Bewley, Ph.D. Process Sciences
Stuart Bunting, Ph.D. Research
Napoleone Ferrara, M.D. Research
David Giltinan, Ph.D. Medical Affairs
Tim Gregory, Ph.D. Process Sciences
Andrew J.S. Jones, D. Phil. Process Sciences
Laurence A. Lasky, Ph.D. Research
Arnon Rosenthal, Ph.D. Research
Steven Shak, M.D.Medical Affairs
Timothy A. Stewart, Ph.D. Research
Gordon A. Vehar, Ph.D. Research
William I. Wood, Ph.D. Research
DISTINGUISHED ENGINEER
Robert van ReisProcess Sciences
Desi
gned
and
pro
duce
d by
Spe
rling
Sam
pson
Wes
t. P
rinte
d in
the
Unite
d St
ates
by
Geor
ge R
ice
& So
ns.

In 1998, Genentech continued to deliver the results of its disciplined business planand strategies to the bottom line. Seeking strong growth into the next century,
in 1998 Genentech defined its goals and identified a five-point strategy for growth:
1998 andearly 1999
businessevents in
genentech
4
1 MAXIMIZE OUR REVENUE GROWTH
• 1998 revenues: $1.15 billion.
• Received approval from the U.S. Food and Drug Adminis-
tration (FDA) to market Herceptin for use as first line
therapy in combination with paclitaxel and as a single agent
in second and third line therapy for patients with metastatic
breast cancer who have tumors that overexpress the HER2
(human epidermal growth factor receptor2) protein.
• Received FDA approval for a label change for Pulmozyme
to include the safety and alternative administration of
Pulmozyme in cystic fibrosis patients under the age of five.
• Genentech and IDEC Pharmaceuticals Corporation’s interna-
tional partner, Roche, received approval to market MabThera
(marketed as Rituxan in the United States) from the
European Comission. MabThera was approved for treating
non-Hodgkin’s lymphoma (NHL) patients who have had two
or more relapses or are resistant to chemotherapy.
• Received FDA approval for the large-scale (12,000-liter)
manufacture of Rituxan, enabling Genentech to supplement
the Rituxan manufactured by partner IDEC.
• Settled patent litigation with Novo Nordisk A/S relating to
human growth hormone (hGH) and insulin. Novo Nordisk and
Genentech cross-licensed worldwide certain patents relating
to hGH. Novo Nordisk received a worldwide license under
Genentech patents relating to insulin and Genentech
received certain payments.
• Received three new patents related to variant forms of tissue-
plasminogen activator (t-PA). Filed patent infringement suits
against Centocor, Inc., alleging that Centocor’s sale, offer for
sale, use and importation of Retavase® (Reteplase, recombi-
nant) rPA in the United States infringe on these three new
Genentech patents. Genentech is seeking a permanent
injunction and damages.
• Signed multiparty agreements with Schering-Plough
Corporation, Biogen, Inc. and Roche settling a 1996 lawsuit
that Biogen filed against Roche and Genentech related to a
disputed alpha interferon invention. As a result of the
settlement, the U.S. Patent Office is expected to issue a
patent to Genentech/Roche for the disputed alpha interferon
claim. Genentech expects to receive certain future payments.
2 FURTHER OUR DISCOVERY ANDDEVELOPMENT OF INNOVATIVE PRODUCTS
• Dedicated a new $250 million, 310,000-square-foot manufac-
turing facility, the world’s largest biotech manufacturing
facility for the large-scale production of biopharmaceutical
proteins in Vacaville, California.
• With partner Alkermes, Inc., began preparing a New Drug
Application for FDA filing seeking approval to market
Nutropin Depot for the treatment of growth hormone
deficiency in children.
• Completed enrollment ahead of schedule in a U.S. Phase III
trial of Neuleze in patients with diabetic peripheral neuropathy.
• With partner Boehringer Ingelheim GmbH, completed enroll-
ment in a worldwide Phase III trial of TNK (a t-PA) in patients
with acute myocardial infarction.
• Based on positive results of Phase II trials, with partners
Novartis AG and Tanox Biosystems, Inc., initiated Phase III
trials of the anti-IgE antibody in allergic asthma and allergic
rhinitis patients.
• With partner IDEC, announced results of a Phase II pilot study
combining Rituxan with standard chemotherapy in patients
with previously untreated intermediate- or high-grade NHL.
• Discontinued development of Activase for treating acute
ischemic stroke (AIS) in patients presenting later than three
hours from symptom onset after two clinical trials showed no
clinical benefit when treating in this time frame. Activase is
approved for the treatment of AIS within three hours of
symptom onset.

• The AIDS Clinical Trials Group completed a Phase II trial
of Genentech’s Neuleze for the potential treatment
of HIV-associated neuropathy and presented positive
preliminary results.
• Began Phase II trials of:
- vascular endothelial growth factor (VEGF) for the
potential treatment of coronary artery disease
- an anti-VEGF antibody in patients with advanced
solid tumors
- an anti-CD18 antibody for the potential treatment
of acute myocardial infarction.
• Through partner LeukoSite, Inc., began Phase Ib/IIa trials of
LDP-02 in patients with ulcerative colitis (an inflammatory
bowel disease) in Canada and Europe.
3 INVEST IN OUR PEOPLE
• Named to FORTUNE magazine’s annual list of “100 Best
Companies to Work for in America.”
• Celebrated the 10th anniversary of Genentech’s Second
Generation child care center — one of the largest corporate-
sponsored daycare centers in the country.
• Introduced a variety of new programs for employees, including
charitable contribution matching, a retiree medical account
and a grant program to support child care alternatives at
Genentech’s Vacaville site.
• Named Stephen G. Juelsgaard as senior vice president,
general counsel and secretary and named Dennis J. Henner,
Ph.D., as senior vice president — Research.
• Named J. Joseph Barta as vice president — Quality; Stephen
G. Dilly, M.D., Ph.D., as vice president — Medical Affairs; David
A. Ebersman as vice president — Product Developement; Sean
A. Johnston, Ph.D., as vice president — Intellectual Property;
and Walter K. Moore as vice president — Government Affairs.
• Named Steven Shak, M.D., as staff scientist in Medical Affairs.
4 LEVERAGE OUR ASSETS
• Entered into an agreement with Roche providing Roche
exclusive ex-U.S. marketing rights for Herceptin. As part of
the agreement, Roche paid $40 million to Genentech.
• Agreed with DAKO A/S for DAKO to develop a laboratory
diagnostic kit to screen breast cancer patients for over-
expression of HER2 and potential eligibility for Herceptin
treatment. DAKO received FDA approval on September 25,
1998, for its diagnostic kit, HercepTest™.
• Entered into an agreement with Schwarz Pharma AG for the
development and distribution of Nutropin and Nutropin
Depot for the treatment of certain pediatric and adult
growth disorders in Europe and certain other countries
outside of the United States, Canada and Japan.
• Licensed to Connetics Corporation the U.S. development
and marketing rights to interferon gamma, including
Actimmune, for the management of chronic granulomatous
disease and the potential treatment of various other diseases.
• Agreed with Abgenix, Inc. that it will provide Genentech
access to Abgenix’s XenoMouse™ technology for generating
fully human antibodies.
• Agreed with Protein Design Labs, Inc. to cross-license
rights to certain intellectual property in the field of
monoclonal antibodies.
• Made $2 million milestone payment to partner XOMA Ltd. for
its successful completion of Phase II clinical trials of
Genentech’s anti-CD11a antibody (hu1124) for the potential
treatment of psoriasis.
• Completed Phase III studies with pimagedine. The drug did
not demonstrate clinical benefit based on analysis of the
primary endpoints. Genentech has terminated its support
of pimagedine development and is in discussions with
Alteon Inc. as to the future direction of the collaboration.
• Discontinued relationship with CytoTherapeutics, Inc. for
the development of encapsulated delivery of nervous
system compounds.
5 IMPROVE OUR FINANCIAL RETURNS
• 1998 net income: $181.9 million.
• 1998 diluted earning per share: $1.40.
• 1998 net income as a percent of revenues: 16 percent.
Actimmune® (Interferon gamma-1b); Activase® (Alteplase, recombinant),a tissue-plasminogen activator (t-PA); Herceptin® (Trastuzumab) anti-HER2antibody; Neuleze™ nerve growth factor; Nutropin® [somatropin (rDNA origin)for injection] growth hormone; Nutropin AQ® [somatropin (rDNA origin) injec-tion] liquid formulation growth hormone; Nutropin Depot™ encapsulatedsustained-release growth hormone; Protropin® (somatrem for injection)growth hormone; Pulmozyme® (dornase alfa, recombinant) InhalationSolution; Rituxan® (Rituximab); Xubix™ (sibrafiban) oral IIb/IIIa antagonist.
5

in businessfor results
To continue to be in business for life, Genentech must also be in business for results.By striving to improve financial returns, Genentech aims to build value for stockholders,
new opportunities for employees and a foundation to continue the pursuitof excellent science addressing further unmet needs.
Genentech’s ability to help people is dependent
upon its business success. The final component
of Genentech’s five-point strategy for growth is to
“Improve Financial Returns.” Success in doing so
will stem from success with the first four compo-
nents of that strategy. But it will also require success
with Genentech’s efforts to increase productivity
while carefully managing costs. While Genentech
expects that expenses will continue to increase in
absolute terms as the company moves projects
through its clinical pipeline, it will seek to decrease
expenses as a percent of revenues as revenues
increase with new-product introductions. In the 21st
century, Genentech seeks to achieve a level of pro-
fitable growth and productivity — when measured by
net income as a percentage of reve-
nues — that is in the top quartile
of the biopharmaceutical industry.
An ambitious goal, yes. One that
might not be achieved
due to many factors,
some of which —
like changes in the industry — are beyond the com-
pany’s control. But Genentech believes it has laid the
groundwork to accomplish this goal.
From its founding, Genentech’s efforts have
helped people. They have helped employees by
providing unparalleled career opportunities.
They have provided stockholders with a unique
investment opportunity. Since the company
launched its first product, Protropin, through the
introduction of its latest, Herceptin, the company’s
efforts have helped hundreds of thousands of patients.
Now 23, former Protropin patient Chris Rattereebenefited from Genentech’s first product,Protropin. Chris was treated for growth hormonedeficiency with a Genentech growth hormoneproduct from 1989 to 1994. In high school, Chriswrote a biology paper about how taking Protropinchanged his life by boosting his confidence.
28 29
5 IMPROVE OUR FINANCIAL RETURNS
Genentech’s strategy seeks to take the company’s
business to new heights. Achieving the goals of the
strategy and Long-Range Plan will enable Genentech
to continue its pursuit of excellent science. It will
provide exciting new opportunities for even more
employees, while at the same time building value for
stockholders. Most important, it will allow Genentech
to help even more patients. Thanks to a solid
business plan, Genentech truly is in business for life.
Breast cancer patient Shirley Michaelsen has benefited from Herceptin,Genentech’s newest product. Since being diagnosed with breast cancer,
Shirley has undergone a mastectomy, chemotherapy, radiation therapyand a stem cell transplant. Nonetheless, her cancer metastasized intoher lungs and liver. In April 1998, Shirley began treatment withHerceptin through the Genentech expanded access program, which was
in place before the medicine received regulatory approval. After eighttreatments, she experienced a 75 percent reduction in her liver tumors
and a significant decrease in her lung tumors.She continues on Herceptin treatment today.
BUSINESS WEEKnamed Herceptin one of the
BEST PRODUCTS OF 1998
DECEMBER 21, 1998
LIFEnamed Herceptin 11th on its list of the 100 BEST THINGS ABOUT AMERICA NOW
NOVEMBER 1998
HARPER’S BAZAAR
named Herceptin one of the10 BIGGEST BREAKTHROUGHSfor breast cancer
OCTOBER 1998
DISCOVERnamed Herceptin one of
THE TOP SCIENCE STORIES OF 1998
JANUARY 1999

Financial Highlights(dollars in millions, except per share data)
% Change f romPreced ing Year
Years ended December 31 1998 1997 1996 1998 1997
Total revenues $ 1 , 150.9 $ 1,016. 7 $ 968.7 13% 5%
Product sales 7 17.8 584.9 582.8 23 —
Cost of sales 138.6 102.5 104.5 35 (2)
Research and development (R&D) expenses 396.2 470.9 471 . 1 (16) —
Marketing, general andadministrative expenses 358.9 269.9 240. 1 33 12
Net income 181 .9 129.0 1 1 8 .3 41 9
Diluted earnings per share 1.40 1.02 0.95 37 7
R&D expense as a % of revenues 34% 46% 49%
Net income as a % of revenues 16% 13% 12%
Shares used to compute diluted earnings per share (millions) 129.9 126.4 124.0 3 2
Actual shares at year-end (millions) 127. 1 124.2 121.4 2 2
Stock price at year-end $ 79.69 $ 60.63 $ 53.63 31 13
The Company has paid no dividends
Cash, short-term investmentsand long-term marketable securities $ 1,604.6 $ 1,286.5 $ 1,159. 1 25 1 1
Property, plant and equipment, net 700.2 683.3 586.2 2 17
Total assets 2,855.4 2,507.6 2,226.4 14 13
Total stockholders’ equity 2,343.8 2,031 .2 1,801. 1 15 13
Capital expenditures 88. 1 154.9 141.8 (43) 9
Number of stockholders of record 13,374 15,122 16,748 (12) (10)
Number of employees 3,389 3,242 3,071 5 6
Revenues
1996 1997 1998
$968.7
Royalties
Contract, interest & other
Product sales
$1,016.7
$1,150.9
1,200
1,000
800
600
400
200
0
R&D Expenses and Total Revenues
1996 1997 1998
$968.7 $1,016.7
$1,150.9
1,200
1,000
800
600
400
200
0
R&D expenses
Total revenues
Diluted Earnings Per Share
1996 1997 1998
$0.95 $1.02
$1.401.50
1.25
1.00
0.75
0.50
0.25
0
3

Overview
Genentech, Inc. (the Company) is a biotechnology company
that uses human genetic information to discover, develop,
manufacture and market human pharmaceuticals for signifi-
cant unmet medical needs. Twelve of the approved products of
biotechnology stem from Genentech science. The Company
manufactures and markets eight products (see Actimmune dis-
cussion below) directly in the United States (U.S.), including:
• Herceptin® (trastuzumab) for the treatment of patients with
metastatic breast cancer whose tumors overexpress the
human epidermal growth factor receptor2 (HER2) protein;
• Rituxan® (rituximab) for the treatment of patients with
relapsed or refractory low-grade or follicular, CD20-positive
B-cell non-Hodgkins lymphoma;
• Activase® (alteplase, recombinant) a tissue plasminogen
activator (t-PA) for the treatment of heart attack, acute
ischemic stroke and acute massive pulmonary embolism;
• Protropin® (somatrem for injection) growth hormone for the
treatment of growth hormone deficiency (GHD) in children;
• Nutropin® [somatropin (rDNA origin) for injection] growth
hormone for the treatment of GHD in children and in adults,
growth failure associated with chronic renal insufficiency
(CRI) prior to kidney transplantation and short stature
associated with Turner syndrome;
• Nutropin AQ® [somatropin (rDNA origin) injection], a liquid
formulation of Nutropin for the same indications as Nutropin;
• Pulmozyme® (dornase alfa, recombinant) inhalation solution
for the management of cystic fibrosis; and
• Actimmune® (interferon gamma-1b) for the treatment of
chronic granulomatous disease, a rare, inherited disorder
of the immune system. In 1998, the Company licensed its
marketing and development rights to Actimmune to
Connetics Corporation (Connetics). Following a transition
period ending January 1999, the Company will no longer
market Actimmune, and Connetics has agreed to pay the
Company royalties on its sales of Actimmune.
The Company receives royalties on sales of its products
outside of the United States from F. Hoffmann-La Roche Ltd
(HLR), a subsidiary of Roche Holdings, Inc. (Roche) (see below
for further discussion). The Company also receives royalties
on sales of growth hormone and t-PA outside of the U.S. and
Canada through other licensees. The Company receives world-
wide royalties on five additional licensed products, and
Financial Review. . . . . . . . . . . . . . . . . . . . . . . . . 30
Report of Management . . . . . . . . . . . . . . . . . . . . 4 1
Consolidated Statements of Income . . . . . . . . . 42
Consolidated Statements of Cash Flows . . . . . . 43
Consolidated Balance Sheets . . . . . . . . . . . . . . . 44
Consolidated Statements ofStockholders’ Equity . . . . . . . . . . . . . . . . . . . . . . 45
Notes to ConsolidatedFinancial Statements . . . . . . . . . . . . . . . . . . . . . 46
Report of Independent Auditors . . . . . . . . . . . . 60
Quarterly Financial Data . . . . . . . . . . . . . . . . . . . 6 1
11-Year Financial Summary . . . . . . . . . . . . . . 62–63
Stock Information . . . . . . . . . . . . . . . . . . . . . . . . 64
Stockholder Information. . . . . . . . . . . . . . . . . . . 65
Board of Directors . . . . . . . . . . . . . . . . . . . . . . . . 66
Officers, Staff Scientistsand Distinguished Engineer . . . . . . . . . . . . . . . . 67
30
received royalties on one other licensed product for which
those royalties expired in August 1998 (see below), that origi-
nated from the Company’s technology and are marketed by
other companies.
Relationship with Roche Holdings, Inc.
On June 30, 1999, Roche’s option to cause the Company to
redeem (call) the outstanding Callable Putable Common Stock
(Special Common Stock) of the Company at predetermined
prices will expire. This arrangement was the result of the
October 1995 agreement (the Agreement) between the
Company and Roche. Should the call be exercised, Roche will
concurrently purchase from the Company a like number of
shares of Common Stock for a price equal to the Company’s
cost to redeem the Special Common Stock. If Roche does not
cause the redemption as of June 30, 1999, within thirty busi-
ness days commencing July 1, 1999, the Company’s stockhold-
ers will have the option (put) to cause the Company to redeem
none, some, or all of their shares of Special Common Stock at
$60.00 per share (and Roche will concurrently provide the
necessary redemption funds to the Company by purchasing a
like number of shares of Common Stock at $60.00 per share).
In conjunction with the Agreement, HLR was granted an
option for ten years for licenses to use and sell certain of the
Company’s products in non-U.S. markets (the License
Agreement). As of May 1997, the Company and HLR agreed in
principle to changes to the License Agreement that, in gener-
al, allow for the sharing of U.S. and European development
costs regardless of location or purpose of studies. Under the
License Agreement, as revised, HLR may exercise its option to
license any such future product of the Company either when
the Company determines to move such product into develop-
ment or at the end of Phase II clinical trials. Also, as part of
this Agreement, the Company receives royalties on sales of
certain of its products in Canada, on sales of Pulmozyme out-
side of the U.S. and on sales of rituximab outside of the U.S.,
excluding Japan.
In addition, on July 6, 1998, the Company entered into an
agreement with HLR to provide HLR exclusive marketing rights
outside of the U.S. for Herceptin. Under the agreement, HLR paid
$40.0 million and has agreed to pay cash milestones tied to
future product development activities, to contribute equally with
the Company up to a maximum of $40.0 million on global devel-
opment costs and to make royalty payments on product sales.
As of December 31, 1998, no additional amounts have been paid.
See the Relationship with Roche Holdings, Inc. note in
the Notes to Consolidated Financial Statements for further
information.
Results of Operations(dollars in millions, except per share amounts)
Revenues for 1998 increased from 1997 primarily as a result of
higher product sales. Revenues for 1997 increased from 1996 in
all areas, but primarily from royalties and contract revenues.
Product sales increased in 1998 as a result of a full year of
Rituxan sales and initial Herceptin sales. These increases were
partly offset by lower Activase and growth hormone sales.
Product sales in 1997 increased over 1996 due to increases in
Pulmozyme, growth hormone, new sales from the introduction
of Rituxan, offset by a decrease in Activase sales. Product sales
31
1,200
1,000
800
600
400
200
0
Revenues
1996 1997 1998 Annual %
change 5% 13%
$968.7$1,016.7
$1,150.9
700
600
500
400
300
200
100
0
Total Product Sales
1996 1997 1998 Annual %
change 0% 23%
$582.8 $584.9
$717.8
Distribution of Revenue Dollars
1996 1997 1998 Annual %
change 5% 13%
$968.7
Net income
MG&A expenses
R&D expenses
Cost of sales
Interest expense & income taxes
$1,016.7
$1,150.9Total revenues1,200
1,000
800
600
400
200
0
Net income as a % of revenues: 13% 16%12%
Financial Contents
Financial Review(dollars in millions, except per share amounts)

to HLR in conjunction with the License Agreement were $28.7
million in 1998, $17.4 million in 1997, and $13.2 million in 1996.
Herceptin: In September 1998, the Company received U.S.
Food and Drug Administration (FDA) approval to market
Herceptin in the U.S. for use as first line therapy in combina-
tion with paclitaxel and as a single agent in second and third
line therapy in patients with metastatic breast cancer who
have tumors that overexpress the HER2 protein. The Company
recorded $30.5 million of initial net sales of Herceptin in 1998.
However, not enough time has passed for this figure to be
indicative of the future trend of Herceptin sales. Herceptin is
the first humanized monoclonal antibody for the treatment of
HER2 overexpressing metastatic breast cancer and the second
U.S. approval in this new class of biotherapeutic cancer drugs;
the first was Rituxan, which was approved in November 1997.
Pursuant to an agreement entered into with the Company, HLR
received exclusive marketing rights to Herceptin outside of
the U.S.
Rituxan: Rituxan was approved for marketing by the FDA in
late November 1997. The Company launched Rituxan on
December 16, 1997, and recorded initial sales of $5.5 million for
1997. Net sales of Rituxan were $162.6 million in 1998. The
increase from 1997 was the result of one full year of sales.
Rituxan was co-developed by the Company and IDEC
Pharmaceuticals Corporation (IDEC), from whom the Company
licenses Rituxan, and is the first monoclonal antibody
approved to treat cancer. IDEC and the Company are jointly
promoting Rituxan in the U.S. and share responsibility for the
manufacturing of the product. HLR holds marketing rights for
MabThera™ (rituximab) outside of the U.S., excluding Japan,
and has agreed to pay to the Company royalties and a mark-
up on MabThera supplied to HLR.
In December 1998, a letter was sent to physicians advising
them of some deaths associated with administration of
Rituxan. As a result, the Company and IDEC have updated the
Warning section of the package insert to include information
on infusion-related reactions and cardiovascular events.
During the first quarter of 1998, the Company received
FDA approval for the large-scale (12,000-liter) manufacture of
rituximab. Rituximab manufactured by the Company will sup-
plement the rituximab manufactured by IDEC on the
Company’s behalf. Also in 1998, the Company’s and IDEC’s part-
ner, HLR, received approval from the European Commission to
market rituximab under the tradename MabThera in the
European Union.
Activase: Sales of Activase in 1998 and 1997 decreased pri-
marily due to a competitive thrombolytic agent, Centocor
Inc.’s (Centocor) Retavase®. This decrease also resulted, to a
lesser extent, from a decline in the size of the thrombolytic
market due to increasing use of mechanical reperfusion and
from a temporary decrease in the available commercial mar-
ket due to patients receiving therapy through large recently
completed Phase III clinical trials.
In March 1998, the Company received two new patents
related to variant forms of t-PA. Based on these patents, the
Company filed an infringement action against Centocor in the
Northern District of California which alleges that Centocor’s
sale, offer for sale, use in, and importation into, the U.S. of
Retavase (reteplase, recombinant), a t-PA, infringes these two
new patents of the Company. The Company is seeking a per-
manent injunction and damages.
In July 1998, the Company discontinued development of
Activase for treating acute ischemic stroke (AIS) in patients pre-
senting later than three hours from symptom onset after the
termination of two clinical trials, one in AIS patients presenting
three to five hours from symptom onset, and another in AIS
patients presenting zero to six hours from symptom onset.
Neither study showed clinical benefit. Activase is approved for
the treatment of AIS within three hours of symptom onset.
Protropin, Nutropin and Nutropin AQ: Net sales of the
Company’s three growth hormone products — Protropin,
Nutropin and Nutropin AQ, decreased in 1998 from 1997, but
increased slightly in 1997 from 1996. A small loss of market
share has been seen in 1998 due to increased competition. The
Company continues to face increased competition from five
other companies with growth hormone products, although
one company has been preliminarily enjoined from selling its
product. In December 1997, the Company received approval
from the FDA to market Nutropin and Nutropin AQ, respective-
ly, in the U.S. for the treatment of growth hormone deficiency
in adults. In December 1996 and January 1997, the Company
received approval from the FDA to market Nutropin and
Nutropin AQ, respectively, in the U.S. for the treatment of
short stature associated with Turner syndrome.
Pulmozyme: Net sales of Pulmozyme were slightly higher in
1998 compared to 1997 as a result of new patients in the mild
to moderate cystic fibrosis (CF) patient population in addition
to new patients from the 1998 FDA approval for a label exten-
sion to include CF patients under the age of five. Net sales in
1997 were higher primarily due to continued penetration in
the mild to moderate CF patient populations as well as from
variations in customer ordering patterns for U.S. sales. In
February 1998, the Company received approval from the FDA
for a label extension which includes the safety and alternative
administration of Pulmozyme in children with CF under the
age of five, adding to the product’s previous approvals for
patients five years of age and older. In November 1996,
Pulmozyme was approved by the FDA for marketing in the U.S.
for the management of CF patients with advanced disease.
Annual % Change
1998 1997 1996 98/97 97/96
Actimmune $ 3.9 $ 3.5 $ 4.5 1 1 (22)
Actimmune: In the second quarter of 1998, the Company
licensed U.S. marketing and development rights to interferon
gamma, including Actimmune, to Connetics. Following a tran-
sition period ending January 1999, the Company will no longer
market Actimmune, but has agreed to supply bulk materials to
Connetics at cost plus a mark-up. The Company will receive
royalties on Connetics’ sales of Actimmune.
Total royalties decreased in 1998 over 1997 due to the expira-
tion of royalties from Eli Lilly and Company (Lilly) in August
1998. Royalties in 1997 increased over 1996 primarily due to
3332
350
250
150
50
0
Activase
1996 1997 1998 Annual %
change (8)% (18)%
$284.1 $260.7$213.0
50
40
30
20
0
Herceptin
1996 1997 1998 Annual %
change — % —%
$0.0 $0.0
$30.5
180
160
120
100
0
Rituxan
1996 1997 1998 Annual %
change —% 2,856%
$0.0 $5.5
$162.6
350
250
150
50
0
Protropin, Nutropin and Nutropin AQ
1996 1997 1998 Annual %
change 2% (4)%
$218.2 $223.6 $214.0
120
100
80
60
0
Pulmozyme
1996 1997 1998 Annual %
change 21% 2%
$76.0
$91.6 $93.8
Financial Review(continued)
300
200
100
0
Royalties
1996 1997 1998 Annual %
change 12% (5)%
$214.7$241.1 $229.6

3534
increased licensee sales from various licensees. Under a
December 1994 settlement agreement with Lilly, royalties of
$30.0 million per year were payable, subject to possible off-
sets and contingent upon Humulin® continuing to be market-
ed in the U.S., to the Company through 1998. These royalty
obligations have now expired. Under a prior license agree-
ment with Lilly, the Company received royalties from Lilly’s
sales of its human insulin product until this royalty obligation
expired in August 1998. Cash flows from royalty income
include nondollar denominated revenues. The Company cur-
rently purchases simple foreign currency put option contracts
(options) to hedge these royalty cash flows. All options expire
within the next two years. See below for discussion of market
risks related to these financial instruments.
Contract and other revenues in 1998 decreased from 1997 as a
result of higher 1997 contract payments and gains from the
sale of biotechnology equity securities. Although the
Company received significant nonrecurring payments from
HLR for exclusive marketing rights outside of the U.S. for
Herceptin (discussed above) and from Novo Nordisk A/S
(Novo) on the patent infringement litigation settlement (dis-
cussed below), other contract revenues from HLR decreased
significantly from 1997 primarily due to the discontinuation of
several projects or indications in development. Contract and
other revenues were higher in 1997 compared to 1996 primari-
ly due to $30.9 million from Sumitomo Pharmaceuticals Co.,
Ltd. (Sumitomo) and Pharmacia & Upjohn (P&U) for strategic
alliances and $11.7 million of gains from the sale of biotech-
nology equity securities in 1997. These increases were partly
offset by higher revenues from HLR in 1996.
In July 1998, the Company and Novo agreed to settle a
lawsuit brought by the Company in the U.S. District Court for
the Southern District of New York relating to the Company’s
patents for human growth hormone and insulin and a lawsuit
brought in October 1997, by Novo in the U.S. District Court for
the District of New Jersey alleging infringement of a patent
held by Novo relating to the Company’s manufacture, use and
sale of its Nutropin human growth hormone products. Under
the settlement agreement, Novo and the Company agreed to
cross-license worldwide certain patents relating to human
growth hormone. In August 1998, Novo received a worldwide
license under the Company patents relating to insulin and the
Company received certain payments from Novo that were
recorded in contract revenues.
As part of a strategic alliance with Sumitomo, the
Company has agreed to provide Sumitomo exclusive distribu-
torship rights in Japan for Nutropin AQ and a sustained
release formulation of human growth hormone.
In an agreement with P&U, in exchange for development
costs, fees and, upon regulatory approval, royalties, the
Company agreed to provide P&U exclusive worldwide rights
for thrombopoietin (TPO), which is in Phase II trials for poten-
tial use in treating patients with complications of cancer
chemotherapy. P&U and the Company are jointly developing
TPO for one indication; however, the Company has no market-
ing rights for this indication.
The Company recorded nonrecurring contract revenues
from HLR of $40.0 million for Herceptin marketing rights out-
side of the U.S. in 1998 and $44.7 million for the exercise of
their options under the License Agreement with respect to
three development projects [Rituxan, insulin-like growth fac-
tor (IGF-I) which was subsequently terminated, and nerve
growth factor] in 1996. All other contract revenue from HLR,
including reimbursement for ongoing development expenses
after the option exercise date, totaled $21.6 million in 1998,
$67.6 million in 1997 and $50.6 million in 1996.
Annual % Change
1998 1997 1996 98/97 97/96
Interest income $ 88.7 $ 69.1 $ 64.2 28 8
Interest income increased in 1998 primarily due to an increase
in the investment portfolio and, to a lesser extent, a higher
average yield on the investment portfolio. The increase in 1997
from 1996 was due to an increase in the average yield on the
investment portfolio and a larger investment portfolio. The
Company enters into interest rate swaps (swaps) as part of its
overall strategy of managing the duration of its investment
portfolio. See below for discussion of market risks related to
150
100
50
0
Contract and Other
1996 1997 1998 Annual %
change 14% (6)%
$107.0$121.6 $114.8
these swaps and also the Financial Instruments note in the
Notes to Consolidated Financial Statements.
Total Costs and Expenses Annual % Change
1998 1997 1996 98/97 97/96
Total costsand expenses $ 898.3 $ 846.9 $ 820.8 6 3
% of revenues 78% 83% 85%
Cost of sales as a percent of product sales increased in 1998
to 19%. This increase was primarily the result of increased
sales to HLR as well as a shift in the product mix, including
the first full year of Rituxan sales and the introduction of
Herceptin. Cost of sales as a percent of product sales was
18% in 1997, which was comparable to 1996. The economic
benefits from sales to HLR are reflected in product sales and
royalties.
Research and development (R&D) expenses decreased in 1998
from 1997 primarily due to the wind-down of certain large
late-stage clinical trials and lower costs to license technolo-
gy from third parties. These decreases were partly offset by
higher costs related to large scale development collabora-
tions. In 1997, R&D expenses were flat compared to 1996. R&D
as a percentage of revenues decreased to 34% in 1998, from
46% in 1997 and from 49% in 1996. The decrease in this per-
centage from year to year reflects growing revenues and
more recently in 1998 a decrease in R&D expenses.
To gain additional access to potential new products and
technologies, and to utilize other companies to help develop
the Company’s potential new products, the Company has
established strategic alliances with companies developing
technologies that fall outside the Company’s research focus
and with companies having the potential to generate new
products through technology exchanges and investments.
This has included the acquisition by the Company of the equi-
ty and convertible debt of such companies. The Company has
also entered into product-specific collaborations to acquire
development and marketing rights for products.
Marketing, general and administrative (MG&A) expenses
increased in 1998 from 1997. The marketing and sales (M&S)
increases were driven by the introduction of Rituxan and
the resultant profit sharing with IDEC, the launch of
Herceptin, and the defense of Activase and the Company’s
growth hormone products against new competition and the
launch of a new indication, growth hormone deficiency in
adults, for Nutropin and Nutropin AQ. General and adminis-
trative expenses were higher principally as a result of the
write down of certain biotechnology equity securities. MG&A
expenses were also higher in 1997 compared to 1996
150
125
100
75
0
Cost of Sales
1996 1997 1998 Annual %
change (2)% 35%
COS as a % of product sales: 18% 19%18%
$104.5 $102.5
$138.6
600
400
200
0
Research and Development
1996 1997 1998 Annual %
change 0% (16)%
$471.1 $470.9$396.2
R&D as a % of revenues: 46% 34%49%
400
300
200
100
0
Marketing, General and Administrative
1996 1997 1998 Annual %
change 12% 33%
$240.1 $269.9
$358.9
MG&A as a % of revenues: 27% 31%25%
Financial Review(continued)

Forward-Looking Statements
The following section contains forward-looking statements
that are based on the Company’s current expectations.
Because the Company’s actual results may differ materially
from these and any other forward-looking statements made by
or on behalf of the Company, this section also includes a dis-
cussion of important factors that could affect the Company’s
actual future results, including its product sales, royalties, con-
tract revenues, expenses and net income.
Product Sales: The Company’s product sales may vary from
period to period for several reasons including, but not limited
to: the overall competitive environment for the Company’s
products; the amount of sales to customers in the U.S.; the
amount and timing of the Company’s sales to HLR; the timing
and volume of bulk shipments to licensees; the availability of
third-party reimbursements for the cost of therapy; the
effectiveness and safety of the products; the rate of adoption
and use of the Company’s products for approved indications
and additional indications; and the potential introduction of
new products and additional indications for existing products
in 1999 and beyond.
Competition: The Company faces growing competition in two of
its therapeutic markets and expects new competition in a third.
First, Activase lost market share and could lose additional mar-
ket share in the thrombolytic market to Centocor’s Retavase and
the resulting adverse effect on sales could be material. Retavase
received FDA approval in October 1996 for the treatment of AMI.
In addition, there is an increasing use of mechanical reperfusion
in lieu of thrombolytic therapy for the treatment of AMI, which is
expected to continue. Second, in the growth hormone market,
the Company continues to face increased competition from five
other companies with growth hormone products, although one
company has been preliminarily enjoined from selling its prod-
uct. As a result of this competition, the Company has experi-
enced a loss in new patient market share. Four of these com-
petitors have also received approval to market their existing
human growth hormone products for additional indications. The
Company expects that such competition could have an adverse
effect on its sales of Protropin, Nutropin and Nutropin AQ and
such effect could be material. Third, in the NHL market, Coulter
recently filed for approval with the FDA with respect to a prod-
uct for a similar indication for which Rituxan is approved.
Genentech is aware of other potentially competitive biologic
therapies in development.
Other competitive factors affecting the Company’s product
sales include, but are not limited to: the timing of FDA approval,
if any, of additional competitive products, pricing decisions
made by the Company, the degree of patent protection afford-
ed to particular products, the outcome of litigation involving
the Company’s patents and patents of competing companies
for products and processes related to production and formula-
tion of those products, the increasing use and development of
alternate therapies, and the rate of market penetration by
competing products.
Royalty and Contract Revenues: Royalty and contract rev-
enues in future periods could vary significantly from 1998 lev-
els. Major factors affecting these revenues include, but are not
limited to: HLR’s decisions to exercise or not to exercise its
option to develop and sell the Company’s future products in
non-U.S. markets and the timing and amount of related devel-
opment cost reimbursements, if any; variations in HLR’s sales
and other licensees’ sales of licensed products; fluctuations in
foreign currency exchange rates; the initiation of other new
contractual arrangements with other companies; the timing of
non-U.S. approvals, if any, for products licensed to HLR and
other licensees; whether and when contract benchmarks are
achieved; and the conclusion of existing arrangements with
other companies and HLR.
R&D: The Company is committed to aggressive R&D investment
to discover and develop new products. The Company currently
has several products in late-stage clinical testing and antici-
pates that its R&D expenses will continue at a high percentage
of revenues over the short-term. Over the long-term, as rev-
enues increase, R&D as a percent of revenues should decrease
to the 20% to 25% range.
Successful pharmaceutical product development is highly
uncertain and is dependent on numerous factors, many of
which are beyond the Company’s control. Products that
appear promising in the early phases of development may fail
to reach the market for numerous reasons: they may be found
to be ineffective or to have harmful side effects in preclinical
or clinical testing; they may fail to receive necessary regula-
tory approvals; they may turn out to be uneconomical
because of manufacturing costs or other factors; or they may
be precluded from commercialization by the proprietary
rights of others or by competing products or technologies for
the same indication. Success in preclinical and early clinical
trials does not ensure that large scale clinical trials will be
successful. Clinical results are frequently susceptible to vary-
ing interpretations that may delay, limit or prevent regulatory
approvals. The length of time necessary to complete clinical
trials and to submit an application for marketing approval for
a final decision by a regulatory authority varies significantly
3736
primarily due to increased M&S expenses in the oncology
area and competitive conditions with other marketed
products.
Annual % Change
1998 1997 1996 98/97 97/96
Interest expense $ 4.6 $ 3.6 $ 5.1 28 (29)
Interest expense will fluctuate depending on the amount of
capitalized interest related to the amount of construction
projects. Interest expense, net of amounts capitalized, relates
to interest on the Company’s 5% convertible subordinated
debentures.
Income Before Taxesand Income Taxes
1998 1997 1996
Income before taxes $ 252.6 $ 169.8 $ 147.9
Income tax provision 70.7 40.8 29.6
Effective tax rate 28% 24% 20%
The Company’s effective tax rate increased in 1998 over 1997 to
28%. This increase is primarily due to the decreased benefit of
R&D tax credits. The tax rate for 1998 and 1997 reflected the leg-
islative extension of R&D tax credits effective beginning in the
third quarter of 1997. The increase in the effective tax rate in
1997 over 1996 was attributable to the proportionally
decreased realization of previously reserved deferred tax
assets. The valuation allowance for deferred tax assets was
fully realized in 1996, with the exception of the portion attrib-
utable to the realization of tax benefits on stock option deduc-
tions which will be credited to additional paid-in-capital when
realized. The effective tax rate in 1998, 1997 and 1996 was less
than the U.S. statutory rate of 35% due in part to the R&D tax
credits, tax benefit of certain realized gains on securities avail-
able-for-sale, and realized foreign losses, except in 1997.
The increase in net income in 1998 from 1997 was driven pri-
marily by sales of Rituxan and Herceptin, lower R&D expenses
and higher interest income. These revenue increases and sav-
ings were partly offset by higher MG&A expenses, a decrease
in Activase sales, higher cost of sales and higher income
taxes. Net income in 1997 increased over 1996 primarily due to
higher royalties and contract and other revenues partly offset
by higher MG&A expenses.
Liquidity andCapital Resources
1998 1997 1996
Cash, cash equivalents,short-term investmentsand long-term marketabledebt and equity securities $ 1,604.6 $ 1,286.5 $ 1,159. 1
Working capital 950.6 904.4 705. 1
Cash provided by (used in):
Operating activities 349.9 1 18.3 139.7
Investing activities (421. 1 ) (168.4) (141 .7)
Financing activities 107.9 87.3 72.2
Capital expenditures(included in investingactivities above) (88. 1 ) (154.9) (141.8)
Current ratio 4.3 : 1 4.1 : 1 3.8 : 1
Cash generated from operations, income from investments
and proceeds from stock issuances were used to purchase
marketable securities and make capital investments in 1998.
Capital expenditures in 1998 included improvements to
existing office and laboratory facilities and equipment, and
equipment purchases. In 1997, capital expenditures primarily
included building improvements to existing manufacturing and
office facilities and production systems. In 1996, capital expen-
ditures primarily included building and land purchases and
improvements to existing manufacturing and office facilities.
Financial Review(continued)
200
175
150
125
100
0
Net Income
1996 1997 1998 Annual %
change 9% 41%
Earnings per share: Basic $ 1.05 $ 1.45$ 0.98
Diluted $ 1.02$ 0.95 $ 1.40
$118.3$129.0
$181.9

and may be difficult to predict. Factors affecting the
Company’s R&D expenses include, but are not limited to: the
number of and the outcome of clinical trials currently being
conducted by the Company and/or its collaborators; the num-
ber of products entering into development from late-stage
research; in-licensing activities, including the timing and
amount of related development funding or milestone pay-
ments; and future levels of revenues.
Income Tax Provision: The Company expects its effective tax
rate to be at or near 35% for the next several years dependent
upon several factors. These factors include, but are not limited
to, changes in tax laws and rates, interpretation of existing tax
laws, future levels of R&D spending, the outcome of clinical tri-
als of certain development products, the Company’s success in
commercializing such products, and potential competition
regarding the products.
Uncertainties Surrounding Proprietary Rights: The patent
positions of pharmaceutical and biotechnology companies can
be highly uncertain and involve complex legal and factual ques-
tions. Accordingly, the breadth of claims allowed in such com-
panies’ patents cannot be predicted. Patent disputes are fre-
quent and can preclude commercialization of products. The
Company has in the past been, is currently, and may in the
future be involved in material patent litigation. Such litigation is
costly in its own right and could subject the Company to signif-
icant liabilities to third-parties and, if decided adversely, the
Company may need to obtain third-party licenses at a material
cost or cease using the technology or product in dispute. The
presence of patents or other proprietary rights belonging to
other parties may lead to the termination of R&D of a particular
product. The Company believes it has strong patent protection
or the potential for strong patent protection for a number of its
products that generate sales and royalty revenue or that the
Company is developing; however, the courts will determine the
ultimate strength of patent protection of the Company’s prod-
ucts and those on which the Company earns royalties.
Year 2000: The Company uses and relies on a wide variety of
information technologies, computer systems and scientific and
manufacturing equipment containing computer related com-
ponents (such as programmable logic controllers and other
embedded systems). Some of the Company’s older computer
software programs and equipment are unable to distinguish
between the year 1900 and the year 2000. As a result, time-
sensitive functions of those software programs and equipment
may misinterpret dates after January 1, 2000, to refer to the
twentieth century rather than the twenty-first century. This
could cause system or equipment shutdowns, failures or mis-
calculations resulting in inaccuracies in computer output or
disruptions of operations, including, among other things, inac-
curate processing of financial information and/or temporary
inabilities to process transactions, manufacture products, or
engage in similar normal business activities.
The Company has a Year 2000 Project (Y2K Project) in place
to address the potential exposures related to the impact on its
computer systems and scientific and manufacturing equipment
containing computer related components for the Year 2000 and
beyond. Approximately half of the Company’s Year 2000 (Y2K)
scheduled work is complete. The remaining work is scheduled
to be completed by the end of the third quarter of 1999. The Y2K
Project phases include: (1) inventorying and prioritizing busi-
ness critical systems; (2) Y2K compliance analysis; (3) remedia-
tion activities including repairing or replacing identified
systems; (4) testing; and (5) developing contingency plans.
An inventory of business critical financial, informational
and operational systems, including manufacturing control sys-
tems, has been completed. Compliance analysis is approximate-
ly 80% complete for these systems. Remediation activities vary
by department, however, on the average, remediation activities
are approximately 50% complete. Testing of the Company’s
information technology infrastructure is 60% complete. Testing
of business critical application programs began in the third
quarter of 1998, and is scheduled to be complete by the third
quarter of 1999. Contingency planning will begin in the first
quarter of 1999. The Company believes that with the completed
modifications, the Y2K issue will not pose significant opera-
tional problems for its computer systems and equipment.
However, if such modifications and conversions are not made,
or are not completed in a timely fashion, the Year 2000 issue
could have a material impact on the operations of the Company,
the precise degree of which cannot be known at this time.
In addition to risks associated with the Company’s own
computer systems and equipment, the Company has relation-
ships with, and is to varying degrees dependent upon, a large
number of third parties that provide information, goods and
services to the Company. These include financial institutions,
suppliers, vendors, research partners, governmental entities
and customers. If significant numbers of these third parties
experience failures in their computer systems or equipment
due to Year 2000 noncompliance, it could affect the Company’s
ability to process transactions, manufacture products, or
engage in similar normal business activities. While some of
these risks are outside the control of the Company, the
Company has instituted programs, including internal records
review and use of external questionnaires, to identify key third
parties, assess their level of Year 2000 compliance, update
contracts and address any noncompliance issues.
The total cost of the Year 2000 systems assessments and
conversions is funded through operating cash flows and the
Company is expensing these costs as they are incurred. The
Company has created a mechanism to trace costs directly
related to the Year 2000 issue and has budgeted funds to
address the issues of assessment and conversion. The financial
impact of making the required systems changes cannot be
known precisely at this time, but it is currently expected to be
less than $10.0 million. The actual financial impact could, how-
ever, exceed this estimate.
Liquidity: The Company believes that its cash, cash equiva-
lents and short-term investments, together with funds provid-
ed by operations and leasing arrangements, will be sufficient
to meet its foreseeable operating cash requirements. In addi-
tion, the Company believes it could access additional funds
from the capital and debt markets. Factors affecting the
Company’s cash position include, but are not limited to, future
levels of the Company’s product sales, royalty and contract
revenues, expenses, in-licensing activities, including the timing
and amount of related development funding or milestone pay-
ments, and capital expenditures.
Roche Holdings, Inc.: At December 31, 1998, Roche held
approximately 65.3% of the Company’s outstanding common
equity. The Company expects to continue to have material
transactions with Roche, including royalty and contract rev-
enues, product sales and joint product development costs. See
also Relationship with Roche Holdings, Inc. note in Notes toConsolidated Financial Statements for a discussion of the
terms of the put and call pursuant to the Agreement.
Market Risk: The Company is exposed to market risk, includ-
ing changes to interest rates, foreign currency exchange rates
and equity investment prices. To reduce the volatility relating
to these exposures, the Company enters into various derivative
investment transactions pursuant to the Company’s invest-
ment and risk management policies and procedures in areas
such as hedging and counterparty exposure practices. The
Company does not use derivatives for speculative purposes.
A discussion of the Company’s accounting policies for
financial instruments and further disclosures relating to finan-
cial instruments is included in the Description of Business andSignificant Accounting Policies and the Financial Instrumentsnotes in the Notes to Consolidated Financial Statements.
The Company maintains risk management control systems
to monitor the risks associated with interest rates, foreign cur-
rency exchange rates and equity investment price changes,
and its derivative and financial instrument positions. The risk
management control systems use analytical techniques,
including sensitivity analysis and market values. Though the
Company intends for its risk management control systems to
be comprehensive, there are inherent risks which may only be
partially offset by the Company’s hedging programs should
there be unfavorable movements in interest rates, foreign cur-
rency exchange rates or equity investment prices.
The estimated exposures discussed below are intended to
measure the maximum amount the Company could lose from
adverse market movements in interest rates, foreign currency
exchange rates and equity investment prices, given a specified
confidence level, over a given period of time. Loss is defined in
the value at risk estimation as fair market value loss. The expo-
sures to interest rate, foreign currency exchange rate and
equity investment price changes are calculated based on pro-
prietary modeling techniques from a Monte Carlo simulation
value at risk model (value at risk model) using a 30-day hold-
ing period and a 95% confidence level. The value at risk model
assumes non-linear financial returns and generates potential
paths various market prices could take and tracks the hypo-
thetical performance of a portfolio under each scenario to
approximate its financial return. The value at risk model takes
into account correlations and diversification across market
factors, including interest rates, foreign currencies and equity
prices. Market volatilities and correlations are based on JP
Morgan Riskmetrics™ dataset as of December 31, 1998.
The Company evaluates this potential value at risk
throughout the year. During 1998, there were no significant
changes in the estimated exposures to market risk from those
disclosed as of December 31, 1997.
Interest Rates — The Company’s interest income is sensitive
to changes in the general level of interest rates, primarily U.S.
interest rates. In this regard, changes in U.S. interest rates affect
the interest earned on the Company’s cash equivalents, short-
term investments, convertible preferred stock investments,
convertible loans and long-term investments. To mitigate the
impact of fluctuations in U.S. interest rates, the Company may
enter into swap transactions, which involve the receipt of fixed
rate interest and the payment of floating rate interest without the
exchange of the underlying principal. By investing the Company’s
cash in an amount equal to the notional amount of the swap
contract, with a maturity date equal to the maturity date of the
floating rate obligation, the Company hedges itself from any
potential earnings impact due to changes in interest rates.
3938
Financial Review(continued)

Based on the Company’s overall interest rate exposure at
December 31, 1998, including derivative and other interest rate
sensitive instruments, a near-term change in interest rates,
within a 95% confidence level based on historical interest rate
movements, would not materially affect the fair value of inter-
est rate sensitive instruments.
Foreign Currency Exchange Rates — The Company receives
royalty revenues from licensees selling products in countries
throughout the world. As a result, the Company’s financial results
could be significantly affected by factors such as changes in
foreign currency exchange rates or weak economic conditions in
the foreign markets in which the Company’s licensed products are
sold. The Company is exposed to changes in exchange rates in
Europe, Asia (primarily Japan) and Canada. The Company’s expo-
sure to foreign exchange rates primarily exists with the Euro.
When the U.S. dollar strengthens against the currencies in these
countries, the U.S. dollar value of non-U.S. dollar-based revenue
decreases; when the U.S. dollar weakens, the U.S. dollar value of the
non-U.S. dollar-based revenues increases. Accordingly, changes in
exchange rates, and in particular a strengthening of the U.S. dollar,
may adversely affect the Company’s royalty revenues as expressed
in U.S. dollars. In addition, as part of its overall investment strategy,
the Company has a portion of its portfolio primarily in nondollar
denominated investments. As a result, the Company is exposed
to changes in the exchange rates of the countries in which these
nondollar denominated investments are made.
To mitigate this risk, the Company hedges certain of its
anticipated revenues by purchasing option contracts with expi-
ration dates and amounts of currency that are based on 25%
to 90% of probable future revenues so that the potential
adverse impact of movements in currency exchange rates on
the nondollar denominated revenues will be at least partly off-
set by an associated increase in the value of the option. The
duration of these options is generally one to four years. The
Company may also enter into foreign currency forward con-
tracts (forward contracts) to lock in the dollar value of a por-
tion of these anticipated revenues. The duration of these for-
ward contracts is generally less than one year. Also, to hedge
the nondollar denominated investments in the portfolio, the
Company also enters into forward contracts.
Based on the Company’s overall currency rate exposure at
December 31, 1998, including derivative and other foreign cur-
rency sensitive instruments, a near-term change in currency
rates within a 95% confidence level based on historical cur-
rency rate movements, would not materially affect the fair
value of foreign currency sensitive instruments.
Equity Investment Securities — As part of its strategic alliance
efforts, the Company invests in equity instruments of biotech-
nology companies that are subject to fluctuations from market
value changes in stock prices. To mitigate this risk, certain equity
securities are hedged with costless collars. A costless collar is a
purchased put option and a written call option in which the cost
of the purchased put and the proceeds of the written call offset
each other; therefore, there is no initial cost or cash outflow for
these instruments at the time of purchase. The purchased put
protects the Company from a decline in the market value of the
security below a certain minimum level (the put “strike” level),
while the call effectively limits the Company’s potential to bene-
fit from an increase in the market value of the security above a
certain maximum level (the call “strike” level). In addition, as part
of its strategic alliance efforts, the Company holds dividend bear-
ing convertible preferred stock and has made interest bearing
loans that are convertible into the equity securities of the debtor.
Based on the Company’s overall exposure to fluctuations
from market value changes in marketable equity prices at
December 31, 1998, a near-term change in equity prices within
a 95% confidence level based on historic volatilities could
result in a potential loss in fair value of the equity securities
portfolio of $10.6 million.
Credit Risk of Counterparties: The Company could be
exposed to losses related to the above financial instruments
should one of its counterparties default. This risk is mitigated
through credit monitoring procedures.
New Accounting Standard: In June 1998, the Financial
Accounting Standards Board issued Statement of Financial
Accounting Standards (FAS) 133, “Accounting for Derivative
Instruments and Hedging Activities,” effective beginning in the
first quarter of 2000. FAS 133 establishes accounting and
reporting standards for derivative instruments, including cer-
tain derivative instruments embedded in other contracts, and
for hedging activities. It requires companies to recognize all
derivatives as either assets or liabilities on the balance sheet
and measure those instruments at fair value. Gains or losses
resulting from changes in the values of those derivatives
would be accounted for depending on the use of the derivative
and whether it qualifies for hedge accounting under FAS 133.
Based on the requirements of FAS 133, there may be changes to
the balance sheet and reported assets and liabilities. The
Company is currently evaluating the impact of FAS 133 on its
financial position and results of operations.
Legal Proceedings: The Company is a party to various legal
proceedings including patent infringement cases and other
matters. See the Leases, Commitments and Contingencies note
in the Notes to Consolidated Financial Statements for further
information.
Genentech, Inc. is responsible for the preparation, integrity and fair presentation of its published financial statements. The
Company has prepared the financial statements in accordance with generally accepted accounting principles. As such, the state-
ments include amounts based on judgments and estimates made by management. The Company also prepared the other informa-
tion included in the annual report and is responsible for its accuracy and consistency with the financial statements.
The financial statements have been audited by the independent auditing firm, Ernst & Young LLP, which was given unrestrict-
ed access to all financial records and related data, including minutes of all meetings of stockholders, the Board of Directors and
committees of the Board. The Company believes that all representations made to the independent auditors during their audit were
valid and appropriate. Ernst & Young LLP’s audit report is included in this Annual Report.
Systems of internal accounting controls, applied by operating and financial management, are designed to provide reasonable
assurance as to the integrity and reliability of the financial statements and reasonable, but not absolute, assurance that assets are
safeguarded from unauthorized use or disposition, and that transactions are recorded according to management’s policies and
procedures. The Company continually reviews and modifies these systems, where appropriate, to maintain such assurance. Through
the Company’s general audit activities, the adequacy and effectiveness of the systems and controls are reviewed and the result-
ant findings are communicated to management and the Audit Committee of the Board of Directors.
The selection of Ernst & Young LLP as the Company’s independent auditors has been approved by the Company’s Board of
Directors and ratified by the stockholders. The Audit Committee of the Board of Directors is composed of four non-management
directors who meet regularly with management, the independent auditors and the general auditor, jointly and separately, to review
the adequacy of internal accounting controls and auditing and financial reporting matters to ascertain that each is properly dis-
charging its responsibilities.
Arthur D. Levinson, Ph.D. Louis J. Lavigne, Jr. Bradford S. Goodwin
President and Executive Vice President Vice President -
Chief Executive Officer and Chief Financial Officer Finance
4140
Financial Review(continued)
Report of Management
/s/ Arthur D. Levinson /s/ Louis J. Lavigne, Jr. /s/ Bradford S. Goodwin

4342
Consolidated Statements of Income(thousands, except per share amounts)
Year ended December 31 1998 1997 1996
Revenues
Product sales (including amounts fromrelated parties: 1998—$28,738; 1997—$17,396;1996—$13,216) $ 7 17,795 $ 584,889 $ 582,829
Royalties (including amounts fromrelated parties: 1998—$35,028; 1997—$25,362;1996—$26,240) 229,589 241 ,1 1 2 214,702
Contract and other (including amounts fromrelated parties: 1998—$61,583; 1997—$67,596;1996—$95,299) 1 14,795 12 1 ,587 107,037
Interest 88,764 69,160 64,1 10
Total revenues 1,150,943 1,016,748 968,678
Costs and expenses
Cost of sales (including amounts fromrelated parties: 1998—$23,155; 1997—$14,348;1996—$10,900) 138,623 102,536 104,527
Research and development (includingcontract related: 1998—$27,660; 1997—$67,596;1996—$50,586) 396,1 86 470,923 471 ,143
Marketing, general and administrative 358,93 1 269,852 240,063
Interest 4,552 3,642 5,010
Total costs and expenses 898,292 846,953 820,743
Income before taxes 252,651 169,795 147,935
Income tax provision 70,742 40,751 29,587
Net income $ 181,909 $ 129,044 $ 1 18,348
Earnings per share:
Basic $ 1.45 $ 1.05 $ 0.98
Diluted $ 1.40 $ 1.02 $ 0.95
Weighted average shares used to computediluted earnings per share 129,872 126,397 123,969
See Notes to Consolidated Financial Statements.
Consolidated Statements of Cash Flows(thousands)
Increase (Decrease) in Cash and Cash Equivalents
Year ended December 31 1998 1997 1996
Cash flows from operating activities:
Net income $ 181,909 $ 129,044 $ 1 18,348
Adjustments to reconcile net income tonet cash provided by operating activities:
Depreciation and amortization 78, 1 0 1 65,533 62, 124
Deferred income taxes 29,792 19,660 (34,021)
Gain on sales of securities available-for-sale (9,542) (13,203) (1,010)
Loss on sales of securities available-for-sale 1,809 2,096 663
Write-down of nonmarketable securities 16,689 — —
Write-down of securities available-for-sale 20,249 4,000 —
Loss on fixed asset dispositions 1,015 318 5,309
Changes in assets and liabilities:
Net cash flow from trading securities 12,725 (109,132) (8,184)
Receivables and other current assets 33,767 1 1 ,194 (30,416)
Inventories (32,600) (24,083) 1 ,705
Accounts payable, other current liabilitiesand other long-term liabilities 15,937 32,897 25,153
Net cash provided by operating activities 349,851 1 18,324 139,67 1
Cash flows from investing activities:
Purchases of securities held-to-maturity (327,690) (304,932) (634,124)
Proceeds from maturities of securitiesheld-to-maturity 410,729 455,317 772,922
Purchases of securities available-for-sale (800,788) (512,727) (304,806)
Proceeds from sales of securities available-for-sale 430,936 410,395 182,564
Purchases of nonmarketable equity securities (29,044) — (9,323)
Capital expenditures (88,088) (154,902) (141,837)
Change in other assets (17, 151 ) (61,529) (7,046)
Net cash used in investing activities (421,096) (168,378) (141,650)
Cash flows from financing activities:
Stock issuances 107,938 87,259 72,558
Reduction in long-term debt,including current portion — — (358)
Net cash provided by financing activities 107,938 87,259 72,200
Increase in cash and cash equivalents 36,693 37,205 70,221
Cash and cash equivalents at beginning of year 244,469 207,264 137,043
Cash and cash equivalents at end of year $ 281,162 $ 244,469 $ 207,264
Supplemental cash flow data:
Cash paid during the year for:
Interest, net of portion capitalized $ 4,552 $ 3,642 $ 5,010
Income taxes 26,189 15,474 52,243
See Notes to Consolidated Financial Statements.

4544
Consolidated Statements of Stockholders’ Equity(thousands)
Special Special Additional Accumulated OtherCommon Common Common Common Paid-in Retained Comprehensive TotalShares Shares Stock Stock Capital Earnings Income
BalanceDecember 31, 1995 42,647 76,621 $ 853 $ 1,532 $ 1,281,640 $ 263,749 $ 54,273 $ 1,602,047
Comprehensive income:Net income 1 18,348 1 18,348
Net unrealized (loss) onsecurities available-for-sale (324) (324)
Comprehensive income 1 18,024
Issuance of stockupon exercise ofoptions and warrants 1,738 35 55,1 03 55, 138
Issuance of stock underemployee stock plan 421 8 17,412 17,420
Income tax benefitsrealized from employeestock option exercises 8,430 8,430
BalanceDecember 31, 1996 44,806 76,621 $ 896 $ 1,532 $ 1,362,585 $ 382,097 $ 53,949 $ 1,801,059
Comprehensive income:Net income 129,044 129,044
Net unrealized (loss) onsecurities available-for-sale (117) (1 17)
Comprehensive income 128,927
Issuance of stockupon exercise ofoptions and warrants 2,350 47 68,346 68,393
Issuance of stock underemployee stock plan 45 1 9 18,857 18,866
Income tax benefitsrealized from employeestock option exercises 13,980 13,980
BalanceDecember 31, 1997 47,607 76,621 $ 952 $ 1,532 $ 1,463,768 $ 51 1 , 14 1 $ 53,832 $ 2,031 ,225
Comprehensive income:Net income 181,909 181 ,909
Net unrealized gain onsecurities available-for-sale 5,431 5,431
Comprehensive income 187,340
Issuance of stockupon exercise ofoptions and warrants 2,460 49 86,835 86,884
Issuance of stock underemployee stock plan 427 9 21,055 21 ,064
Income tax benefitsrealized from employeestock option exercises 17,332 1 7,332
BalanceDecember 31, 1998 50,494 76,621 $ 1,010 $ 1,532 $ 1,588,990 $ 693,050 $ 59,263 $ 2,343,845
See Notes to Consolidated Financial Statements.
Consolidated Balance Sheets(dollars in thousands, except par value)
December 31 1998 1997
Assets:
Current assets:
Cash and cash equivalents $ 281 ,162 $ 244,469
Short-term investments 606,544 588,853
Accounts receivable — trade(net of allowances of: 1998—$14,661; 1997—$8,826) 79, 4 1 1 71 ,415
Accounts receivable — other(net of allowances of: 1998—$2,757; 1997—$5,709) 47,480 73,444
Accounts receivable — related party 22,850 44,386
Inventories 148,626 1 16,026
Prepaid expenses and other current assets 55,885 55,325
Total current assets 1,241,958 1 ,193,9 18
Long-term marketable securities 716,888 453,188
Property, plant and equipment, net 700,249 683,304
Other assets 1 96,307 177,202
Total assets $ 2,855,402 $ 2,507,612
Liabilities and stockholders’ equity:
Current liabilities:
Accounts payable $ 40,895 $ 48,992
Income taxes payable 46,447 40,293
Accrued liabilities — related party 10,945 15,427
Other accrued liabilities 193,040 184,845
Total current liabilities 291,327 289,557
Long-term debt 149,990 150,000
Other long-term liabilities 70,240 36,830
Total liabilities 51 1 , 557 476,387
Commitments and contingencies
Stockholders’ equity:
Preferred stock, $0.02 par value; authorized: 100,000,000 shares; none issued — —
Special common stock, $0.02 par value; authorized:100,000,000 shares; outstanding: 1998—50,493,631 ; 1997—47,606,785 1 ,010 952
Common stock, $0.02 par value; authorized: 200,000,000 shares; outstanding: 1998 and 1997—76,621,009 1,532 1 ,532
Additional paid-in capital 1,588,990 1 ,463,768
Retained earnings 693,050 51 1 , 1 4 1
Accumulated other comprehensive income 59,263 53,832
Total stockholders’ equity 2,343,845 2,031,225
Total liabilities and stockholders’ equity $ 2,855,402 $ 2,507,612
See Notes to Consolidated Financial Statements.
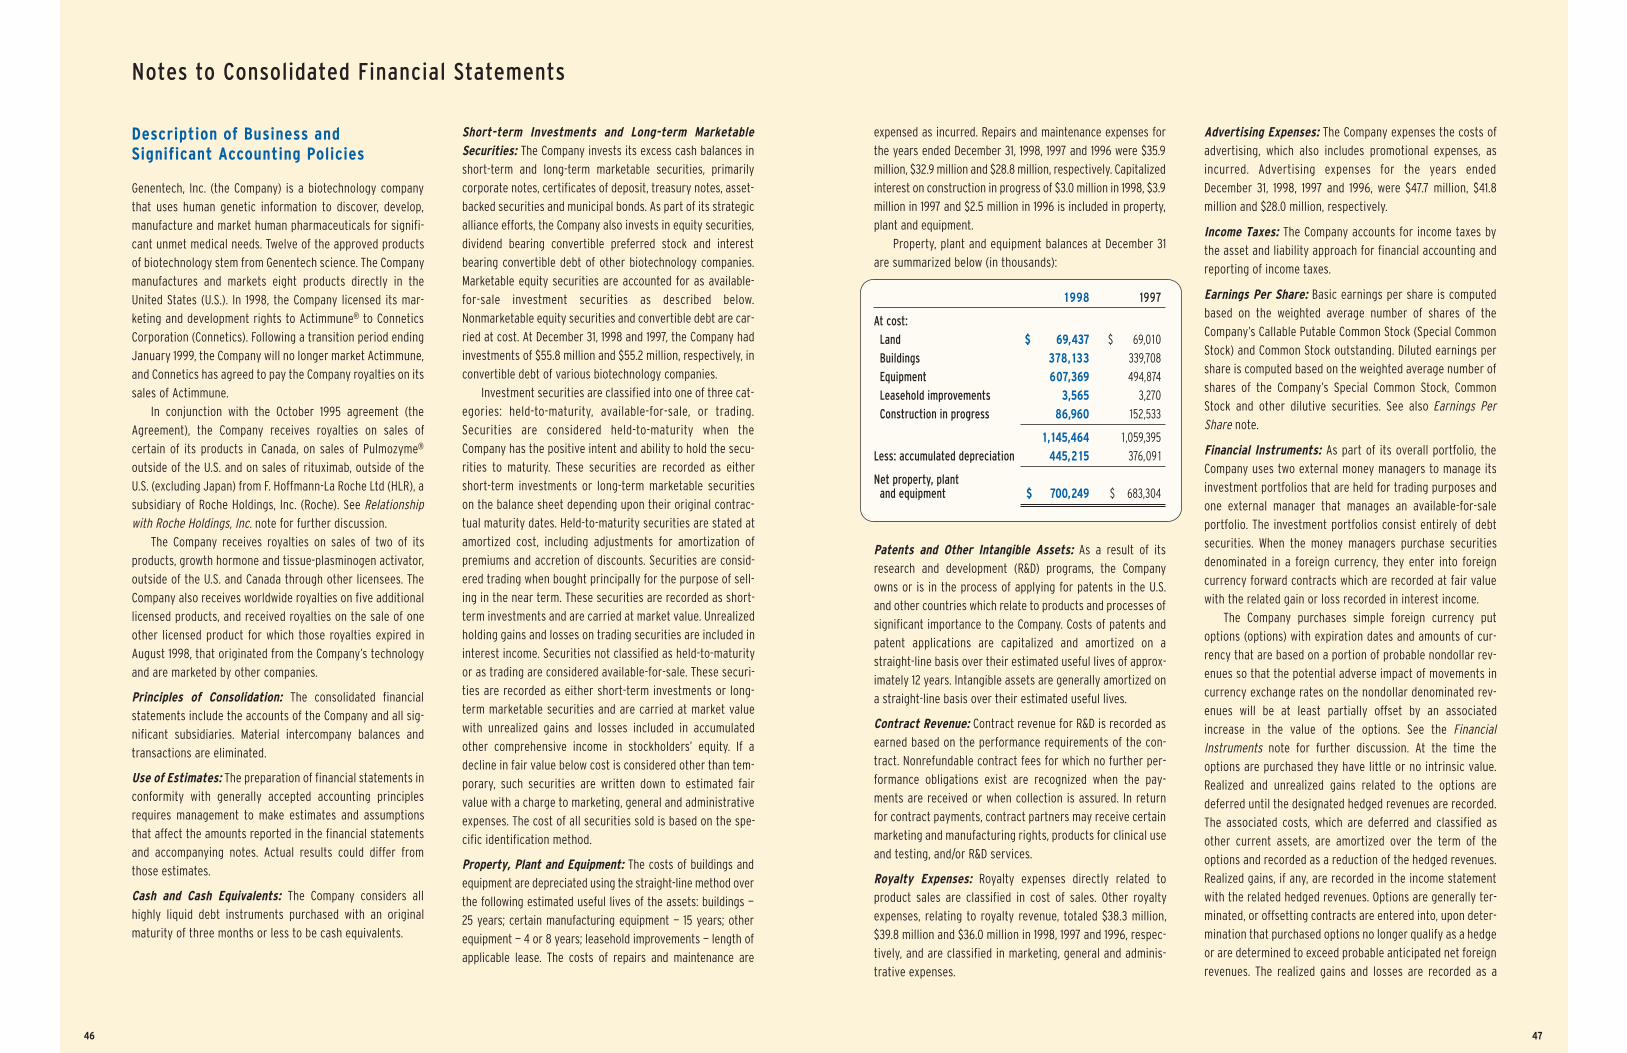
Description of Business andSignificant Accounting Policies
Genentech, Inc. (the Company) is a biotechnology company
that uses human genetic information to discover, develop,
manufacture and market human pharmaceuticals for signifi-
cant unmet medical needs. Twelve of the approved products
of biotechnology stem from Genentech science. The Company
manufactures and markets eight products directly in the
United States (U.S.). In 1998, the Company licensed its mar-
keting and development rights to Actimmune® to Connetics
Corporation (Connetics). Following a transition period ending
January 1999, the Company will no longer market Actimmune,
and Connetics has agreed to pay the Company royalties on its
sales of Actimmune.
In conjunction with the October 1995 agreement (the
Agreement), the Company receives royalties on sales of
certain of its products in Canada, on sales of Pulmozyme®
outside of the U.S. and on sales of rituximab, outside of the
U.S. (excluding Japan) from F. Hoffmann-La Roche Ltd (HLR), a
subsidiary of Roche Holdings, Inc. (Roche). See Relationshipwith Roche Holdings, Inc. note for further discussion.
The Company receives royalties on sales of two of its
products, growth hormone and tissue-plasminogen activator,
outside of the U.S. and Canada through other licensees. The
Company also receives worldwide royalties on five additional
licensed products, and received royalties on the sale of one
other licensed product for which those royalties expired in
August 1998, that originated from the Company’s technology
and are marketed by other companies.
Principles of Consolidation: The consolidated financial
statements include the accounts of the Company and all sig-
nificant subsidiaries. Material intercompany balances and
transactions are eliminated.
Use of Estimates: The preparation of financial statements in
conformity with generally accepted accounting principles
requires management to make estimates and assumptions
that affect the amounts reported in the financial statements
and accompanying notes. Actual results could differ from
those estimates.
Cash and Cash Equivalents: The Company considers all
highly liquid debt instruments purchased with an original
maturity of three months or less to be cash equivalents.
Short-term Investments and Long-term MarketableSecurities: The Company invests its excess cash balances in
short-term and long-term marketable securities, primarily
corporate notes, certificates of deposit, treasury notes, asset-
backed securities and municipal bonds. As part of its strategic
alliance efforts, the Company also invests in equity securities,
dividend bearing convertible preferred stock and interest
bearing convertible debt of other biotechnology companies.
Marketable equity securities are accounted for as available-
for-sale investment securities as described below.
Nonmarketable equity securities and convertible debt are car-
ried at cost. At December 31, 1998 and 1997, the Company had
investments of $55.8 million and $55.2 million, respectively, in
convertible debt of various biotechnology companies.
Investment securities are classified into one of three cat-
egories: held-to-maturity, available-for-sale, or trading.
Securities are considered held-to-maturity when the
Company has the positive intent and ability to hold the secu-
rities to maturity. These securities are recorded as either
short-term investments or long-term marketable securities
on the balance sheet depending upon their original contrac-
tual maturity dates. Held-to-maturity securities are stated at
amortized cost, including adjustments for amortization of
premiums and accretion of discounts. Securities are consid-
ered trading when bought principally for the purpose of sell-
ing in the near term. These securities are recorded as short-
term investments and are carried at market value. Unrealized
holding gains and losses on trading securities are included in
interest income. Securities not classified as held-to-maturity
or as trading are considered available-for-sale. These securi-
ties are recorded as either short-term investments or long-
term marketable securities and are carried at market value
with unrealized gains and losses included in accumulated
other comprehensive income in stockholders’ equity. If a
decline in fair value below cost is considered other than tem-
porary, such securities are written down to estimated fair
value with a charge to marketing, general and administrative
expenses. The cost of all securities sold is based on the spe-
cific identification method.
Property, Plant and Equipment: The costs of buildings and
equipment are depreciated using the straight-line method over
the following estimated useful lives of the assets: buildings —
25 years; certain manufacturing equipment — 15 years; other
equipment — 4 or 8 years; leasehold improvements — length of
applicable lease. The costs of repairs and maintenance are
4746
expensed as incurred. Repairs and maintenance expenses for
the years ended December 31, 1998, 1997 and 1996 were $35.9
million, $32.9 million and $28.8 million, respectively. Capitalized
interest on construction in progress of $3.0 million in 1998, $3.9
million in 1997 and $2.5 million in 1996 is included in property,
plant and equipment.
Property, plant and equipment balances at December 31
are summarized below (in thousands):
1998 1997
At cost:
Land $ 69,437 $ 69,010
Buildings 378, 133 339,708
Equipment 607,369 494,874
Leasehold improvements 3,565 3,270
Construction in progress 86,960 152,533
1,145,464 1,059,395
Less: accumulated depreciation 445,215 376,09 1
Net property, plantand equipment $ 700,249 $ 683,304
Patents and Other Intangible Assets: As a result of its
research and development (R&D) programs, the Company
owns or is in the process of applying for patents in the U.S.
and other countries which relate to products and processes of
significant importance to the Company. Costs of patents and
patent applications are capitalized and amortized on a
straight-line basis over their estimated useful lives of approx-
imately 12 years. Intangible assets are generally amortized on
a straight-line basis over their estimated useful lives.
Contract Revenue: Contract revenue for R&D is recorded as
earned based on the performance requirements of the con-
tract. Nonrefundable contract fees for which no further per-
formance obligations exist are recognized when the pay-
ments are received or when collection is assured. In return
for contract payments, contract partners may receive certain
marketing and manufacturing rights, products for clinical use
and testing, and/or R&D services.
Royalty Expenses: Royalty expenses directly related to
product sales are classified in cost of sales. Other royalty
expenses, relating to royalty revenue, totaled $38.3 million,
$39.8 million and $36.0 million in 1998, 1997 and 1996, respec-
tively, and are classified in marketing, general and adminis-
trative expenses.
Advertising Expenses: The Company expenses the costs of
advertising, which also includes promotional expenses, as
incurred. Advertising expenses for the years ended
December 31, 1998, 1997 and 1996, were $47.7 million, $41.8
million and $28.0 million, respectively.
Income Taxes: The Company accounts for income taxes by
the asset and liability approach for financial accounting and
reporting of income taxes.
Earnings Per Share: Basic earnings per share is computed
based on the weighted average number of shares of the
Company’s Callable Putable Common Stock (Special Common
Stock) and Common Stock outstanding. Diluted earnings per
share is computed based on the weighted average number of
shares of the Company’s Special Common Stock, Common
Stock and other dilutive securities. See also Earnings PerShare note.
Financial Instruments: As part of its overall portfolio, the
Company uses two external money managers to manage its
investment portfolios that are held for trading purposes and
one external manager that manages an available-for-sale
portfolio. The investment portfolios consist entirely of debt
securities. When the money managers purchase securities
denominated in a foreign currency, they enter into foreign
currency forward contracts which are recorded at fair value
with the related gain or loss recorded in interest income.
The Company purchases simple foreign currency put
options (options) with expiration dates and amounts of cur-
rency that are based on a portion of probable nondollar rev-
enues so that the potential adverse impact of movements in
currency exchange rates on the nondollar denominated rev-
enues will be at least partially offset by an associated
increase in the value of the options. See the FinancialInstruments note for further discussion. At the time the
options are purchased they have little or no intrinsic value.
Realized and unrealized gains related to the options are
deferred until the designated hedged revenues are recorded.
The associated costs, which are deferred and classified as
other current assets, are amortized over the term of the
options and recorded as a reduction of the hedged revenues.
Realized gains, if any, are recorded in the income statement
with the related hedged revenues. Options are generally ter-
minated, or offsetting contracts are entered into, upon deter-
mination that purchased options no longer qualify as a hedge
or are determined to exceed probable anticipated net foreign
revenues. The realized gains and losses are recorded as a
Notes to Consolidated Financial Statements

component of other revenues. For early termination of
options that qualify as hedges, the gain or loss on termina-
tion will be deferred through the original term of the option
and then recognized as a component of the hedged revenues.
Changes in the fair value of hedging instruments that qualify
as a hedge are not recognized and changes in the fair value
of instruments that do not qualify as a hedge would be rec-
ognized in other revenues.
The Company may also enter into foreign currency for-
ward contracts (forward contracts) as hedging instruments.
Forward contracts are recorded at fair value, and any gains
and losses from these forward contracts are recorded in the
income statement with the related hedged revenues.
Financial instruments, such as forward contracts, not qualify-
ing as hedges under generally accepted accounting princi-
ples are marked to market with gains or losses recorded in
other revenues if they occur.
Interest rate swaps (swaps) have been used and may be
used in the future to adjust the duration of the investment
portfolio in order to meet duration targets. Interest rate swaps
are contracts in which two parties agree to swap future
streams of payments over a specified period. See the FinancialInstruments note for further discussion. The accrued net set-
tlement amounts on swaps are reflected on the balance sheet
as other accounts receivable or other accrued liabilities. Net
payments made or received on swaps are included in interest
income as adjustments to the interest received on invested
cash. Amounts deferred on terminated swaps are classified as
other assets and are amortized to interest income over the
original contractual term of the swaps by a method that
approximates the level-yield method. For early termination of
swaps where the underlying asset is not sold, the amount of
the terminated swap is deferred and amortized over the
remaining life of the original swap. For early termination of
swaps with the corresponding termination or sale of the under-
lying asset, the amounts are recognized through interest
income. Changes in the fair value of swap hedging instruments
that qualify as a hedge are not recognized and changes in the
fair value of swap instruments that do not qualify as a hedge
would be recognized in other income.
The Company’s marketable equity portfolio consists pri-
marily of investments in biotechnology companies whose
risk of market fluctuations is greater than the stock market
in general. To manage a portion of this risk, the Company
enters into certain costless collar instruments to hedge cer-
tain equity securities against changes in market value. See
the Financial Instruments note for further discussion. Gains
and losses on these instruments are recorded as an adjust-
ment to unrealized gains and losses on marketable securities
with a corresponding receivable or payable recorded in
short-term or long-term other assets or liabilities. Equity col-
lar instruments that do not qualify for hedge accounting and
early termination of these instruments with the sale of the
underlying security would be recognized through earnings.
For early termination of these instruments without the sale
of the underlying security, the time value would be recog-
nized through earnings and the intrinsic value will adjust the
cost basis of the underlying security.
401(k) Plan: The Company’s 401(k) Plan (Plan) covers sub-
stantially all of its employees. Under the Plan, eligible
employees may contribute up to 15% of their eligible com-
pensation, subject to certain Internal Revenue Service
restrictions. The Company matches a portion of employee
contributions, up to a maximum of 4% of each employee’s
eligible compensation. The match is effective December 31
of each year and is fully vested when made. During 1998,
1997 and 1996, the Company provided $7.3 million, $6.7 million
and $6.1 million, respectively, for the Company match under
the Plan.
Comprehensive Income: The Company adopted Statement
of Financial Accounting Standards (FAS) 130, “Reporting
Comprehensive Income,” at December 31, 1998. Under FAS
130, the Company is required to display comprehensive
income and its components as part of the Company’s full set
of financial statements. The measurement and presentation
of net income did not change. Comprehensive income is
comprised of net income and other comprehensive income.
Other comprehensive income includes certain changes in
equity of the Company that are excluded from net income.
Specifically, FAS 130 requires unrealized holding gains and
losses on the Company’s available-for-sale securities, which
were reported separately in stockholders’ equity, to be
included in accumulated other comprehensive income.
Comprehensive income for years ended December 31, 1998,
1997 and 1996 has been reflected in the ConsolidatedStatements of Stockholders’ Equity.
New Accounting Standard: In June 1998, the Financial
Accounting Standards Board issued FAS 133, “Accounting for
Derivative Instruments and Hedging Activities,” effective
beginning in the first quarter of 2000. FAS 133 establishes
accounting and reporting standards for derivative instru-
ments, including certain derivative instruments embedded
in other contracts, and for hedging activities. It requires
4948
companies to recognize all derivatives as either assets or lia-
bilities on the balance sheet and measure those instruments
at fair value. Gains or losses resulting from changes in the
values of those derivatives would be accounted for depend-
ing on the use of the derivative and whether it qualifies for
hedge accounting under FAS 133. The Company is currently
evaluating the impact of FAS 133 on its financial position and
results of operations.
Inventories: Inventories are stated at the lower of cost or
market. Cost is determined using a weighted-average
approach which approximates the first-in first-out method.
Inventories at December 31, 1998 and 1997 are summarized
below (in thousands):
1998 1997
Raw materials and supplies $ 21,414 $ 1 7,544
Work in process 106,383 84, 83 1
Finished goods 20,829 1 3,65 1
Total inventories $ 148,626 $ 1 16 ,026
Reclassifications: Certain reclassifications of prior year
amounts have been made to conform with the current year
presentation.
Segment, Significant Customer andGeographic Information
The Company adopted FAS 131, “Disclosure about Segments of
an Enterprise and Related Information,” at December 31, 1998.
FAS 131 establishes annual and interim reporting standards
for an enterprise’s operating segments and related disclo-
sures about its products, services, geographic areas and
major customers. Under FAS 131, the Company’s operations
are treated as one operating segment as it only reports prof-
it and loss information on an aggregate basis to chief oper-
ating decision makers of the Company. Information about the
Company’s product sales and major customers are as follows
(in millions):
Product Sales
1998 1997 1996
Herceptin $ 30.5 — —
Rituxan 162.6 $ 5.5 —
Activase 213.0 260.7 $ 284. 1
Growth hormone (Protropin,Nutropin and Nutropin AQ) 214.0 223.6 218.2
Pulmozyme 93.8 91.6 76.0
Actimmune 3.9 3.5 4.5
Total product sales $ 717.8 $ 584.9 $ 582.8
HLR contributed approximately 11% of the Company’s
total revenues in 1998, 11% in 1997 and 14% in 1996. See the
Related Party Transactions note below for further informa-
tion. Three other major customers, Caremark, Inc., Bergen
Brunswig, and Cardinal Distribution, Inc., each contributed
10% or more of the Company’s total revenues in at least one
of the last three years. Caremark, Inc., a national distributor,
which accounted for 10%, 14% and 15% of total revenues in
1998, 1997 and 1996, respectively, distributes the Company’s
growth hormone products, Pulmozyme and Actimmune
through its extensive branch network and is then reimbursed
through a variety of sources. Bergen Brunswig, a national
wholesale distributor of all of the Company’s products, con-
tributed 11% in 1998 and 10% in 1997 and 1996. Cardinal
Distribution, Inc., a national wholesaler distributor of all the
Company’s products, contributed 11% in 1998.
Notes to Consolidated Financial Statements(continued)

5150
The components of deferred taxes consist of the follow-
ing at December 31 (in thousands):
1998 1997
Deferred tax liabilities:
Depreciation $ 66,47 1 $ 55,137
Unrealized gain on securitiesavailable-for-sale 30,617 25,086
Other 20,016 2 , 1 73
Total deferred tax liabilities 1 17,104 82,396
Deferred tax assets:
Capitalized R&D costs 42,317 33,950
Federal credit carryforwards 86,725 100,400
Expenses not currentlydeductible 56,699 35,000
State credit carryforwards 30,632 28,365
Other 4,992 4,398
Total deferred tax assets 221,365 202, 1 13
Valuation allowance (62,844) (48,508)
Total net deferred tax assets 158,521 153,605
Total net deferred taxes $ 41,417 $ 71,209
Total tax credit carryforwards of $117.4 million expire in
the years 1999 through 2012, except for $43.0 million of alter-
native minimum tax credits which have no expiration date.
The valuation allowance at December 31, 1998, reflected above
relates to the tax benefits of stock option deductions which
will be credited to additional paid-in-capital when realized.
The valuation allowance increased by $14.3 million and
$12.7 million in 1998 and 1997, respectively, and decreased by
$17.0 million in 1996. Realization of net deferred taxes depends
on future earnings from existing and new products and new
indications for existing products. The timing and amount of
future earnings will depend on continued success in market-
ing and sales of the Company’s current products, as well as
the scientific success, results of clinical trials, availability of
third party reimbursement for therapies and regulatory
approval of products under development.
Earnings Per Share
The following is a reconciliation of the numerator and
denominators of the basic and diluted EPS computations
for the years ended December 31, 1998, 1997 and 1996 (in
thousands):
1998 1997 1996
Numerator:
Net income —numerator for basicand diluted EPS: $ 181,909 $ 129,044 $ 1 18,348
Denominator:
Denominator forbasic EPS—weighted-average shares 125,767 123,042 120,623
Effect of dilutivesecurities:
Stock options 4,105 3,355 3,325
Warrants — — 21
Denominator fordiluted EPS—adjustedweighted-averageshares and assumedconversions 129,872 126,397 123,969
Options to purchase 178,575 shares of the Company’s
Special Common Stock ranging from $70.50 to $71.13 per share,
103,700 shares of Special Common Stock at $59.00 per share
and 5,251,665 shares of Special Common Stock at $54.25 per
share were outstanding during 1998, 1997 and 1996, respec-
tively, but were not included in the computation of diluted
earnings per share. These options’ exercise price was greater
than the average market price of the Special Common Stock
and therefore, the effect would be anti-dilutive. See CapitalStock note for information on option expiration dates.
During 1998, 1997 and 1996, the Company had convertible
subordinated debentures which were convertible to 1,013,447,
1,013,514 and 1,013,514 shares, respectively, of Special Common
Stock, but were not included in the computation of diluted
earnings per share because they were anti-dilutive. See the
Long-term Debt note for additional information on the con-
vertible subordinated debentures.
Approximate foreign sources of revenues were as follows
(in millions):
1998 1997 1996
Europe $ 171.0 $ 139.5 $ 146.4
Asia (primarily Japan) 16.9 34.2 17.8
Canada 11.7 1 1.7 1 1. 1
The Company currently sells primarily to distributors and
health care companies throughout the U.S., performs ongo-
ing credit evaluations of its customers’ financial condition
and extends credit generally without collateral. In 1998, 1997
and 1996, the Company did not record any material additions
to, or losses against, its provision for doubtful accounts.
Research and DevelopmentArrangements
To gain access to potential new products and technologies
and to utilize other companies to help develop the Company’s
potential new products, the Company has established strate-
gic alliances with various companies. These strategic alliances
include the acquisition of both marketable and nonmar-
ketable equity investments and convertible debt of companies
developing technologies that fall outside the Company’s
research focus and include companies having the potential to
generate new products through technology exchanges and
investments. Potential future payments may be due to certain
collaborative partners achieving certain benchmarks as
defined in the collaborative agreements. The Company has
also entered into product-specific collaborations to acquire
development and marketing rights for products.
In December 1997, the Company and Alteon, Inc. (Alteon)
entered into a collaborative agreement to develop and mar-
ket pimagedine, an advanced glycosylation end-product for-
mation inhibitor to treat kidney disease in diabetic patients.
Under the terms of the agreement, the Company licensed
pimagedine and second generation compounds from Alteon
and has made investments in Alteon stock of $37.5 million. In
1998, as a result of unsuccessful clinical trials with pimage-
dine and the decline in the value of the Company’s invest-
ment in Alteon, the Company wrote down $24.2 million of its
marketable and nonmarketable equity investments in
Alteon. The Company is in discussions with Alteon as to the
future direction of the collaboration.
Income Taxes
The income tax provision consists of the following amounts
(in thousands):
1998 1997 1996
Current:
Federal $ 39,945 $ 30,617 $ 61,502
State 1,004 432 2,1 04
Foreign — 2 2
Total current 40,949 31,051 63,608
Deferred:
Federal 29,006 23,799 (34,02 1)
State 787 (14,099) —
Total deferred 29,793 9,700 (34,02 1)
Total income taxprovision $ 70,742 $ 40,751 $ 29,587
Actual current tax liabilities are lower by $17.3 million,
$14.0 million and $8.4 million in 1998, 1997 and 1996, respec-
tively, due to employee stock option related tax benefits
which were credited to stockholders’ equity.
A reconciliation between the Company’s effective tax
rate and the U.S. statutory rate follows:
1998 Amount Tax Rate
(thousands) 1998 1997 1996
Tax at U.S.statutory rate $ 88,428 35.0% 35.0% 35.0%
R&D creditsrealized (11,919) (4.7) (1 1.4) (3.0 )
Tax benefit ofcertain realizedgains on securitiesavailable-for-sale (2,982) (1 .2) (3.8) —
Adjustment ofdeferred tax assetsvaluation allowance — — — (15.3 )
Foreign lossesrealized (10,500) (4.2) — (3.4)
State taxes 7,49 1 3.0 2.3 2 . 3
Other 224 0. 1 1.9 4 . 4
Income taxprovision $ 70,742 28.0% 24.0% 20.0%
Notes to Consolidated Financial Statements(continued)

5352
Gross Gross EstimatedAmortized Unrealized Unrealized Fair
December 31, 1998 Cost Gains Losses Value
(thousands)
Total TradingSecurities (carriedat estimated fair value) $ 236,330 $ 3,817 $ (246) $ 239,901
Securities Available-for-Sale (carriedat estimatedfair value):
Equity securities $ 42,024 $ 77,364 $ (1,042) $ 1 18,346
U.S. Treasurysecurities andobligations of otherU.S. governmentagencies maturing:
between 5-10 years 31,294 1,812 (74) 33,032
Corporate debtsecurities maturing:
within 1 year 251,238 233 (515) 250,956
between 1-5 years 309,762 3,525 (934) 312,353
between 5-10 years 149,410 6,603 (472) 155,541
Other debt securitiesmaturing:
between 1-5 years 70,768 172 (2,502) 68,438
between 5-10 years 19,836 267 — 20,103
greater than10 years 9,033 49 (7) 9,075
TotalAvailable-for-Sale $ 883,365 $90,025 $ (5,546) $ 967,844
Securities Held-to-Maturity (carriedat amortized cost):
Corporate debtsecurities maturing:
within 1 year $ 115,687 — $ (79) $ 1 15,608
TotalHeld-to-Maturity $ 115,687 — $ (79) $ 1 15,608
Gross Gross EstimatedAmortized Unrealized Unrealized Fair
December 31, 1997 Cost Gains Losses Value
(thousands)
Total TradingSecurities (carriedat estimated fair value) $ 256,428 $ 686 $ (4,487) $ 252,627
Securities Available-for-Sale (carriedat estimatedfair value):
Equity securities $ 46,262 $ 75,796 $ (2,147) $ 1 19,91 1
U.S. Treasurysecurities andobligations of otherU.S. governmentagencies maturing:
between 5-10 years 38,979 577 (3) 39,553
Corporate debtsecurities maturing:
within 1 year 100,178 51 (8) 100,221
between 1-5 years 100,713 770 (103) 10 1 ,380
between 5-10 years 149,242 4,053 — 153,295
Other debt securitiesmaturing:
within 1 year 41,061 — (578) 40,483
between 1-5 years 41,057 — (2,008) 39,049
TotalAvailable-for-Sale $ 517,492 $ 81 , 247 $ (4,847) $ 593,892
Securities Held-to-Maturity (carriedat amortized cost):
Corporate debtsecurities maturing:
within 1 year $ 195,522 $ 19 — $ 195,541
TotalHeld-to-Maturity $ 195,522 $ 19 — $ 195,541
The carrying value of all investment securities held at
December 31, 1998 and 1997, is summarized below (in thousands):
Security 1998 1997
Trading Securities $ 239,901 $ 252,627
Securities Available-for-Salematuring within one year 250,956 140,704
Securities Held-to-Maturitymaturing within one year 1 15,687 195,522
Total short-terminvestments $ 606,544 $ 588,853
Securities Available-for-Salematuring between 1–10 years,including equity securities $ 716,888 $ 453,188
Total long-termmarketable securities $ 716,888 $ 453,188
In 1998, proceeds from the sales of available-for-sale secu-
rities totaled $431.0 million; gross realized gains totaled $9.5
million and gross realized losses totaled $1.8 million. In 1997,
proceeds from the sales of available-for-sale securities totaled
$410.4 million; gross realized gains totaled $13.2 million and
gross realized losses totaled $2.1 million. In 1996, proceeds
from sales of available-for-sale securities totaled $182.6 mil-
lion; gross realized gains totaled $1.0 million and gross realized
losses totaled $0.7 million. The Company recorded charges in
1998 and 1997 of $20.2 million and $4.0 million, respectively, to
write down certain available-for-sale biotechnology equity
securities for which the decline in fair value below cost was
other than temporary. In 1996, there were no such write-downs.
During the year ended December 31, 1998, 1997 and 1996,
net change in unrealized holding gains/(losses) on trading
securities included in net income totaled $7.4 million, ($3.8)
million and ($1.0) million, respectively.
Marketable debt securities held by the Company are issued
by a diversified selection of corporate and financial institu-
tions with strong credit ratings. The Company’s investment pol-
icy limits the amount of credit exposure with any one institu-
tion. Other than asset-backed securities, these debt securities
are generally not collateralized. The Company has not experi-
enced any material losses due to credit impairment on its
investments in marketable debt securities in the years 1998,
1997 and 1996.
Financial Instruments
Foreign Currency Instruments: Certain of the Company’s
revenues are earned outside of the U.S. Moreover, the
Company’s foreign currency denominated revenues exceed
its foreign currency denominated expenses; therefore, risk
exists that net income may be impacted by changes in the
exchange rates between the U.S. dollar and foreign curren-
cies. To hedge a portion of anticipated nondollar denominat-
ed net revenues, the Company currently purchases options
and may enter into forward contracts. At December 31, 1998,
the Company had hedged approximately 75% of probable
net foreign revenues anticipated within 12 months and 40%
of its probable net foreign revenues through the year 2000.
At December 31, 1998 and 1997, the notional amounts of the
options totaled $75.0 million and $122.9 million, respectively,
and consisted of the following currencies: German marks,
Spanish pesetas, French francs, British pounds, Italian lire,
Japanese yen and Swedish krona. All option contracts
mature within the next two years. The fair value of the
options was based on exchange rates and market conditions
at December 31, 1998 and 1997. All forward contracts were
closed out at the end of 1997 and no forward contracts were
entered into in 1998.
Credit exposure is limited to the unrealized gains on
these contracts. All agreements are with a diversified selec-
tion of institutions with strong credit ratings which mini-
mizes risk of loss due to nonpayment from the counterparty.
The Company has not experienced any material losses due to
credit impairment of its foreign currency instruments.
Interest Rate Swaps: Interest income is subject to fluctua-
tions as interest rates change, primarily U.S. interest rates.
To manage this risk, the Company periodically establishes
duration targets for its investment portfolio that reflect its
anticipated use of cash and fluctuations in market rates of
interest. The Company may enter into swaps as part of its
overall strategy of managing the duration of its investment
portfolio. For each swap, the Company receives interest
based on fixed rates and pays interest to counterparties
based on floating rates on a notional principal amount. The
Company’s swap counterparties have strong credit ratings
which minimize the risk of non-performance on the swaps.
The Company has not experienced any material losses due
to credit impairment. At December 31, 1998 and 1997, the
Company had three swap contracts outstanding with notion-
al amounts totaling $150.0 million. The Company’s credit
Notes to Consolidated Financial Statements(continued)
Investment Securities
Securities classified as trading, available-for-sale and held-to-maturity at December 31, 1998 and 1997, are summarized below.
Estimated fair value is based on quoted market prices for these or similar investments.

5554
exposure on swaps and the net carrying amounts of swaps
held at December 31, 1998 and 1997, were not material. Net
interest income from swaps in 1998, 1997 and 1996 was also
immaterial.
Equity Collar Instruments: To hedge against fluctuations in
the market value of a portion of the marketable equity port-
folio, the Company has entered into costless collar instru-
ments, a form of equity collar instrument, that expire in 1999
and will require settlement in equity securities or cash. A
costless collar instrument is a purchased put option and a
written call option on a specific equity security such that the
cost of the purchased put and the proceeds of the written call
offset each other; therefore, there is no initial cost or cash
outflow for these instruments. The fair value of the pur-
chased puts and the written calls were determined based on
quoted market prices at year end. At December 31, 1998, the
notional amounts of the put and call options were $32.0 mil-
lion and $46.0 million, respectively. At December 31, 1997, the
notional amounts of the put and call options were $33.7 mil-
lion and $50.1 million, respectively.
Financial Instruments Held for Trading Purposes: As part
of its 1998 overall investment strategy, the Company has con-
tracted with two external money managers to manage part of
its investment portfolio. This portfolio at December 31, 1998,
consisted of U.S. and nondollar denominated investments.
To hedge the nondollar denominated investments, the
money managers enter into forward contracts. The notional
amounts of the forward contracts at December 31, 1998 and
1997, were $211.6 million and $209.3 million, respectively. The
fair value at December 31, 1998 and 1997, of the forward con-
tracts, totaled $0.4 million and $3.3 million, respectively. The
average fair value during 1998 and 1997 totaled ($0.9) million
and $2.1 million, respectively. Net realized and unrealized
trading gains on the portfolio totaled approximately $16.2
million in 1998 and $9.1 million in 1997, respectively, and are
included in interest income. Counterparties have strong cred-
it ratings which minimize the risk of non-performance from
the counterparties.
Summary of Fair Values: The table below summarizes the
carrying value and fair value at December 31, 1998 and 1997,
of the Company’s financial instruments. The fair value of the
long-term debt was estimated based on the quoted market
price at year end (in thousands):
1998 1997
Financial Carrying Fair Carrying FairInstruments Value Value Value Value
Assets:
Investment securities $ 1,323,432 $ 1,323,353 $ 1,042,041 $ 1,042,060
Convertibleequity loans 55,800 55,800 55,248 55,248
Purchasedforeign exchangeput options 1,441 5,741 3,891 14,468
Outstandinginterest rateswaps 5,742 167,535 5,742 165,559
Liabilities:
Long-term debt 149,990 148,000 150,000 139,500
Equity collars 4,857 11,600 12,161 15,533
Outstandinginterest rateswaps 3,587 153,587 3,732 153,732
Other Accrued Liabilities
Other accrued liabilities at December 31 are as follows
(in thousands):
1998 1997
Accrued compensation $ 47,057 $ 44,624
Accrued clinicaland other studies 35,535 47,269
Accrued royalties 23,392 23,905
Accrued marketingand promotion costs 9,417 13,369
Other 77,639 55,678
Total otheraccrued liabilities $ 193,040 $ 184,845
Long-term Debt
The Company’s long-term debt as of December 31, 1998 and
1997, consisted of $150.0 million of convertible subordinated
debentures, with interest payable at 5%, due in 2002. The
debentures are convertible, at the option of the holder, into
shares of the Company’s Special Common Stock. Upon con-
version, the holder receives, for each $74 in principal amount
of debenture converted, one-half share of the Company’s
Special Common Stock and $18 in cash. The $18 in cash is
reimbursed by Roche to the Company. Generally, the
Company may redeem the debentures until maturity.
Leases, Commitments andContingencies
Leases: Future minimum lease payments under operating
leases, net of sublease income, at December 31, 1998, are as
follows (in thousands):
There-1999 2000 2001 2002 2003 after Total
$ 25,855 23,591 22,470 19,627 18,637 36,707 $ 146,887
The Company leases various real property under operat-
ing leases that generally require the Company to pay taxes,
insurance and maintenance. Rent expense was approximate-
ly $12.7 million, $11.7 million and $11.7 million for the years
1998, 1997 and 1996, respectively. Sublease income was not
material in any of the three years presented.
Under four of the lease agreements, the Company has an
option to purchase the properties at an amount that does not
constitute a bargain. Alternatively, the Company can cause
the property to be sold to a third party. The Company is con-
tingently liable, under residual value guarantees, for approx-
imately $377.0 million. The Company also is required to main-
tain certain financial ratios and is limited to the amount of
additional debt it can assume.
Commitments: The Company and CuraGen Corporation
(CuraGen) entered into a research collaborative agreement in
November 1997, whereby the Company invested $5.0 million in
equity of CuraGen and has agreed to provide a convertible equi-
ty loan to CuraGen of up to $26.0 million. As of December 31,
1998, no loan amounts have been funded to CuraGen.
Also, in December 1997, the Company and LeukoSite, Inc.
(LeukoSite) entered into a collaboration agreement to devel-
op and commercialize LeukoSite’s LDP-02, a humanized mon-
oclonal antibody for the potential treatment of inflammatory
bowel diseases. Under the terms of the agreement, the
Company made a $4.0 million equity investment in LeukoSite
and has agreed to provide a convertible equity loan for
approximately $15.0 million to fund Phase II development
costs. Upon successful completion of Phase II, if LeukoSite
agrees to fund 25% of Phase III development costs, the
Company has agreed to provide a second loan to LeukoSite
for such funding. As of December 31, 1998, no loan amounts
have been funded to LeukoSite.
In addition, the Company has entered into research
collaborations with companies whereby potential future
payments may be due to selective collaborative partners
achieving certain benchmarks as defined in the collaborative
agreements. The Company may also, from time to time, lend
additional funds to these companies, subject to approval.
The Company is a limited partner in the Vector Later-
Stage Equity Fund II, LP (Vector Fund). The General Partner is
Vector Fund Management II, LLC, a Delaware limited liability
company. The purpose of the Vector Fund is to invest in
biotech equity and equity-related securities. Under the terms
of the Vector Fund agreement, the Company makes contribu-
tions to the capital of the Vector Fund through installments
in cash as called by the General Partner. The Company’s total
commitment to the Vector Fund through September 2003 is
$25.0 million, of which $7.2 million was contributed as of
December 31, 1998. The Vector Fund will terminate and be dis-
solved in September 2007.
Contingencies: The Company is a party to various legal pro-
ceedings, including patent infringement cases involving
human growth hormone products and Activase® and other
matters.
In July 1997, an action was filed in the U.S. District Court
for the Northern District of California alleging that the
Company’s manufacture, use and sale of its Nutropin® human
growth hormone products infringed a patent (the Goodman
Patent) owned by the Regents of the University of California
(UC). This action is substantially the same as a previous
action filed in 1990 against the Company by UC alleging that
the Company’s manufacture, use and sale of its Protropin®
human growth hormone products infringed the Goodman
Notes to Consolidated Financial Statements(continued)

Patent. The 1997 case has been stayed pending the conclu-
sion of the 1990 case, which is expected to commence trial in
April 1999.
Based upon the nature of the claims made and the infor-
mation available to date to the Company and its counsel
through investigations and otherwise, the Company believes
the outcome of these actions is not likely to have a material
adverse effect on the financial position, results of operations
or cash flows of the Company. However, were an unfavorable
ruling to occur in any quarterly period, there exists the pos-
sibility of a material impact on the net income of that period.
In addition to the above, in 1995, the Company received
and responded to grand jury document subpoenas from the
U.S. District Court for the Northern District of California for
documents relating to the Company’s past clinical, sales and
marketing activities associated with human growth hormone.
In February 1997, February 1998 and October 1998, the
Company received grand jury document subpoenas from the
same court related to the same subject matter. The govern-
ment is actively investigating this matter, and the Company is
a target of that investigation. The Company expects further
activity with respect to this matter in the near future. At this
time, the Company cannot reasonably estimate a possible
range of loss, if any, that may result from this investigation
due to uncertainty regarding the outcome.
Relationship with Roche Holdings, Inc.
On October 25, 1995, the Company and Roche entered into the
Agreement. Each share of the Company’s Common Stock not
held by Roche or its affiliates on that date automatically con-
verted to one share of Special Common Stock. The Agreement
extends until June 30, 1999 Roche’s option to cause the
Company to redeem (call) the outstanding Special Common
Stock of the Company at predetermined prices. Should the
call be exercised, Roche will concurrently purchase from the
Company a like number of common shares for a price equal
to the Company’s cost to redeem the Special Common Stock.
During the quarter beginning January 1, 1999, the call price is
$81.00 per share and increases by $1.50 per share each quar-
ter through the end of the option period on June 30, 1999, on
which date the price will be $82.50 per share. If Roche does
not cause the redemption as of June 30, 1999, the Company’s
stockholders will have the option (put) to cause the Company
to redeem none, some or all of their shares of Special
Common Stock at $60.00 per share (and Roche will concur-
rently provide the necessary redemption funds to the
Company by purchasing a like number of shares of Common
Stock at $60.00 per share) within thirty business days com-
mencing July 1, 1999. Roche Holding Ltd, a Swiss corporation,
has guaranteed Roche’s obligation under the put.
In the event of the put, wherein sufficient shares of the
Company’s Special Common Stock are tendered to result in
Roche owning at least 85% of the total outstanding shares of
the Company’s stock, the Company has in place an Incentive
Units Program (Program) which could result in amounts
payable to eligible employees. These amounts are based on
specified performance benchmarks achieved by the Company
during the term of the Program. In the event of the put, at
December 31, 1998, $14.8 million is contingently payable under
the Program.
In conjunction with the Agreement, HLR was granted an
option for ten years for licenses to use and sell certain of the
Company’s products in non-U.S. markets (the License
Agreement). In 1997, the Company and HLR agreed in princi-
ple to changes to the License Agreement. Key changes to the
License Agreement are summarized as follows: (1) For future
products, HLR may choose to exercise its option either when
the Company determines to move a product into develop-
ment, or at the end of Phase II clinical trials (as in the 1995
agreement). U.S. and European development costs will be
shared (discontinuing the distinction regarding location or
purpose of studies). (2) If HLR exercises its option at the
development determination point, U.S. and European devel-
opment costs will be shared 50/50. (3) If HLR exercises its
option at the end of Phase II clinical trials, HLR will reimburse
the Company for 50 percent of any development costs
incurred, and subsequent U.S. and European development
costs will be shared 75/25, HLR/Genentech. (4) For nerve
growth factor, which HLR has already exercised its option to
develop, prospective U.S. and European development costs
will be shared 60/40, HLR/Genentech. (5) HLR has assumed
development of Xubix™ (the oral IIb/IIIa antagonist) globally
on its own. The Company may subsequently opt-in and join
development at any time through the New Drug Application
approval for the first indication. If the Company does not opt-
in, it will receive from HLR a 6.0% royalty on worldwide sales
of Xubix.
In general, with respect to the Company’s products, HLR
pays a royalty of 12.5% until a product reaches $100.0 million
in aggregate sales outside of the U.S., at which time the
royalty rate on all sales increases to 15%. In addition, HLR has
rights to, and pays the Company 20% royalties on, Canadian
sales of Activase, Protropin, Nutropin, Pulmozyme and
Actimmune, sales of Pulmozyme outside of the U.S. and sales
of Rituxan® outside of the U.S., excluding Japan. HLR current-
ly has the right to sell Pulmozyme exclusively in Canada and
Europe and pays royalties to the Company on such sales. The
Company supplies its products to HLR, and has agreed to sup-
ply its products for which HLR has exercised its option, for
sales outside of the U.S. at cost plus 20%.
Under the Agreement, independent of its right to cause
the Company to redeem the Special Common Stock, Roche
may increase its ownership of the Company up to 79.9% by
making purchases on the open market. Roche holds approxi-
mately 65.3% of the outstanding common equity of the
Company as of December 31, 1998.
Related Party Transactions
The Company has transactions with Roche, HLR (a wholly
owned subsidiary of Roche, with two officers on the
Company’s Board of Directors) and its affiliates in the ordi-
nary course of business. The Company recorded nonrecurring
contract revenues from HLR of $40.0 million for Herceptin®
(trastuzumab) marketing rights outside of the U.S. in 1998
(see below) and $44.7 million for the exercise of their options
under the License Agreement with respect to three develop-
ment projects [Rituxan, insulin-like growth factor (IGF-I)
which was subsequently terminated, and nerve growth fac-
tor] in 1996. All other contract revenue from HLR, including
reimbursement for ongoing development expenses after the
option exercise date, totaled $21.6 million in 1998, $67.6 mil-
lion in 1997, $50.6 million in 1996. All other revenue from
Roche, HLR and their affiliates, principally royalties under
previous product licensing agreements, and royalties and
product sales under the License Agreement, totaled $63.8
million in 1998, $42.8 million in 1997 and $39.5 million in 1996.
In July 1998, the Company entered into an agreement with
HLR to provide HLR exclusive marketing rights outside of the
U.S. for Herceptin. Under the agreement, HLR paid $40.0 million
and has agreed to pay cash milestones tied to future product
development activities, to contribute equally with the
Company up to a maximum of $40.0 million on global develop-
ment costs and to make royalty payments on product sales. As
of December 31, 1998, no additional amounts have been paid.
The Company has a contractual relationship with
Novation, LLC (Novation), a group purchasing organization
that is a joint venture of VHA, Inc. and University
HealthSystem Consortium. One officer of VHA, Inc. is on the
Company’s Board of Directors. Under the contractual relation-
ship, the Company pays to Novation an administrative fee, and
pays to Novation member hospitals a rebate, based on a per-
centage of the purchases of Activase by such member hospi-
tals. In 1998, administrative fees and rebates paid to Novation
and its member hospitals, respectively, were not material.
The Company has contracted with Jacobs Engineering
Group, Inc. (Jacobs) to provide design and engineering serv-
ices for various projects of the Company. One of the members
of the Board of Directors of Jacobs is also a member of the
Board of Directors of the Company. In 1998, the amounts the
Company paid to Jacobs were not material.
Capital Stock
Common Stock, Special Common Stock and RedeemableCommon Stock: After the close of business on June 30,
1995, each share of the Company’s redeemable Common
Stock automatically converted to one share of Genentech
Common Stock, in accordance with the terms of the
redeemable Common Stock put in place at the time of its
issuance in 1990 and as described in Genentech’s Certificate
of Incorporation. On October 25, 1995, pursuant to the
Agreement with Roche, each share of the Company’s
Common Stock not held by Roche or its affiliates automati-
cally converted to one share of Special Common Stock. See
the Relationship with Roche Holdings, Inc. note above for a
discussion of these transactions.
Stock Award Plans: The Company has stock option plans
adopted in 1996, 1994, 1990 and 1984, which variously allow
for the granting of non-qualified stock options, stock awards
and stock appreciation rights to employees, non-employee
directors and consultants of the Company. Incentive stock
options may only be granted to employees under these plans.
Generally, non-qualified options have a maximum term of 20
years, except those granted under the 1996 Plan and options
granted prior to 1992 under the 1984 Plan, which have a term
of 10 years. Incentive options have a maximum term of 10
years. In general, options vest in increments over four years
from the date of grant, although the Company may grant
options with different vesting terms from time-to-time. No
stock appreciation rights have been granted to date.
The Company adopted the 1991 Employee Stock Plan (1991
Plan) on December 4, 1990, and amended it during 1993, 1995
5756
Notes to Consolidated Financial Statements(continued)

5958
and 1997. The 1991 Plan allows eligible employees to purchase
Special Common Stock at 85% of the lower of the fair market
value of the Special Common Stock on the grant date or the
fair market value on the first business day of each calendar
quarter. Purchases are limited to 15% of each employee’s eli-
gible compensation. All full-time employees of the Company
are eligible to participate in the 1991 Plan. Of the 4,500,000
shares of Special Common Stock reserved for issuance under
the 1991 Plan, 3,743,789 shares have been issued as of
December 31, 1998. During 1998, 2,818 of the eligible employ-
ees participated in the 1991 Plan.
The Company has elected to continue to follow
Accounting Principles Board (APB) 25 for accounting for its
employee stock options because the alternative fair value
method of accounting prescribed by FAS 123, “Accounting for
Stock-Based Compensation,” requires the use of option valu-
ation models that were not developed for use in valuing
employee stock options. Under APB 25, “Accounting for Stock
Issued to Employees,” no compensation expense is recog-
nized because the exercise price of the Company’s employee
stock options equals the market price of the underlying stock
on the date of grant.
Pro forma information regarding net income and earn-
ings per share has been determined as if the Company had
accounted for its employee stock options and employee
stock plan under the fair value method prescribed by FAS 123
and the earnings per share method under FAS 128. The result-
ing effect on pro forma net income and earnings per share
disclosed is not likely to be representative of the effects on
net income and earnings per share on a pro forma basis in
future years, due to subsequent years including additional
grants and years of vesting. The fair value of options was
estimated at the date of grant using a Black-Scholes option
valuation model with the following weighted average
assumptions for 1998, 1997 and 1996, respectively: risk-free
interest rates of 5.5%, 6.2% and 5.8%; dividend yields of 0%;
volatility factors of the expected market price of the
Company’s Common Stock of 11.9%, 9.2% and 6.2%; and a
weighted-average expected life of the option of five years.
The Black-Scholes option valuation model was developed
for use in estimating the fair value of traded options which
have no vesting restrictions and are fully transferable. In
addition, option valuation models require the input of highly
subjective assumptions including the expected stock price
volatility. Because the Company’s employee stock options
have characteristics significantly different from those of
traded options, and because changes in the subjective input
assumptions can materially affect the fair value estimate, in
management’s opinion the existing models do not necessari-
ly provide a reliable single measure of the fair value of its
employee stock options.
For purposes of pro forma disclosures, the estimated fair
value of options is amortized to pro forma expense over the
options’ vesting period. Pro forma information for the years
ending December 31 follows (in thousands, except per share
amounts):
1998 1997 1996
Net income —as reported $ 181 ,909 $ 129,044 $ 1 18,348
Net income —pro forma 140,995 1 1 1 ,441 1 04,358
Earnings per share —as reported:
Basic 1.45 1.05 0.98
Diluted 1.40 1 .02 0.95
Earnings per share —pro forma:
Basic 1 .12 0.9 1 0.87
Diluted 1.10 0.89 0.84
A summary of the Company’s stock option activity and
related information were as follows:
Weighted AverageShares Price
Options outstandingat December 31, 1995 15,209,074 $ 36.80
Grants 6,76 1 ,545 53.99
Exercises (1,624,541) 29.39
Cancellations (743,569) 48.93
Options outstandingat December 31, 1996 19,602,509 42.89
Grants 329,505 58.2 1
Exercises (2,443,696) 30.07
Cancellations (1,248,709) 52.35
Options outstandingat December 31, 1997 16,239,609 44.4 1
Grants 4,594,925 67.82
Exercises (2,460,907) 35.32
Cancellations (1 ,248,021) 54.64
Options outstandingat December 31, 1998 17,125,606 $ 51.27
The following table summarizes information concerning
currently outstanding and exercisable options.
Options OptionsOutstanding Exercisable
WeightedAverage
Years Weighted WeightedRemaining Average Average
Range of Number Contractual Exercise Number ExerciseExercise Prices Outstanding Life Price Exercisable Price
$ 15.990– $ 21.375 2 14,951 0.58 $ 19.87 214,951 $ 1 9.87
$ 25.500– $ 38.125 3,196,155 1 1.08 28.18 3,155,655 28.20
$ 41.750 – $ 59.000 9,306,775 1 1.98 52.09 4,937,820 51.35
$ 67.063 – $ 71.125 4,407,725 9.68 67.82 1,525 67.3 1
17,125,606 8,309,951
Using the Black-Scholes option valuation model, the
weighted average fair value of options granted in 1998, 1997
and 1996, respectively was $17.23, $15.37 and $13.36. Shares of
Special Common Stock available for future grants under all
stock option plans were 2,041,218 at December 31, 1998.
Notes to Consolidated Financial Statements(continued)

Report of Ernst & Young LLP, Independent Auditors
The Board of Directors and Stockholders of Genentech, Inc.
We have audited the accompanying consolidated balance sheets of Genentech, Inc. as of December 31, 1998 and 1997, and the relat-
ed consolidated statements of income, stockholders’ equity, and cash flows for each of the three years in the period ended
December 31, 1998. These financial statements are the responsibility of the Company’s management. Our responsibility is to express
an opinion on these financial statements based on our audits.
We conducted our audits in accordance with generally accepted auditing standards. Those standards require that we plan and
perform the audit to obtain reasonable assurance about whether the financial statements are free of material misstatement. An
audit includes examining, on a test basis, evidence supporting the amounts and disclosures in the financial statements. An audit
also includes assessing the accounting principles used and significant estimates made by management, as well as evaluating the
overall financial statement presentation. We believe that our audits provide a reasonable basis for our opinion.
In our opinion, the financial statements referred to above present fairly, in all material respects, the consolidated financial
position of Genentech, Inc. at December 31, 1998 and 1997, and the consolidated results of its operations and its cash flows for each
of the three years in the period ended December 31, 1998, in conformity with generally accepted accounting principles.
San Jose, California
January 20, 1999
6160
1998 Quarter Ended
December 31 September 30 June 30 March 31
Total revenues $ 304,301 $ 313,930 $ 268,012 $ 264,700Product sales 213,713 163,100 1 76,263 164,7 19Gross margin from product sales 181,212 127,749 139,1 1 3 131 ,098Net income 37,140 63,378 40,374 41,017Earnings per share:
Basic 0.29 0.50 0.32 0.33Diluted 0.28 0.49 0.31 0.32
1997 Quarter Ended
December 31 September 30 June 30 March 31
Total revenues $ 277,053 $ 248,917 $ 233,493 $ 257,285Product sales 143,352 142,306 145,018 154,213Gross margin from product sales 120,633 1 15 ,74 1 1 19,451 126,528Net income 41,529 32, 122 23,794 31,599Earnings per share:
Basic 0.34 0.26 0.19 0.26Diluted 0.33 0.25 0.19 0.25
Report of Independent Auditors Quarterly Financial Data (Unaudited)(thousands, except per share amounts)

62
11-Year Financial Summary (Unaudited)(millions, except per share and employee data)
1998 1997 1996 1995 1994
Total revenues $ 1,150.9 $ 1,016.7 $ 968.7 $ 9 17.8 $ 795.4Product sales 717.8 584.9 582.8 635.3 601.0Royalties 229.6 24 1 . 1 2 14.7 190.8 126.0Contract & other 1 14.8 1 2 1 .6 107.0 31 .2 25.6Interest 88.7 69. 1 64.2 60.5 42.8
Total costs and expenses $ 898.3 $ 846.9 $ 820.8 $ 745.6 $ 665.8Cost of sales 138.6 102.5 104.5 97.9 95.8Research & development 396.2 470.9 471 . 1 363.0 314.3Marketing, general & administrative 358.9 269.9 240. 1 251.7 248.6Special charge — — — 25.0(1) —Interest 4.6 3.6 5. 1 8.0 7. 1
Income dataIncome (loss) before taxes $ 252.6 $ 169.8 $ 147.9 $ 172.2 $ 129.6Income tax provision 70.7 40.8 29.6 25.8 5.2Net income (loss) 181.9 129.0 1 18.3 146.4 124.4Tax rate 28% 24% 20% 15% 4%
Earnings (loss) per share:Basic $ 1.45 $ 1.05 $ 0.98 $ 1.24 $ 1.07Diluted 1.40 1.02 0.95 1.20 1.03
Selected balance sheet dataCash, short-term investments
& long-term marketable securities $ 1,604.6 $ 1 ,286.5 $ 1 ,159. 1 $ 1,096.8 $ 920.9Accounts receivable 149.7 189.2 197.6 172 .2 146.3Inventories 148.6 1 16.0 9 1 .9 93.6 103.2Property, plant & equipment, net 700.2 683.3 586.2 503.7 485.3Other long-term assets 196.3 177.2 149.2 105.5 61.0Total assets 2,855.4 2,507.6 2,226.4 2 ,01 1 .0 1 ,745. 1Total current liabilities 291.3 289.6 250.0 233.4 220.5Long-term debt 150.0 150.0 150.0 150.0 150.4Total liabilities 511 .6 476.4 425.3 408.9 396.3Total stockholders’ equity 2,343.8 2,031.2 1 ,801 . 1 1,602.0 1,348.8
Other dataDepreciation and amortization expense $ 78.1 $ 65.5 $ 62. 1 $ 58.4 $ 53.5Capital expenditures 88.1 1 54.9 14 1 .8 70.2 82.8
Share informationShares used to compute EPS:
Basic 125.8 123.0 120.6 1 18.3 1 16 .0Diluted 129.9 126.4 124.0 12 1 .7 120.2
Actual year-end 127. 1 124.2 1 2 1 .4 1 1 9.3 1 1 7.2
Per share dataMarket price: High $ 79.75 $ 60.63 $ 55.38 $ 53.00* $ 53.50
Low $ 59.25 $ 53.25 $ 51.38 $ 44.50* $ 41.75
Book value $ 18.44 $ 16.35 $ 14.84 $ 13.43 $ 11.50
Number of employees 3,389 3,242 3,071 2,842 2,738
1993 1992 199 1 1990 1989 1988
$ 649.7 $ 544.3 $ 515.9 $ 476. 1 $ 400.5 $ 334.8457.4 39 1 .0 383.3 367.2 319. 1 262.51 12.9 9 1 .7 63.4 47.6 36.7 26.737.9 1 6.7 20.4 31 .9 27.5 33.541 .5 44.9 48.8 29.4 1 7.2 12 . 1
$ 590.8 $ 522.3 $ 469.8 $ 572.7 $ 352.9 $ 31 1 .770.5 66.8 68.4 68.3 60.6 46.9
299.4 278.6 221.3 1 73. 1 156.9 132.7214.4 172.5 175.3 158. 1 127.9 101.9
— — — 167.7(2) — 23.3(3)
6.5 4.4 4.8 5.5 7.5 6.9
$ 58.9 $ 22.0 $ 46. 1 $ (96.6) $ 47.6 $ 23. 1— 1 . 1 1 .8 1.5 3.6 2.5
58.9 20.9 44.3 (98.0) 44.0 20.6— 5% 4% — 8% 11%
$ 0.52 $ 0.19 $ 0.40 — (4) — (4) $ 0.250.50 0.18 0.39 $ (1.05)(4) $ 0.51(4) 0.24
$ 719.8 $ 646.9 $ 7 1 1 .4 $ 69 1 .3 $ 205.0 $ 152.5130.5 93.9 69.0 58.8 66.8 63.984.7 65.3 56.2 39.6 49.3 63.4
456.7 432.5 342.5 300.2 299. 1 289.464. 1 37. 1 42.7 61 .7 85.0 89.7
1,468.8 1,305. 1 1,231 .4 1,157.7 7 1 1 .2 662.9190.7 133.5 1 18.6 101 .4 75.9 95.4151 .2 152.0 152.9 153.5 154.4 155.3352.0 297.8 281 .7 264.5 242.2 263.6
1 , 1 16.8 1,007.3 949.7 893.2 469.0 399.3
$ 44.0 $ 52.2 $ 46.9 $ 47.6 $ 44.6 $ 38.387.5 126.0 71 .3 36.0 37.2 110.9
1 13 .9 1 1 1 .9 1 1 1 .0 — (4) — (4) 82.21 18 .7 1 15.0 1 13 .2 93.0(4) 86.0(4) 85.0114.8 112 .9 1 1 1 .3 1 10.6 84.3 82.9
$ 50.50 $ 39.50 $ 36.25 $ 30.88 $ 23.38 $ 47.50$ 27.50**
$ 31.25 $ 25.88 $ 20.75 $ 20. 1 3 $ 16.00 $ 14.38$ 21.75**
$ 9.73 $ 8.92 $ 8.53 $ 8.08 $ 5.56 $ 4.82
2,510 2,331 2,202 1,923 1,790 1,744
The Company has paid no dividends.The Financial Summary above reflects adoption of FAS 130 and 131 in 1998, FAS 128 and 129 in 1997, FAS 121 in 1996, FAS 115 in 1994, FAS 109 in 1992 and FAS 96 in 1988.*Special Common Stock began trading October 26, 1995. On October 25, 1995, pursuant to the new Agreement with Roche, each share of the Company’s Common Stock not held byRoche or its affiliates automatically converted to one share of Special Common Stock.
**Redeemable Common Stock began trading September 10, 1990; prior to that date all shares were Common Stock. Pursuant to the merger agreement with Roche, all shareholders as ofeffective date September 7, 1990, received for each common share owned, $18 in cash from Roche and one-half share of newly issued Redeemable Common Stock from the Company.
( 1) Charges related to 1995 merger and new Agreement with Roche ($21 million) and resignation of the Company’s former CEO ($4 million).(2) Charges primarily related to 1990 Roche merger.(3) Primarily inventory-related charge.(4) Reflect amounts previously reported. Information was not available to restate these amounts pursuant to FAS 128.
63

65
HEADQUARTERSGenentech, Inc.1 DNA WaySouth San Francisco, California 94080-4990(650) 225-1000http://www.gene.com
STOCK LISTINGSGenentech, Inc. is listed on the New YorkStock Exchange and the Pacific Exchangeunder the symbol GNE.
TRANSFER AGENTCommunications concerning transferrequirements, lost certificates andchange of address should be directed toGenentech’s transfer agent:
EquiServeBoston EquiServe DivisionStockholder ServicesPost Office Box 8040Boston, MA 02266-8040Telephone: (781) 575-3400Fax: (781) 828-8813http://www.equiserve.com
ANNUAL MEETINGThe annual meeting of stockholders will beheld at 10:00 a.m. Pacific time on April 13,1999, at The Westin Hotel, 1 Old BayshoreHighway, Millbrae, California. Detailedinformation about the meeting is containedin the Notice of Annual Meeting and ProxyStatement sent with a copy of the AnnualReport to each stockholder of record as ofFebruary 16, 1999.
STOCKHOLDER INFORMATION
INTERESTED IN BIOLOGY?
Visit Access Excellence, Genentech’s site on the World WideWeb for biology teachers, their students and everyoneinterested in the latest exciting advances in the life sciences:http://www.gene.com/ae
WANT TO LEARN MORE ABOUT GENENTECH?
Visit us on the World Wide Web:http://www.gene.com
INVESTOR RELATIONSGenentech invites stockholders, security analysts, representatives ofportfolio management firms and other interested parties to contact:
Susan BentleySenior Director, Investor RelationsGenentech, Inc.1 DNA WaySouth San Francisco, California 94080-4990(650) 225-1260e-mail: [email protected]
ADDITIONAL INFORMATIONIf you need additional assistance or information regardingthe company, or would like to receive a free copy of Genentech’sForm 10-K and 10-Q reports filed with the Securities andExchange Commission, contact the Investor Relations Departmentat Genentech’s corporate offices at (650) 225-8679 or send ane-mail message to [email protected]. Or direct requestsfor literature to Genentech’s literature request line at (800) 488-6519.You may also visit Genentech’s site on the World Wide Web athttp://www.gene.com.
INDEPENDENT AUDITORSErnst & Young LLPSan Jose, California
64
Stock Trading Symbol GNE
Stock Exchange Listings
The Company’s callable putable Common Stock (Special
Common Stock) has traded on the New York Stock Exchange
and the Pacific Exchange under the symbol GNE since October
26, 1995. On October 25, 1995, the Company’s non-Roche stock-
holders approved an agreement (the Agreement) with Roche
Holdings, Inc. (Roche). Pursuant to the Agreement, each share
of the Company’s Common Stock not held by Roche or its affil-
iates automatically converted to one share of Special
Common Stock. From July 3, 1995 through October 25, 1995,
the Company’s Common Stock was traded under the symbol
GNE. After the close of business on June 30, 1995, each share
of the Company’s Redeemable Common Stock automatically
converted to one share of the Company’s Common Stock. The
conversion was in accordance with the terms of the
Redeemable Common Stock put in place at the time of its
issuance on September 7, 1990, when the Company’s merger
with a wholly owned subsidiary of Roche was consummated.
The Redeemable Common Stock of the Company traded under
the symbol GNE from September 10, 1990 to June 30, 1995. The
Company’s Common Stock was traded on the New York Stock
Exchange under the symbol GNE from March 2, 1988, until
September 7, 1990, and on the Pacific Exchange under the
symbol GNE from April 12, 1988, until September 7, 1990. The
Company’s Common Stock was previously traded in the NAS-
DAQ National Market System under the symbol GENE. No divi-
dends have been paid on the Common Stock, Special Common
Stock or Redeemable Common Stock. The Company currently
intends to retain all future income for use in the operation of
its business and, therefore, does not anticipate paying any
cash dividends in the foreseeable future. See the Relationship
with Roche Holdings, Inc. note in the Notes to Consolidated
Financial Statements for a further description of the
Agreement with Roche.
Special Common Stockholders
As of December 31, 1998, there were approximately 13,374
stockholders of record of the Company’s Special Common
Stock.
Special Common/RedeemableStock Prices Common/Common Stock
1998 1997High Low High Low
4th Quarter $ 79 3/4 $ 68 1/8 $ 60 5/8 $ 57 1/2
3rd Quarter 72 11/16 63 9/16 58 15/16 56 1/2
2nd Quarter 73 3/4 65 3/4 59 1/4 56 1/2
1st Quarter 72 1/2 59 1/4 58 53 1/4
Common Stock, Special Common Stockand Redeemable Common Stock Information

66
Actimmune, Activase, Herceptin, Nutropin, Nutropin AQ, Protropin and Pulmozyme are
registered trademarks, Neuleze and Nutropin Depot are trademarks and SPOC is a
service mark of Genentech, Inc. HercepTest is a trademark of Genentech, Inc. that is
licensed to DAKO A/S. Cancer Survival Toolbox, Building Skills that Work for You
is a trademark of the National Coalition for Cancer Survivorship. Retavase is a
registered trademark of Centocor, Inc. Rituxan is a registered trademark of IDEC
Pharmaceuticals Corporation. XenoMouse is a trademark of Abgenix, Inc. Xubix is a
trademark of Hoffmann-La Roche, Inc.
Copyright © 1999, Genentech, Inc.
BOARD OF DIRECTORS
J. Richard MunroChairman of the Board,Genentech, Inc.
Herbert W. Boyer, Ph.D.Professor Emeritus of Biochemistryand Biophysics, University of California,San Francisco, and Chairman of the Board,Allergan, Inc., a technology-driven globalhealthcare company
Franz B. Humer, Ph.D.Chief Executive OfficerHead of the Pharmaceuticals Division,F. Hoffmann-La Roche, Ltd.,a research-based healthcare company
Jonathan K.C. Knowles, Ph.D.President of Global Research,F. Hoffmann-La Roche, Ltd., a research-based healthcare company
Arthur D. Levinson, Ph.D.President and Chief Executive Officer,Genentech, Inc.
Linda Fayne LevinsonPrincipal,Global Retail Partners, L.P.,a private equity investment fund
Donald L. MurfinGeneral Partner,Chemicals and MaterialsEnterprise Associates, L.P.,a venture capital firm
John T. Potts, Jr., M.D.Distinguished Jackson Professor ofClinical Medicine,Harvard Medical School,and Director of Research,Massachusetts General Hospital
C. Thomas Smith, Jr.President and Chief Executive Officer,VHA, Inc., a national alliancerepresenting 1,800 community-ownedhealthcare organizations
David S. Tappan, Jr.Retired Chairman and ChiefExecutive Officer,Fluor Corporation, an international engineering and construction company
OFFICERS
Arthur D. Levinson, Ph.D.*President and Chief Executive Officer
William D. Young*Chief Operating Officer
Louis J. Lavigne, Jr.*Executive Vice Presidentand Chief Financial Officer
Susan D. Desmond-Hellmann, M.D., M.P.H.*Senior Vice President — Developmentand Chief Medical Officer
Dennis J. Henner, Ph.D.*Senior Vice President — Research
Judith A. Heyboer*Senior Vice President —Human Resources
Stephen G. Juelsgaard* Senior Vice President, GeneralCounsel and Secretary
W. Robert Arathoon, Ph.D.Vice President — Process Sciences
Joffre B. Baker, Ph.D.Vice President — Research Discovery
J. Joseph Barta Vice President — Quality
John G. Curd, M.D.Vice President — Clinical Development
Stephen G. Dilly, M.D., Ph.D.Vice President — Medical Affairs
David A. EbersmanVice President — Product Development
Robert L. Garnick, Ph.D.Vice President — Regulatory Affairs
Bradford S. GoodwinVice President — Finance
Paula M. Jardieu, Ph.D.Vice President — PharmacologicalSciences
Edmon R. JenningsVice President — Corporate Development
Sean A. Johnston, Ph.D. Vice President — Intellectual Property
Cynthia J. LaddVice President — Corporate Lawand Assistant Secretary
Walter K. MooreVice President — Government Affairs
James P. PanekVice President — Manufacturing,Engineering and Facilities
Kimberly J. PopovitsVice President — Sales
Nicholas J. SimonVice President — Business and CorporateDevelopment
David C. Stump, M.D.Vice President — Clinical Research andGenentech Fellow
John M. WhitingController
* Member of Executive Committee
STAFF SCIENTISTS
Thomas A. Bewley, Ph.D. Process Sciences
Stuart Bunting, Ph.D. Research
Napoleone Ferrara, M.D. Research
David Giltinan, Ph.D. Medical Affairs
Tim Gregory, Ph.D. Process Sciences
Andrew J.S. Jones, D. Phil. Process Sciences
Laurence A. Lasky, Ph.D. Research
Arnon Rosenthal, Ph.D. Research
Steven Shak, M.D.Medical Affairs
Timothy A. Stewart, Ph.D. Research
Gordon A. Vehar, Ph.D. Research
William I. Wood, Ph.D. Research
DISTINGUISHED ENGINEER
Robert van ReisProcess Sciences
Desi
gned
and
pro
duce
d by
Spe
rling
Sam
pson
Wes
t. P
rinte
d in
the
Unite
d St
ates
by
Geor
ge R
ice
& So
ns.

By investing in strategic partnerships and acquisitions, Genentech isputting its financial assets to work as it seeks to complement and to
extract the full value of its own scientific efforts.
the power of
As a key component of its business strategy,
Genentech plans to continue to leverage its
assets by developing strategic alliances and by acqui-
sitions. The goal is to provide access to novel
products and technologies that will add incremental
value and growth to the company’s own internal
research, development and marketing portfolios.
As the company’s current alliances do now, new part-
nerships will enhance Genentech’s efforts at all stages
of the process of bringing new medicines to market.
To complement the beginning stages of the process,
Genentech looks to enter research collaborations on
promising early-stage technologies being developed by
other companies. Some such existing partnerships —
such as an agreement with Incyte Pharmaceuticals, Inc.
to access its proprietary genomic database — are
important components of Genentech’s discovery
research initiative. A new relationship with Abgenix,
Inc. provides access to that company’s XenoMouse™
technology for generating fully human antibodies.
Genentech expects that this technology may be useful
to develop desired antibodies to some of the proteins
identified through SPDI (see page 18).
Further in the process, Genentech looks for partners
to aid in the development of internal programs that
fall outside its strategic focus or that need important
expertise or resources offered by other companies.
These partnerships focus on Genentech products
that the company believes are exciting and valuable
assets worthy of development, but that could be more
effectively developed by partners. An example of
a strategic product-development collaboration is
VaxGen
DAKO CuraGen
IncyteCambridge Antibody Technology
Boehr inger AlkermesIDECPharmacia & Upjohn
4 LEVERAGE OUR ASSETS
Alteon

partnersGenentech’s agreement with XOMA
Ltd., which is developing for
Genentech through Phase II
studies an anti-CD11a antibody
(hu1124) for the potential treat-
ment of psoriasis.
Genentech also seeks partnerships
or acquisitions that will add com-
plementary projects to its clinical
development pipeline. Genentech’s
collaboration with LeukoSite, Inc.
to develop LeukoSite’s LDP-02 for
the potential treatment of inflamma-
tory bowel diseases is one example.
Strategic alliances also benefit
Genentech’s efforts once a product
reaches the market. Genentech and
its partner IDEC Pharmaceuticals
Corporation continue to collabo-
rate to expand the market for
Rituxan in the United States.
In 1998, Genentech entered an
agreement with DAKO A/S to
develop a laboratory diagnostic kit
to detect HER2 overexpression
in breast tumor specimens. This
screening kit helps oncologists
identify which of their patients can
best benefit from treatment with
Herceptin. As another example, in
1999 Genentech entered into an
agreement with Schwarz Pharma
AG, which, together with a previ-
ous arrangement with Sumitomo
Pharmaceuticals Co., Ltd., will now
make Genentech’s growth hormone
available worldwide.
Genentech assesses potential part-
nership opportunities on the basis
of scientific merit, technical and
regulatory feasibility, potential
market size, competitive outlook,
cost, means of financing, resource
requirements and strategic fit with
Genentech’s existing portfolio.
Genentech also licenses rights for
certain Genentech intellectual prop-
erty to partners that can maximize
value for Genentech and make
important technologies available
for patient benefit.
Genentech brings to its partner-
ships not only financial resources
but also its expertise in bringing
products to market, which includes
extensive experience in preclinical
and clinical development, regulatory
support, leading-edge process science
and manufacturing capabilities,
and a marketing/sales organization
that recognizes the importance of
demonstrating product value to
customers and of responding quickly
to customer needs.
By combining forces with its part-
ners, Genentech enhances its power
to achieve its strategy and its ambi-
tious goals and to bring important
new medicines to patients.
A bgenixXOMA
Tanox
Connetics
Roche
Immunex
Sumitomo
Novartisr Ingelheim
Hoechst Marion Roussel
Tular ikLeukoSite
Schwarz PharmaSensus


By developing the talents, knowledge and growth of its people,Genentech is realizing the full value of its human assets, who are
at the core of everything Genentech does.
3 INVEST IN OUR PEOPLE
From its inception in 1976, Genentech has prided
itself in attracting and retaining only the best
people in all areas of the company. The company’s
founders, Herbert W. Boyer, Ph.D., and Robert A.
Swanson, laid the foundation for this reality by
insisting that their new company break with indus-
try tradition; while offering the benefits of a well-
funded corporation, it would also offer significant
scientific freedom. This approach worked and, in
fact, was essential to attracting Genentech’s current
president and chief executive officer as one of the
company’s early research scientists.
Since then, Genentech has retained this founding
philosophy and expanded on it so that it affects all
areas of the company. Genentech seeks employees
with an entrepreneurial drive and nurtures that
drive through programs that encourage employees
to become stockholders. Other programs reward
individual initiative and ideas that identify scientific
avenues, enhance productivity or reduce costs.
While individual drive spurs Genentech forward,
day-to-day teamwork keeps the progress smooth
and steady. Recognizing this, Genentech also has
programs in place to reward interdisciplinary teams
as they achieve important project milestones. The
power of Genentech’s teams stems in large part
from the diversity of their players. Genentech seeks
to attract and retain a diverse work force made up
of individuals who bring their varied backgrounds
and perspectives to their jobs.
Genentech’s teams have strong individual players.
Of the more than 3,300 Genentech employees,
more than 80 percent have college degrees and
more than 25 percent hold advanced degrees includ-
ing Ph.D.s and M.D.s. Genentech expects the best
from its employees and rewards them accordingly.
The company’s benefits plan includes industry-
leading healthcare benefits, a company-matching
retirement savings plan, domestic-partner benefits,
a paid sabbatical program, a corporate-sponsored
daycare center and health club membership.
Genentech also ensures its employees remain up
to date. Its scientific library rivals those of leading
academic research centers. Company-sponsored,
on-site scientific seminars and visiting scientist pro-
grams facilitate the free exchange of scientific ideas.
Employee training funds and a tuition reimburse-
ment program help employees throughout the
company expand their skills and knowledge.
In 1998, as Genentech revised its strategy,
it added as an additional point: “Invest in Our
People.” While Genentech has always done so, its
strategy now explicitly recognizes that continuing
this emphasis is essential to the company’s con-
tinued success. After all, it is the employees who
make Genentech’s success happen.
In 1998, Genentech added “Invest in Our People” as
a point to its strategy for growth. After all, it is the
employees who make Genentech’s success happen.
investing in the heart of our success:
genentech people
2525
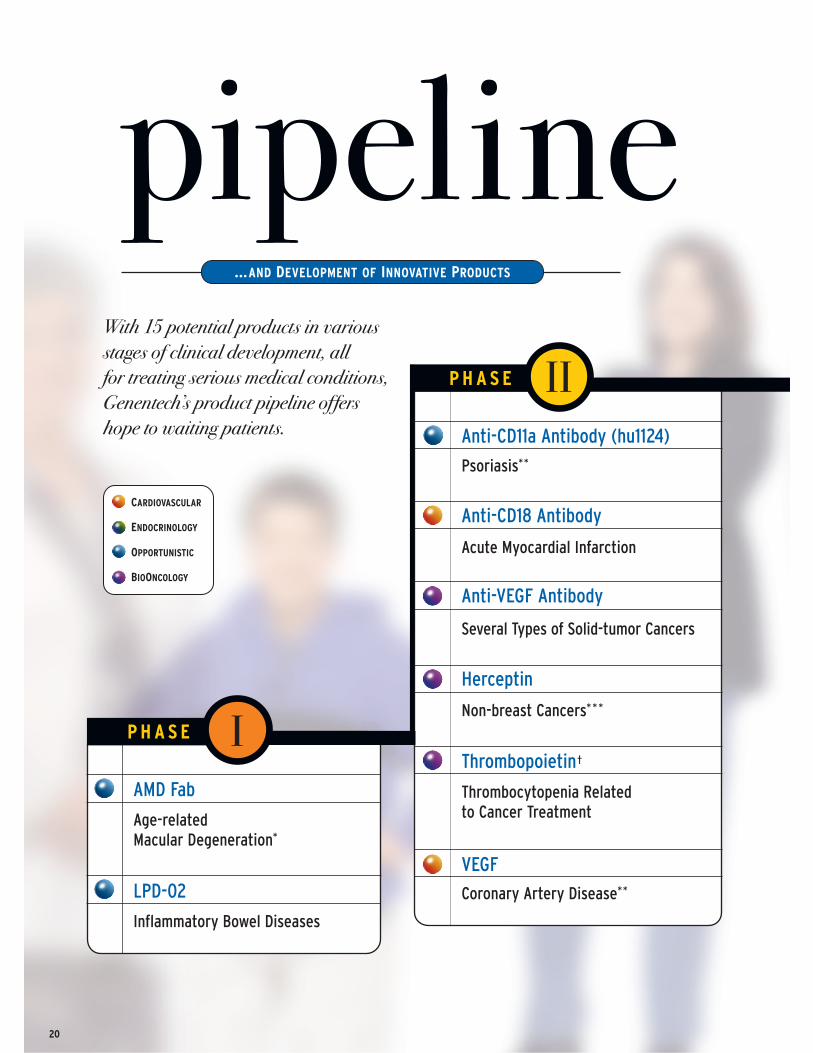
AMD Fab
Age-relatedMacular Degeneration*
LPD-02
Inflammatory Bowel Diseases
Anti-CD11a Antibody (hu1124)
Psoriasis**
Anti-CD18 Antibody
Acute Myocardial Infarction
Anti-VEGF Antibody
Several Types of Solid-tumor Cancers
Herceptin
Non-breast Cancers* * *
Thrombopoietin†
Thrombocytopenia Relatedto Cancer Treatment
VEGF
Coronary Artery Disease**
With 15 potential products in variousstages of clinical development, allfor treating serious medical conditions,Genentech’s product pipeline offershope to waiting patients.
pipelineP H A S E II
P H A S E I
20
...AND DEVELOPMENT OF INNOVATIVE PRODUCTS
CARDIOVASCULAR
ENDOCRINOLOGY
BIOONCOLOGY
OPPORTUNISTIC

Anti-IgE AntibodyAllergic Asthma, Allergic Rhinitis
Neuleze™
Diabetic Peripheral Neuropathy**
Pulmozyme
Cystic Fibrosis Early Intervention**
Rituxan
Intermediate- and High–gradeNon-Hodgkin’s Lymphoma
TNKAcute Myocardial Infarction**
Xubix™ ††
Acute Coronary Syndrome
as lifeline
P R E PA R I N G R EG U L ATO RY F I L I N G
Nutropin Depot™
Growth HormoneDeficiency in Children
P H A S E III
* Currently preparing for Phase I clinical trial.
** Patient enrollment completed.
*** Currently preparing for Phase II clinical trial.
† Pharmacia & Upjohn (P&U) has exclusiveworldwide rights for thrombopoietin (TPO).P&U and Genentech will jointly develop TPO.
†† Under clinical development by Roche.Genentech retains option rights.
21

22
Through well-designed clinical
trials, Genentech seeks to
identify whether its projects meet
certain key criteria early in the
development process. This way
the company can move only those
candidates with the highest likeli-
hood for success into more
expensive and time-consuming
late-stage clinical development.
Genentech designs late-stage trials
to provide answers needed by
regulatory authorities to defini-
tively determine safety and
efficacy as needed for seeking
marketing approval. At all stages,
Genentech works closely with
its development partners and
with regulatory authorities to
help ensure a smooth and ex-
peditious development process.
In all four of its areas of clinical
focus, Genentech made significant
progress in 1998.
BIOONCOLOGY
Besides obtaining approval for
Herceptin in 1998, Genentech
progressed with continued studies
of Rituxan and Herceptin and
with other oncology products in
its pipeline.
With partner IDEC Pharma-
ceuticals Corporation, Genentech
announced results of a small
Phase II pilot study combining
Rituxan with standard chemo-
therapy in patients with previously
untreated intermediate- or high-
grade non-Hodgkin’s lymphoma
(NHL). The two companies
continue to study this indication
in Phase III trials. Rituxan is
currently approved for a type of
low-grade NHL. Genentech is
also preparing to study Herceptin
for additional cancer indications
in Phase II clinical trials.
A Genentech antibody to the
protein vascular endothelial
growth factor (VEGF) began
Phase II clinical trials. Designed
to block the growth of new blood
vessels to growing tumors, the
anti-VEGF antibody may be
useful for treating a variety of
solid-tumor cancers, such as lung
and colon cancer.
In collaboration with Pharmacia
& Upjohn, Inc. (P&U), Genentech
continued Phase II clinical trials
of thrombopoietin (TPO). This
blood growth factor induces the
growth of platelets — cells that
assist in blood clotting. Many
cancer therapies lead to a side
effect called thrombocytopenia,
a platelet deficiency that can
lead to uncontrolled bleeding.
Genentech and P&U are investi-
gating whether TPO can prevent or
reduce the severity of thrombocy-
topenia related to cancer treatment.
ENDOCRINOLOGY
In 1998, Genentech completed
Phase III clinical trials with
Nutropin Depot, a sustained-
release growth hormone product
that may require an injection only
once or twice monthly instead of
daily. Based on positive results,
with partner Alkermes, Inc., the
company is preparing regulatory
filings to seek approval to market
Nutropin Depot for treating
growth hormone deficiency
in children.
Genentech is also investigating
a potential medicine for the
treatment of a common side effect
of diabetes called peripheral
neuropathy. This condition can
cause pain and/or numbness of the
hands and feet and can lead to
severe complications, sometimes
including amputation. Neuleze is
in a Phase III clinical trial to deter-
mine if it can ameliorate peripher-
al neuropathy in diabetic patients.
Enrollment in this trial is completed
and patient evaluation is ongoing.
CARDIOVASCULAR MEDICINE
Four potential cardiovascular
medicines developed by Genentech
are in the clinic.
Genentech scientists selectively
mutated the gene encoding
tissue-plasminogen activator to
develop TNK, a custom throm-
bolytic protein that may be easier
to administer than Activase.
Enrollment in the Phase III trial
is complete and data analysis is
under way. Genentech’s develop-
ment of TNK is designed to
support the company’s acute
thrombolytic position, as is an
ongoing Phase II trial of the
anti-CD18 antibody used in
combination with thrombolytic
therapy. This trial is studying
whether the anti-CD18 antibody
can further improve blood flow in
heart attack patients.
The other two projects in
Genentech’s cardiovascular devel-
opment portfolio may offer a
22
G E N E N T E C H ’ S P R O D U C T D E V E L O P M E N T P I P E L I N E

more sustained approach to
treating cardiovascular disease.
They have the potential to
prevent acute occurrences such as
heart attacks.
Because the clumping of platelets
is involved in the formation of
blood clots that lead to heart
attacks, Genentech’s partner
Roche is investigating Xubix, an
oral drug that blocks a receptor
on platelets involved in this
clumping. Roche is conducting
Phase III trials to determine if
Xubix can reduce the risk of
secondary heart attacks and death
in patients with acute coronary
syndrome (which includes unstable
angina and heart attacks).
Genentech retains certain U.S.
option rights to Xubix.
Genentech completed enroll-
ment in Phase II trials of VEGF as
a potential treatment for ischemic
cardiovascular disease. The trials
are studying whether VEGF can
enhance blood flow to the heart
by growing new blood vessels
to bypass blocked coronary arter-
ies in patients with advanced
cardiovascular disease.
OPPORTUNISTIC
Genentech is developing several
potential medicines that fall out-
side of its three defined areas of
medicine and into its fourth,
“opportunistic,” area of focus.
In Phase III trials, an anti-IgE
antibody is under clinical devel-
opment for two related potential
indications: allergic asthma and
allergic rhinitis (hay fever). This
antibody has the potential to
interfere early in the complex,
multistep process that leads to the
symptoms of allergies and asthma.
Genentech is investigating this
potential medicine with its part-
ners Novartis AG and Tanox
Biosystems, Inc.
Also in Phase III trials, Genentech
continues to investigate the poten-
tial benefits of managing cystic
fibrosis patients with Pulmozyme
early in the progression of their
disease, before significant symp-
toms appear. Genentech has
already gained approval for a
label change to include safety
data for the use of Pulmozyme
in patients under the age
of five. Results from this contin-
uing trial may help physicians
determine when best to begin
their cystic fibrosis patients on
Pulmozyme therapy.
With partner XOMA Ltd.,
Genentech completed enrollment
in Phase II clinical trials of an
anti-CD11a antibody as a potential
treatment for psoriasis. This anti-
body may inhibit certain white
blood cells of the immune system,
which could lead to improvement
in this autoimmune skin disorder.
With partner LeukoSite, Inc.,
Genentech is involved in investi-
gating another antibody to recep-
tors on certain white blood cells.
Preclinical studies have indicated
that these receptors may be
involved in inflammatory bowel
diseases. An antibody to these
receptors, called LDP-02, is in
Phase Ib/IIa trials as a potential
treatment for these diseases.
Genentech is also currently
planning Phase I clinical trials of
AMD Fab, a fragment of an
anti-VEGF antibody, for the
potential treatment of age-related
macular degeneration (AMD).
In this condition, abnormal blood
vessel growth in the retina of
the eye can lead to blindness.
Besides conducting clinical trials of
these potential medicines, Genentech
also develops and refines the processes
for their manufacture. The company
seeks to produce extraordinarily
complex medicines of the highest
quality. It must do so economically
and in a quantity and time frame
appropriate to supply clinical trials and,
upon approval, meet market demands.
Depending on the processes involved,
Genentech may develop production
processes for its potential medicines
in its manufacturing facilities in
either South San Francisco or —
newly opened in 1998 — Vacaville,
California. Together, excellent clinical
and manufacturing science will lead
to new opportunities for patients and
new products for Genentech’s markets.
23

14
Genentech has brought to market more biotechnology products than any othercompany, including a new oncology product introduced in 1998.
where discoveryis delivered
14
1 MAXIMIZE OUR REVENUE GROWTH
One component of Genentech’s
five-point strategy is to
maximize its revenue growth.
Genentech plans to do so by doing
more of what it is good at:
successfully introducing new
products. The company intends
to bolster the success of its
products by maintaining market
leadership in each of its thera-
peutic areas of focus, by continu-
ing to deliver clinically focused
resources to healthcare profes-
sionals and by continuing to
provide unique patient services.
BIOONCOLOGY
In 1998, Genentech successfully
launched Herceptin for the
treatment of certain patients with
metastatic breast cancer. This
followed, by about a year, the
successful launch of Genentech’s
BioOncology Initiative and of
Rituxan for treating a type of
non-Hodgkin’s lymphoma. These
events firmly placed Genentech
as a leader in certain oncology
therapeutic areas. As such,
Genentech has become increas-
ingly involved in the patient- and
medical-oncology community,
supporting a variety of programs.
For example, Genentech has
established partnerships with
various cancer associations to
develop the Cancer Survival
Toolbox.™ This set of learning
modules helps patients diagnosed
with cancer learn skills to become
better advocates for themselves
as they manage their cancer.
ENDOCRINOLOGY
Despite significant competition in
the growth hormone market,
Genentech remains a market
leader, with three growth hormone
products that together target four
indications. In 1998, Genentech
recorded additional revenues
from the latest indication,
approved in late 1997: growth
hormone deficiency in adults.
Genentech’s commitment to the
ongoing study of growth hor-
mone treatment is evident in its
observational clinical studies that
investigate long-term safety and
efficacy in patients receiving
growth hormone for its var-
ious approved indications. Such
studies provide physicians with
important information that they
can evaluate to ensure appropriate
treatment of their patients.
Genentech also provides practical
assistance to physicians. For exam-
ple, it provides patient education
materials to help the physician or
nurse ease patients’ concerns and
help promote compliance.
CARDIOVASCULAR MEDICINE
During 1998, Activase continued
to face pressure from a competi-
tive thrombolytic agent and from
a decline in the overall size of the
thrombolytic therapy market as
some heart attack patients received
mechanical reperfusion rather
than thrombolytic therapy. Despite
these pressures, Activase continues
to maintain market leadership in
the thrombolytic therapy market.
In 1998 and early 1999, Genentech
received three new patents re-
lated to variant forms of tissue-
plasminogen activator (t-PA).
The company filed patent in-
fringement suits against Centocor,
Inc., which allege that Centocor’s
sale, offer for sale, use and impor-
tation of Retavase® (Reteplase,
recombinant) rPA in the United
States infringe on these three
new Genentech patents. Genentech
is seeking a permanent injunction
and damages.

Besides enforcing intellectual property rights,
Genentech also supports its market through various
programs for patients and the medical community.
For example, Genentech supports the American
Heart Association’s Metro Stroke Task Force
program. This effort has the potential to sub-
stantially reduce crucial delays in the treatment
of stroke by educating and motivating professionals
dedicated to emergency medicine and by raising
public awareness of stroke symptoms.
Genentech is also committed to the continued
study of, and improvements in care for, heart
attack, known medically as acute myocardial
infarction (AMI). Its National Registry of Myo-
cardial Infarction (NRMI) — the world’s largest
observational study of AMI — collects, analyzes and
publishes valuable data on practice patterns and
outcomes. NRMI has demonstrated the importance
of decreasing time to treatment and has served as a
cornerstone for continued quality improvement in
the treatment of AMI.
OPPORTUNISTIC
In 1998, Genentech received approval to include
safety data for the use of Pulmozyme in patients
under age five. As a result, this medicine is now
available to eligible cystic fibrosis (CF) patients of all
age groups and at all levels of disease progression.
Genentech is committed to making the most of the
medical benefit that Pulmozyme provides through
the ongoing investigation of CF management.
Its Epidemiologic Study of Cystic Fibrosis (ESCF)
provides healthcare professionals valuable information
on treatment trends and patient outcomes. Genentech
also helps physicians by offering education and
support materials for patients.
Orbin Anderson had an acute ischemic stroke in 1997. Becauseten years earlier his wife had a stroke, she recognized hissymptoms. Orbin was rushed to the hospital, where tests confirmed he was eligible for Activase. When he arrived, Orbincould not lift his left arm; within 20 minutes after Activaseinfusion, he could. Today he has no aftereffects from hisstroke. Various programs that Genentech supports, such asthe American Heart Association’s Metro Stroke Task Force,seek to ensure that all stroke patients receive — as Orbin did —speedy medical care.
1515

Growth hormoneProtropin®
(somatrem for injection)
Growth hormone
• Growth hormone deficiency(GHD) in children
Activase®
(Alteplase, recombinant)
A tissue-plasminogenactivator
Twelve of the approved products of biotechnology stem from Genentech science.Genentech manufactures and markets seven protein-based pharmaceuticals, listed below.Other products stemming from Genentech science are licensed to other companies.
marketed productsand approved indications
Rituxan patientPaul Workman CARDIOVASCULAR
ENDOCRINOLOGY
BIOONCOLOGY
OPPORTUNISTIC
16
• Acute myocardialinfarction
• Acute ischemic strokewithin the first threehours of symptom onset
• Acute massivepulmonary embolism
Nutropin®
[somatropin (rDNAorigin) for injection]
• GHD in children
• GHD in adults
• Growth failure associatedwith chronic renalinsufficiency (CRI) priorto kidney transplantation
• Short stature associatedwith Turner syndrome
Nutropin AQ®
[somatropin (rDNAorigin) injection]
Liquid formulationgrowth hormone
• GHD in children
• GHD in adults
• Growth failure associatedwith CRI prior to kidneytransplantation
• Short stature associatedwith Turner syndrome

Herceptin®*
(Trastuzumab)
Anti-HER2 antibody
• Metastatic breastcancer in which HER2is overexpressed
Rituxan®
(Rituximab)
• Relapsed or refractorylow-grade or follicular,CD20 positive, B-cell non-Hodgkin’s lymphoma
Nutropin patientAndrew McGladdery
*New approval
Pulmozyme®
(dornase alfa, recombinant)
Inhalation Solution
• Management of cysticfibrosis (including patientsunder the age of five*)
17
ENSURING ACCESS TO NEEDED MEDICINES
Since it launched its first product, Genentech has had programs in place to ensure that U.S.
patients who need its medicines can receive them, regardless of their ability to pay.
An important service to growth hormone and BioOncology patients and their physicians
is SPOC,SM or Single Point of Contact, launched in 1997. SPOC provides customer-focused
assistance to help patients and their physicians identify resources for reimbursement.
One possible resource for uninsured U.S. patients is Genentech’s Uninsured Patients Program
(UPP). SPOC case support ensures that each patient is managed from the first call until
appropriate coverage has been identified or, if the patient is eligible, Genentech provides
medication under the UPP.
To help ensure that Activase is available to every patient who needs it, Genentech has a
financial assistance program to provide support for uninsured and underinsured patients
meeting the program’s criteria.
Genentech is aware that the numerous expenses associated with cystic fibrosis (CF)
treatment can, at times, limit patients’ access to needed therapies. This concern led
Genentech to create the Genentech Endowment for Cystic Fibrosis. The Endowment’s
purpose is to help financially needy CF patients with the cost of Pulmozyme therapy.

What is the key to discovery?
For Genentech, as the
company moves into the 21st
century, it is focusing on its areas
of expertise and asking the right
questions. And, with the benefits
of modern technology, asking —
and getting answers to — the right
questions very quickly. This is
the essence of SPDI (pronounced
speedy), Genentech’s Secreted
Protein Discovery Initiative.
SPDI builds on Genentech’s
world-class expertise in cloning
and expressing genes that encode
proteins. It also focuses on iden-
tifying the minority of proteins
that are secreted by cells. These
are the proteins most likely
to be of therapeutic interest.
SPDI uses computers and the new
technologies of bioinformatics to
search large databases of infor-
mation to find secreted proteins.
Genentech is cloning, expressing
and purifying thousands of these
secreted proteins using recombi-
nant DNA technology.
SPDI next uses dozens of bio-
logical screens to sift through the
purified proteins to find those of
potential therapeutic interest.
The biological screens were
carefully selected by Genentech
scientists with many different
areas of expertise to identify
18
innovate
to live,innovateDriven at first by innate curiosityand the never-ending “What ifs?,”Genentech scientists’ penchant toinnovate is made more urgent by a sincere desire to benefit patients.
live to
2 FURTHER OUR DISCOVERY...

proteins with therapeutic poten-
tial. These screens very quickly ask
the question of thousands of pro-
teins, “Might this protein show
activity in this area?” and very
quickly give an answer, “Yes” or
“No.” The “Yeses” are then
subjected to more thorough screen-
ing and testing to identify the most
promising therapeutic candidates.
For example, some screens seek
to identify proteins that may cause
new blood vessels to grow —
a process called angiogenesis.
These screens have already identi-
fied some promising candidates
for treating cardiovascular dis-
ease, where the growth of new
blood vessels to bypass clogged
arteries would be desirable.
By creating antibodies to such
proteins, Genentech has also
identified promising potential
cancer therapies, where blocking
new blood supplies to growing
tumors would be desirable.
Another set of screens, available
to Genentech through a partner-
ship with the National Cancer
Institute, identifies proteins that
cause a process called apoptosis —
the biologically programmed
death of cells. These screens have
identified proteins that may be
useful as cancer therapies, where
programming the death of tumor
cells would be desirable.
A third screen identifies genes
rather than proteins — specifically
genes that are amplified (exist in
multiple copies) in certain
cancers. Just as the HER2 gene’s
amplification in breast cancer led
to the development of Herceptin
to treat metastatic breast cancer,
knowledge of genes amplified
in other cancers could lead
to specific antibodies to treat
these cancers. One gene that has
so far been identified, to which
Genentech is now developing
antibodies, is amplified in colon
and lung cancers.
The beauty of SPDI is that,
because of its speed, all the
screens that Genentech employs
can practically be applied to all
the proteins to which it has
access. Therefore, certain proteins
may show activity in certain
unexpected areas that might never
have been identified with more
traditional research techniques.
And Genentech scientists with
vastly different areas of focus and
expertise are all finding uses for
SPDI that expedite and enhance
their research projects. As always,
based on their experience and
insight, Genentech scientists are
deciding what questions to ask.
With SPDI, they are getting useful
answers faster than ever.
Genentech scientist William Wood, Ph.D.,
and computer specialist Kathryn Woods are
involved in testing the hundreds of proteins
being investigated through Genentech’s
Secreted Protein Discovery Initiative (SPDI).
As always, based on their
experience and insight,
Genentech scientists are
deciding what questions
to ask. With SPDI, they
are getting useful answers
faster than ever.
19

65
HEADQUARTERSGenentech, Inc.1 DNA WaySouth San Francisco, California 94080-4990(650) 225-1000http://www.gene.com
STOCK LISTINGSGenentech, Inc. is listed on the New YorkStock Exchange and the Pacific Exchangeunder the symbol GNE.
TRANSFER AGENTCommunications concerning transferrequirements, lost certificates andchange of address should be directed toGenentech’s transfer agent:
EquiServeBoston EquiServe DivisionStockholder ServicesPost Office Box 8040Boston, MA 02266-8040Telephone: (781) 575-3400Fax: (781) 828-8813http://www.equiserve.com
ANNUAL MEETINGThe annual meeting of stockholders will beheld at 10:00 a.m. Pacific time on April 13,1999, at The Westin Hotel, 1 Old BayshoreHighway, Millbrae, California. Detailedinformation about the meeting is containedin the Notice of Annual Meeting and ProxyStatement sent with a copy of the AnnualReport to each stockholder of record as ofFebruary 16, 1999.
STOCKHOLDER INFORMATION
INTERESTED IN BIOLOGY?
Visit Access Excellence, Genentech’s site on the World WideWeb for biology teachers, their students and everyoneinterested in the latest exciting advances in the life sciences:http://www.gene.com/ae
WANT TO LEARN MORE ABOUT GENENTECH?
Visit us on the World Wide Web:http://www.gene.com
INVESTOR RELATIONSGenentech invites stockholders, security analysts, representatives ofportfolio management firms and other interested parties to contact:
Susan BentleySenior Director, Investor RelationsGenentech, Inc.1 DNA WaySouth San Francisco, California 94080-4990(650) 225-1260e-mail: [email protected]
ADDITIONAL INFORMATIONIf you need additional assistance or information regardingthe company, or would like to receive a free copy of Genentech’sForm 10-K and 10-Q reports filed with the Securities andExchange Commission, contact the Investor Relations Departmentat Genentech’s corporate offices at (650) 225-8679 or send ane-mail message to [email protected]. Or direct requestsfor literature to Genentech’s literature request line at (800) 488-6519.You may also visit Genentech’s site on the World Wide Web athttp://www.gene.com.
INDEPENDENT AUDITORSErnst & Young LLPSan Jose, California

letter“We showed that
excellent science
can indeed serve as
a foundation for solid
operating results.”
6
Arthur D. Levinson, Ph.D.President and Chief Executive Officer
February 16, 1999

to
Since I assumed the leadership of Genentech in
1995, I have reported to you each year on the
progress of our business plan. This year I do so with
particular pleasure.
1998 was one of the most significant years in
Genentech’s history. We successfully launched
Herceptin, the first monoclonal antibody for the
treatment of certain types of metastatic breast
cancer, offering enhanced survival time to some of
the most seriously ill breast cancer patients. I give
tremendous credit to Genentech employees, who
discovered Herceptin, developed it, manufacture it,
achieved its regulatory approval and launched the
new medicine, with some records set for speed and
efficiency along the way.
We also in 1998 recorded significant financial
growth. In doing so we showed that excellent
science can indeed serve as a foundation for solid
operating results. Too often our industry has seen
these two elements as representing incompatible
goals. We, however, are taking a lead in demon-
strating a new vision for business success in the
industry. Solid business results are absolutely neces-
sary for us to continue our scientific endeavors
toward benefiting people’s lives. I have gained great
satisfaction, as I hope you have, from seeing our
approach validated as our scientific efforts continue
to drive important product introductions.
Key to our success in making a solid business
of excellent science has been our strategy and
Long-Range Plan (LRP). From the start, these were
designed to be both flexible and disciplined.
In 1998, we extended our specific goals into the
middle of the first decade of the new millennium.
We reassessed our strengths and challenges and
developed a new five-point strategy for achieving
our goals — a refinement of our earlier four-point
strategy that has served us well. While we have
always been an industry leader in terms of science
and numbers of products developed, we now strive
to have leading financial results as well. For details
of our goals and the strategy for achieving them,
please see page 10 of this report.
We have shown with our success to date that
the discipline of our strategy and LRP has not
forced scientific compromise. Rather, it has spurred
further innovation, allowing us to make progress
in all operating areas within the constraints of
our budget.
And our progress has been significant. Besides the
approval of Herceptin, we also received a second
FDA approval, for a label change to include safety
information in the management of cystic fibrosis
patients younger than age five with Pulmozyme.
In its first full year on the market, Rituxan was used
to treat more than 16,000 patients worldwide — one
of the most successful introductions of any cancer
therapy. In Europe, Roche received approval to
market MabThera (marketed as Rituxan in the
United States) for a specific non-Hodgkin’s lym-
phoma indication. Our initial successes with
Genentech’s BioOncology initiative set the stage
well for the launch of Herceptin in the United States.
We also reached an agreement with Roche for
the international development and marketing
of Herceptin. This agreement provides significant
revenues to Genentech and helps ensure that this
medicine will reach patients worldwide.
stockholders
7

“While we have always been an industry leader in terms
of science and numbers of products developed, we
now strive to have leading financial results as well.”
For the remaining products in our portfolio — ourgrowth hormone products and our thrombolytic
medicine, Activase — we retained a significant market
share even in the face of continued strong competi-
tion. These product lines continue to contribute
significant revenues. For more information on our
efforts related to our seven marketed products,
please see page 14 of this report.
As we have since we launched our first product,
we continue to support programs to help ensure that
patients who need our medicines can receive them,
regardless of their ability to pay. I believe that these
programs — besides being of tremendous impor-
tance to thousands of people — are characteristic of
the fundamental ethos of Genentech and its people.
Our product pipeline fuels both our hope for
continued business success and patients’ hopes for
improved or extended lives. 1998 was a year of
tremendous progress in our pipeline, and we
are poised to learn key results for several of our
potential products in coming months. In all, we
now have 15 products in our development pipeline,
including seven in Phase III or beyond.
Even with the best science, clinical research into
new medicines occasionally identifies products
that do not work significantly well for certain
indications. This was the case with our and others’
efforts investigating tissue-plasminogen activator,
which we sell as Activase in the United States,
for the treatment of acute ischemic stroke in
patients arriving for treatment beyond three
hours after symptoms began. Activase is currently
approved and used successfully for treating acute
ischemic stroke in patients within three hours of
symptom onset, and we continue our efforts to
educate the medical community and the public
about the urgent need for emergency medical
treatment of stroke.
Occasional disappointments are to be expected in
this business, which is one reason a broad yet
focused pipeline of products is necessary for our
continued success. As you can see in the section
beginning on page 20, the potential medicines
in our pipeline represent all four of our areas
of therapeutic focus: oncology, cardiovascular
medicine, endocrinology and opportunistic (where
we pursue exciting opportunities that fall outside of
the other three defined areas). With this broad base,
even with the inevitable, occasional disappoint-
ments, I believe we are well-poised to enhance our
portfolio of marketed products in the coming years.
As pipeline products move onto the market, we
must ensure that we have the capacity to manufacture
them. In 1998, we opened a second manufacturing
facility in Vacaville, California, to provide this needed
capacity. This new facility defines state-of-the-
science for biopharmaceutical manufacturing and is
a result of excellent planning by Genentech em-
ployees, who are now readying the facility to
manufacture future supplies of Herceptin, the first
product to be manufactured there.
As projects move through our pipeline, we must
continue to build for the future by adding new ones.
For this, our discovery research efforts are essential.
Two years ago we began implementing a powerful
approach to discovering new proteins with pharma-
ceutical potential. I’m pleased to report that we are
beginning to see exciting results. I believe that this
approach, called the Secreted Protein Discovery
Initiative (SPDI), will serve well to keep our pipeline
primed for the years to come. I invite you to read
about our discovery efforts on page 18 of this report.
8

Also important to keeping our pipeline filled
are our partnerships with other companies. In fact,
such partnerships complement our efforts through
all stages of the drug development process.
Whether we are working with Abgenix, Inc.’s
technology to create new potential antibody
medicines, XOMA Ltd. to move a potential
psoriasis medicine through the clinical testing
process, IDEC Pharmaceuticals Corporation to
promote Rituxan, or Schwarz Pharma AG and
Sumitomo to make growth hormone available
worldwide, our partners’ efforts complement our
own and strengthen our business. As you can read
on page 26, powerful partnerships remain an
important component of our business strategy.
While four of the five elements of our new
five-point strategy for success are refinements of
the elements of our earlier four-point strategy, the
fifth one is new. It concerns investing in our
employees. In fact, it is primarily the articulation of
this point in our strategy that is new: we have
long recognized the value of our employees and
invested in attracting, retaining and training the
best people for the job. The fact that FORTUNE
magazine recently named Genentech to its annual
list of the “100 Best Companies to Work for in
America” is testimony to our efforts. I’m pleased
that we have added this point to our strategy,
as it will ensure that we continue to recognize and
invest in this valuable asset, and it reaffirms to our
employees that they are at the heart of our strategy
for success.
On that note, I want to thank our more than
3,300 employees for your tremendous efforts in
1998. You made our success. I also want to thank
all our stockholders for your continued support.
You enabled us to pursue our goals. And finally I
want to thank the medical community and the
patients who use or are waiting for our medicines.
In huge measure, you drive us to succeed. And we
intend to continue to do so.
We face 1999 with a midyear deadline for Roche’s
call option followed by a stockholder put option on
our stock. These will be important time points in
defining our relationship with Roche. Our best
approach to this challenge — and one that has
moved our stock price beyond the specified put
price of $60 a share — is to continue with our focus
on and commitment to implementing our plan for
continued growth. We are working hard to ensure
that whatever the outcome of our arrangement with
Roche, the spirit, culture and potential of Genentech
will continue to flourish. We are also working to
achieve financial results that will make exercising the
put option unattractive to shareholders.
In 1999 and into the next century, we remain
in business for hope,
in business for results,
in business for life.
Sincerely,
Arthur D. Levinson, Ph.D.
President and Chief Executive Officer
Also important to keeping our pipeline filled
are our partnerships with other companies. In fact,
such partnerships complement our efforts through
all stages of the drug development process.
Whether we are working with Abgenix, Inc.’s
technology to create new potential antibody
medicines, XOMA Ltd. to move a potential
psoriasis medicine through the clinical testing
process, IDEC Pharmaceuticals Corporation to
promote Rituxan, or Schwarz Pharma AG and
Sumitomo Pharmaceuticals Co., Ltd. to make our
growth hormone available worldwide, our partners’
efforts complement our own and strengthen our
business. As you can read on page 26, powerful
partnerships remain an important component of
our business strategy.
While four of the five elements of our new
five-point strategy for success are refinements of
the elements of our earlier four-point strategy,
the fifth one is new. It concerns investing in our
people. In fact, it is primarily the articulation of
this point in our strategy that is new: we have
long recognized the value of our employees and
invested in attracting, retaining and training the
best people for the job. The fact that FORTUNE
magazine recently named Genentech to its annual
list of the “100 Best Companies to Work for in
America” is testimony to our efforts. I’m pleased
that we have added this point to our strategy,
as it will ensure that we continue to recognize and
invest in this valuable asset, and it reaffirms to our
employees that they are at the heart of our strategy
for success.
On that note, I want to thank our more than
3,300 employees for your tremendous efforts in
1998. You made our success. I also want to thank
all our stockholders for your continued support.
You enabled us to pursue our goals. And finally I
want to thank the medical community and the
patients who use or are waiting for our medicines.
In huge measure, you drive us to succeed. And we
intend to continue to do so.
We face 1999 with a midyear deadline for Roche’s
call option followed by a stockholder put option on
our stock. These will be important time points in
defining our relationship with Roche. Our best
approach to this challenge — and one that has
moved our stock price beyond the specified put
price of $60 a share — is to continue with our focus
on and commitment to implementing our plan for
continued growth. We are working hard to ensure
that, whatever the outcome of our arrangement with
Roche, the spirit, culture and potential of Genentech
will continue to flourish. We are also working to
achieve financial results that will make exercising the
put option unattractive to shareholders.
In 1999 and into the next century, we remain
in business for hope,
in business for results,
in business for life.
Sincerely,
Arthur D. Levinson, Ph.D.
President and Chief Executive Officer
9
/s/ Arthur D. Levinson

into a new
*This table contains forward-looking statements, which involve risks and uncertainties, and actual results may differ materially. For a discussion of risk factorsthat may affect future revenues, including future revenues from strategic alliances and acquisitions, see "—Product Sales," "—Competition," "—Royalty andContract Revenues," and "—Uncertainties Surrounding Proprietary Rights" on pages 37 and 38. For a discussion of risk factors that may affect future netincome as a percent of revenues, see the foregoing risk factors plus "—R&D," "—Income Tax Provision," "—Year 2000," "—Market Risk," "—Credit Risk ofCounterparties" and "—Legal Proceedings" on pages 37 to 40. For a discussion of risk factors that may affect the development and approval of products, see"—Uncertainties Surrounding Proprietary Rights" on page 38 and "—R&D" on pages 37 to 38.
10
• $5 billion in revenues
• 5 significant products in late-stageclinical trials
• 5 new approved products/indications
• $500 million in revenues fromstrategic alliances or acquisitions
• 25 percent net income as apercent of revenues
Genentech’s enhanced strategy aims to help Genentech reach
its goal of becoming the world’s leading biotechnology company
by the year 2005. It does so by setting ambitious targets for
five key measures (at right). As Genentech strives to reach
these targets, the Long-Range Plan will help guide the company’s
decision-making, steering Genentech toward significant continued
growth even if each of the five targets is not reached.*
millennium

Genentech has long been recognized as
a leading biotechnology company in
terms of scientific achievement and new-
product development and introduction.
By following its four-point strategy for
success and its Long-Range Plan imple-
mented in 1995, the company has affirmed
that leadership position and has begun to
show attractive financial returns as well.
Now Genentech has fine-tuned and
enhanced its strategy for success, with its
sights set higher and further into
the future. The company has set specific
ambitious targets for the year 2005, with
the goal of becoming the world’s leading
biotechnology company. These targets
focus on five key measures: revenues,
number of products in late-stage clinical
testing, number of new approved products
and indications, revenues resulting from
alliances and acquisitions, and net income
as a percent of revenues.
Essential to achieving these targets is
a new five-point strategy, outlined on the
following pages.
Genentech’s targets and strategiesalong with its Long-Range Plan
set the course for Genentech’s goalto become the world’s leading
biotechnology company.
1 1
Committed to the success of Genentech’s Long-Range Plan,which is well-grounded in practical strategies, the company’sexecutive committee has its focus firmly set on leading Genentechinto a future of sound and continued growth. Left to right: Louis J.Lavigne, Jr.; Stephen G. Juelsgaard; Judith A. Heyboer; Susan D.Desmond-Hellmann, M.D., M.P.H.; Dennis J. Henner, Ph.D.; William D.Young; and Arthur D. Levinson, Ph.D.
Genentech has fine-tuned and enhanced its
strategy for success, with its sights set
higher and further into the future.

•
•
•
•
•
•• With successful new-product introductions and continued market leadershipin our therapeutic areas of focus.
• By delivering clinically focused resources to healthcare professionals andby providing unique patient services.
• By building on our scientific strengths, coupled with using industry-leadingtechnology to discover and develop a steady stream of protein (includingantibody) and small-molecule products.
• With well-designed preclinical and clinical trials, using products fromhighly efficient manufacturing and regulatory processes directed towardbringing new therapeutic products to patients quickly and safely.
• By initiating four new development projects each year (three from research,one from in-licensing).
• By fostering an exceptional environment that provides growth, recognitionand continuous learning, to retain and attract committed people whoseknowledge, efforts and creativity will enable our success.
12
2 FURTHER OUR DISCOVERY AND
DEVELOPMENT OF INNOVATIVE PRODUCTS
1 MAXIMIZE OUR REVENUE GROWTH
G E N E N T E C H ’ S F I V E - P O I N T S T R A T E G Y
3 INVEST IN OUR PEOPLE
G E N E N T E C H ’ S F I V E - P O I N T S T R A T E G Y

•
•
Having a clear plan in place allows Genentech to take calculated risks for its future. In 1995, withseveral potential medicines moving into late stages of clinical development, Genentech beganbuilding its new manufacturing facility in Vacaville, California. Opened in 1998, it is expected to befully operational in the third quarter of 1999, with FDA licensure to follow. It is now being readiedto manufacture the newly approved Herceptin (initially manufactured in South San Francisco) andwill be available to provide needed capacity for other products moving through Genentech’s pipeline.
Having a clear plan in place allows Genentech to take calculated risks for its future. In 1995, withseveral potential medicines moving into late stages of clinical development, Genentech beganbuilding its new manufacturing facility in Vacaville, California. Opened in 1998, it is expected to befully operational in the third quarter of 1999, with FDA licensure to follow. It is now being readiedto manufacture the newly approved Herceptin (initially manufactured in South San Francisco) andwill be available to provide needed capacity for other products moving through Genentech’s pipeline.
• With aggressive pursuit of strategic alliances, acquisitions and otherarrangements that add incremental value and growth to our discovery,development and marketed product portfolios.
• With profitable growth and productivity measured by net income as a percentage of revenues that is in the top quartile of the industry.
4 LEVERAGE OUR ASSETS
5 IMPROVE OUR FINANCIAL RETURNS
This five-point strategy serves both as a guide for Genentech’s actions and as a measure for itssuccess. It is geared toward enabling the company to continue its pursuit of excellent sciencedirected toward addressing further unmet medical needs, while at the same time building value forstockholders and providing new opportunities for employees. Although these goals are ambitious,Genentech’s management and its employees are committed to the five-point strategy to achieveGenentech’s next goals. Guided by the Long-Range Plan, Genentech’s management intends to leadthe company into a new millennium of success for stockholders, for employees, for medicalproviders and, most important, for patients in need.
13