board of directors agenda - part 1 - yeovil hospital
TRANSCRIPT

BOARD OF DIRECTORS
This is to advise that there will be a meeting of the Board of Directors on Wednesday 20 November 2013 at 9:00am
in the Boardroom, Level 1, Yeovil District Hospital NHS Foundation Trust
AGENDA - PART 1
Presenter 1 APOLOGIES 2 DECLARATIONS OF INTEREST Members of the Board are required to make known any
interests relating to items on the current agenda
3 MINUTES OF THE PREVIOUS MEETING HELD ON
16 OCTOBER 2013 PW Appendix
To APPROVE the Minutes of the Board of Directors’ meeting
held on 16 October 2013
4 ACTION SHEET PW Appendix 5 MATTERS ARISING PW Oral 6 PATIENT STORY HR Presentation To DISCUSS a patient story and to DISCUSS the current
approach to patient stories
7 CHIEF EXECUTIVE’S REPORT PM Appendix To DISCUSS the key current issues affecting the Trust 8 FRANCIS REPORT PROGRESS HR Oral + presentation To DISCUSS the Trust’s progress in implementing the
proposals
PERFORMANCE REPORT 9 OPERATING & FINANCIAL PERFORMANCE OVERVIEW TN Appendix To DISCUSS the overall performance of the Trust 10 FINANCE REPORT TN Oral To DISCUSS any specific matters relating to Finance 11 CLINICAL QUALITY REPORT JHo & HR Appendix To NOTE the Clinical Quality Report and to DISCUSS any

specific matters relating to Clinical Quality 12 SERVICE DELIVERY REPORT JHig + SD Oral To DISCUSS any specific matters relating to Service Delivery 13 WORKFORCE REPORT MP Appendix To NOTE the Workforce Report and to DISCUSS any specific
matters relating to Workforce
14 CHIEF FINANCE AND COMMERCIAL OFFICER’S REPORT TN Appendix To DISCUSS any specific matters relating to the Chief Finance
and Commercial Officer’s remit
15 ASSURANCE COMMITTEE MINUTES / REPORTS PW To NOTE the minutes of the following meeting: CGAC – 8 November 2013 JHen Appendix 16 ESTATES MASTER PLAN TN Presentation To RECEIVE a presentation on and to DISCUSSS the Estates
Master Plan
ITEMS TO NOTE 17 BOARD EVALUATION PROCESS SC Appendix To NOTE the arrangements for undertaking a Board
evaluation exercise.
18 MEDICAL STAFF APPRAISAL RATE ACTION PLAN JHo Appendix To NOTE the action plan to be submitted to NHS England 19 ANY OTHER BUSINESS 20 EXCLUSION OF THE PUBLIC PW Oral
To RESOLVE to exclude the public from the rest of the meeting by passing the following resolution: The Board of Directors resolves to exclude the public from the rest of the meeting because publicity would be prejudicial to the public interest by reason of the confidential nature of the business to be transacted or for other reasons arising from the nature of the business and the proceedings.
20 DATES AND TIMES OF FUTURE MEETINGS AND EVENTS There will be a meeting of the Board of Directors on
Wednesday 18 December at 9.00am in the Boardroom, Level 1, Yeovil District Hospital

1
APPENDIX Board of Directors
16 October 2013
BOARD OF DIRECTORS
Minutes of the meeting of the Board of Directors held on Wednesday 16 October 2013 at Yeovil District Hospital
Present: Peter Wyman [PW] Chairman Paul Mears [PM] Chief Executive Maurice Dunster [MD] Non-Executive Director Julian Grazebrook [JG] Non-Executive Director Jane Henderson [JH] Non-Executive Director Paul von der Heyde [PH] Non-Executive Director Mark Saxton [MS] Non-Executive Director Jonathan Howes [JHo] Medical Director & Deputy Chief Executive Tim Newman [TN] Chief Finance & Commercial Officer Helen Ryan [HR] Interim Director of Nursing & Clinical
Governance In Attendance: Susan Davies [SD] Director of Elective Care Jonathan Higman [JHig] Director of Urgent Care & Long Term
Conditions Mark Power [MP] Director of Workforce and HR Simon Blackburn [SB] Head of Communications and Marketing Simon Chase [SC] Company Secretary Nicola Webber Minutes Michael Fernando Staff Governor Yvonne Thorne Head of Operations – for item 168/13 Michelle Dorrian Portering Manager – for item 168/13 Jamie Hewlett Portering Supervisor – for item 168/13 Apologies: None
Action 162/13 DECLARATIONS OF INTEREST
The Chairman declared that he is Treasurer and a member of the Council of the University of Bath. Mark Power declared that he is Director of Workforce & HR for Dorset County Hospital NHS Foundation Trust.
163/13 APOLOGIES AND WELCOME There were no apologies. The Chairman welcomed Michael Fernando, Staff Governor, and asked him to participate freely but to respect the confidentiality of the topics discussed in part 2.
164/13 MINUTES OF THE PREVIOUS MEETING The minutes of the meeting held on 18 September 2013 were AGREED.
165/13 ACTION SHEET

Page 2
The Board NOTED the action sheet.
166/13 MATTERS ARISING There were no matters arising
167/13 CHIEF EXECUTIVE’S REPORT Paul Mears spoke to his report and the Board discussed a number of items. The Board welcomed the appointment of Dr Berge Balian as Associate Medical Director for Primary Care. The Chairman reported that he has invited the Deputy Chairman of NHS England to attend the Board meeting in March 2014. The Board considered progress on the Symphony Project and in particular the risks associated with and resources required for fully developing the alliance contract model. Mr Mears also reported on a visit from healthcare staff from Canterbury, New Zealand who are approximately three years ahead in the implementation of a similar project. Mr Mears updated the Board on the latest position of the Stroke review; the final decision is expected from the CCG following their Board meeting in December. The Board acknowledged Simon Chase is leaving the Trust at the end of the year and thanked him for his contribution as Company Secretary. The Board NOTED the Monitor Quarter 1 report.
168/13 PATIENT STORY Yvonne Thorne, Head of Operations, introduced colleagues from the Trust’s portering service: Michelle Dorrian, Portering Manager and Jamie Hewlett, Portering Supervisor. Yvonne Thorne described an unusual patient story involving an incident in a non-clinical area. This was of interest to the Board as it shed light on the role played by the support teams such as portering staff in ensuring there is both good and dignified patient care throughout the whole of the patient journey. The Board asked a number of questions and the issues noted included the serious nature of the incident, the fact that it occurred in a public place and the problems of using equipment that relied on electrical power in an open area and in inclement weather. In particular, the episode highlighted the importance of the portering staff and the range of demands that fall upon them. The Chairman expressed his thanks to all the teams involved and asked that his thanks be passed on to all the members of the teams.
169/13
FRANCIS REPORT PROGRESS Helen Ryan summarised areas of progress including: leadership

Page 3
development; raising concerns; the NHS Constitution; patient experience and learning from complaints; safe staffing levels. It was AGREED that the NHS Constitution would be circulated to the Board. Helen Ryan presented briefly on the way in which the Trust Risk Register is being restructured and made more accessible. She also used some risk examples to demonstrate how they would be reviewed and managed. The Board welcomed the developments but encouraged the improvements to be made rapidly, and also highlighted the importance of identifying extremely rare events which could have a potentially catastrophic consequence. Helen Ryan confirmed that the new approach has been shared with the internal auditors. The Chairman re-stated that a key recommendation of Francis Report was to review the effectiveness of the Board. The review will be undertaken in early 2014.
SC
170/13 KEY QUALITY METRICS Jon Howes explained that further work had been done on identifying a set of standard metrics to report publicly on the Trust’s performance. The metrics will include the Hospital Standardised Mortality Rate, Friends and Family test, Emergency Department performance, Referral to Treatment time and infection control. Other topical items will be added. The Patients Association will be asked for their opinion on these data. The Board was informed that the mechanisms are now in place for the website and the intranet. Simon Blackburn reported on progress in placing patient information screens in strategic locations within the hospital. The information on the screens would be controlled by the communications team. Mr Blackburn is also exploring the scope for using the metrics on social media and they will be incorporated in the regular Chief Executive’s column the Western Gazette will be running. Consistency and repetition will be key factors in successfully conveying a good understanding of the Trust’s performance to the public and local health community. Mr Mears drew the Board’s attention to recent publicity about a visiting French ophthalmologist who had operated on some patients at YDH 10 years ago. The clinician has been struck off by the GMC. The Western Gazette online headline had been misleading and concerning. Mr Mears also updated the Board on NHS Choices’ treatment of the Friends and Family test. The exclamation mark and warning symbols will no longer be used.
171/13 THE CASE FOR CHANGE The Board considered the ‘Case for Change’ document, which Paul Mears introduced. The Board agreed that the Trust had focused carefully on its risks and how to respond to them. It was important that the paper’s proposals did not result in a slowing of the pace the Trust had set, or that the paper’s focus on Somerset should not jeopardise the partnership with

Page 4
Dorset County Hospital which the Trust has already established. There was a need to strike a balance between maintaining the Trust’s own progress and playing a full part in the Somerset health community’s concerns. The Board discussed the document and strongly supported the analysis of the collective challenge for the health and social care system in the county. However, it agreed that the response should also put down markers relating to the concerns the Trust had, plus the lack of primary care engagement which needed strengthening to ensure the proposal would address some of the real challenges currently being faced by GPs. The Board also expressed concern at the size of the proposed Transformation Board with the attendant risks that this could bring in terms of decision making and speed of action. In further discussion it was agreed that an approach embodied in the Symphony project was the best response to the issues facing the heath community and that the opportunity to develop the same methodology for the whole county was a positive opportunity. The Board noted that the current countywide programme boards for frail elderly and urgent care had had limited impact and that with the establishment of the Transformation Board there should also be a review of the existing working groups to streamline activity and focus on the biggest challenge of managing the demographic pressures facing the NHS and social care. The Board AGREED that a draft minute would be circulated to confirm that the concerns raised were accurately expressed.
SC
172/13 PERFORMANCE REPORT The Board considered the new-style report and Mr Mears asked for feedback about its clarity and potential improvement to be given to Tim Newman. Directors were invited to add any updates or draw attention to any particular issues that warranted consideration. The Board noted the extremely strong performance on referral to treatment times; although not included in the report the 15 and 17 week performances are good. The Board was also pleased to note the reductions in the average length of stay. It discussed ambulance turnaround times and the aim to avoid any possible fines. The Trust’s performance is extremely good compared to the rest of the region. A number of initiatives will improve the stroke performance of enabling patients to be admitted to and to stay on the Stroke unit. Mr Higman confirmed that patients who need to stay on the unit are being accommodated there. Pressure ulcers have reduced, as have the number of falls resulting in harm. Further work is being done to reduce the overall number of falls. The CQUIN dashboard is being developed.

Page 5
Tim Newman confirmed that the September budget surplus remains on track. Helen Ryan reported briefly on some clinical quality items. Work on complaints management is continuing. The patient experience work should address some issues that precipitate complaints. Helen Ryan reported on Neil Tomlin’s success in obtaining promotion and that this will mean he will be leaving the Trust by the end of 2013. The Board noted the Workforce Report which will eventually be integrated into the main performance report. Mark Power reported that most indicators are green and that sickness absence has reduced to 2.8%. The Board noted the appraisal performance by department, indicating the weaker areas. The new appraisal recording process is expected to improve compliance. The Chairman noted the reduction in the headcount and asked if this was affecting the Trust’s services. The executive team confirmed that this had not led to a deterioration in the quality of services.
173/13 CHIEF FINANCE AND COMMERCIAL OFFICER’S REPORT This was NOTED.
174/13 ASSURANCE COMMITTEE MINUTES The Clinical Governance Assurance Committee minutes were NOTED. Maurice Dunster provided an oral update on the Patient Experience Committee held on 8 October 2013. The meeting had addressed a number of matters and it will be involving the Patient’s Association in their work.
175/13 WINTER PLAN Jonathan Higman gave a brief presentation on the key points of how the Trust is preparing to manage the anticipated ‘winter’ pressures. The most significant demand is historically from January onwards. Operationally the time from 3pm-9pm is the most pressurised, with demand for beds approximately 20% above the midnight position. The focus will be on optimal management of patient flow through the system. The Board was informed of a range of actions which are being put in place to achieve this. The Board supported planned approach to managing the pressures.
176/13 REVISIONS TO SFIs & SCHEME OF DELEGATION The Board APPROVED the Standing Financial Instructions and the Scheme of Reservation and Delegation.
177/13 MONITOR Q2 RETURN PROCESS
The Board APPROVED the approach to seeking Board approval of the Monitor Quarter 2 return via email.
178/13 ANNUAL ORGAN DONATION TRUST REPORT 2012/13 AND STRATEGIC PLAN 2013/14

Page 6
This was NOTED.
179/13 ANY OTHER BUSINESS There was no other business.
180/13 EXCLUSION OF THE PUBLIC The Board RESOLVED to exclude the public from the rest of the meeting.
181/13 DATE OF NEXT MEETING The next meeting will be held on Wednesday 20 November 2013.
1
APPENDIX BOARD OF DIRECTORS
20 NOVEMBER 2013
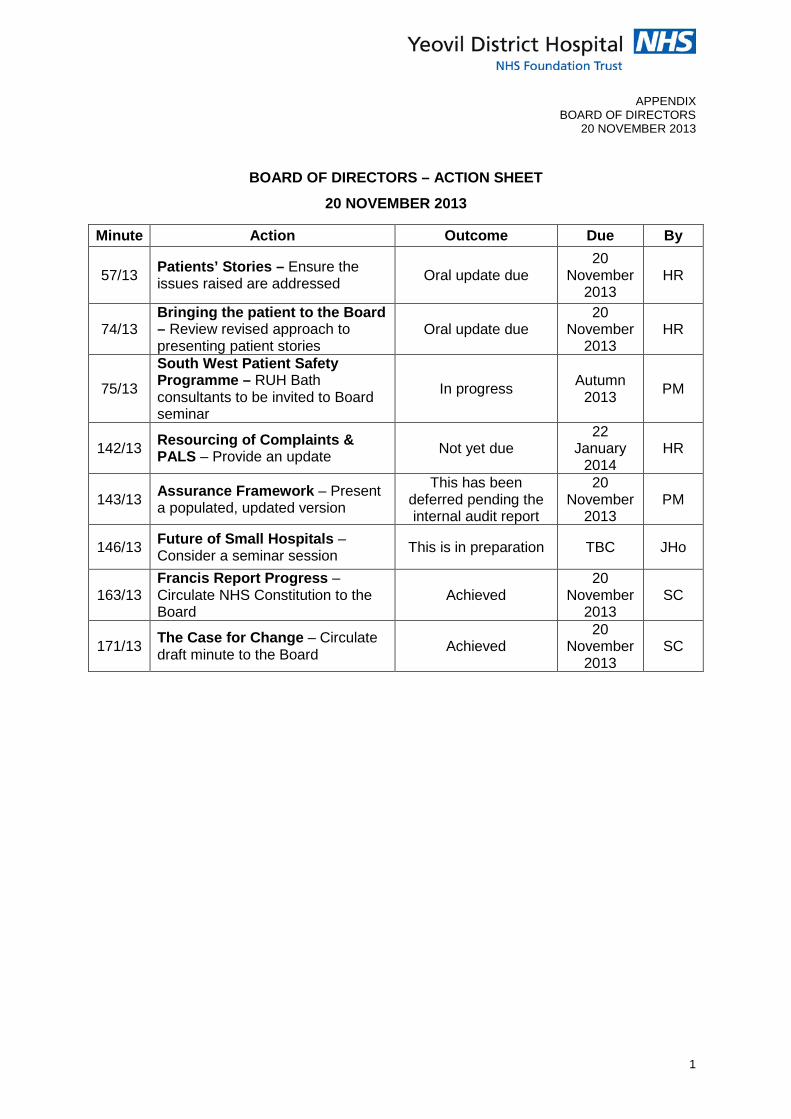
BOARD OF DIRECTORS – ACTION SHEET
20 NOVEMBER 2013
Minute Action Outcome Due By
57/13 Patients’ Stories – Ensure the issues raised are addressed Oral update due
20 November
2013 HR
74/13 Bringing the patient to the Board – Review revised approach to presenting patient stories
Oral update due 20
November 2013
HR
75/13
South West Patient Safety Programme – RUH Bath consultants to be invited to Board seminar
In progress Autumn 2013 PM
142/13 Resourcing of Complaints & PALS – Provide an update Not yet due
22 January
2014 HR
143/13 Assurance Framework – Present a populated, updated version
This has been deferred pending the internal audit report
20 November
2013 PM
146/13 Future of Small Hospitals – Consider a seminar session This is in preparation TBC JHo
163/13 Francis Report Progress – Circulate NHS Constitution to the Board
Achieved 20
November 2013
SC
171/13 The Case for Change – Circulate draft minute to the Board Achieved
20 November
2013 SC

Report to: Board of Directors Report from: Chief Executive Officer Subject: Chief Executive’s Report Date: 20th November 2013 Symphony Project
As you will know unfortunately we were not successful in our bid to become a Pioneer for integrated care. This is disappointing particularly as we had submitted a strong case and put in much work to developing the bid. However there is a very clear commitment from the Symphony project board that we will continue to take forward the Symphony work and a belief that it is a real opportunity to transform the way in which we deliver services across the local health and social care system.
There have been a number of events in the past month involving staff, patients and carers from across the partner organisations and the work to develop a new alliance contract model is also gathering pace. Much of this work is breaking new ground and will require a significant level of trust between the partners to make it a success. I believe that the work that has been done in the past fifteen months to build momentum and a shared understanding across the Symphony partners will ensure we are able to manage the inevitable operational challenges as they arise.
Somerset Case for Change
At our last meeting Board members considered the Somerset Case for Change paper produced by the Health and Social Care partners in the county. Since that meeting the Chief Executives from the three NHS providers, the CCG and the County Council have met to discuss the next steps and to agree how we prioritise the areas of work to develop services across the county.
One of the major areas of work is how we manage the increase in older people living with complex long term conditions and this very much builds on the work we are undertaking locally through the Symphony project. I have undertaken to put together a paper for the CEO group describing what an integrated care model could look like across acute, community, primary and social care and this will be shared within the next two weeks.
It is clear from discussions in the CEO group that there is a significant challenge in all of our organisations to manage the increase in demand at a time when resources are extremely limited. We will ensure that YDH plays an active part in these discussions to build on our own organisational strategy of collaboration and partnership being key to our success.
Contract 14/15
We have met with the CCG and begun discussions on the contract for the next financial year. Monitor has recently written to all trusts alongside NHS England, the Trust Development Agency and the Local Government Association to set out the combined expectations of these organisations with regard to planning for the next year. There is a

clear expectation that trusts with their commissioners and local authority will have a joined-up and integrated approach to the contracting discussions for the coming year.
We are also working with the CCG to discuss the implications of the Integration Transformation Fund which will come into action in 15/16. This is the national move to transfer NHS money to support developments in social care recognising the critical role this sector has on ensuring the best quality care for patients particularly in their own homes. We are already discussing this with the CCG and thinking through how this is also an opportunity to support the transformation of integrated care as part of the Symphony project.
SmartCare
The procurement process for SmartCare (the name for the Electronic Health Record project) is in process and five potential suppliers have been identified to proceed to the next stage of procurement. We are working closely with colleagues in the partner trusts to ensure our clinical teams are fully involved in the procurement decisions.
The work on SmartCare is being led at YDH by Jonathan Smith who has recently joined us as Project Director for the programme. Jonathan is currently reviewing our internal governance arrangements for the programme and will be providing updates to the relevant assurance committee.
I have also agreed that given the importance of SmartCare to our clinical operations it is appropriate that Jon Howes is the Senior Responsible Officer for the programme.
iCARE Awards
Many of the board were fortunate to attend the first of the new iCARE staff awards on the 22nd October. This event brought together over 200 staff to celebrate the achievements of staff and volunteers working in Yeovil Hospital.
The evening was a great success and a real showcase for the great work of people across the organisation. Many people have commented since the event on the positive effect it had on morale for people who attended and on the organisation and professionalism of the event.
I would like to thank Simon Blackburn and the organising committee for the hard work and effort that went into the preparation of the ceremony and congratulate all the nominees and winners in the award categories.
Head of Midwifery
I would like to congratulate Neil Tomlin who has been successful in applying for a post of Local Supervisor of Midwives in Yorkshire. Neil will be leaving the trust at the end of the year and we wish him well in his new post.
Helen Ryan has been reviewing the post of Head of Midwifery and we are currently discussing with the Midwifery team and the Obstetric consultants how we could fill this post moving forward. This is an important role and we are committed to ensuring we find the right solution to provide the appropriate level of professional supervision to our midwives.

11/14/2013
Operating & Financial
Performance Overview
September 2013 – Month 6

11/14/2013
2
Section Title Page
CONTENTS
1 Operational Performance
2 Financial Performance Summary 3 Appendix - Financial Detail

11/14/2013
Mortality [1/2]
3
HSMR in August 13 was 85.6 (13.7 higher than August 12), reducing steadily over the last 12 months Actual number of deaths in October 13 was 62, the highest since April 13
0.0
20.0
40.0
60.0
80.0
100.0
120.0
140.0
Apr-1
0
Jul-1
0
Oct
-10
Jan-
11
Apr-1
1
Jul-1
1
Oct
-11
Jan-
12
Apr-1
2
Jul-1
2
Oct
-12
Jan-
13
Apr-1
3
Jul-1
3
Hospital Standardised Mortality Ratio (HSMR)
6 month moving average
0102030405060708090
Apr-1
0
Jul-1
0
Oct
-10
Jan-
11
Apr-1
1
Jul-1
1
Oct
-11
Jan-
12
Apr-1
2
Jul-1
2
Oct
-12
Jan-
13
Apr-1
3
Jul-1
3
Actual number of deaths
6 month moving average

11/14/2013
Mortality [2/2]
4
907 deaths YTD, Care of the Elderly and General Medicine have the highest number deaths.
0 100 200 300 400 500 600
Gynaecology
Gastroenterology
Urology
Paediatrics
Cardiology
Orthopaedics
General Surgery
Care of the Elderly
General Medicine
YTD Deaths by Specialty
60 80 100 120 140 160
Sunday
Saturday
Friday
Thursday
Wednesday
Tuesday
Monday
YTD Deaths by Day of Week

11/14/2013
Safety
5
Patient falls in October were 72 with spikes in Feb and Mar 13. The last reported case of MRSA was in Mar 13 with only 4 cases in the last 3 years. Pressure ulcers are on a decreasing trend, data is unavailable for 10/11.
0
1
2
Apr-1
0
Jul-1
0
Oct
-10
Jan-
11
Apr-1
1
Jul-1
1
Oct
-11
Jan-
12
Apr-1
2
Jul-1
2
Oct
-12
Jan-
13
Apr-1
3
Jul-1
3MRSA
Monthly data 6 month moving average
0
20
40
60
80
100
120
140
Apr-1
0
Jul-1
0
Oct
-10
Jan-
11
Apr-1
1
Jul-1
1
Oct
-11
Jan-
12
Apr-1
2
Jul-1
2
Oct
-12
Jan-
13
Apr-1
3
Jul-1
3
Oct
-13
Patient falls
Monthly data 6 month moving average
012345678
Apr-1
0
Jul-1
0
Oct
-10
Jan-
11
Apr-1
1
Jul-1
1
Oct
-11
Jan-
12
Apr-1
2
Jul-1
2
Oct
-12
Jan-
13
Apr-1
3
Jul-1
3
C difficile cases
Monthly data 6 month moving average
0
5
10
15
20
25
30
Apr-1
0
Jul-1
0
Oct
-10
Jan-
11
Apr-1
1
Jul-1
1
Oct
-11
Jan-
12
Apr-1
2
Jul-1
2
Oct
-12
Jan-
13
Apr-1
3
Jul-1
3
Oct
-13
Pressure ulcers +2
Monthly data 6 month moving average

11/14/2013
RTT [1/2]
6
In September 97.1% (target 90%) of admitted patients and 98.0% (target 95%) of non-admitted patients started consultant-led treatment within 18 weeks of referral.
75.0%
80.0%
85.0%
90.0%
95.0%
100.0%
Apr-1
0
Jul-1
0
Oct
-10
Jan-
11
Apr-1
1
Jul-1
1
Oct
-11
Jan-
12
Apr-1
2
Jul-1
2
Oct
-12
Jan-
13
Apr-1
3
Jul-1
3
RTT completed pathways - 18 week - admitted
6 month moving average RTT target
75%
80%
85%
90%
95%
100%
Apr-1
0
Jul-1
0
Oct
-10
Jan-
11
Apr-1
1
Jul-1
1
Oct
-11
Jan-
12
Apr-1
2
Jul-1
2
Oct
-12
Jan-
13
Apr-1
3
Jul-1
3
RTT completed pathways - 18 week - non admitted
6 month moving average RTT target
0.0%
20.0%
40.0%
60.0%
80.0%
100.0%
120.0%
Apr-1
0
Jul-1
0
Oct
-10
Jan-
11
Apr-1
1
Jul-1
1
Oct
-11
Jan-
12
Apr-1
2
Jul-1
2
Oct
-12
Jan-
13
Apr-1
3
Jul-1
3RTT incompleted pathways - 18 week - admitted
6 month moving average RTT target
75%
80%
85%
90%
95%
100%
Apr-1
0
Jul-1
0
Oct
-10
Jan-
11
Apr-1
1
Jul-1
1
Oct
-11
Jan-
12
Apr-1
2
Jul-1
2
Oct
-12
Jan-
13
Apr-1
3
Jul-1
3
RTT incompleted pathways - 18 week - non admitted
6 month moving average RTT target

11/14/2013
RTT [2/2]
7
01,0002,0003,0004,0005,0006,0007,000
Apr-1
2
May
-12
Jun-
12
Jul-1
2
Aug-
12
Sep-
12
Oct
-12
Nov
-12
Dec-
12
Jan-
13
Feb-
13
Mar
-13
Apr-1
3
May
-13
Jun-
13
Jul-1
3
Aug-
13
Sep-
13
RTT incomplete pathways
RTT incomplete pathways
0
50
100
150
200
250
300
Apr-1
2
May
-12
Jun-
12
Jul-1
2
Aug-
12
Sep-
12
Oct
-12
Nov
-12
Dec-
12
Jan-
13
Feb-
13
Mar
-13
Apr-1
3
May
-13
Jun-
13
Jul-1
3
Aug-
13
Sep-
13
RTT incomplete pathways > 18 weeks
RTT incomplete pathways > 18 weeks
There are 134 admitted patients and 97 non-admitted patients that are currently waiting longer than 18 weeks, 55 of these patients are waiting over 26 weeks. Three specialities where RTT % is less than 93% target, Oral, Neurology and General Surgery.
020406080
100120140160
19 w
eeks
20 w
eeks
21 w
eeks
22 w
eeks
23 w
eeks
24 w
eeks
25 w
eeks
26+
wee
ks
RTT Incomplete pathways - Aging
Non Admitted Admitted
Patients that delay treatment through choice are counted as an incomplete pathways until they receive their treatment, or it is decided that they don’t need treatment. Patient choice only changes things once they have received an admitted treatment (non-admitted stops aren’t adjusted for patient choice)

11/14/2013
Waiting lists
8
0500
1000150020002500300035004000
Apr-1
0
Jun-
10
Aug-
10
Oct
-10
Dec-
10
Feb-
11
Apr-1
1
Jun-
11
Aug-
11
Oct
-11
Dec-
11
Feb-
12
Apr-1
2
Jun-
12
Aug-
12
Oct
-12
Dec-
12
Feb-
13
Apr-1
3
Jun-
13
Aug-
13
Oct
-13
Waiting Lists
OP Waiting List Size IP/DC Waiting List Size
In October 13, OP waiting increased by 318, IP/DC decreased by 314 patients.
Numbers above are live waiting list patients, they include patients that have chosen to delay their treatment. Currently it is difficult to identify these patients due to the booking methods i.e. this information is only in the form of a “comment”. Previously we used a separate waiting list code, which enabled us to exclude these patients from our reports. This stopped to increase visibility of all patients. The above numbers do not include planned or suspended patients i.e. medically unfit or regular future bookings i.e. endoscopies
Outpatients waiting list - patients that have been referred but not yet seen. Inpatients/Day cases – patients that have been referred for elective admissions but not yet treated.

11/14/2013
Day Case Admissions
9
Day case admissions (1,257) were 84% of total elective admissions. This mix has remained stable between 80% and 86% since April 2010. 52% of all day cases are in 3 specialities – Gastroenterology (19%), General Surgery (18%), Medical Oncology (15%)
0
500
1,000
1,500
2,000
2,500
Apr
-10
Jul-1
0
Oct
-10
Jan-
11
Apr
-11
Jul-1
1
Oct
-11
Jan-
12
Apr
-12
Jul-1
2
Oct
-12
Jan-
13
Apr
-13
Jul-1
3
Day Case admissions
Total Elective admissions Day Case admissions
0200400600800
100012001400
Gast
roen
tero
logy
Gene
ral S
urge
ry
Med
ical
Onc
olog
y
Ort
hopa
edic
s
Haem
atol
ogy
Oph
thal
mol
ogy
Gyna
ecol
ogy
Derm
atol
ogy
Gene
ral M
edic
ine
Ora
l Sur
gery
Plas
tic S
urge
ry
Uro
logy
Rheu
mat
olog
y
Neu
rolo
gy
Care
of t
he E
lder
ly
ENT
Card
iolo
gy
Paed
iatr
ics
Thor
acic
Med
icin
e
YTD day cases
11/14/2013
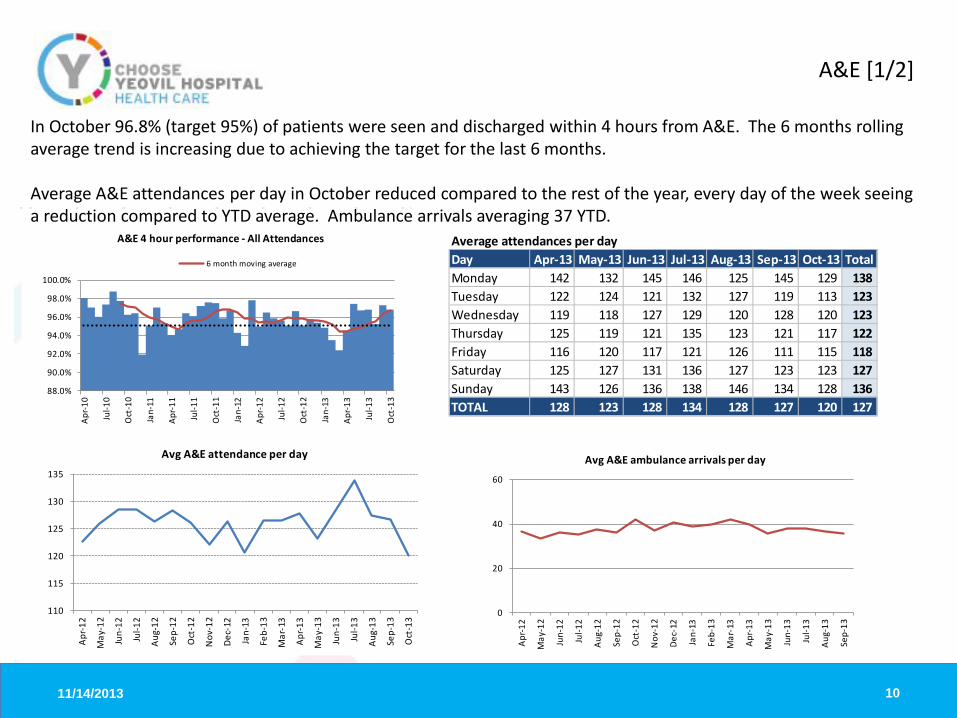
A&E [1/2]
10
88.0%
90.0%
92.0%
94.0%
96.0%
98.0%
100.0%
Apr-1
0
Jul-1
0
Oct
-10
Jan-
11
Apr-1
1
Jul-1
1
Oct
-11
Jan-
12
Apr-1
2
Jul-1
2
Oct
-12
Jan-
13
Apr-1
3
Jul-1
3
Oct
-13
A&E 4 hour performance - All Attendances
6 month moving average
In October 96.8% (target 95%) of patients were seen and discharged within 4 hours from A&E. The 6 months rolling average trend is increasing due to achieving the target for the last 6 months. Average A&E attendances per day in October reduced compared to the rest of the year, every day of the week seeing a reduction compared to YTD average. Ambulance arrivals averaging 37 YTD.
Average attendances per dayDay Apr-13 May-13 Jun-13 Jul-13 Aug-13 Sep-13 Oct-13 TotalMonday 142 132 145 146 125 145 129 138Tuesday 122 124 121 132 127 119 113 123Wednesday 119 118 127 129 120 128 120 123Thursday 125 119 121 135 123 121 117 122Friday 116 120 117 121 126 111 115 118Saturday 125 127 131 136 127 123 123 127Sunday 143 126 136 138 146 134 128 136TOTAL 128 123 128 134 128 127 120 127
110
115
120
125
130
135
Apr-1
2
May
-12
Jun-
12
Jul-1
2
Aug-
12
Sep-
12
Oct
-12
Nov
-12
Dec-
12
Jan-
13
Feb-
13
Mar
-13
Apr-1
3
May
-13
Jun-
13
Jul-1
3
Aug-
13
Sep-
13
Oct
-13
Avg A&E attendance per day
0
20
40
60
Apr-1
2
May
-12
Jun-
12
Jul-1
2
Aug-
12
Sep-
12
Oct
-12
Nov
-12
Dec-
12
Jan-
13
Feb-
13
Mar
-13
Apr-1
3
May
-13
Jun-
13
Jul-1
3
Aug-
13
Sep-
13
Avg A&E ambulance arrivals per day

11/14/2013
A&E [2/2]
11
A&E activity increased by 5% in 12/13 vs 11/12, mainly due to spikes in June (+7.2%), August (8.8%), September (7.3%) and December (+13.1%). October activity is down compared to September by 2.1% (3,722) and lower than previous year by 4.9%. November activity month to date (as at 12th Nov), is 1.8% down on prior month (1,454 attendances vs 1,481) YTD, activity is up on last year by 0.1%.
30003200340036003800400042004400
Apr-1
0
Jul-1
0
Oct
-10
Jan-
11
Apr-1
1
Jul-1
1
Oct
-11
Jan-
12
Apr-1
2
Jul-1
2
Oct
-12
Jan-
13
Apr-1
3
Jul-1
3
A&E Activity
6 month moving average
-10.0%
-5.0%
0.0%
5.0%
10.0%
15.0%
Apr-1
0
Jul-1
0
Oct
-10
Jan-
11
Apr-1
1
Jul-1
1
Oct
-11
Jan-
12
Apr-1
2
Jul-1
2
Oct
-12
Jan-
13
Apr-1
3
Jul-1
3
Oct
-13
% increase/decrease vs LY
80
90
100
110
120
130
140
150
160
170
01/0
8/20
13
08/0
8/20
13
15/0
8/20
13
22/0
8/20
13
29/0
8/20
13
05/0
9/20
13
12/0
9/20
13
19/0
9/20
13
26/0
9/20
13
03/1
0/20
13
10/1
0/20
13
17/1
0/20
13
24/1
0/20
13
31/1
0/20
13
07/1
1/20
13
A&E Attendances by day

11/14/2013
Ambulance targets
12
We have achieved the 30 minute handover target (98%) for the last 5 months running. YTD fines total £23,000 , mainly due to spike in April of £16,800, the same period last year fines were £8,295 but this is due to the fine structures changing for 13/14 as actual Ambulance Handover breaches are currently 71 YTD compared with 361 for the same period last year.
NOTES: Ambulance fines for over 30mins only began in April 2011 Imposed Fines have changed each year but have always been based on breaching 30 mins or more
88.0%90.0%92.0%94.0%96.0%98.0%100.0%102.0%
£0£2,000£4,000£6,000£8,000
£10,000£12,000£14,000£16,000£18,000
Apr-1
2
May
-12
Jun-
12
Jul-1
2
Aug-
12
Sep-
12
Oct
-12
Nov
-12
Dec-
12
Jan-
13
Feb-
13
Mar
-13
Apr-1
3
May
-13
Jun-
13
Jul-1
3
Aug-
13
Sep-
13
Ambulance handovers - Fines Ambulance Handover <30mins

11/14/2013
Cancer 2 week waits
13
Since October 2011, we have achieved the 2 week wait target (93%) of seeing patients within 2 weeks of a suspected cancer referral.
01020304050607080
0
100
200
300
400
500
600
Apr-1
0
Jul-1
0
Oct
-10
Jan-
11
Apr-1
1
Jul-1
1
Oct
-11
Jan-
12
Apr-1
2
Jul-1
2
Oct
-12
Jan-
13
Apr-1
3
Jul-1
3 no. r
efer
rals
-bre
ast s
ympt
ons
no. r
efer
rals
-sus
pect
ed c
ance
r
Number of referrals
2 week wait suspected cancer 2 week wait exhibited breast symptoms
75.0%
80.0%
85.0%
90.0%
95.0%
100.0%
105.0%
Apr-1
0
Jul-1
0
Oct
-10
Jan-
11
Apr-1
1
Jul-1
1
Oct
-11
Jan-
12
Apr-1
2
Jul-1
2
Oct
-12
Jan-
13
Apr-1
3
Jul-1
3
2 week cancer targets
2 wk wait suspected cancer 2 wk wait Breast

11/14/2013
Cancer 31 day and 62 day targets
14
We continue to achieve the target of delivering treatment within 31 days of the decision to treat.
85.0%87.0%89.0%91.0%93.0%95.0%97.0%99.0%
101.0%
Apr-1
0
Jul-1
0
Oct
-10
Jan-
11
Apr-1
1
Jul-1
1
Oct
-11
Jan-
12
Apr-1
2
Jul-1
2
Oct
-12
Jan-
13
Apr-1
3
Jul-1
3
31 day treatment first
Achievement % Target % 6 month rolling %
85.0%87.0%89.0%91.0%93.0%95.0%97.0%99.0%
101.0%
Apr-1
0
Jul-1
0
Oct
-10
Jan-
11
Apr-1
1
Jul-1
1
Oct
-11
Jan-
12
Apr-1
2
Jul-1
2
Oct
-12
Jan-
13
Apr-1
3
Jul-1
3
31 day treatment first subsequent drugs
Monthly data Target % 6 month rolling %
75.0%77.0%79.0%81.0%83.0%85.0%87.0%89.0%91.0%93.0%95.0%97.0%99.0%
101.0%103.0%
Apr-1
0
Jul-1
0
Oct
-10
Jan-
11
Apr-1
1
Jul-1
1
Oct
-11
Jan-
12
Apr-1
2
Jul-1
2
Oct
-12
Jan-
13
Apr-1
3
Jul-1
3
31 day treatment subsequent surgery
Monthly data Target % 6 month rolling %
0
1
2
3
4
5
6
0.0%
20.0%
40.0%
60.0%
80.0%
100.0%
120.0%
Apr-1
0
Jul-1
0
Oct
-10
Jan-
11
Apr-1
1
Jul-1
1
Oct
-11
Jan-
12
Apr-1
2
Jul-1
2
Oct
-12
Jan-
13
Apr-1
3
Jul-1
3
62 day treatment screening
Achievement % Target % Number of referrals
0
10
20
30
40
50
60
70
84.0%86.0%88.0%90.0%92.0%94.0%96.0%98.0%
100.0%102.0%
Apr-1
0
Jul-1
0
Oct
-10
Jan-
11
Apr-1
1
Jul-1
1
Oct
-11
Jan-
12
Apr-1
2
Jul-1
2
Oct
-12
Jan-
13
Apr-1
3
Jul-1
3
62 day treatment standard
Achievement % Target % Number of referrals
0
5
10
15
20
0.0%
20.0%
40.0%
60.0%
80.0%
100.0%
120.0%
Apr-1
0
Jul-1
0
Oct
-10
Jan-
11
Apr-1
1
Jul-1
1
Oct
-11
Jan-
12
Apr-1
2
Jul-1
2
Oct
-12
Jan-
13
Apr-1
3
Jul-1
3
62 day treatment upgrades
Achievement % Target % Number of referrals
We are currently achieving all 62 day targets.

11/14/2013
DNA
15
YTD DNA ratio of 7.9% increase of 1% compared to August 13. The sharp increase in DNAs in September was mostly concentrated among patients of school attending age, with the increase in this subgroup twice that of the increase for patients not of school attending age.
4.0%
5.0%
6.0%
7.0%
8.0%
9.0%
10.0%
Apr-1
0Ju
n-10
Aug-
10O
ct-1
0De
c-10
Feb-
11Ap
r-11
Jun-
11Au
g-11
Oct
-11
Dec-
11Fe
b-12
Apr-1
2Ju
n-12
Aug-
12O
ct-1
2De
c-12
Feb-
13Ap
r-13
Jun-
13Au
g-13
DNA rate
Overall DNA rate First DNA rate Follow up DNA rate
0.0%
5.0%
10.0%
15.0%
20.0%
25.0%
0
100
200
300
400
500
600
700
800
900
Ort
hopa
edic
s
Gene
ral M
edic
ine
Paed
iatr
ics
Oph
thal
mol
ogy
Gyna
ecol
ogy
Gene
ral S
urge
ry
Derm
atol
ogy
ENT
Ort
hodo
ntic
s
Uro
logy
Rheu
mat
olog
y
Ora
l Sur
gery
Obs
tetr
ics/
Mat
Mid
wife
Card
iolo
gy
Med
ical
Onc
olog
y
Neu
rolo
gy
Plas
tic S
urge
ry
Haem
atol
ogy
Gast
roen
tero
logy
Reha
bilit
atio
n
Anae
s/Pa
in
Thor
acic
Med
icin
e
YTD DNAs by speciality
DNAs Rate %

11/14/2013
First to follow up
16
1st to follow up ratio in September 2.0, 6 month moving average reducing steadily
- 1.0 2.0 3.0 4.0 5.0 6.0 7.0 8.0
0
500
1000
1500
2000
2500
Ort
hopa
edic
s
Oph
thal
mol
ogy
Gen
eral
Sur
gery
ENT
Uro
logy
Ort
hodo
ntic
s
Ora
l Sur
gery
Plas
tic S
urge
ry
Anae
s/Pa
in
rate
atte
ndan
ces
YTD 1st to follow up ration by speciality
1st Follow Up Rate
1.5
1.7
1.9
2.1
2.3
2.5
Apr-1
0Ju
n-10
Aug-
10O
ct-1
0De
c-10
Feb-
11Ap
r-11
Jun-
11Au
g-11
Oct
-11
Dec-
11Fe
b-12
Apr-1
2Ju
n-12
Aug-
12O
ct-1
2De
c-12
Feb-
13Ap
r-13
Jun-
13Au
g-13
New:Follow ratio
6 month moving average

11/14/2013
0%
20%
40%
60%
80%
100%
120%
Apr-1
0
Jul-1
0
Oct
-10
Jan-
11
Apr-1
1
Jul-1
1
Oct
-11
Jan-
12
Apr-1
2
Jul-1
2
Oct
-12
Jan-
13
Apr-1
3
Jul-1
3
Stroke Unit Stay >90%
Stroke Unit Stay >90% Target
0%
20%
40%
60%
80%
100%
Apr-1
2
May
-12
Jun-
12
Jul-1
2
Aug-
12
Sep-
12
Oct
-12
Nov
-12
Dec-
12
Jan-
13
Feb-
13
Mar
-13
Apr-1
3
May
-13
Jun-
13
Jul-1
3
Aug-
13
Sep-
13
4Hr Direct Admission
4Hr Direct Admission Target
Stroke
17
In September we achieved the 80% target for the second month in a row for stroke patients spending >90% of their time on the stroke ward. 63% of patients were admitted directly to the stroke ward within 4 hours, this is well below target of 90%.
80% of high risk Transient Ischaemic Attack (TIA) patients were treated within 24 hours. 48% of patients that were subsequently diagnosed with a stroke had a CT scan within 1 hour of arrival. Please note that the underlying data includes all patients, whether a CT scan is needed within 1 hour or not, therefore our achievement maybe understated
0%
20%
40%
60%
80%
100%
120%
Apr-1
0
Jul-1
0
Oct-1
0
Jan-
11
Apr-1
1
Jul-1
1
Oct-1
1
Jan-
12
Apr-1
2
Jul-1
2
Oct-1
2
Jan-
13
Apr-1
3
Jul-1
3
High Risk TIA <24Hrs
0%
10%
20%
30%
40%
50%
60%
Apr-1
2
May
-12
Jun-
12
Jul-1
2
Aug-
12
Sep-
12
Oct-1
2
Nov-
12
Dec-
12
Jan-
13
Feb-
13
Mar
-13
Apr-1
3
May
-13
Jun-
13
Jul-1
3
Aug-
13
Sep-
13
Achievement 1HrCTScan

11/14/2013
Cancelled operations
18
For any elective operation cancelled by the trust on the day of the operation/admission, an offer of a new date must be made within 5 calendar days, and the newly offered date must be within 28 days of the cancelled operation date. YTD to Sep 13, 69 operations have been cancelled by the trust on the day or day before, 66 were contacted within 5 days to be offered a new date and 66 were rebooked within 28 days.
0
50
100
150
200
250
300
350
400
1 day before 2-7 days before 8 or more daysbefore
On the day
Timing of Cancelled Operation (By Hospital)
0 50 100 150 200 250
Surgery / Appt not required
More urgent case took priority - Elective only e.g. cancer
Patient unfit for surgery (acute illness)
Consultant / Clinician unavailable
Patient unfit for surgery (pre-existing medical condition)
TCI / Appt rescheduled - Requires alternative session / clinic
Patient cancelled - Unfit for treatment
TCI / Appt rescheduled - date brought forward
Patient failed to arrive / DNA
Patient Cancelled - TCI / Appt inconvenient
Top 10 Reasons for Cancellation of Elective Operations Most common reason of cancelling operation is “patient cancellation” Cancelled by Trust – 31% on day, 50% 8 + days before

11/14/2013
Admissions
19
Total elective admissions in September were 1,565 compared to non-elective 1,550. For the last 12 months the mix has remained at a 50:50 equal split, compared to prior year which was 54% Elective to 46% Non Elective admissions. Average length of stay is 3.1 days for Elective Division and 4.5 days for UCLTC Division. In the last 12 months the average length of stay has dropped by 0.4 of a day.
In November we are carrying out further analysis to determine relevant and accurate criteria for LOS vs accurate targets
0
5001,0001,5002,0002,5003,0003,500
Apr-1
0
Jun-
10
Aug-
10
Oct
-10
Dec-
10
Feb-
11
Apr-1
1
Jun-
11
Aug-
11
Oct
-11
Dec-
11
Feb-
12
Apr-1
2
Jun-
12
Aug-
12
Oct
-12
Dec-
12
Feb-
13
Apr-1
3
Jun-
13
Aug-
13
Admissions
Total Elective admissions Non Elective admissions
Total admissions (6 mths avg)
0.0
1.0
2.0
3.0
4.0
5.0
6.0
7.0
Apr-1
0
Jun-
10
Aug-
10
Oct
-10
Dec-
10
Feb-
11
Apr-1
1
Jun-
11
Aug-
11
Oct
-11
Dec-
11
Feb-
12
Apr-1
2
Jun-
12
Aug-
12
Oct
-12
Dec-
12
Feb-
13
Apr-1
3
Jun-
13
Aug-
13
Average Length of Stay (days)
LOS Elective LOS Non Elective
LOS Sep-10 Sep-11 Sep-12 Sep-13Elective 2.9 3.4 3.2 3.1Non Elective 5.7 4.6 4.9 4.5

11/14/2013
Bed Occupancy
20
Total available beds in September was 320, compared to August 338. The reduction due to closure of ward 6A (-30 beds). An additional 12 beds were made available on Jasmine. September bed occupancy was 81%. October numbers not confirmed.
0%
20%
40%
60%
80%
100%
120%
Apr-1
1
May
-11
Jun-
11
Jul-1
1
Aug-
11
Sep-
11
Oct
-11
Nov
-11
Dec-
11
Jan-
12
Feb-
12
Mar
-12
Apr-1
2
May
-12
Jun-
12
Jul-1
2
Aug-
12
Sep-
12
Oct
-12
Nov
-12
Dec-
12
Jan-
13
Feb-
13
Mar
-13
Apr-1
3
May
-13
Jun-
13
Jul-1
3
Aug-
13
Sep-
13
Bed Occupancy by Speciality
Medical Division Surgical Division Ortho Paeds Ob & Gynae
Bed Occupancy % Jul-13 Aug-13 Sep-1310 48% 43% 40%6A 91% 69%6B 99% 100% 115%7A 91% 88% 91%8A 98% 95% 96%8B 74% 53% 91%9A 91% 89% 92%9B 97% 97% 98%Coronary Care 73% 81% 75%Clinical Decisions Unit 108% 113% 118%Emergency Admissions Unit (7B) 66% 62% 68%Freya 53% 54% 57%Intensive Care Unit 85% 73% 86%Jasmine 56% 33% 60%Kingston Wing 83% 90% 86%Total 80% 75% 81%
Bed Occupancy % Jul-13 Aug-13 Sep-13Medical Division 97% 96% 99%Surgical Division 97% 97% 97%Ortho 82% 64% 96%Paeds 35% 31% 26%Ob & Gynae 51% 48% 46%Total 80% 75% 81%
Bed Occupancy = total beds occupied/total available beds (position as at midnight) >100% = data quality issues – to be investigated

11/14/2013
Length of stay – long stayers
21
Patient with length of stay 233 days. This patient on 9B under the care of Dr Khan is fit for discharge, but is awaiting rehousing.
2
2
1
4
13
4
1
1
2
4
1
1
3
3
7
1
5
1
1
1
0 2 4 6 8 10 12 14
medically fit for discharge
Not Medically Fit
Not Medically Fit
Palliative/?Hospice
End Of Life Care
medically fit for discharge
Not Medically Fit
Palliative/?Hospice
Unknown
medically fit for discharge
Not Medically Fit
Gen.
Med
.Ge
n. S
urg.
Geria
tric
Car
ePa
edi
atric
sT&
O
Emergency YTD Average LoS by Speciality
200+*
60-100
30-60
15-30

11/14/2013
Discharges
22
41% of inpatients had an EDD (estimated discharge date) recorded, of these only 40% were actually discharged by the estimated due date. Top 4 largest specialities (% discharged by EDD) - General medicine 36%, Paediatrics 48%, General Surgery 49%, Orthopaedics 43%
0
500
1000
1500
2000
2500
Monday Tuesday Wednesday Thursday Friday Saturday Sunday
YTD Discharges by Day of the Week
Elective Emergency
0
500
1000
1500
2000
2500
3000
GeneralMedicine
Paediatrics General Surgery Orthopaedics Gynaecology Care of theElderly
Urology
YTD Discharges with EDD Recorded by Specialty - Top 7 Specialties
disch on EDD not disch on EDD no EDD recorded

11/14/2013
Re-admissions within 30 days
23
General Medicine has a high rate of readmissions post electively from other specialties, and post-emergency General Surgery has a high rate of post-elective same-specialty readmissions due to the high rate of elective admissions for general surgery (all endoscopies are managed as day cases, and therefore count as admissions)
0 10 20 30 40 50 60
Paediatrics
Geriatrics
A&E
Trauma & Orthopaedics
Gynaecology
General Surgery
General Medicine
Post Elective Readmissions by Specialty
different speciality same speciality
0 50 100 150 200 250 300
Urology
Obstetrics
Paediatrics
Gynaecology
Trauma & Orthopaedics
Geriatrics
A&E
General Surgery
General Medicine
Post Emergency Readmissions by Specialty
different speciality same speciality

11/14/2013
Patient complaints and compliments
24
YTD there have been 755 compliments to Clinical Departments and Medical Staff and 474 complaints There has been an increase in number of PALs contacts, Sep (72), Oct (85) compared to average Apr-Aug (57)
0 20 40 60 80 100 120 140
Failure to Follow ProceduresConfidentiality
Operation Cancellation/delayRecords Issue
Medication ErrorOther
EnvironmentWaiting Time
Diagnosis ProblemsAppointment (OP) Cancellation/
Nursing CareAttitude
Information To PatientsClinical Treatment
Communication
YTD complaints by reason
93%
94%
95%
96%
97%
98%
99%
100%
0
5
10
15
20
25
30
35
40
Apr-13 May-13 Jun-13 Jul-13 Aug-13 Sep-13 Oct-13
% r
espo
nded
with
in a
gree
d tim
esca
les
no. c
ompl
aint
s
Number of complaints received % responded within agreed timescale
0
100
200
300
400
500
600
700
800
YTD complaints YTD compliments
11/14/2013
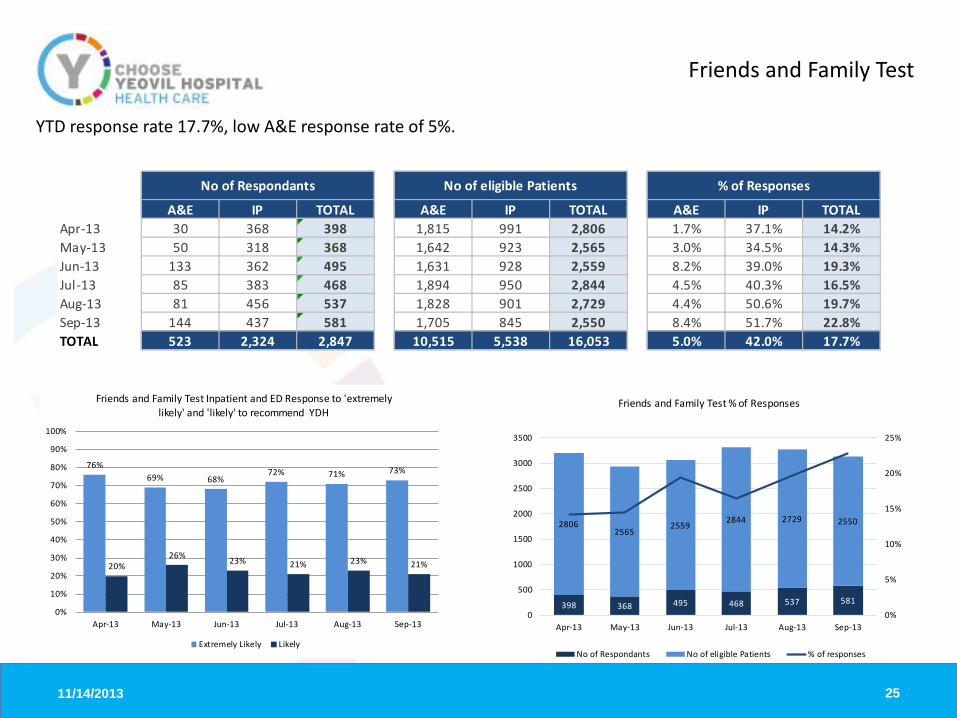
Friends and Family Test
25
YTD response rate 17.7%, low A&E response rate of 5%.
20%26% 23% 21% 23% 21%
76%69% 68%
72% 71% 73%
0%
10%
20%
30%
40%
50%
60%
70%
80%
90%
100%
Apr-13 May-13 Jun-13 Jul-13 Aug-13 Sep-13
Friends and Family Test Inpatient and ED Response to 'extremely likely' and 'likely' to recommend YDH
Extremely Likely Likely
398 368 495 468 537 581
28062565
25592844 2729 2550
0%
5%
10%
15%
20%
25%
0
500
1000
1500
2000
2500
3000
3500
Apr-13 May-13 Jun-13 Jul-13 Aug-13 Sep-13
Friends and Family Test % of Responses
No of Respondants No of eligible Patients % of responses
A&E IP TOTAL A&E IP TOTAL A&E IP TOTALApr-13 30 368 398 1,815 991 2,806 1.7% 37.1% 14.2%May-13 50 318 368 1,642 923 2,565 3.0% 34.5% 14.3%Jun-13 133 362 495 1,631 928 2,559 8.2% 39.0% 19.3%Jul-13 85 383 468 1,894 950 2,844 4.5% 40.3% 16.5%Aug-13 81 456 537 1,828 901 2,729 4.4% 50.6% 19.7%Sep-13 144 437 581 1,705 845 2,550 8.4% 51.7% 22.8%TOTAL 523 2,324 2,847 10,515 5,538 16,053 5.0% 42.0% 17.7%
No of Respondants No of eligible Patients % of Responses

11/14/2013
Finance
26
YTD surplus £365k, £401k favourable against budget, Monitor risk rating of 3, YTD capital expenditure £1,080k, Cash balance £6.4m
Variance: Favourable/(Adverse)
Financial Summary Actual Variance Actual Variance
Income 9,600 38 56,901 (612)Pay (6,069) 24 (36,358) 677Non Pay (3,003) 337 (17,596) 325EBITDA 528 399 2,947 390Other (410) 2 (2,582) 11Surplus 118 401 365 401EBITDA Margin % 5.4% 5.3% 5.1% 0.9%Surplus % 1.2% 4.2% 0.6% 0.7%
Year to DateIn Month

11/14/2013 27
APPENDIX
Financial Detail
11/14/2013
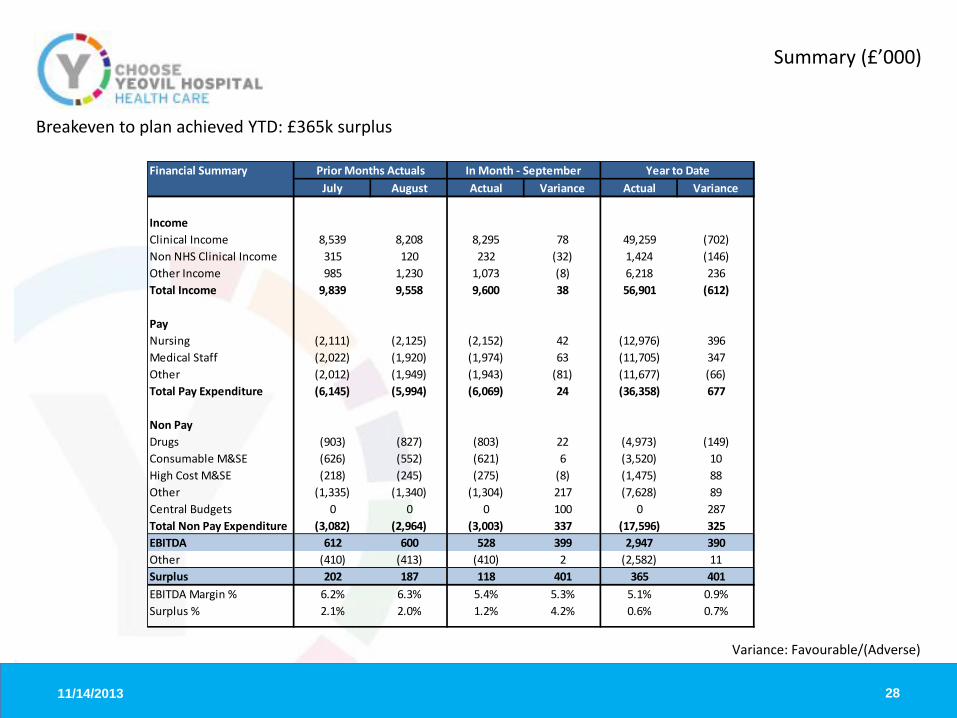
Summary (£’000)
28
Breakeven to plan achieved YTD: £365k surplus
Variance: Favourable/(Adverse)
Financial Summary July August Actual Variance Actual Variance
IncomeClinical Income 8,539 8,208 8,295 78 49,259 (702)Non NHS Clinical Income 315 120 232 (32) 1,424 (146)Other Income 985 1,230 1,073 (8) 6,218 236Total Income 9,839 9,558 9,600 38 56,901 (612)
PayNursing (2,111) (2,125) (2,152) 42 (12,976) 396Medical Staff (2,022) (1,920) (1,974) 63 (11,705) 347Other (2,012) (1,949) (1,943) (81) (11,677) (66)Total Pay Expenditure (6,145) (5,994) (6,069) 24 (36,358) 677
Non PayDrugs (903) (827) (803) 22 (4,973) (149)Consumable M&SE (626) (552) (621) 6 (3,520) 10High Cost M&SE (218) (245) (275) (8) (1,475) 88Other (1,335) (1,340) (1,304) 217 (7,628) 89Central Budgets 0 0 0 100 0 287Total Non Pay Expenditure (3,082) (2,964) (3,003) 337 (17,596) 325EBITDA 612 600 528 399 2,947 390Other (410) (413) (410) 2 (2,582) 11Surplus 202 187 118 401 365 401EBITDA Margin % 6.2% 6.3% 5.4% 5.3% 5.1% 0.9%Surplus % 2.1% 2.0% 1.2% 4.2% 0.6% 0.7%
In Month - September Year to DatePrior Months Actuals
11/14/2013
Monitor Risk Ratings
29
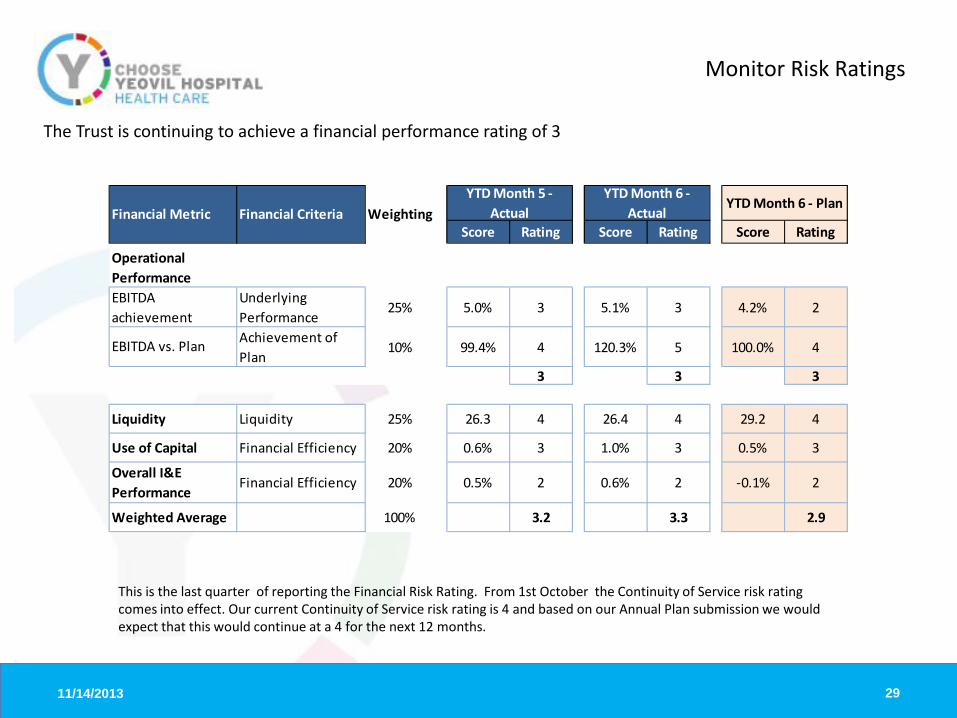
The Trust is continuing to achieve a financial performance rating of 3
Score Rating Score Rating Score Rating
Underlying Performance
25% 5.0% 3 5.1% 3 4.2% 2
Achievement of Plan
10% 99.4% 4 120.3% 5 100.0% 4
3 3 3
Liquidity 25% 26.3 4 26.4 4 29.2 4
Financial Efficiency 20% 0.6% 3 1.0% 3 0.5% 3
Financial Efficiency 20% 0.5% 2 0.6% 2 -0.1% 2
100% 3.2 3.3 2.9
Financial Metric Financial Criteria WeightingYTD Month 6 -
ActualYTD Month 6 - Plan
YTD Month 5 - Actual
Weighted Average
Overall I&E Performance
Liquidity
Use of Capital
Operational PerformanceEBITDA achievement
EBITDA vs. Plan
This is the last quarter of reporting the Financial Risk Rating. From 1st October the Continuity of Service risk rating comes into effect. Our current Continuity of Service risk rating is 4 and based on our Annual Plan submission we would expect that this would continue at a 4 for the next 12 months.

11/14/2013
Income (£’000)
30
Income in month £9,600k; YTD £56,901k (£612k adverse variance to budget)
Non NHS Clinical Income - There is a adverse variance of £32k in month. This is due an adverse variance of £7k relating to underachievement of private patient income and an adverse variance of £25k relating to the Injury Cost Recovery Scheme. Other Income – There is an adverse variance of £8k in month. This is due to an adverse variance of £106k on donated asset income, which is mainly a timing difference as the planned ultrasound scanner has not yet been purchased. Education and Training income is £63k favourable due to increased education income from Health Education South West. N.B. Main components of Other Income include Research & Development funding, Education & Training funding and Donated Asset Income. Other significant income streams include services provided to external organisations for pharmacy & facilities contracts.
Clinical Income - There is a favourable variance of £78k in month. Of this £70k is due to a timing difference on contract income and £11k is as a result of higher than planned cancer drug fund income .

11/14/2013
Substantive &Total Pay (£’000)
31
Pay in month £6,069k; YTD £36,358k (£677k favourable variance to budget)
Nursing – Total expenditure in month is £2,152k, resulting in a favourable variance of £42k. This is due to vacancies, approved timing & CIP variances. The business units that are underspent are Medicine, Somerset Academy, Obs, Gynae & Specialist Surgery, Theatres, Surgery & Critical Care. Medical Staffing – Total expenditure in month is £1,974k, resulting in a favourable variance of £63k. This is due to vacancies, approved timing variances and CIP in ED & Critical Care and Radiology, partially offset by overspends in Ophthalmology, Gynae and Medicine. A&C, Estates & Ancillary – Total expenditure in month is £1,065k, resulting in a favourable variance of £21k. This is due to Senior Manager underspends in CEO, Corporate and Finance directorates relating to vacancies or offset by non pay costs. Other CIP - There is an adverse variance in month of £102k. This is due to non-achievement of CIP against the target in various business units and is partially offset by achievement in the above staff categories.

11/14/2013
Pay Non Substantive (£’000)
32
Non substantive Pay in month £427k; YTD £2,584k (£455k greater YTD than 12/13)
Locum Bank Agency Total Locum Bank Agency TotalMedical and Dental 61 40 101 345 472 817 Nursing and Midwifery 108 70 178 566 347 913 Other 44 104 148 242 611 853 Total 61 152 214 427 345 808 1,431 2,584
In Month YTD

11/14/2013
Drugs (£’000)
33
Drugs spend in month £803k; YTD £4,973k (£149k adverse variance to budget)
Drugs are reporting an overspend of £149k year to date. This is offset by increased income of £219k; £65k from the cancer drug fund, £140k from Specialist Commissioning and £14k from other NHS Trusts. The net impact is a £70k favourable variance which is mainly due to an underspend on Somerset and Dorset CCG ‘s high cost drugs by £42k. Note: Any total under or over performance relating to drugs commissioned by NHS England will be paid through on a ‘pass through’ basis.

11/14/2013
Non Pay (£’000)
34
Non Pay (excl drugs) spend in month £2,200k; YTD £12,623k (£187k favourable variance to budget)
In month: – Consumable M&SE – Favourable £6k.
– High Cost M&SE – Adverse 8k.
- Other Non Pay - Favourable £217k. £354k is relating to a timing difference on restructuring costs. £43k of underspends on Travel, Training & Miscellaneous expenditure budgets partially offset overspends of £70k on Estates & Facilities, Office Expenses and Professional & Consultancy Fees.

11/14/2013 35
Overhead costs include Facilities, Energy, Maintenance, Management, HR, Finance etc. There has been a slight jump in September, partly due to an overspend in Facilities Management.
£0
£500
£1,000
£1,500
£2,000
£2,500
£3,000
Jul-12 Oct-12 Jan-13 Apr-13 Jul-13 Oct-13 Jan-14
£'00
0
Overhead spend by month (rolling twelve months and forecast)
Actuals Forecast Linear (for trend)
11/14/2013
Use of Capital (£’000)
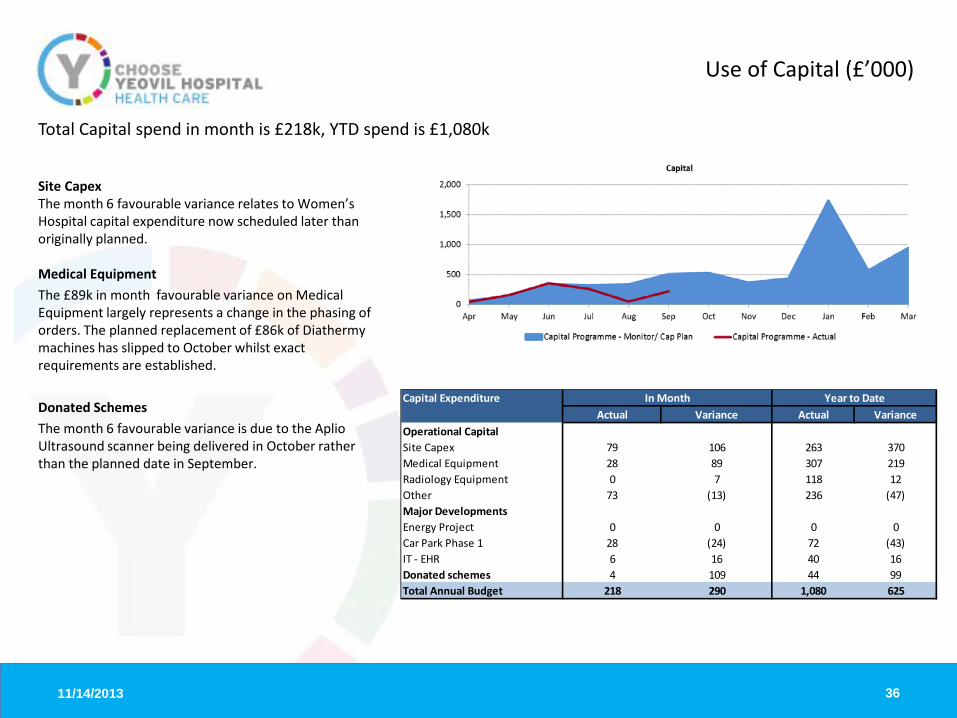
36
Site Capex The month 6 favourable variance relates to Women’s Hospital capital expenditure now scheduled later than originally planned. Medical Equipment The £89k in month favourable variance on Medical Equipment largely represents a change in the phasing of orders. The planned replacement of £86k of Diathermy machines has slipped to October whilst exact requirements are established. Donated Schemes The month 6 favourable variance is due to the Aplio Ultrasound scanner being delivered in October rather than the planned date in September.
Total Capital spend in month is £218k, YTD spend is £1,080k
Capital ExpenditureActual Variance Actual Variance
Operational CapitalSite Capex 79 106 263 370Medical Equipment 28 89 307 219Radiology Equipment 0 7 118 12Other 73 (13) 236 (47)Major DevelopmentsEnergy Project 0 0 0 0Car Park Phase 1 28 (24) 72 (43)IT - EHR 6 16 40 16Donated schemes 4 109 44 99Total Annual Budget 218 290 1,080 625
In Month Year to Date

11/14/2013 37
Cash (£’000)
Cash outflow in month is £763k, YTD Cash outflow is £3,460k Year to date there is a cash outflow higher than plan by £932k. The main variances are: Trade Receivables £2,685k adverse NHS Debtors are higher than plan due to the invoicing of £833k to Somerset CCG re transitional funding in respect of month 1 to 5. Accrued Income is higher than expected due to amounts still to be invoiced to other NHS organisations, including transitional funding, CCG contracts & drug funding. Trade Payables £875k favourable This is due to a late Somerset Pathology invoice of £288k and deferred income of £552k relating to a timing difference on contract income. Provisions £124k favourable This is due to an increase in the provision for Injury Benefit. Capital £607k favourable This has arisen due to the delayed start on projects but will catch up as the work on the projects accelerates. Public Dividend Capital £245k adverse It was planned that all the income for the £350k dementia project would be received however this has been delayed due to a delayed start to the project. Other £492 favourable This is due to a higher than planned EBITDA
Cashflow In Month Variance Year to Date VarianceTrade Receivables (1,116) (2,685)Trade Payables 994 875Provisions 0 124Capital 97 607PDC 0 (245)Stock (35) (100)Other 411 492Cash inflow/(outflow) Variance 351 (932)

11/14/2013 38
Statement of Financial Position (£’000)
Current Assets has increased by £235k Inventories: has increased by £52k in month. Pacemaker stock has increased by £24k, and Pharmacy by £37k, while Audiology has decreased by £9k. Trade Receivables: NHS Debtors are higher by £1.3m which is due to changes in commissioning arrangements resulting in delayed payment of invoices and delayed invoicing to Somerset CCG for transitional funding. Non NHS Trade Debtors have reduced by £354k due to good collection of income . Current Liabilities has increased by £115k Creditors and accruals have increased by £343k. A significant proportion of this, £280k is a result of the monthly Pathology contract invoice being received late. The half yearly PDC dividend has been paid resulting in a £579k accrual reduction. Capital Creditors have reduced by £200k due to slippage in the Capital programme. Deferred income has increased by £552k due to a timing difference on contract income.
August 13 September 13 Mvt In Mth
Non Current Assets 51,029 50,963 (66)
Current AssetsInventories 1,847 1,899 52Trade & Other Receivables <1yr 6,009 6,955 946Cash in Hand and at Bank 7,175 6,412 (763)Total Current assets 15,031 15,266 235
Current Liabilities (9,328) (9,443) (115)
Net Current Assets 5,703 5,823 120
Total Assets less Current Liabilities 56,732 56,786 54Trade and other Payables >1yr 0 0 0Loans > 1yr (64) 0 64Provisions >1yr (1,149) (1,149) 0Net Assets employed 55,519 55,637 118
Financed by:I&E Reserve Current year 248 366 118Public Dividend Capital 40,930 40,930 0I&E Reserve Previous year 6,238 6,238 0Revaluation Reserve 8,103 8,103 0Donation Reserve 0 0 0Total Financed 55,519 55,637 118

11/14/2013
Trust Level Key Ratios
39
EBITDA margin 5.1% YTD, 5.4% in month
There are no material variations in month for Pay and Non Pay compared to last year. Return on pay has remained the same compared to the previous month. Return on non pay has remained the same compared to the previous month. EBITDA margin is 0.5% lower than achieved YTD in 12/13 Notes: Ratios are calculated under the current contract income value and not PbR

11/14/2013
Service Line Reporting Summary (£’000)
40
The Corporate income figure of £966k includes other income streams such as car parking and Injury Cost Recovery Scheme income. The £9,6m of central costs are overheads, and include departments such as Facilities, Management services, HR, Finance, and also depreciation costs.
Elective Care Urgent Care Corporate Total
Revenue 25,479 24,326 966 50,771
Direct Costs (11,648) (15,777) 0 (27,425)Indirect Costs (8,766) (4,607) 0 (13,373)
Gross Contribution 5,065 3,942 966 9,973Central Costs (5,045) (4,563) 0 (9,608)
Net Contribution 20 (621) 966 365
Month 6 Year to Date

11/14/2013
Service line reporting – Elective Care contribution
• Average full year budget margin for Elective Care is 22% • Audiology activity counting will be reviewed in light of
underperformance. • ICU activity has been low prior to month 6 but is now virtually
on plan, hence the in month increase.
41
£000's % £000's %Month 6 1,212 27% 940 22%YTD 5,065 20% 5,701 22%Full Year Budget 11,566 22%
Elective Care Strategic Business Unit ContributionActual Budget

11/14/2013
Service line reporting – Urgent Care contribution
• Average full year budget margin for Urgent Care is 19% • The Pathology drop in month is related to a reallocation of income for
blood products. • The paediatric drop in month is mainly due to a drop in revenue,
particularly in non-elective inpatients. • The full year contribution of 19% is higher than the YTD plan of 16%
due to CIP savings a due to be made in the latter part of the year.
42
£000's % £000's %Month 6 532 14% 647 16%YTD 3,942 16% 4,052 16%Full Year Budget 9,825 19%
ActualUrgent Care Strategic Business Unit Contribution
Budget

1
Clinical Quality Report October 2013-14
TITLE: Clinical Quality Report DATE: 20 November 2013 PRESENTED BY: Director of Nursing and Clinical Governance ________________________________________________________________________ PAPER What is this item about? The clinical quality report aims to provide the Clinical Governance Delivery Committee with essential information about the quality of care provided during October. It is subdivided under the three key areas of clinical effectiveness, patient experience and patient safety Why is this item necessary? To provide a level of assurance on the quality, safety and effectiveness of clinical care delivered by the Trust. What is the Clinical Governance Delivery Committee asked to do? The Clinical Governance Delivery Committee is asked to DISCUSS the report
1. How does this paper improve patient care? This paper improves patient care by sharing data about the current position in respect of clinical care and informs the CGDC where improvements may be necessary 2. How does this paper advance the Annual Plan? The provision of effective, safe patient care is the Trust’s main objective and as such the clinical quality report is an essential part of the work towards the Annual Report and Quality Account 3. How does this advance our strategic objectives? The Trust’s strategic objectives include ensuring the deloivery of safe patient care, with good clinical outcomes, and in a way that enhances the patient experience. This report aims to provide an overview of the Trust’s position at October 2013 4. Is further information available? Yes on request from the Clinical Governance team
Are there implications for the Trust? • Legally? No • Financially? Yes. Some of the issues discussed reflect the current position against CQUIN
targets • Regarding Workforce? No • Is this paper clear for release under Freedom of Information? YES

2
Clinical Quality Report October 2012-13
EXECUTIVE SUMMARY This report provides an overview to the Clinical Governance Delivery Committee about clinical effectiveness, patient safety and patient experience. It includes topics within the 2013-14 Quality Account and Trust CQUIN programme and details exceptions and trends and the high level actions being taken where indicated. Clinical Effectiveness The latest measure in the rolling 3 month Hospital Standardised Mortality Ratio (HSMR) shows the Trust performing consistently well with HSMR lower than the expected threshold and peforming well in comparison with Trusts across the region. The Standardised Hospital Mortality-level Index (SHMI) shows a sustained reduction since 2011 and more recently and reassuringly, constant and lower scores. Our 30-day readmission rate is slightly above the 12/13 outturn of 13.8% at currently sits at 14/1% for the YTD. Patient Safety Performance was sustained in October for patients being risk assessed for venous thrombo-embolism across the Trust, with performance reported as 95.5% for October. The number of falls remained consistent at 72 and below the monthly trajectory of 78. We remain within trajectory for MRSA with no cases during October 2013 and 7 cases of Clostridium difficile reported for the year to date. Negotiations are taking place with the Commissioners to establish agreement about the reporting and performance monitoring of cases where attribution should not be made against the Trust or whether the case was deemed to be unavoidable. There were no Serious Incidents Requiring Investigation (SIRIs) reported in October. Patient Experience 27 formal complaints were received in October, alongside 85 PALS queries. The rate of complaints has remained at a consistent level but a decrease in the number of formal complaints is expected in the next month due to a change in process of risk scoring concerns and improvements in the delivery of the PALS service. No Ombudsman referrals were made, 0 cases were re-opened and 9 meetings took place with patients / families in October. The response rate to complaints is 95%.
3
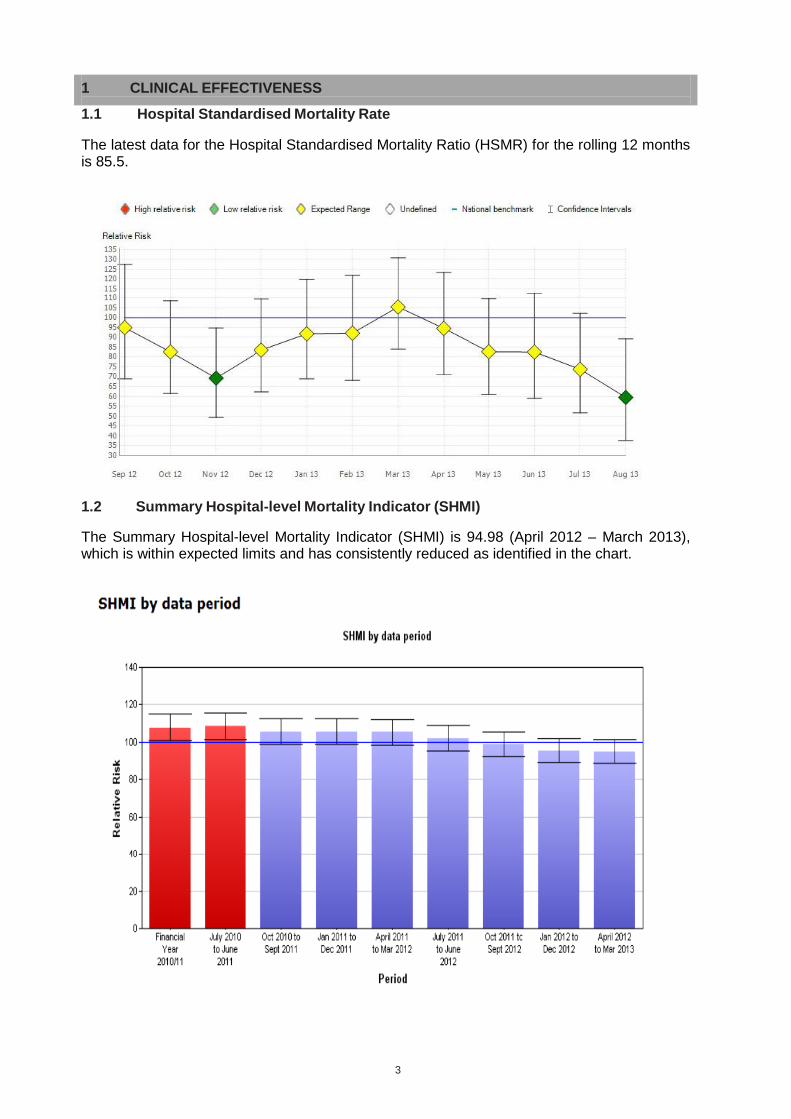
1 CLINICAL EFFECTIVENESS
1.1 Hospital Standardised Mortality Rate The latest data for the Hospital Standardised Mortality Ratio (HSMR) for the rolling 12 months is 85.5.
1.2 Summary Hospital-level Mortality Indicator (SHMI)
The Summary Hospital-level Mortality Indicator (SHMI) is 94.98 (April 2012 – March 2013), which is within expected limits and has consistently reduced as identified in the chart.

4
1.3 In Hospital deaths per month The chart below shows the actual in-hospital deaths for October was 62.
1.4 NICE Guidance Compliance
The following table provides an overview of NICE guidance issued since April 2012, followed by specific detail of new guidance issued in month and detail of non-compliance with guidelines. Full details of non / partial compliance for Clinical Guidelines and Technology Appraisals is attached at Annex A.
Type Issued October
Issued Compliance status
Technology Appraisals 1 48 40 compliant, 2 under review, 6 not
applicable Clinical Guidelines 0 32 16 compliant, 2 non-compliant, 8 partly
compliant, 6 under review Interventional Procedures 0 44
33 Compliant, 4 non-compliant, 7 under review
Public Health Guidance
1 11
3 compliant, 4 partly compliant, 4 under review
Diagnostic Guidance
1 8 3 compliant, 1 non-compliant, 4 under review
Medical Technology Guidance
0 6
2 Compliant, 4 under review

5
2 PATIENT SAFETY
2.1 Hospital Acquired Pressure Ulcers The number of grade 2 or above hospital acquired pressure ulcers totals 74 YTD against a year end target reduction of 40% of no more than 121 cases. This measure is sub-categorised for patients with dementia who have hospital acquired pressure ulcers, with 1 case reported in October with a total of 8 for YTD.

6
2.2 Medication Incidents When reporting medication incidents staff are required to state whether the issue related to prescribing, administering or dispensing, and the following chart shows the breakdown by incident type and the rate per 1,000 bed days.
2.3 Reducing Patient Falls
A total of 72 patient falls were reported in October, with 19% of patients falling on more than one occasion. The rate per 1,000 bed days is 8.75 for October. 2 areas did not meet the target of reducing all falls by 10%. 9B were most adrift having reported 77 since April 2013 (higher numbers in June,July & August) however there was a reduction in October with only 8 falls with none causing moderate harm or above. Key actions taken include the reconvening of the Trust Falls Prevention Group, gap analysis against NICE guidance and testing of falls prevention interventions. This includes the piloting of non slip socks in high risk patients and testing of intentional rounding on two wards, including Ward 9B. A corporate action plan has been developed to map key actions required. Patients with dementia are recognised to be at high risk of falling with 9 incidents reported in October, with a year to date total of 119. This figure is significantly lower that this time last year when 246 patients with dementia were reported as fallers. A 15% reduction has been achieved for falls that cause harm (moderate and above) and for those falling more than once.

7
2.4 Infection Prevention and Control Report
The report summarises Infection Prevention and Control metrics and activities for October 2013. 2.4.1 PERFORMANCE AGAINST KEY TARGETS Performance against the key patient safety targets for the year to the end of October is summarised below.
October
data
YTD data Full year threshold
Variance (%)
MRSA blood stream infections
0 (pre-hospital acquired)
0 (hospital acquired)
1 (pre-hospital acquired)
0 ( hospital acquired)
0 On target
For the most recent quarter (October to December 2012) the rate per 100,000
bed days for acute trust apportioned cases for Yeovil was 0.00, the South West
region was 1.22 and the national rate was 1.02
The South West value changed from 1.25 to 1.17 per 100,000 occupied bed days, the national figure changed from 1.09 to 1.04 per 100,000 occupied bed days.

8
Days since last hospital acquired
MRSA BSI 237 days (from 4th March 2013)
Clostridium difficile infections
3 (pre-hospital acquired)
2 (hospital acquired)
9 (pre-hospital acquired)
7 (hospital acquired)
9 Over trajectory
For the most recent quarter (October to December 2012) the rate of acute trust
apportioned cases per 100,000 bed days for Yeovil was 15.1, the South West
region was 16.9 and the national rate was 17.2.
E Coli BSI
6 (pre-hospital acquired)
3 (hospital acquired)
38 (pre-hospital acquired)
11 (hospital acquired)
No threshold set
Glycopeptide resistant enterococci 0 0 No threshold
set
MSSA BSI
2 (pre-hospital acquired)
1 (hospital acquired)
1 (1 RCAs required)
7 (pre-hospital acquired)
1 (hospital acquired)
1 (1 RCAs required)
No threshold set
The Trust continues to monitor all cases of ESBL Grade A blood stream infections, although there are currently no targets for reduction. The MRSA screening rates for elective admissions for September was 100% and for emergency admissions was 90%. Compliance with hand hygiene is routinely audited in all clinical areas each month and during October the overall compliance was 100%. The audit tool and process has been revised and is currently being rolled out via compulsory training sessions to all hand hygiene champions across the Trust. The aim is to obtain clear results against each of the five moments to indicate improvements required and ultimately devise a spread sheet for staff to submit their own data – this will be monitored through the peer review process.

9
2.4.2 Key IP&C Activities/ Work Completed Policies and guidelines are reviewed regularly at the Infection Prevention and
Control meetings. Responsibility for specific policies/guidelines is allocated to individuals within the team. There were no Infection Control guidelines due for review in September.
Audit & Other Activities The following audit activity continues: • Monthly Hand Hygiene programme
• Side Room Isolation Compliance
• Cleanliness of commodes
• MRSA decolonisation
• Sharps Safety
2.4.3 Other areas of key Infection Prevention and Control Activity completed during
October: • Use of the daily isolation tool to assess compliance with isolation policy and side room
capacity. Compliance with side room isolation for October was 99.8%.
• Compliance with MRSA 28 Day Rescreens for October was 69%. None of the patients screened were positive.
• Participation in commencing the national safety thermometer data collection initiative.

10
2.5 Incident Reporting
In October, a total of 486 incidents were reported 329 of which were patient safety incidents. The following run chart below shows the actual number of patient safety incidents reported by month and as a rate per 1,000 bed days. The figures on the top of the columns represent those scored with an actual impact as Moderate, Major and Catastrophic (3+).
4350
42 4450 55 53 46 43 49 57 47 44
59
0
100
200
300
400
500
600
All Incidents by Level of Harm and Rate per 1,000 Bed days
Near Miss
Catastrop
Major
Moderate
Minor
Insignifica
Rate per 1 days
17
18
12
10
65
8
16
26
13
9
23
19
19 22
29
1
1
1 1
1
27 24 21 27 23 26 26 34 37 3327
35 41 32 33 37
0
50
100
150
200
250
300
350
400
Patient Safety Incidents by Level of Harm and Rate per 1,000 Bed days
Near Miss
Catastrophic
Major
Moderate
Minor
Insignificant
Rate per 1,000 Beddays

11
2.6 Adverse (Serious Untoward) Incidents 7 new root cause analysis clinical investigations were commissioned and 6 closed in October. Investigations total 49 YTD compared with 56 cases at this point in 2012/13. A total of 21 remain open and under investigation, 3 of these are reportable to the CCG. The details of the investigations reported in October are as follows:
• IV contrast and MRI given to wrong patient • C Section maternity treatment – failiure to adequately prepare for procedure • Frenchay appointment from Yeovil – Safeguarding concern raised by external Trust • Pneumothorax post NG tube misplacement • Administration of blood products - failure to follow correct checking prcoedures • Patient RIP within 24 hours of discharge and hospital acquired pressure ulcer • Patient identification error.
Some of the key recommendations from the 6 closed RCAs included:
• Falls – consideration of escalation to senior staff if falls alarms are not available. • Attempted hanging – Review of action plan related to risks within department related
to self harm and the development of a clear observation policy. A review also to take place to review the appropriateness of admitting patients with mental health issues.
• Radiology (IV contrast given to wrong patient) – to develop guidelines to support the requesting and vetting of requests for investigations and training to be given to all radiographers who may be required to administer IV contrast so they have a better understanding of the guidelines.

12
3 PATIENT EXPERIENCE
3.1 Complaints and PALS
This report provides an overview of what our patients have told us about their care and treatment from April to October 2013 and how that compares to previous months. The way that complaints and PALS information is presented has been reviewed and this report now gives more detail on the effectiveness of complaints and PALS handling and outcomes as well as analysis of themes.
To give perspective to complaints and concerns the following run chart has complaints and PALs measured as a rate per 1,000 bed days. This represents the total number of contacts with patients each month.

13
During May 2013, a new Complaints Manager was appointed. A full review of the PALS process was carried out and it was identified that there was nothing in place to risk assess PALS or complaints. In view of that, a number of concerns that might have been PALS became complaints over the following 5 months. The Patient Experience team have since been risk assessing all concerns registered and it is anticipated that the number of complaints will reduce in the light of this and become PALS enquiries. 3.2 Analysis of Complaints and PALs The following chart shows areas with 7 or more PALS and complaints in the first 2 quarters. This breakdown provides an overview to highlight those areas with the highest number of concerns raised.
Out-Patient Department and Emergency Department (ED) are the areas with the highest number of PALS and complaints with 51 and 43 respectively. Orthopaedic Outpatients and Radiology also feature amongst the top 4 with 22 and 19 each. Quarter 2 saw an increase in Out-Patient department complaints and PALS concerns. In quarter 1, communication raised 3 formal complaints and 6 PALs enquires. In quarter 2, queries regarding clinical treatment raised 3 formal complaints and 8 PALS. ED complaints and PALS combined doubled in quarter 2 to 34 from 17 in quarter 1. Clinical Treatment was the biggest concern with 4 formal complaints raised on quarter 1 and 5 in quarter 2 with an additional 6 PALS concerns.

14
3.3 Monthly update from Complaints Manager with recommendations to improve
service delivery The "standard you walk by" posters are still bringing people into the office and all seem very pleased to have been invited to give feedback. Perhaps there is more we could do on this in the future to encourage feedback. We notice every time there is “bad press” re the NHS that people mention it when raising a concern. We are doing a lot of work in assuring people of our transparency and commitment to learn from our mistakes. Perhaps a return to "you said, we did" posters would help to show hospital visitors what we have done as a result of listening to a concern. We still receive a lot of ward queries where relatives are not happy with the care or discharge arrangements and come to us instead of asking ward staff. I think this has been recommended in the past but is not the most effective way of dealing with concerns. Sisters’ and matrons’ visibility should help this but also staff nurses need to be more proactive. Workshops might be needed. A number of PALS and complaints each month seem to be because of concerns from previous admissions often going back over years and most say they didn't want their relatives to come into our hospital this time. A recent family have been unhappy for 7 years and of course we then have a lot of prior misconceptions or grievances to address and overcome. This is not currently recorded but could be something for development. There is some work to be carried out to seek out people who have long term problems with us. Possibly a complaint amnesty. This month we have experienced an increase in Orthopaedic clinic PALS concerns, especially changed appointments and post arriving after the appointment date. This was anticipated alongside the orthopaedic rota changes but patients appear particularly dissatisfied with this aspect of the service.

15
Unanswered phone calls continue to feature so patients then phone PALS/Complaints to answer their query. In particular, Audiology, Bone Densitometry, Rheumatology and Radiology issues. We have seen an increase in complaints coming via the PALS office either in person or via email. There has been a decrease in formal letters. We have recently identified a number of missed fractures in ED in addition to missed diagnoses. We don't have real data on this so Krystle and I will do some work on this. There have been four complaints regarding Dermatology. This is being followed up by the Medical Director. We continue to receive a number of lengthy and complex complaints regarding patients receiving end of life care, especially a few months after the event. Developments are underway for increased working between the patient experience teams and end of life care teams and on-going audit is proposed. This should help to identify concerns earlier. One theme that continues to be identified regularly involves staff not introducing themselves to patients and relatives. GP’s are still suggesting to patients that they phone PALS if they want an outpatient appointment brought forward. I am not sure that this is appropriate. 3.4 Comments received on NHS Choices and Patient Opinion websites Comments on NHS Choices are monitored daily and a response from the relevant Trust department is submitted accordingly. Patients leaving concerns are advised to contact the Trust to enable the organisation to investigate and improve services as a consequence of the feedback. 3.5 Patient Feedback Indicators / Patient Surveys A total of 844 (906 offered) iCARE if you’re smiling (which includes the family and friends test) surveys, and 170 Your Care Questionnaires (facilitated by the PPI members) were completed during October. The following chart shows the percentage of patients that answered ‘excellent’ when rating their overall care in the Your Care Questionnaires.

16
The following chart shows the results of the friends and family test
NB: Data includes all responses before exclusions for national submission, therefore national figures may differ
3.6 Litigation and Coroners Activity There were four new Clinical negligence claims in October; Inappropriate management of a possible ectopic pregnancy; Allegations of mismanagement of shoulder injury; Alleged failure of total hip replacement and a fracture sustained at time of hip replacement surgery.
There were no new Coroners cases advised in October. The case of Mrs VR has been heard with a narrative verdict. There were no actions identified for the Trust.

All information provided must remain on this sheet only
BOARD OF DIRECTORS PAPER
TITLE: Workforce Performance Report DATE: 20 November 2013 PRESENTED BY: Director of Workforce and Human Resources PAPER What is this item about? The purpose of this report is to: provide data and commentary relating to key workforce performance measures for
Month 6, to date 30 September 2013. Why is this item necessary? This is a regular, monthly performance report to the Trust board. To provide the Trust board with assurance that the necessary degree of focus and attention is being given to either maintain efficiency, or improve areas of under performance. What is the Board asked to do? To note the report. 1. How does this paper improve patient care? There is a direct correlation between the degree of engagement, motivation, competence and attitude of staff and the quality of care they provide to patients. 2. How does this paper advance the Annual Plan? The maintenance of a workforce which is adequately resourced, appropriately skilled, trained and developed, and effectively managed, combined with a focus on containing overall pay costs, underpins many of the key objectives associated with the delivery of the Annual Plan. Areas of under performance are highlighted which, if not effectively addressed, could present a risk to the Trust’s financial position. 3. How does this advance our strategic objectives? The overall performance of the workforce, at all levels of the organisation, impacts significantly on the achievement of Trust strategic objectives. There needs to be continued focus on improving workforce productivity by reducing pay costs, maintaining control of recruitment, whilst also building positive and effective staff engagement and effecting positive cultural change.

All information provided must remain on this sheet only
4. Is further information available? Yes, upon request. Are there implications for the Trust? • Legally? Yes • Financially? Yes • Regarding Workforce? Yes Is this paper clear for release under Freedom of Information? Yes

WORKFORCE PERFORMANCE REPORT 1. PURPOSE 1.1 This report provides data and commentary relating to key workforce performance measures for Month 6, to date 30 September 2013. 1.2 Current data and trend analysis relating to selected key workforce performance measures are provided in the Workforce Dashboard at Appendix 1. The rolling twelve month Workforce Scorecard for all measures is provided at Appendix 2. With the exception of the Sickness Absence Rate (which is reported ‘in month’ and one month in arrears) all data relate to Sep 13 (Month 6). 2. OVERVIEW 2.1 A summary of performance against the Month 6 key workforce measures is provided in table 1, below. Table 1: Key Workforce Performance Measures – Summary
3. KEY MESSAGES Workforce Capacity 3.1 In-month changes in FTE were as follows:
the number of substantive staff (i.e. directly employed staff) decreased by
3.0 FTE against Month 5;
Workforce Performance Measures for Month 6 -
Current Ratings and in-Month Movement
Rating Movement In-Month
Workforce Capacity (Actual v Funded Establishment) Green Down (+)
Temporary Workforce Expenditure (Bank; Agency) Amber Up (-)
Total Pay Cost Green Up (-)
Substantive Staff Unit Labour Cost Green Down (+)
Turnover Rate Green Down (-)
Workforce Stability Green Up (+)
Recruitment Efficiency Amber Down (-)
Sickness Absence Rate (Month 5) Amber Up (-)
Annual Appraisal Rate Red Up (+)
Mandatory Training Compliance Green No Change
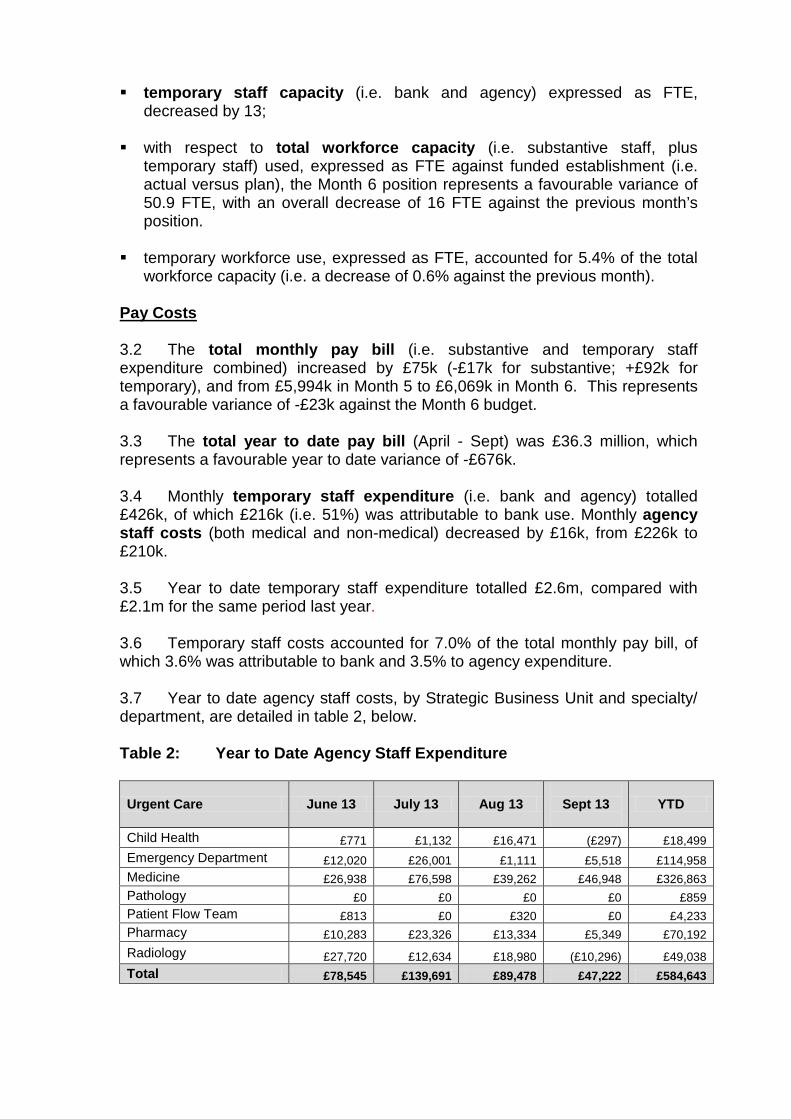
temporary staff capacity (i.e. bank and agency) expressed as FTE, decreased by 13;
with respect to total workforce capacity (i.e. substantive staff, plus
temporary staff) used, expressed as FTE against funded establishment (i.e. actual versus plan), the Month 6 position represents a favourable variance of 50.9 FTE, with an overall decrease of 16 FTE against the previous month’s position.
temporary workforce use, expressed as FTE, accounted for 5.4% of the total
workforce capacity (i.e. a decrease of 0.6% against the previous month).
Pay Costs 3.2 The total monthly pay bill (i.e. substantive and temporary staff expenditure combined) increased by £75k (-£17k for substantive; +£92k for temporary), and from £5,994k in Month 5 to £6,069k in Month 6. This represents a favourable variance of -£23k against the Month 6 budget. 3.3 The total year to date pay bill (April - Sept) was £36.3 million, which represents a favourable year to date variance of -£676k. 3.4 Monthly temporary staff expenditure (i.e. bank and agency) totalled £426k, of which £216k (i.e. 51%) was attributable to bank use. Monthly agency staff costs (both medical and non-medical) decreased by £16k, from £226k to £210k. 3.5 Year to date temporary staff expenditure totalled £2.6m, compared with £2.1m for the same period last year. 3.6 Temporary staff costs accounted for 7.0% of the total monthly pay bill, of which 3.6% was attributable to bank and 3.5% to agency expenditure. 3.7 Year to date agency staff costs, by Strategic Business Unit and specialty/ department, are detailed in table 2, below. Table 2: Year to Date Agency Staff Expenditure
Urgent Care June 13 July 13 Aug 13
Sept 13
YTD
Child Health £771 £1,132 £16,471 (£297) £18,499 Emergency Department £12,020 £26,001 £1,111 £5,518 £114,958 Medicine £26,938 £76,598 £39,262 £46,948 £326,863 Pathology £0 £0 £0 £0 £859 Patient Flow Team £813 £0 £320 £0 £4,233 Pharmacy £10,283 £23,326 £13,334 £5,349 £70,192 Radiology £27,720 £12,634 £18,980 (£10,296) £49,038 Total £78,545 £139,691 £89,478 £47,222 £584,643

Elective Care
June 13
July 13
Aug 13
Sept 13
YTD
Main Theatres, Surgical, Anaesthetics & Critical Care £24,391 £3,533 (£934) £5,917 £57,976
Obstetrics, Gynaecology & Surgical Specialties £25,724 £61,078 £41,188 £49,430 £273,889
Orthopaedics, Endoscopy & Day Theatres £12,708 £14,347 (£1,878) £18,152 £69,852
Private Patients (Kingston Wing) £3,168 £5,124 £4,852 £4,159 £30,971
Therapy £5,096 £0 £2,744 (£1,467) £11,468
Total £71,087 £84,083 £45,972 £76,191 £444,156 Corporate
June 13
July 13
Aug 13
Sept 13
YTD
Chief Executive £0 £12,960 £3,574 £7,007 £23,541 Facilities Management £45,374 £44,227 £49,199 £54,461 £261,480 Finance, PMO & Other services £47,941 £8,558 £35,205 £22,867 £165,870 Nurse Administration £274 (£934) £138 (£548) (£3,644) Research & Development, Clinical Trials £2,572 £2,572 £2,572 £2,572 £14,430 Total £100,162 £63,384 £90,687 £86,358 £461,677
Central Adjustment (£24,366) £0 £0 £0 (£62,846)
Total Agency Cost £225,428 £287,157 £226,137 £209,771 £1,427,630
Workforce Efficiency 3.8 The Sickness Absence Rate for Month 5 was 3.3%, (0.5% higher than the Month 4 performance) representing an adverse variance of 0.3% against target. 3.9 The highest levels of sickness in Month were recorded in the Emergency Department (6.1%), Orthopaedics (5.7%) and Kingston Wing (5.4%). 3.10 The Recruitment Efficiency Measures assess the effectiveness of the overall recruitment process. The measures are as follows: Time taken to fill a post, measured from the date of approval to recruit to the
date on which an individual is cleared to start work. The target of 60 calendar days was missed by 17 days.
Time taken to issue a confirmatory offer letter, further to a verbal offer of employment having been made. The target of two working days was achieved.
Time taken to issue a full contract of employment. The target of 4 calendar
weeks was achieved.

3.11 Between Month 5 and Month 6, Staff Turnover decreased by 0.7% to 13% (against a target upper limit of 15%). The rolling twelve-month average is 12.8%. Workforce Management 3.12 The percentage of staff remaining in date for their Annual Appraisal increased to 78%, against a target of 90%. 3.13 The percentage of staff remaining in date for all elements of their Mandatory Training remained at 81%, against a target of 80%. 4. HR UPDATES Leadership Development and Talent Management Leadership Development Programme 4.1 Within the evolving operating environment faced by the Trust, our continued success will require a bold and thoughtful style of leadership to be exercised by our senior managers and clinicians. Future leadership must be rooted in the absolute need to deliver safe and compassionate patient care and those individuals in both clinical and non-clinical leadership roles must demonstrate high levels of enthusiasm, energy, commitment and engagement, at a personal level, but also an appreciation of the key factors that influence behaviours and attitudes to change within others. Successful managers and leaders must be prepared to re-consider how they and their teams work, challenge current practice, and think beyond their own local and professional interests. 4.2 In recognition of this required shift from the traditional ‘command and control’ style of leadership, to one which is inspirational, facilitative, supportive, empowering and more ‘visible’, it is proposed to deliver a YDH Leadership Development Programme - ‘Leadership for a Purpose’ - commencing in January 2014. The Programme will focus on four key themes, namely Service Leadership; People/Personal Leadership; Quality Leadership, and Collaborative Leadership, and aims to offer a degree of intellectual challenge; motivational support; credibility through experienced and skilled facilitation; a range of delivery methods, and a ‘feel good’ factor for participants. Whilst theory has its place, the main emphasis of the Programme is on practical learning and knowledge transfer. 4.3 Locally designed, the Programme will include four key phases, namely: Diagnostic; Core Delivery; Supported Learning (through Action Learning Sets), and Evaluation. Three separate Modules, delivered over nine months, will each include three Units, as follows: Module 1 Unit 1 - Mission, Vision, Values, Expectations; Unit 2 - Customer Focus; Unit 3 - Leading and Managing People through Change;
Module 2 Unit 4 - Working Effectively;

Unit 5 - Assessing Performance; Unit 6 - Leadership of Self and Others; Module 3 Unit 7 - Financial Management; Unit 8 - Clinical/Business Planning; Unit 9 - Maximising Individual and Team Performance. 4.4 A Development Programme of this nature represents an important investment for the Trust and for those individuals participating. As such, successful delivery and outcomes are unlikely to be achieved without expert facilitation. Hence, the Trust has partnered with POD South West, which is a specialist consultancy in the field of organisational learning and development. Since the Programme will very much emphasise and aim to embed our organisational values, expectations and strategic goals, periodic involvement is also required from a number of key individuals from within the Trust (e.g. from Finance, Operations, and the executive team). 4.5 For the first cohort, a total of 24 individuals, occupying leadership positions across a range of staff groups, have been selected to participate in the Programme. A successful bid via the South West Leadership Academy has secured funding of £25k, which represents 70 per cent of the total Programme cost. Talent Management Framework 4.6 Aligned with, and in support of leadership development and succession planning, a Talent Management Framework is being established, which aims to help ensure the Trust continues to develop and retain the ‘people’ capabilities, commitment and behaviours needed to deliver future organisational success. This means recruiting/promoting the right people, with the right skills and values to the right roles; identifying rising talent and applying a consistent measure to assess individuals’ potential, and providing access to opportunities and ‘stretch’ development that enable people to achieve their potential. 4.7 Within the Talent Management Framework, a local ‘potential model’ is proposed, which assesses the behaviours and attributes demonstrated in an individual’s current role, with respect to four key dimensions, namely: Influencing Skills Personal Agility Results Orientation Strategic Awareness The model is intended to be used alongside, and to be informed by regular performance appraisal assessments and discussions, and to be fully shared with individuals. The combination of performance assessment and evaluation of potential (via consideration of the four key dimensions) will enable the ‘mapping’ of talent within teams and across the organisation. 4.8 The Framework provisions and proposed ‘potential model’ have been well-received by members of the Hospital Management Team. Initially, the aim is for every individual occupying a band 7 position, or above, and every individual

occupying a clinical leadership position, to be ‘talent mapped’. Respective positioning on the talent map will inform the consideration and application of appropriate development interventions: These could include leadership development programmes, secondments, discreet assignments, coaching, mentoring, or a combination of such activities. Concurrently, talent mapping will provide a baseline for establishing succession plans for key roles within the organisation. 5. RECOMMENDATION 5.1 The Trust Board is asked to note the Month 6 position. Appendices: 1 Workforce Dashboard - Sep 13 (Month 6) 2 Workforce Scorecard - Sep 13 (Month 6)

Appendix 1
Sept -13 (M6) Aug - 13 (M5) Target Variance
Movement in Month
Funded Actual £42,167 -£50 2.8% -0.2% 1.6%Substantive 1,648.9 1,605.9 -43.0 3.9% 0.9% 1.1%Agency 58.3 39.3 -19.0 Urgent Care 2.9% -0.1% -0.7%Bank 66.2 52.7 -13.5 3.3% 0.3% 0.5%Total FTE 1,773.4 1,748.8 1,697.9 -75.5
Substantive Staff by SBU (FTE)
Baseline Mar -13
Movement in Month
Corporate Services 318.7 -2.3Elective Care 707.9 -1.8Urgent Care 622.3 1.0Total Substantive 1,648.9 -3.0
Corporate Services 30.2 -1.6
Elective Care 38.6 -3.5Urgent Care 55.7 -8.4Total Temporary 124.5 -13.5 Total Bank / Locum Cost (£k)
Total Temporary Cost (£k)
21.3
Baseline Mar -13 Sept -13 (M6)
WORKFORCE MANAGEMENT
-1692.0
21039.3Element Movement in Month
Annual Appraisal Rate
Turnover Rate
216426
10992
Pay Costs
WORKFORCE EFFICIENCY (I)
Trust
Mandatory Training Compliance
Bank and Agency Expenditure
Total Agency Cost (£k) Sept -13 (M6)
607.9
Movement in Month
31.4
Sept -13 (M6)
302.1
1,605.8
695.8
Temporary Staff by SBU (FTE)
Sept -13 (M6)
WORKFORCE DASHBOARD - SEPT 2013 (MONTH 6)
Division
Elective Care
WORKFORCE CAPACITY & COST (I) WORKFORCE EFFICIENCY (II)
Workforce Employed Sickness Absence RateUnit Labour Cost
WORKFORCE CAPACITY & COST (II)
Full Time Equivalent (FTE)
Baseline Mar-13
Movement in Month Variance fromBaseline
Corporate Services
1,500
1,550
1,600
1,650
1,700
1,750
1,800
Oct-12 Nov-12 Dec-12 Jan-13 Feb-13 Mar-13 Apr-13 May-13 Jun-13 Jul-13 Aug-13 Sep-13
Substantive Employed (FTE) Temp Worked (FTE)
£4,000
£4,500
£5,000
£5,500
£6,000
£6,500
Oct-12 Nov-12 Dec-12 Jan-13 Feb-13 Mar-13 Apr-13 May-13 Jun-13 Jul-13 Aug-13 Sep-13
Substantive Pay Cost £k Temporary Pay Cost £k Pay Budget £k
36,000
40,000
44,000
48,000
Oct-12 Nov-12 Dec-12 Jan-13 Feb-13 Mar-13 Apr-13 May-13 Jun-13 Jul-13 Aug-13 Sep-13
Actual Baseline 12/13
£0
£100
£200
£300
£400
£500
£600
£700
Oct-12 Nov-12 Dec-12 Jan-13 Feb-13 Mar-13 Apr-13 May-13 Jun-13 Jul-13 Aug-13 Sep-13
Total Agency Spend £k Total Bank Spend £k Total Temporary Spend £k
9%
10%
11%
12%
13%
14%
15%
16%
Oct-12 Nov-12 Dec-12 Jan-13 Feb-13 Mar-13 Apr-13 May-13 Jun-13 Jul-13 Aug-13 Sep-13
Actual Target (Lower Limit) Target (Upper Limit)
2.0%
2.5%
3.0%
3.5%
4.0%
4.5%
Oct-12 Nov-12 Dec-12 Jan-13 Feb-13 Mar-13 Apr-13 May-13 Jun-13 Jul-13 Aug-13
Actual Target
60%
65%
70%
75%
80%
85%
Oct-12 Nov-12 Dec-12 Jan-13 Feb-13 Mar-13 Apr-13 May-13 Jun-13 Jul-13 Aug-13 Sep-13
Actual Target
50%55%60%65%70%75%80%85%90%95%
Oct-12 Nov-12 Dec-12 Jan-13 Feb-13 Mar-13 Apr-13 May-13 Jun-13 Jul-13 Aug-13 Sep-13
Actual Target

Appendix 2 Workforce Element/Measure Oct-12 Nov-12 Dec-12 Jan-13 Feb-13 Mar-13 Apr-13 May-13 Jun-13 Jul-13 Aug-13 Sep-13
Substantive Workforce
Substantive Headcount 1,995.0 2,005.0 1,993.0 1,985.0 1,994.0 1,979.0 1,955.0 1,948.0 1,950.0 1,967.0 1,927.0 1,923.0
Substantive FTE ( Contracted) 1,657.2 1,665.6 1,655.6 1,651.6 1,662.0 1,648.9 1,633.5 1,628.0 1,625.1 1,642.5 1,608.8 1,605.9
Temporary Workforce
Temporary (Bank and Agency) FTE - Actual 98 101 78 94 109 124 111 95 99 108 105 92
Total Workforce
Total FTE (Substantive & Temporary) - Actual 1,755.20 1,766.63 1,733.83 1,745.25 1,771.23 1,773.35 1,744.33 1,723.10 1,723.89 1,750.47 1,714.25 1,697.86
Temporary Workforce Use
Temporary Workforce as % of Total Workforce (FTE) 5.6% 5.7% 4.5% 5.4% 6.2% 7.0% 6.4% 5.5% 5.7% 6.2% 6.2% 5.4%
Pay Costs (£k)
Total Substantive Cost - Actual 5,775.0 5,686.0 5,619.2 5,861.0 5,624.0 5,649.0 5,660.0 5,575.0 5,563.0 5,674.0 5,660.0 5,643.0
Total Temporary Cost - Actual 381.3 387.7 315.4 407.9 583.4 579.7 528.0 410.0 414.0 470.0 334.0 426.4
Total Pay Cost - Actual 6,156.3 6,073.7 5,934.6 6,268.9 6,207.4 6,228.7 6,188.0 5,985.0 5,977.0 6,144.0 5,994.0 6,069.0
Total Pay Cost -Budgeted 6,164.3 6,042.5 6,035.7 6,330.0 6,228.0 6,272.6 6,229.0 6,171.0 6,178.1 6,222.4 6,141.5 6,092.4
Total Pay Cost - Variance -8.0 31.2 -101.1 -61.1 -20.6 -43.9 -41.0 -186.0 -201.1 -78.4 -147.5 -23.4
Absence
Sickness Absence - Actual 4.2% 4.2% 3.7% 3.9% 3.6% 3.6% 4.1% 3.2% 3.2% 2.8% 3.3% N/A
Sickness Absence - Target 3.0% 3.0% 3.0% 3.0% 3.0% 3.0% 3.0% 3.0% 3.0% 3.0% 3.0% 3.0%
Sickness Absence - Variance 1.2% 1.2% 0.7% 0.9% 0.6% 0.6% 1.1% 0.2% 0.2% -0.2% 0.3% N/A
Maternity Leave - Actual 0.0% 0.0% 0.0% 0.0% 0.0% 0.0% 0.0% 0.0% 0.0% 0.0% 0.0% 0.0%
Turnover
Substantive Staff Turnover 11.4% 11.4% 11.8% 12.8% 13.4% 13.1% 13.3% 11.1% 12.7% 12.8% 12.8% 13.0%
Stability
Substantive Staff Stability 88.8% 88.4% 88.4% 88.6% 87.7% 87.8% 87.2% 87.5% 88.2% 90.0% 88.2% 90.0%
Annual Appraisal
Appraisal Rate - Actual 79.0% 79.0% 78.0% 76.0% 73.0% 72.0% 75.0% 75.0% 78.0% 77.0% 77.0% 78.0%
Appraisal Rate - Target 90.0% 90.0% 90.0% 90.0% 90.0% 90.0% 90.0% 90.0% 90.0% 90.0% 90.0% 90.0%
Appraisal Rate - Variance -11.0% -11.0% -12.0% -14.0% -17.0% -18.0% -15.0% -15.0% -12.0% -13.0% -13.0% -12.0%
Mandatory Training
Mandatory Training - Actual 72.0% 73.0% 73.0% 74.0% 74.0% 75.0% 76.0% 79.0% 80.0% 81.0% 81.0% 81.0%
Mandatory Training - Target 80.0% 80.0% 80.0% 80.0% 80.0% 80.0% 80.0% 80.0% 80.0% 80.0% 80.0% 80.0%
Mandatory Training - Variance -8.0% -7.0% -7.0% -6.0% -6.0% -5.0% -4.0% -1.0% 0.0% 1.0% 1.0% 1.0%

Report to: Board of Directors Report from: Chief Finance and Commercial Officer Subject: Monthly update Date: 12th November 2013 Estates update The Master Plan work has made further good progress and a presentation will be given to outline the plans at the Board meeting. Assuming the Board agree with the direction the next stage will involve consultation with interested parties. The planning application for demolition of Cheverton has been approved, and asbestos removal will commence over the winter. We may delay demolition to dovetail in with the master plan work, notably to enable preliminary works for construction of a multi-storey car park. The combined heat & power (boiler) project continues and is on schedule. Other major current internal work includes the upgrading of Ward 6A to be dementia friendly which is substantially government funded, as well as work to combine the physio/cardio gyms and build the frail elderly persons assessment unit in the day hospital. We are looking at the configuration of the main entrance of the hospital. Plans and costing will be shared in due course. The aim is to provide a much stronger sense of arrival for patients and visitors, as well as grouping retail, catering and patient service facilities together to promote both efficiency of operation and revenue generation. Finally there is a focus on fixing visible routine maintenance issues and a programme is being reviewed and costed. Cost Improvement Programme
Currently the PMO team continues to forecast a £1m shortfall of cost savings programmes vs. the required value. An update will be given at the Board meeting. The forecast assumes delays on some material programmes however whilst the saving in the current year will be lower than planned the expectation is that the full year effect next year will be substantial.
The final £300k of transitional support assumed in our budget has been confirmed from Somerset CCG.
Financial position
At the time of writing October results were not available and an update will be given at the Board. A forecast for the balance of year for 13/14 and high level outlook for 14/15 will be presented at the Board meeting. In summary we are expecting 13/14 to be close to budget, and for 14/15 to have another challenging CIP to balance the books. The latter is not a surprise however it is critical that the 14/15 budget reflects CIP plans to reduce the risk of underperformance. Somerset CCG has indicated that their commissioning intention is that revenue will be flat for 14/15 and further transitional support will be available – only for 14/15

– but this support is dependent on some collaboration on transforming services between the acute providers in Somerset. Discussions on the 14/15 contract with Dorset CCG and Specialist Commissioners have not yet commenced.
Strategic partnerships
We are fortunate that we have been successful in attracting a graduate secondment from GSK who starts in January. A key task will be to project manage the progression of the OJEU for the strategic estates partner. In addition she will work with our pharmacy team to start the process of finding a strategic partner for pharmacy services. Smartcare (electronic patient record) The procurement work continues as well as preparatory work to engage front line staff. The aim is to ensure that the project is clinically led to ensure appropriate design and buy in. Having successfully completed the initial shortlisting, there are now 5 potential suppliers who are completing their responses for evaluation. YCloud YCloud (replacement of the intranet site) was launched with the new branding on 15 Oct, and has received a very positive response from staff. There is strong demand for the development of “Apps” for departments, so focus has been on consolidating existing requests especially those which promote efficiency of operation, whilst minimising new developments. The ‘Trauma Board’ was launched last week, and Diabetes is in development.
Tim Newman
CLINICAL GOVERNANCE ASSURANCE COMMITTEE (CGAC)
Minutes of a meeting of the Clinical Governance Assurance Committee held on
8 November 2013 at Yeovil District Hospital
Present: Jane Henderson (Chair) [JH] Non-executive Director Maurice Dunster [MD] Non-executive Director Mark Saxton [MS] Non-executive Director Peter Wyman [PW] Chairman In Attendance: Jonathan Howes [JHo] Medical Director Helen Ryan [HR] Director of Nursing and Clinical Governance Jo Howarth [JHow] Associate Director of Nursing for Patient Safety
& Quality Simon Chase Company Secretary Ian Fawcett Public Governor (Observer) Sue McInnes Public Governor (Observer) Jonathan Higman [JHig] For item 62/13 Medical Records Management Apologies: Adrian Pickles Trust Risk Manager
Action 54/13 Welcome & apologies
Jane Henderson welcomed the governors and Chairman. Apologies from Adrian Pickles were NOTED.
55/13 Minutes of the Last Meeting The minutes of the meeting held on 20 September 2013 were APPROVED.
56/13 Matters Arising One matter was discussed: a) The support for the Medical Director role. Jon Howes confirmed a
Business Manager has been appointed and starts 11 November 2013.
57/13 Action Sheet The Action Sheet was NOTED.
58/13 External Reports 1. Issues at Colchester NHS Foundation Trust The Committee noted the issues concerning the manipulation of cancer patient records that had arisen at Colchester. The meeting discussed the cultural influences on NHS organisations arising from regulators and the pressure (real or perceived) to meet targets, and those within YDH. The internal auditors are being asked to review Trust’s data and systems to provide assurance that similar issues would not arise or escape detection at YDH. The Committee welcomed the approach the Trust was taking to ensure its own arrangements were robust. Coincidentally, staff from YDH had arranged to visit the Business Intelligence Unit at Colchester, which had been instrumental in highlighting the problems at that Trust. 2. Raising Concerns The Governors sought reassurance about the degree of staff confidence

in raising concerns and how open and non-punitive the Trust’s culture was. Jo Howarth explained the significant emphasis that has been placed on encouraging staff to voice concerns over the last few months, and the Trust’s policies and provisions for staff to raise concerns were being revised. The Committee requested a simple flow chart setting out the routes for raising concerns so that it could review whether the provisions were comprehensive. MD suggested that the Trust might consider appointing its own independent ‘ombudsman’, to whom staff could bring concerns that they might be reluctant to raise in the management chain. Helen Ryan highlighted the importance of supporting the services and departments that were self-contained and may be less aware of how to raise concerns. 3. Safety allegations received Jon Howes informed the Committee of an issue that had arisen from a consultant interview process. One candidate had made allegations regarding the safety of the particular service. The Trust was taking these seriously and investigating the issues raised, and had already instigated an internal review. This would be supplemented by a further review group including external representatives. The CQC has also been informed of the issues and would receive a copy of the internal review’s report. The Committee noted the actions taken and endorsed the approach taken to bottom out whether there was substance to the allegations.
JHow
59/13 “Intelligent Monitoring” The Committee reviewed the CQC’s new approach to risk monitoring and the contents of the first report. Helen Ryan explained that the Trust is responding firstly by scrutinising the data to make sure they are wholly reliable; secondly by identifying the risk areas and thirdly by assessing whether the Trust can anticipate the findings of future reports by improving its own “real time” data and evaluation of risk. The Committee discussed the whistleblowing alert noted in the report. It was confirmed that a member of staff had contacted the CQC regarding a safety risk in their area. However, the CQC had declared that it was their policy not to disclose any details, which left the Trust in a difficult position in terms of identifying and dealing with the risk. Nevertheless, the Trust was seeking to respond to any clinical areas where they may be pressures and concerns. For example, the Urgent Care and Long Term Conditions Strategic Business Unit is working with Radiology, where there have been significant changes in working practice and staff are being supported through this process. The Committee also discussed the other areas where the data item had indicated an increased risk. The Trust had reviewed these to confirm there are no substantive issues. It was confirmed that at the next CQC engagement meeting the issues arising from the data presented in the tool would be discussed. The Trust was also reviewing the processes for generating its data to ensure they were of the highest quality. JH asked that the Trust’s data experts also consider writing to their opposite numbers in CQC to raise any concerns issues about data quality and timeliness. In conclusion, the Committee was very pleased with the Trust’s response and approach.
60/13 Complaints Management
Helen Ryan provided an update on arrangements and referred specifically to the recently-published report arising from Anne Clwyd’s review of the NHS complaints system. This report would be circulated with the minutes. The Committee was informed that the report was very helpful and the Trust’s own work strengthening its process elements worked with the same grain. The Trust was also moving to work on resolving complaints without requiring all the bureaucratic elements where these added little or no value. Instead, the focus would be on rapid resolution of the problems raised and also identifying how future issues could be prevented from occurring. In tandem with this the array of services related to first contact with patients and relatives were being redesigned to provide a much higher standard of responsiveness. Helen Ryan was leading a gap analysis of the Clwyd report and would bring the matter to the Board for review and action. The Council of Governors will have an update session on complaints at their meeting on 6 December 2013.
SC
HR
61/13 Medical Records Management Jonathan Higman explained the current position on the Trust’s paper records in the light of the eventual arrival of the electronic health record. He emphasised that audits indicate that the standard of records and their availability are good. Pathology records are being moved to a wholly electronic arrangement, which will eliminate considerable amounts of paper. It was noted that the greatest risk for the Trust arises from constraints to the physical storage of these paper records, which were proliferating at a rate of 13k records per month. The Electronic Health Record will resolve this issue in due course, but due to the false start related to Connecting for Health, the problems of storage have persisted for longer than expected, and some mitigating actions were being put in place. The Committee discussed the matter and concluded that whilst there was a clear logistical issue that needed to be managed, the risk to quality of care arising from present arrangements was minimal. In addition it noted that the Trust was looking at ways of implementing digital alternatives to multiple pieces of paper, thus simplifying work and improving quality. There was also discussion of the opportunities and risks to scanning notes. It was agreed that an audit of the quality of records already scanned would be undertaken.
JHig
62/13 First Impressions Jo Howarth shared her thoughts and impressions on returning to the Trust. She identified opportunities to strengthen a range of systems and processes to improve its management of risk above the immediate operational level and to bring those systems into clearer alignment with the Trust’s current management structure. The Trust Risk Register had been reviewed and would soon be re-launched, along with a process to ensure that this was and remained a live document. In addition, the Assurance Framework was being revised.

The Committee welcomed the initiative to move the culture of patient safety from a reactive to a proactive emphasis.
63/13 Safer Care South West Jo Howarth explained how the South West Patient Safety Programme is being re-launched to support improvement work and rebuild a learning network. This is an important element in moving forward in driving improvement across the Trust. The junior doctors’ audit programme is being re-engineered to make the projects far more meaningful improvement programmes both for the doctors and for the Trust. Helen Ryan praised Jo Howarth for the work she has done since arriving and thanked her for what she has achieved.
64/13 Clostridium Difficile Helen Ryan explained the challenges the Trust faced in not exceeding the year threshold of nine. A number of trusts have found that their numbers were already at the limit. YDH currently had seven, but there has been a recent change in thinking which has turned the focus on to how many cases are avoidable or unavoidable. Discussions with the CCG and further case reviews will focus on how many of the seven were avoidable. The expectation is that two will have been avoidable and when this is agreed in writing the Trust will seek the same understanding with Monitor. The Trust is focusing on appropriate management and ensuring correct prescribing practices. The Committee was very satisfied with this approach.
65/13 Francis Report It was agreed to address this matter fully at the next meeting.
66/13 End of Life Care Pathway The Trust is thoroughly reviewing its arrangements, but YDH’s pathway was still being used as this provides the right framework for patients.
66/13 Friends and Family Monthly reports were providing a better picture which can be used to identify and outlying performance areas that may indicate a pattern. Individual comments, both positive and negative, were being fed back to clinical areas. A full analysis would be brought to a future meeting.
67/13 Any Other Business 1. Maurice Dunster reported on a meeting with Sue Baker and agreed that when the new patient experience arrangements were fully in place the effectiveness of this approach would be audited in an appropriate way. 2. Company Secretary: As this was his last meeting Jane Henderson thanked Simon Chase for his work with the Committee in its various incarnations over a number of years
68/13 Date of Next Meeting The next meeting will be Friday 10 January 2014.

Report to: Board of Directors Report from: Company Secretary Subject: Board Evaluation Process Date: 20 November 2013 1. Introduction Regular evaluations of the Board of Directors are important exercises in themselves and are also expected under the provisions of Monitor’s Code of Governance. That Code also refers to “the desirability for independent assessment”. To that end the Chairman has explored the options for undertaking a cost-effective and proportionate independent assessment of the Board’s effectiveness. 2. Arrangements A Board evaluation exercise will be undertaken, facilitated by EY (Ernst & Young LLP). This will involve a template questionnaire based on the Trust’s constitution and the Code of Governance and subject to any amendments we would like to make. The first stage will be a questionnaire sent to each director for return directly to EY. The second stage will be follow-up interviews with each director. Then a report based on the findings will be prepared and shared with the Chairman. The final stage will be submission of the report to the Board. In order to minimise the costs of this exercise it is expected that EY will carry out the work by phone or email and will not attend Board for the presentation of the report. 3. Timetable There will be two weeks allowed for the completion and return of the questionnaire and on that basis the whole process will take between four and six weeks. It is intended to complete this process before the end of the financial year. 4. Recommendation The Board of Directors is asked to NOTE the arrangements for Board evaluation.

All information provided must remain on this sheet only
BOARD OF DIRECTORS PAPER
TITLE: Medical Appraisals Update DATE: 20th November PRESENTED BY: Jonathan Howes (Director and any others attending) PAPER PRESENTATION PAPER & PRESENTATION (Indicate which is true) What is this item about? Update on current position with regard to medical staff appraisal rates. Why is this item necessary? For information & assurance to the Board & NHS England. What is the Board asked to do? To note & approve 1. How does this paper improve patient care? Ensure doctors are up to date & fit to practice. 2. How does this paper advance the Annual Plan? Essential to have a fully engaged, up to date work force with clear development plans to ensure delivery of key trust objectives. 3. How does this advance our strategic objectives? As above 4. Is further information available? Yes Are there implications for the Trust? • Legally? yes • Financially? yes • Regarding Workforce? yes Is this paper clear for release under Freedom of Information? YES

Action Plan Template Please complete the below action plan and return to: [email protected] by 8th November 2013 Name of designated body Yeovil District Hospital
Name of responsible officer Jonathan Howes
What is your projected appraisal completion rate for 13/14: >90%
What is your current appraisal completion rate as at 30 September 2013: 83% (116/140) appraised within last 12 months Since 01/04/2013: 68 (49%) completed appraisals 48 (34%) appraisals due between 01/10/2013 – 31/03/2014 7 (5%) new starters not due appraisal until 14/15 4 (3%) new starters due 1st appraisal between 01/01/14 – 31/03/2014 13 (9%) appraisals overdue at 30/09/2013
What is your plan to achieve your projected year end appraisal rate: On target to achieve an appraisal rate of > 90% by year end (as described in audit process below)
What is your escalation plan for non-engagement? (also see audit process below)
• Email reminder at due date and monthly at 13 and 14 months post last appraisal • Letter from appraisal lead when 15 months since last appraisal • Meeting with appraisal lead if on-going failure to engage within 1 month of letter • Letter from Responsible Officer • Discussion with ELA if no progress towards appraisal within 2 weeks of letter from
RO and meeting with the RO
Please detail your process for auditing incomplete and missed appraisals? Each month the Deputy Responsible Officer / Appraisal Lead reviews the Trust Appraisal Database and the electronic appraisal system (PremierIT) to identify all due, overdue and

incomplete appraisals. Those due (12-15 months since last appraisal) an annual appraisal are contacted with a reminder email and details of support available if any difficulties are being experienced. Those who are overdue (> 15 months since last appraisal) their appraisal, or for whom no evidence of a completed satisfactory appraisal is available, are sent a letter requesting immediate action to rectify the situation. In the case of incomplete appraisals, the individual is contacted by the Appraisal Lead to discuss the particular omissions etc. If no appraisal date is set and supporting information not uploaded onto the e-portfolio system in preparation for the appraisal within 4 weeks, the individual (and their Clinical and Divisional Director) is sent a letter from the Responsible Officer with a deadline for action specified and the individual is contacted by the Deputy Responsible Officer to discover the reason for the missing appraisal and whether additional support is needed. Clinical Directors are required to encourage and facilitate medical staff appraisal. If the appraisal is not completed within the specified time, the individual is required to meet with the Responsible Officer to discuss non-engagement. Each month the Responsible Officer and Divisional Directors receive a copy of the appraisal data spread sheet with the Trust’s appraisal position and the appraisal status is a standing item on the agenda of a quarterly meeting of the Trust Revalidation Group.
Please attach your last audit of missed or incomplete appraisals – see attached
What are the common themes in regard to appraisal challenges faced by either the doctor or organisation and how are these being addressed?
• Lack of familiarity with the electronic e-portfolio and appraisal system – training readily available from Health Informatics Team and additional information provided on the Trust Medical Appraisal webpage
• SAS doctors have faced a steep learning curve in moving towards a uniform and rigorous appraisal system – this has been addressed by regular email and face to face contact with the Trust Appraisal Lead and a formal ‘Appraisal and Revalidation’ training day for all SAS doctors.
How is this appraisal information presented to your Board and with what frequency? Appraisal data for all Trust staff presented as a standing item on the monthly agenda. Data presented in aggregated form and broken down by business unit. Last presented 16th Oct 2013.
As responsible officer I confirm that the information above has been discussed and agreed with my Board or equivalent
Signature & Date
Date of Board sign-off (To be presented to the Trust Board on 20th November 2013)