board composition, corporate performance, and … composition, corporate performance, and the...
TRANSCRIPT
Board Composition, Corporate Performance, and the Cadbury Committee Recommendation
Jay Dahya Baruch College
and
John J. McConnell Purdue University
First draft: February 25, 2003
May 22, 2003
JEL Classifications: G38 (Government policy), G34 (Corporate governance), D21 (Firm behavior) Corresponding author: John J. McConnell, Krannert School of Management, Purdue University, West Lafayette, IN 47907. [email protected]

Board Composition, Corporate Performance, and the Cadbury Committee Recommendation
Abstract
During the 1990s and beyond, countries around the world have witnessed calls and/or mandates for more outside directors on publicly-traded companies’ boards even though extant studies find no significant correlation between outside directors and corporate performance. We examine the connection between changes in board composition and corporate performance in the UK over the interval 1989–1996, a period that surrounds publication of the Cadbury Report calling for at least three outside directors for publicly-traded corporations. We find that companies that added directors to conform with this standard exhibited a significant improvement in operating performance both in absolute terms and relative to various peer-group benchmarks. We also find a statistically significant increase in stock prices around announcements that outside directors are added in conformance with this recommendation. We do not necessarily endorse mandated board structures, but the evidence appears to be that such a mandate was associated with an improvement in performance in UK companies.

Board Composition, Corporate Performance, and the Cadbury Committee Recommendation
During the 1990s and beyond, the global economy appears to have become caught up in
what might be described as “outside director mania” - - at least 24 countries have witnessed
publication of guidelines that stipulate minimum levels for the representation of outside directors
on boards of publicly traded companies. At the time of their publication, in most countries, these
minimum standards represented a dramatic increase in outside director representation. A
presumption that appears to underlie this movement toward more outside directors is that boards
with more outside directors will lead to better board decisions and, as a consequence, better
corporate performance. In large measure, this presumption rests more on faith than evidence.
As observed by Sanjai Bhagat and Bernard Black (1999) and Benjamin E. Hermalin and Michael
S. Weisbach (2003), various studies of the relationship between board composition and corporate
performance appear to show that board composition affects the way in which boards accomplish
certain discrete tasks, such as hiring and firing the CEO, responding to hostile takeovers, setting
CEO compensation and so forth (James A. Brickley, Jeffrey L. Coles, and Rory L. Terry (1994),
James A. Brickley and Christopher James (1987), John W. Byrd and Kent A. Hickman (1992),
John E. Core, Robert W. Holthausen and David F. Larcker (1999), James F. Cotter, Anil
Shivdasani, and Marc Zenner (1997), Jay Dahya, John J. McConnell and Nikolaos G. Travlos
(2002), Omesh Kini, William Kracaw and Shehzad Mian (1995), Anil Shivdasani (1993), and
Michael S. Weisbach (1988)). However, other studies generally report little or no correlation
between board composition and corporate profitability (Anup Agrawal and Charles R. Knoeber
(1996), Sanjai Bhagat and Bernard Black (2002), Benjamin E. Hermalin and Michael S.
Weisbach (1991), and Hamid Mehran (1995)).

2
Three related explanations have been offered as to why prior studies might fail to find a
relationship between board composition and corporate performance even if one exists. First,
board composition is endogenous. Thus, if board composition does affect corporate
performance, but every board is at its optimum construction, no relationship between board
composition and corporate performance will be observed in a cross-section (Harold Demsetz and
Kenneth Lehn (1985)). Second, firms tend to add outside directors during periods of poor
performance. Thus, outside directors may become more prominent in poorly performing firms.
If so, then even if outside directors do lead to improved performance, in a cross-section, the
relationship will be obscured (Hermalin and Weisbach (2003)). Third, prior studies have
focused primarily on US companies and most US companies have boards that are and have been
dominated by outside directors for many years. Thus, it is difficult to find boards with few
outside directors to serve as a control group and, because boards rarely undergo radical and swift
alterations, the effect of changes in board composition on corporate performance is difficult to
discern.
In this study, we investigate further the relationship between outside directors and
corporate performance. As a laboratory for our analysis, we use the UK over the years
surrounding the issuance of the Report of the Committee on the Financial Aspects of Corporate
Governance, commonly known as the Cadbury Report, published in December 1992. This
Report established a minimum number of three outside directors for publicly traded UK firms.
As documented by Dahya, McConnell and Travlos (DMT) (2002), the years following
publication of the Report witnessed widespread increases in the number and fraction of outside
directors on UK boards.
By using UK firms in our analysis, we hope to circumvent, or at least alleviate, some of

3
the shortcomings attributed to studies conducted with US data. First, it can be argued that the
Cadbury Report represented an exogenous shock that perturbed UK board structures. Second, to
the extent that boards were coerced into adding outside directors, directors were just as likely to
have been added during a period of good performance as during a period of poor performance.
And, third, the significant changes in board composition that followed publication of the Report
were concentrated over a relatively short interval thus providing a large sample of boards with
altered structures so as to permit a clean before- and after-event analysis.
Beyond these reasons, exploration of the effect of the adoption of the Cadbury Report
recommendation on corporate performance is interesting in its own right because, in terms of
GDP, the UK is the world’s 7th largest economy and, according to market capitalization, the
London Stock Exchange (LSE) is the world’s 3rd largest stock market (after the New York Stock
Exchange and Nasdaq). It is also interesting because many other countries appear to have
modeled their Codes of Best Governance along the lines of the Cadbury Report. Because the
Cadbury Report was one of the first of such national Codes, it has now been in effect long
enough to observe what, if any, impact it has had on corporate performance. Thus, this study can
be thought of as a preview of what might occur in other countries that have adopted similar
Codes.
The primary question that we address is whether UK companies that came into
compliance with the Cadbury Report recommendation of having at least three outside directors
experienced an improvement in performance. We measure performance in two ways. First, we
compare the return on assets (ROA) for companies that came into compliance with the Cadbury
recommendation against various benchmarks. The benchmarks are composed either of
companies already in compliance with the recommendation at least four years prior to the

4
Cadbury Report or of companies that never complied with the recommendation during the period
of our analysis. Second, we conduct an event study of stock prices around announcements that
companies were appointing a sufficient number of outside directors so as to conform with the
recommendation.
We find that compliance with the Cadbury recommendation is followed by a statistically
and economically significant improvement in operating performance regardless of the
performance benchmark employed. For example, from one year before to two years after
adoption of the Cadbury recommendation, the adopting firms experienced a statistically
significant increase in average ROA of 2.50%, from 7.04% to 9.54%. Over the same time
interval, the adopting companies’ industry peers experienced an insignificant increase in average
ROA of 0.33%, from 8.69% to 9.02%.
The data also show that, in the year prior to adoption, on average, firms that came into
compliance with the Cadbury recommendation exhibited relatively low ROAs. It could be that
earnings are mean reverting such that companies that adopted the recommendation would have
rebounded anyway and that what we observe is merely a natural mean reversion in earnings. To
address that possibility, we match adopting companies with industry peers on the basis of ROA
using a version of the Brad M. Barber and John D. Lyon (1996) performance-matching
methodology. Against this benchmark too, companies that adopted the Cadbury
recommendation experienced a statistically and economically significant improvement in ROA
in comparison with companies that were already in compliance with the Cadbury
recommendation and in comparison with companies that never came into compliance during the
period of our analysis.
As regards the event study of stock returns, instances in which a company with fewer

5
than three outside directors announced additions of outside directors that increase the number of
outsiders to three or more are accompanied by an average 2-day excess return of 0.44%. In
comparison, the average 2-day excess return associated with announcements of the addition of
inside directors is 0.17%. The difference between the two is statically significant. Thus, the
reaction of investors to the announcement that a firm has complied with the Cadbury
recommendation is consistent with an expectation by investors that the decision will lead to an
improvement in operating performance - - and our analysis documents such an improvement.
Numerous caveats are in order. Perhaps the most important is that we do not offer up our results
as a blanket endorsement of mandated minimum levels for outside directors. The results do
show that companies that increased their number of outside directors to meet the Cadbury
standard experienced a significant improvement in performance, but that experience may be
unique to the UK or to the time period studied. Other studies of other countries will provide
insight regarding the extent to which the outcome in the UK can be generalized.
The next section briefly reviews prior studies of board composition and corporate
performance and provides further details about the Cadbury Report. Section 3 describes the
sample and data used in our analysis. Section 4 presents the results of our analysis of operating
performance. Section 5 contains the results of our event study of stock prices. Section 6
presents sensitivity analysis and tests of whether splitting the positions of Chairman of the Board
and CEO influenced performance. It does not. Section 7 provides a commentary and
conclusion.
I. Background
A. Prior studies
Bhagat and Black (1999) and Hermalin and Weisbach (2003) provide excellent and

6
extensive surveys of prior studies of the connection between board composition and corporate
decisions. Thus, our review of this literature will be brief.
Studies of the relationship between board composition and performance fall into one of
two categories. In the first, various measures of corporate performance are regressed against the
fraction of the board composed of outside directors. For example, Benjamin E. Hermalin and
Michael S. Weisbach (1991) study a sample of 134 NYSE firms at three year intervals over the
period 1971 through 1983. They regress operating earnings and Tobin’s Q against the fraction of
the board made-up of outside directors and various control variables. They experiment with
various specifications of their regressions, but in none do they find performance to be
significantly correlated with the fraction of outside directors. Agrawal and Knoeber (1996)
conduct cross-sectional regressions with a sample of 383 large US firms for which they have
board data for 1987. In their regressions, Tobin’s Q is the dependent variable. Initially, they
report a significant negative correlation between the fraction of outside directors and Q.
However, in later work with the same sample and other control variables, the significance of the
relationship disappears (Anup Agrawal and Charles R. Knoeber (2001)). Bhagat and Black
(2002) analyze the relationship between board composition and four different measures of
corporate performance - - Q, ROA, Sales/Assets, and long-term stock returns. They conduct
their analysis with a sample of 828 US firms for which they have board data in 1991. They
report that firms that experience poor performance tend to appoint more outside directors, but
that the maneuver does not lead to an improvement in performance. They also find no
significant relationship between board composition and various measures of “long term”
performance.
The second category includes event studies of stock returns around announcements of

7
director appointments. Stuart Rosenstein and Jeffrey G. Wyatt (1990, 1997) report that
announcements of outside director appointments are associated with a significant excess return
of 0.20% and that announcements of inside directors appointments are associated with an
insignificant excess return. Both of their samples use US companies.
As we describe below, our analysis differs from those of earlier studies in that we focus
on the relationship between changes in the composition of corporate boards and changes in
corporate performance.
B. The Cadbury Committee
The Cadbury Committee was appointed by the Conservative Government of the UK in
May 1991 with a broad mandate to “…address the financial aspects of corporate governance”
(Report of the Committee on the Financial Aspects of Corporate Governance, 1992, Section 1.8).
The Committee, chaired by Sir Adrian Cadbury, CEO of the Cadbury confectionary empire,
issued its report, the cornerstone of which was The Code of Best Practice, in December 1992. A
key recommendation of the Code is that boards of publicly traded companies have at least three
non-executive (i.e., outside) directors.1 Although the Code has not been enacted into law, it does
have the implicit backing of the UK government. Additionally, the LSE requires that any listed
company that does not comply with the Code issue a statement to shareholders indicating that the
company is not in compliance and explaining why not.
As reported in DMT (2002), over the years 1989 through 1992, for a random sample of
460 LSE firms, the average size of the board of directors of an LSE-listed company was 5.7
members with a median of 5.0. Over the years 1993-1996, the mean board size was 7.3
1 Among other things, the Code also recommended that the positions of CEO and the Chairman of the Board be held by two different individuals. We briefly report the results of our analyses of the effect of splitting the positions of Chairman of the Board and CEO in section 7.

8
members with a median of 7.0. Over the same two periods, the proportion of outside directors
increased from an average of 35% to an average of 46%. Thus, over the years immediately
preceding issuance of the Cadbury Report, the average board had just under 2 outside directors.
In comparison, over the years immediately after the issuance of the Report, the average board
had about 3.3 outside directors. These statistics indicate that publication of the Code was
associated with a significant increase in the presence of outside directors on UK boards.
Arguably, publication of the Code of Best Practice in the UK touched off an explosion of
similar Codes elsewhere. A commonality of such codes is that they specify a minimum standard
for the representation of outside directors on boards of publicly traded companies. Sometimes
these minima are framed as a minimum number of outside directors (Sweden, Thailand,
Australia, India, Belgium, New Zealand, Denmark, Portugal, and Russia), sometimes they are
framed as a minimum fraction of outside directors (Mexico, Singapore, Greece, Brazil, Japan,
Switzerland, Czech Republic, Indonesia, Kenya, and Poland), and sometimes they specify both a
minimum number and a minimum fraction of outside directors (South Africa, Korea, France,
Malaysia, and Cyprus).
II. Sample and Data
The sample used in our analysis includes the universe of industrial companies (with data
on board composition and certain financial information) listed on the LSE over the period 1989
through 1996.2 In the aggregate, the sample includes 1,124 firms that enter the analysis with at
least one year of data.3
For our analysis, we split the sample into 3 mutually exclusive groups: (1) the set of firms
2 Thus, we exclude financial firms. 3 We identified 1,681 industrial companies listed on the LSE over the period 1989 through 1996. Of these, 344 were dropped due to insufficient accounting data to calculate ROA; 213 were dropped because neither the Stock Exchange Yearbook nor the Corporate Register identified whether board members were outsiders.

9
that had at least three outside directors every year in which they were listed on the LSE over the
period 1989 through 1996 (we call this the always-in-compliance set, 336 firms); (2) the set of
firms that never had more than two outside directors any year in which they were listed over the
period 1989 through 1996 (we call this the never-in-compliance set, 279 firms); and (3) the
remaining set of firms that comprises those that added a sufficient number of outside directors so
as to come into compliance with the Cadbury recommendation of at least three outside directors
any year during the interval 1989 through 1996 (we call this the adopted-Cadbury set, 509
firms). To determine into which set to classify a firm, we manually collected the number of
outside directors and the total number of directors each year for each firm from the Stock
Exchange Yearbook.
We employ accounting earnings and stock prices to measure corporate performance. We
use return on assets (ROA) as our measure of accounting earnings. For each firm in the sample,
for each year for which data are available, we calculate return on assets (ROA) as earnings
before depreciation, interest, and taxes divided by the beginning-of-the-year total assets. For
each firm in the sample, accounting data are taken from Datastream each year for which such
data are available from 1986 through 1999. Stock prices used in our event study are also taken
from Datastream. Each firm is identified according to its Financial Times Industry
Classification (FTIC). Because firms enter and exit the sample for various reasons, the number
of firms differs from year to year. Any year for which a firm has the requisite data, the firm is
included in our analysis.
Summary statistics on board size, outside directors, total assets, and market value of
equity along with the number of firms in the sample each year are presented in table 1 for the
three sets of firms. Panel A is the adopted-Cadbury set; Panel B is the always-in-compliance set;

10
Panel C is the never-in-compliance set. The average firm in the adopted-Cadbury set shows a
marked increase in board size from 6.8 members in 1989 to 8.2 members in 1996. The always-
in-compliance set is relatively constant in terms of board size with about 8.2 members (which is
the ending board size for the adopted-Cadbury set). The never-in-compliance set exhibits a mild
increase from 6.5 to 7.1 members. Thus, in terms of size, this set is close to the beginning point
for the adopted-Cadbury set.
By definition, of course, the adopted-Cadbury set will end up with a larger number of
outside directors than it began. It also exhibits an increase in the fraction of outside directors,
from 26.4% to 44.9%. As might be expected, this statistic shows its largest increase between
year-end 1992 and year-end 1993. This fraction also exhibits a relatively large increase from
year-end 1991 to year-end 1992 which may reflect anticipation of the Cadbury Report on the
part of some firms.4 In contrast, in terms of board composition the always-in-compliance set is
relatively stable - - it begins with an average of 42.1% outside directors and ends with 45.7%.
The never-in-compliance set shows an increase in the fraction of outside directors, but does not
rise to the level of the other two sets - - it begins with 16.7% and ends with 21.5%.
Finally, as shown in the table, in terms of market value of equity and book value of
assets, on average, firms in the adopted-Cadbury set are smaller than those in the always-in-
compliance set and larger than those in the never-in-compliance set. This suggests that we
should control for firm size in our subsequent analyses.
III. Analysis and Results
A. Operating Performance: An Overview
The statistic that we employ for presenting our results is the trimmed mean of the
4 An initial draft of the Code was issued for comments in May 1991. After various revisions, the final report was published in December 1992.

11
distribution of ROAs where the distribution is trimmed at the 1% and 99% level. Henceforth,
unless we state otherwise, we refer to this statistic as the mean of the distribution.
Figure 1 provides an overview of the operating performance of the three sets of firms
over the period 1989 through 1996. The graph gives the time series mean ROA for each set of
firms. First, as the graph shows, in each year, the average ROA of the always-in-compliance set
(the dotted line) lies above the average ROA of the never-in-compliance set (the dashed line).
The difference between the two ranges from 0.6% (in 1989) to 2.6% (in 1992). This suggests
that firms with three or more outside directors tend to outperform firms with fewer than three
outside directors. Second, and more interestingly, the average ROA of the adopted-Cadbury set
(the solid line) starts out in 1989 at the same level as the never-in-compliance set and
progressively moves toward the mean of the always-in-compliance set. By 1996, the average
ROA of the adopted-Cadbury set lies slightly above the mean ROA of the always-in-compliance
set.
Recall that the adopted-Cadbury set is composed of firms that came into compliance with
the Cadbury recommendation at various points in time. As of the beginning of 1989, none were
in compliance; as of the end of 1996, all were in compliance. One way to interpret these results
is that the ROA of the never-in-compliance set represents the ROA that the adopted-Cadbury
firms would have achieved had they not adopted the Cadbury recommendation, while the
always-in-compliance ROA represents the ROA that the adopted-Cadbury set would have had
each year had they always been in compliance. Taken at face value, figure 1 indicates that
adoption of the Cadbury recommendation is associated with an increase in operating profitability
in absolute terms and relative to other firms. That is, the never-in-compliance set was composed
of poor performers relative to those in the always-in-compliance set. Those firms that adopted

12
the Cadbury-recommendation started out as poor performers and then improved their
performance to be on par with the always-in-compliance firms. In the remainder of this section,
we examine this issue from various perspectives with a variety of tests. Each of these tests
supports the face value interpretation of figure 1 - - adoption of the Cadbury recommendation is
associated with an improvement in corporate operating performance.
(One further observation about figure 1 previews some of the tests we conduct later.
Note that in 1991-1992, all three sets of firms experienced a sharp decline in ROA and in 1993-
1994, all firms exhibited a sharp increase in ROA. This time period happens to coincide with
publication of the Cadbury Report and with an increase in outside directors as shown in table 1.
We investigate whether the coincidental occurrence of these two events might explain our
results.)
B. Changes in ROA From Before to After Adoption of the Cadbury Recommendation in Comparison with Industry-Matched Benchmarks
Having examined the time series level of operating performance, we now examine
changes in operating performance from before to after adoption of the Cadbury recommendation
for the adopted-Cadbury firms in comparison with various benchmarks. In these analyses, we
refer to the year in which a firm adopted the recommendation as event year y, year y+1 is event
year y+1 and so forth. (Year y is the calendar year in which a firm that previously had less than
three outside directors increases the number of outside directors to three or more.)
We present certain of the results in graphical form in figures 2 and 3. Univariate tests of
statistical significance are reported in the accompanying tables 2 and 3. Further univariate tests
are presented in tables 4 and 5.
The solid line in figure 2 depicts the mean ROA of the adopted-Cadbury set over the
seven-year interval surrounding the year in which the firms adopted the recommendation. This

13
is event period y–3 through y+3. This set contains 500 firms in year y. The number of firms in
the sample decreases as we move away from y in either direction. Thus, the number of firms in
year y-1, y-2, and y-3 is 490, 418, and 355, respectively; the number of firms in year y+1, y+2,
and y+3 is 491, 424, and 343. (Because the sample sizes decline by about one-third by year y+3,
results based on year y+3 may be less reliable than those based on shorter time intervals.)
As the figure demonstrates, the mean ROA of the adopting firms increased sharply
following adoption of the Cadbury recommendation. As shown in table 2 (panel B), the increase
is statistically significant regardless of the interval considered. For example, from year y-1
through y+2, the average ROA increased by 2.50%, from 7.04% to 9.54% (p-value < 0.01). This
jump is consistent with adoption of the Cadbury recommendation leading to an increase in
operating performance. But, it is also possible that part, or all, of the increase in ROA was due
to macroeconomic factors having nothing to do with a change in the number of outside directors.
As we noted above, each set of firms evidenced an increase in ROA from 1992 through 1994
and, as we also noted above, a significant fraction of firms adopted the Cadbury recommendation
in 1992 and 1993. It could be that the increase in ROA from y-1 through y+2 merely reflects the
economy-wide uptick in corporate profitability that occurred between 1992 and 1994 along with
the purely coincidental publication of the Cadbury recommendation.
To control for macroeconomic factors that affected ROAs generally, for each adopted-
Cadbury firm, we identify all firms in the always-in-compliance set and all firms in the never-in-
compliance set with the same FTIC as the adopted-Cadbury firms and which had an available
ROA during any year over the adopting firm’s y-3 through y+3 interval. We then calculate the
adopting firm’s industry-matched (i.e., FTIC-matched) mean ROA for the always-in-compliance
set and for the never-in-compliance set for each year over the interval y-3 through y+3. These
14
industry-matched mean ROAs are also presented in figure 2.
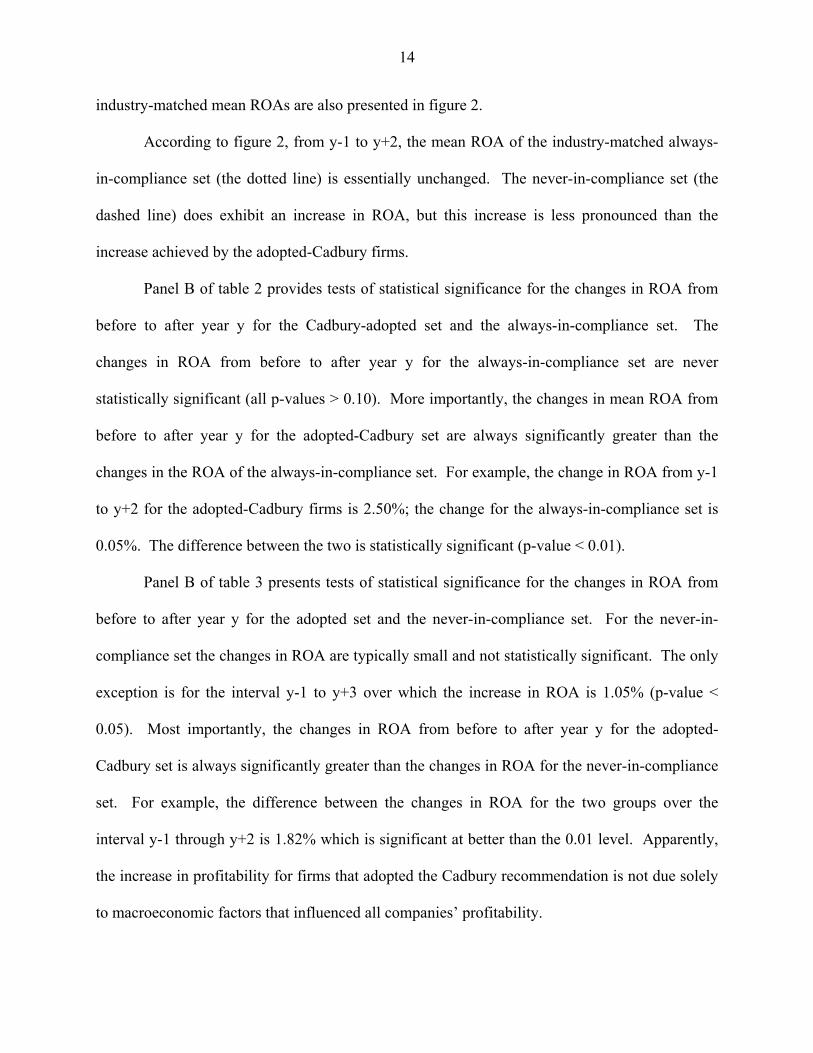
According to figure 2, from y-1 to y+2, the mean ROA of the industry-matched always-
in-compliance set (the dotted line) is essentially unchanged. The never-in-compliance set (the
dashed line) does exhibit an increase in ROA, but this increase is less pronounced than the
increase achieved by the adopted-Cadbury firms.
Panel B of table 2 provides tests of statistical significance for the changes in ROA from
before to after year y for the Cadbury-adopted set and the always-in-compliance set. The
changes in ROA from before to after year y for the always-in-compliance set are never
statistically significant (all p-values > 0.10). More importantly, the changes in mean ROA from
before to after year y for the adopted-Cadbury set are always significantly greater than the
changes in the ROA of the always-in-compliance set. For example, the change in ROA from y-1
to y+2 for the adopted-Cadbury firms is 2.50%; the change for the always-in-compliance set is
0.05%. The difference between the two is statistically significant (p-value < 0.01).
Panel B of table 3 presents tests of statistical significance for the changes in ROA from
before to after year y for the adopted set and the never-in-compliance set. For the never-in-
compliance set the changes in ROA are typically small and not statistically significant. The only
exception is for the interval y-1 to y+3 over which the increase in ROA is 1.05% (p-value <
0.05). Most importantly, the changes in ROA from before to after year y for the adopted-
Cadbury set is always significantly greater than the changes in ROA for the never-in-compliance
set. For example, the difference between the changes in ROA for the two groups over the
interval y-1 through y+2 is 1.82% which is significant at better than the 0.01 level. Apparently,
the increase in profitability for firms that adopted the Cadbury recommendation is not due solely
to macroeconomic factors that influenced all companies’ profitability.

15
C. Changes in ROA From Before to After Adoption of the Cadbury Recommendation in Comparison with Industry- and Performance-Matched Benchmarks
Figure 2 also shows that the companies that came into compliance with the Cadbury
recommendation experienced a significant decline in ROA over the two years prior to adoption.5
As Barber and Lyon (1996) emphasize, if earnings are mean reverting, and if the companies
being analyzed have experienced especially poor or especially good performance prior to the
event being examined, comparison with a simple industry benchmark can be misleading. To
account for mean reversion in earnings, they propose that companies be matched on the basis of
industry classification and prior performance. Thus, we generate a set of always-in-compliance
firms and a set of never-in-compliance firms that match the adopting firm on the basis of
industry (i.e., FTIC) and ROA in year y-1. Specifically, for each adopting company, we identify
all firms in the always-in-compliance set with the same FTIC as of year y-1. From among these
firms, we choose the one whose ROA during year y-1 is closest to the ROA of the adopting firm
so long as the matching company’s ROA lies within 75% and 125% of the adopting firm’s ROA.
As we noted above, the number of firms in the adopted-Cadbury set declines as we move away
from year y. This phenomenon also occurs in the always-in-compliance matching firms which
further reduces the sample size as we move away from year y. In years y+1, y+2, and y+3, the
sample sizes (and their matching firm sample sizes) are 484, 409, and 304 respectively. We then
replicate the industry and performance matching procedure for the set of never-in-compliance
firms. In years y+1, y+2, and y+3, the sample sizes are 481, 396, and 297, respectively.
Because the number of always-in-compliance firms and the number of never-in-compliance
firms is less than the number of adopted-Cadbury firms, some of the matching firms enter the
5 The phenomenon of firms increasing their number of outside directors following a decline in performance has been documented for US firms by David J. Denis and Atulya Sarin (1999) and Hermalin and Weisbach (1991). As documented by Bhagat and Black (2002), however, this practice does not lead to an improvement in performance.

16
analysis more than once, albeit typically in a different calendar year.
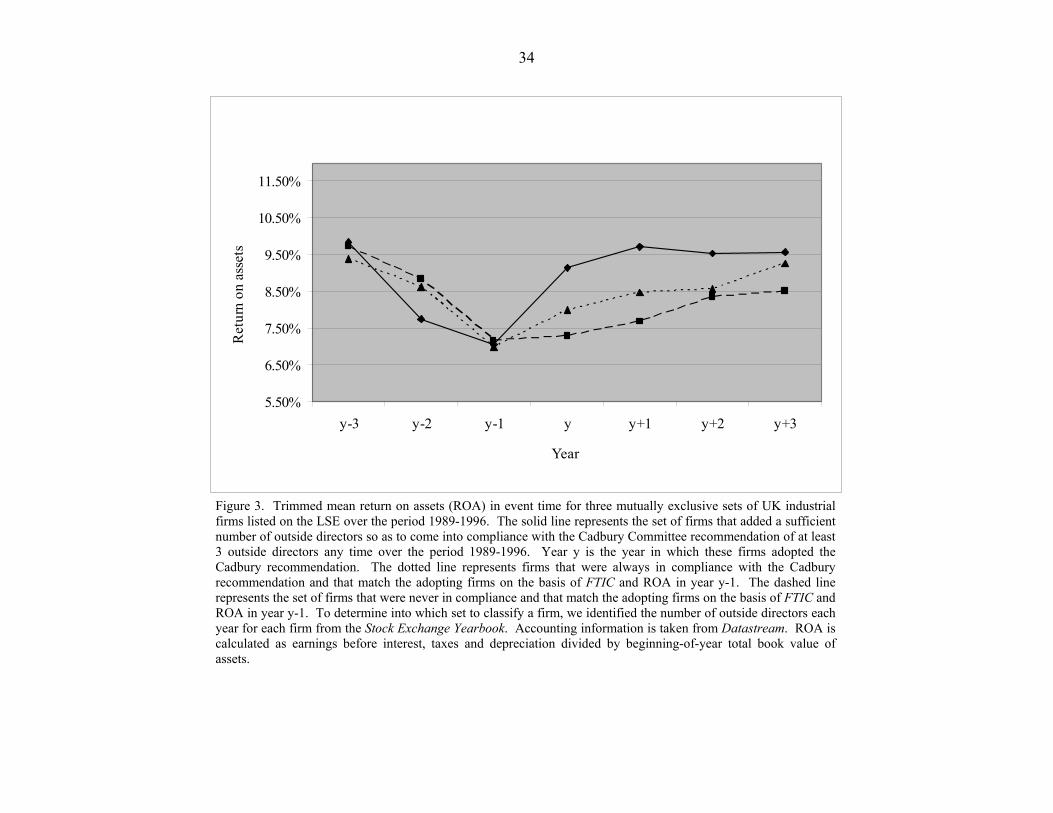
The mean ROAs of the adopted-Cadbury firms along with the mean ROAs of their
industry- and performance-matched firms are displayed in figure 3. By construction, the mean
ROAs of the three sets of firms are nearly identical in year y-1. According to the figure, each set
of firms experienced a significant decline in mean ROA from year y-3 through year y-1. And
each set exhibited a marked improvement in average ROA from year y-1 through year y+1 and
from year y-1 through year y+2. However, the improvement in ROA for the adopted-Cadbury
set exceeds that of the improvement in either the industry- and performance-matched always-in-
compliance set or the industry- and performance-matched never-in-compliance set. Thus, even
against these benchmarks, the adopted-Cadbury firms exhibit a greater increase in operating
performance from before to after year y. Statistical tests are presented in tables 2 and 3.
As shown in panel B of table 2, in comparison with the always-in-compliance set, over
the intervals y-1 through y+1 and y-1 through y+2, the performance improvement for the
adopted-Cadbury firms is statistically significantly greater than zero. For example, from y-1 to
y+2, the difference is 0.92% with a p-value < 0.05. However, over the interval y-1 to y+3, the
difference of 0.26% is positive, but not significantly greater than zero. Thus, the performance
improvement for the adopted-Cadbury set exceeds that of its industry- and performance-matched
always-in-compliance benchmark, but by year y+3, the benchmark firms close the gap.
As shown in panel B of table 3, however, over every interval, the improvement in ROA
for the adopted-Cadbury set is statistically significantly greater than the improvement in ROA
for the industry- and performance-matched never-in-compliance set. For example, from y-1 to
y+2, the difference is 1.30% (p-value < 0.05). Thus, although firms that adopted the Cadbury
recommendation experienced a decline in operating performance prior to adoption, the

17
subsequent improvement is not due solely to mean reversion. Adoption of the Cadbury
recommendation appears to be associated with an absolute and relative improvement in operating
performance, especially in comparison with firms that never conformed with the
recommendation during the period of our analysis.
D. Changes in ROA From Before to After Adoption of the Cadbury Recommendation in Comparison with Industry-Matched Good, Moderate, and Poor Performers
As one further way to determine whether the improvement in performance is due merely
to mean reversion in poorly performing firms, we split the adopted-Cadbury set into three
subsets - - a set of “poor performers,” a set of “moderate performers,” and a set of “good
performers” - - as of year y-1. Specifically, we sort the adopted-Cadbury firms from highest to
lowest ROA in year y-1. The one-third of the firms with the lowest ROA is put into the poor
performers subset. The one-third of the firms with the highest ROA is put into the good
performers subset. The middle one-third of the firms is put into the moderate performers subset.
For each subset of adopted-Cadbury firms and their industry- and performance-matching
always-in-compliance firms (as identified above), we calculate the mean ROAs and mean
changes in ROA over the intervals y-1 through y+1, y-1 through y+2, and y-1 through y+3. The
results are presented in table 4. Table 5 presents a parallel set of results for the never-in-
compliance firms.
The results present an interesting pattern. First, the poor performers exhibit the greatest
improvement in ROA. For example, as shown in panel B of table 4, for the adopted-Cadbury
firms, on average, from y-1 to y+2, the increase in ROA is 11.27%, from -7.25% to 4.02%.
Moderate performers show a mild improvement in ROA. For them, the change in ROA from y-1
to y+2 is 0.57%. But, the good performers actually show a decline in ROA of -1.26%. In
combination, these results are very consistent with mean reversion in earnings. The question

18
then becomes whether the change in performance for the adopted-Cadbury firms is different
from that of their performance-matched peers. In fact, it is.
As shown in panel B of table 4, columns E-G, the ROA of the always-in-compliance
firms mimics that of the adopted-Cadbury firms. However, for the poor performers and the
moderate performers, the increase in ROA from before to after year y is greater (typically
significantly greater) for the adopted-Cadbury firms than for the always-in-compliance firms.
Most intriguingly is the good performer set. For these firms, both the adopted-Cadbury set and
the always-in-compliance set show a decline in ROA. However, the decline in ROA for the
always-in-compliance set is greater than the decline in ROA for the adopted-Cadbury set, albeit
it is statistically significant only for the interval y-1 to y+3. Thus, mean reversion does play a
role in the change in ROA from before to after adoption of the Cadbury recommendation, but
companies that adopted the Cadbury recommendation have changes in performance that override
the effects of mean reversion.
The pattern observed in comparing the adopted-Cadbury set with the always-in-
compliance set is even more pronounced when the adopted-Cadbury set is compared with the
never-in-compliance set. This comparison is given in table 5.
As with the adopted-Cadbury firms and the always-in-compliance, the poor performers in
the never-in-compliance set show a significant improvement from before to after year y.
However, the change in ROA for the adopted-Cadbury firms significantly outstrips the
improvement of the never-in-compliance firms. For example, the change in ROA over the
interval y-1 to y+2 for the adopted-Cadbury poor performers exceeds the change in ROA of the
never-in-compliance poor performers by 2.85% (p-value < 0.01). Interestingly, for the never-in-
compliance set, the moderate performers and the good performers both exhibit declines in ROA

19
from before to after year y, and the decreases are statistically significant for the good performers.
For example, from y-1 to y+2, the good performers among the never-in-compliance set show a
change in mean ROA of -3.49% (p-value <0.01). As shown in columns H-J of table 5, when the
three subsets of adopted-Cadbury firms are compared with the three subsets of the never-in-
compliance firms, the mean changes in ROA for the adopted-Cadbury firms from before to after
December 1992 are always significantly greater than the mean changes for the never-in-
compliance firms with all having p-values less than 0.05 and 7 of the 9 having p-values less than
0.01. Furthermore, the differences across the three sets are reasonably consistent at
approximately 1.5% to 3.0%.
The message that comes through this analysis is that the starting point does have an effect
on the change in ROA - - in particular, all firms exhibit mean reversion. However, regardless of
the starting point, firms that move to at least three outside directors outperform their
performance-matched benchmarks. Compliance with the Cadbury recommendation appears to
lead to an improvement in performance regardless of what the firm’s performance was when it
adopted the recommendation.
E. Changes in ROA From Before to After Adoption of the Cadbury Recommendation Pre- and Post-December 1992
A further question that may arise is whether it is publication of the Cadbury Report per se
or whether it is moving to three outside directors that is associated with an improvement in ROA.
In our analyses, we have not distinguished between firms that moved to three outside directors
pre- and post-December 1992. In fact, 103 firms in the adopted-Cadbury set moved to three
outside directors between January 1989 and December 1992. We, thus, split the sample into
those that came into compliance before and after December 1992 and redo our analysis of ROA
using the industry- and performance-matched firms as benchmarks for each subsample. The

20
results are given in table 4 columns K-P when the benchmark comprises the always-in-
compliance firms and in table 5 columns K-P when the benchmark is the never-in-compliance
firms.
The results are nearly identical regardless of whether the firms move to three outside
directors before or after December 1992. These results indicate that, regardless of when the
firms moved to have three or more outside directors, that decision was associated with an
improvement in operating performance both absolutely and relative to industry- and
performance-matching benchmarks. One interpretation of this result is that the Cadbury
recommendation was not exogenous. That is, even before Cadbury, on average, firms that
altered their boards to have three outside directors exhibited better performance. As a result,
other firms might well have followed that lead anyway. As a consequence, the Cadbury Report
merely codified an outcome that would have occurred anyway. Of course, regardless of the
interpretation, the conclusion is the same: Companies that altered their boards to have at least
three outside directors experienced an improvement in operating performance.
F. Multivariate Tests of Statistical Significance
By construction, the univariate tests control for industry factors that might affect ROA
and for mean reversion in ROA. An additional factor that has sometimes been shown to
influence ROA is size of the company. To control for the influence that size may have on ROA
and changes in ROA, we estimate regressions using the change in ROA across event time
intervals as the dependent variable. In the first set of regressions, we include the adopted-
Cadbury firms and their matched always-in-compliance firms. The independent variables are an
indicator for adopted-Cadbury firms (1) or always-in-compliance firms (0), the log of book
assets, and an indicator for pre (0)- and post (1)- December 1992 adoption. The regression is

21
estimated separately for the intervals y-1 through y+1, y-1 through y+2, and y-1 through y+3.
And the regressions are estimated separately with the always-in-compliance industry-matched
firms and with the always-in-compliance industry- and performance-matched firms. There are,
thus, six regressions, the results of which are presented in panel A of table 6. The pre-/post-
December 1992 indicator variable is never significant and the size variable is significant in about
half the regressions. We are most interested in the adopted-Cadbury indicator. This variable is
significant at the 0.01 level in five of the six regressions. In the sixth regression, the coefficient
is significant at the 0.10 level. Thus, in comparison with firms that had at least three outside
directors prior to 1989 (the always-in-compliance set) and after controlling for firm size,
industry, prior performance, and pre-/post- 1992, the improvement in operating earnings for
companies that altered their boards by increasing the number of outside directors to three or
more is significantly greater than zero.
The set-up of panel B mimics panel A except that the regressions reported in panel B
include the adopted-Cadbury firms and the never-in-compliance firms. Log assets is typically
not significant and pre-/post- 1992 adoption is never significant. Importantly, however, the
coefficient of the adopted-Cadbury indicator variable is significant at the 0.01 or better in five of
the six regressions and in the sixth, it is significant at the 0.05 level.
The multivariate analysis is consistent with the univariate analysis, after controlling for
industry, pre-adoption performance, asset size, and whether the movement to three outside
directors occurred before or after December 1992, adoption of the Cadbury recommendation
foreshadowed a significant improvement in corporate earnings.

22
IV. Event Study Around Announcements of Director Appointments
A. Sample and Methodology
Our analyses of changes in board composition and operating performance indicate that
addition of outside directors to corporate boards coincided with an improvement in operating
performance, as measured by ROA. In this section, we perform an event study to analyze stock
returns around announcements of appointments of inside and outside directors to determine
whether the addition of outside directors showed up as an increase in stock price. We should
note that in this analysis, because of the Cadbury Report, much of the stock price effect of
moving to three outside directors may already have been incorporated into stock prices prior to
the announcements. Thus, whatever stock price effect we find may be attenuated.
To conduct our event study, we use the market model procedure with market model
parameters estimated using daily stock returns over the interval of 153 trading days prior to the
announcement day through 3 days prior to the announcement day. We examine excess stock
returns over the 2-day interval that encompasses the day on which the company issued its press
release announcing a director appointment and the following day.
To construct our sample of director appointments, we identified all new directors each
year over the period 1989 through 1996 from the annual board rosters of the 1,124 companies in
our sample. Many appointments have no effect on board composition. For example, suppose
that in 1994, a board consisted of four members, three of which were insiders and one of which
was an outsider. And, suppose in 1995, the board still consisted of four members, of which three
were the same insiders as 1994 and the fourth was a different outsider. In this case, we observe
the appointment of a new outside director, but the appointment has no impact on either the
number or fraction of outside directors. Because we are interested in the composition of the
23
board, appointments that do not alter the split between insiders and outsiders are dropped from
the sample. With this construction, the total number of new directors was 1,988. Of these, 985
were inside director appointments and 1,003 were outside director appointments. The
announcement date for each director appointment was manually collected from the Extel Weekly
News Summary. If the company announced the appointment of both an inside and outside
director appointment on the same date, this observation is further excluded from the event study.
If the company announced the appointment of multiple outside or multiple inside directors on the
same date, this observation remains in the sample. If more than one inside or outside director is
announced on the same day, that observation is included only once. This process leaves 952
outside director and 940 inside director appointments.
B. Stock Prices and Appointments of Outside Directors
We are interested in appointments that increase the number of outside directors to three
or more in comparison with other types of appointments. Thus, we separate our sample of
director appointments into three groups: (1) appointments that increase the number of outside
directors to two or less (326 observations); (2) appointments that increase the number of outside
directors to three or more (626 observations); and (3) inside director appointments (940
observations).
As shown in panel A of table 7, the average two-day announcement period excess return
for each group is positive and statistically significantly greater than zero. The average two-day
announcement period excess return for appointments that increase the number of outside
directors to two or less is 0.25% (p-value = 0.03); the average two-day announcement period
excess return for appointments that increase the number of outside directors to three or more is
0.44% (p-value < 0.01); and the average announcement period excess return for appointments

24
that increase the number of inside directors is 0.17% (p-value = 0.06). Further, the average
excess return for appointments that increase the number of outside directors to three or more is
significantly greater than the average excess return for either of the other two subsets (with p-
values of 0.01 and 0.05, respectively). However, the average excess return surrounding
announcements that add outside directors, but bring the total number of outside directors to less
than three (i.e., 0.25%), is not significantly different from the average excess return surrounding
announcements that add inside directors (0.17%). Thus investors appear to view all
appointments of directors as good news. However, they appear to view appointments that
increase the number of outside directors to three or more as the best news. These results are
consistent with our analysis of ROA.
C. Director Appointments Pre- and Post-December 1992
We also split the group of outside director appointments that increased the number of
outsiders to three or more into those that occurred pre-December 1992 and those that occurred
post-December 1992. The average two-day announcement period excess return for the 139 pre-
1992 outside director appointments and for the 487 post-1992 outside director appointments
were 0.47% and 0.41%, respectively. With p-values < 0.01, both are statistically significantly
different from zero, but not significantly different from each other. Thus, the positive stock
return associated with outside director appointments that increase the number of outsiders on the
board to three or more is not confined to those that came about as a result of the Cadbury Report
- - outside director appointments that increase the number of outside directors on the board
appear to be good news for shareholders both before and after Cadbury. Again, this result is
consistent with our analysis of operating earnings.

25
D. Stock Prices and the Fraction of Inside and Outside Director Appointments
We consider one further question. Our analysis indicates that appointing more outside
directors is better than appointing fewer. It may also be that appointing more inside directors is
better than appointing fewer. That is, the significant effect of appointing outside directors such
that the total is three or more, may be due to adding more directors and we might find a similar
effect in cases where more inside directors are appointed. To address that question, albeit
somewhat obliquely, we separate the sample of 940 inside director appointments into three
groups: (1) appointments that increase the fraction of inside directors by 0.20 or less (611
observations); (2) appointments that increase the fraction of inside directors by 0.21 to 0.39 (250
observations); and (3) appointments that increase the fraction of inside directors by 0.40 or more
(79 observations). We undertake the analysis by stratifying the sample according to the
proportional increase in inside directors rather than in terms of whether the number of inside
directors increased to three or more because most boards already had three or more inside
directors as of the date they entered our sample.
As shown in panel B of table 7, the average two-day announcement period excess returns
for the three groups are 0.20% (p-value = 0.06); 0.13% (p-value = 0.17); and -0.03% (p-value =
0.65), respectively. Thus, the greater the proportional increase in inside directors, the lower the
announcement period return. The addition of more inside directors is associated with a smaller
(or negative) change in value for shareholders.
For a direct comparison, we also stratify outside director appointments according to the
percentage increase in outside directors. Also as shown in panel B of table 7, the average two-
day announcement period excess return for appointments that increase the fraction of outside
directors by 0.20 or less is 0.16% (p-value = 0.08); for appointments that increase the fraction of
26
outside directors by 0.21 to 0.39, the average announcement period excess return is 0.40% (p-
value < 0.01); and for appointments that increase the fraction of outside directors by 0.40 or
more it is 0.59% (p-value < 0.01). Thus, what we observed above was that the average
announcement period excess return for inside director appointments declined monotonically as
the percentage increase in outside directors increased. For outside director appointments, the
results are exactly reversed - - a greater increase in the percentage of outside directors is
associated with a higher excess return. These results compliment the results from our analysis of
operating earnings. Apparently investors expect that more outside directors will lead to an
improvement in corporate performance and our analysis of operating performance indicates that,
on average, those expectations are realized.
V. Sensitivity Analysis
In this section we discuss certain sensitivity analyses.
A. Tests of Operating Performance
To determine the robustness of our results wherein we examine ROA, we trimmed the
distribution at the 0.5% and 99.5% and the 2.0% and 98% levels. The significance of none of the
results is changed. We also conducted the analysis with no trimming. With no trimming, in
some cases the mean change in ROA for the adopting firms was not significantly different from
the benchmark. That seems to be due to six benchmark firms with extraordinary changes in
ROA over some intervals. With the various trimmed distributions, we conducted both univariate
and multivariate tests. We also conducted the univariate tests with median changes in ROA.
The results were mildly more significant with median than mean changes in ROA.
In section 5, we noted that some of the industry- and performance-matching firms enter
the analysis more than once, albeit usually in different years. We reran all of the tests making

27
sure that each matching firm entered the analysis only once. The significance of the results is
unchanged. Thus, our results appear to be robust.
B. Event Study of Stock Prices
To determine whether the results of our stock price event study are robust, we employed
announcement periods of various lengths. We also estimated the market model parameters over
various pre-event intervals. The event study results are robust to the length of the announcement
period considered and to the interval used to estimate market model parameters.
C. Separating the Positions of Chairman of the Board and CEO
As we noted in footnote 1, a second major component of the Cadbury Report is a
recommendation that the positions of Chairman of the Board and Chief Executive Officer (CEO)
not be held by the same individual. This recommendation has shown up in the US in the
Sarbannes-Oxley Act and has garnered much publicity. As in the UK, the proposal has been
advanced with a sense of “feel-good” urgency with little or no evidence to indicate that its
adoption would actually do good. We conducted all of our multivariate tests including an
additional indicator variable to identify firms that adopted this provision of the Cadbury Report.
In none of these tests is the coefficient of this indicator variable significant, but the “three outside
directors” variable continues to be significant. Based upon our evidence, hopes that this feel-
good provision will lead to corporate governance nirvana in the US are probably misplaced.
IV. Commentary and Conclusion
Over the past decade, the global economy appears to have been captured by what might
be best characterized as “outside director mania”. A presumption that underlies this movement
is that boards with more outside directors will lead to better board decisions and, as a result,
better corporate performance. Dahya, McConnell and Travlos (2002) examine the relationship
28
between corporate performance and CEO turnover before and after firms adopted the key
recommendations of the Cadbury Report, in the UK they find that CEO turnover is significantly
more sensitive to performance after firms came into compliance with the report by moving to
three outside directors. They go on to note that this result is consistent with the
recommendations having improved corporate governance, but they remain skeptical as to
whether that would inevitably lead to improved corporate performance: “[I]ncreased
management turnover and increased sensitivity of turnover to performance do not necessarily
mean an improvement in performance” (p. 482). In this study, we examine changes in
performance directly. We find that UK firms that moved to three outside directors in
conformance with the Cadbury Committee recommendation show an improvement in operating
performance both absolutely and relative to various peer-group benchmarks from before to after
moving to have three outside directors. We also find that firms that move to three outside
directors have a statistically significant stock price increase at the time of announcement of this
decision. The results strongly suggest that adding outside directors, at least up to three, lead to
improved performance by UK firms and increased value for shareholders.
A concern that might be raised about our analysis is one of reverse causality - - that is,
management of companies that were anticipating an improvement in performance added outside
directors; whereas management of companies that were anticipating a worsening of performance
stayed with the status quo. Certainly that story would also be consistent with our results, but the
motives of management are difficult to discern. It would seem more natural for managers of
poorly performing firms to add outside directors as a way of showing that they are doing
something to improve performance or as a shield if matters do not improve.
A second concern has to do with endogeneity - - perhaps it is a third unobservable factor

29
that causes firms to have improved performance and to add outside directors concurrently. Of
course, we do not know what the third factor might be which is not the same as saying there isn’t
one (Hermalin and Weisbach (1988, 1998)). However, as we noted, several studies with US data
find that firms tend to add outside directors after a period of poor performance, but the addition
of outside directors does not lead to an improvement.
Our results do show that UK firms that moved to three outside directors so as to conform
with the Cadbury recommendation experienced a significant improvement in performance.
Even, then, however, most UK firms had less than a majority of outside directors; on average,
outside directors comprised 44% of UK firms. Thus, one question that our study raises is
whether there is an optimal number or fraction of outside directors that may be less than 50%. A
second question is whether the results from UK firms can be generalized to other countries that
have adopted similar Codes of Best Practice. We do not answer those questions here, but expect
that future studies by others will address them.

30
References
Agrawal, Anup and Knoeber, Charles R., Firm performance and mechanisms to control agency problems between managers and shareholders, Journal of Financial and Quantitative Analysis, September 1996, 31(3), 377 – 397. Agrawal, Anup and Knoeber, Charles R., Do some outside directors play a political role?, Journal of Law and Economics, April 2001, 44(1), 179 – 198. Barber, Brad M. and Lyon, John D., Detecting abnormal operating performance: the empirical power and specification of test-statistics, Journal of Financial Economics, July 1996, 41(3), 359 – 399. Bhagat, Sanjai and Black, Bernard, The uncertain relationship between board composition and firm performance, Business Lawyer, May 1999, 54(3), 921 – 961. Bhagat, Sanjai and Black, Bernard, The non-correlation between board independence and long-term firm performance, Journal of Corporation Law, Winter 2002, 27(2), 232 – 273. Brickley, James A., Coles, Jeffrey L., and Terry Rory L., Outside directors and the adoption of poison pills, Journal of Financial Economics, June 1994, 35(3), 371 – 390. Brickley, James A. and James, Christopher M., The takeover market, corporate board composition, and ownership structure: the case of banking, Journal of Law and Economics, April 1987, 30(1), 161 – 180. Byrd, John W. and Hickman, Kent A., Do outside directors monitor managers?: Evidence for tender offer bids, Journal of Financial Economics, October 1992, 32(2), 195 – 221. Core, John. E., Holthausen, Robert. W., and Larcker, David. F., Corporate governance, chief executive officer compensation and firm performance, Journal of Financial Economics, March 1999, 51(3), 373 – 406. Cotter, James F., Shivdasani, Anil, and Zenner, Marc, Do independent directors enhance target shareholder wealth during tender offers?, Journal of Financial Economics, February 1997, 43(2), 195 – 218. Dahya, Jay, McConnell, John J., and Travlos, Nickolaos G., The Cadbury committee, corporate performance, and top management turnover, Journal of Finance, February 2002, 57(1), 461 – 483. Demsetz, Harold and Lehn, Kenneth, The structure of corporate ownership: causes and consequences, Journal of Political Economy, December 1985, 93(6), 1155 – 1177.

31
Denis, David J. and Sarin, Atulya, Ownership and board structures in publicly traded firms, Journal of Financial Economics, May 1999, 52(2), 187 – 223. Hermalin, Benjamin E. and Weisbach, Michael S., The determinants of board composition, The RAND Journal of Economics, Winter 1988, 19(4), 589 – 606. Hermalin, Benjamin E. and Weisbach, Michael S., The effects of board composition and direct incentives on firm performance, Financial Management, Winter 1991, 20(4), 101 – 112. Hermalin, Benjamin E. and Weisbach, Michael S., Endogenously chosen boards of directors and their monitoring of the CEO, The American Economic Review, March 1998, 88(1), 96 – 118. Hermalin, Benjamin E. and Weisbach, Michael S., Boards of directors as an endogenously determined institution; A survey of the economic literature, Economic Policy Review, 2003, forthcoming. Kini, Omesh, Kracaw, William A., and Mian, Shehzad, Corporate takeovers, firm performance, and board composition, Journal of Corporate Finance, April 1995, 1(3-4), 383 – 412. Klein, April, Audit committee, board of director characteristics and earnings management, Journal of Accounting and Economics, August 2002, 33(3), 375 – 400. Mehran, Hamid, Executive compensation structure, ownership and firm performance, Journal of Financial Economics, June 1995, 38(2), 163 – 184. Rosenstein, Stuart and Wyatt, Jeffrey G., Outside directors, board independence, and shareholder wealth, Journal of Financial Economics, August, 1990, 26(2), 175 – 191. Rosenstein, Stuart and Wyatt, Jeffrey G., Inside directors, board effectiveness, and shareholder wealth, Journal of Financial Economics, May 1997, 44(2), 229 – 250. Shivdasani, Anil, Board composition, ownership structure, and hostile takeovers, Journal of Accounting and Economics, January/April/July 1993, 16(1/2/3), 167 – 198. Weisbach, Michael S., Outside directors and CEO turnover, Journal of Financial Economics, January/March 1988, 20(1/2), 431 – 460.

32
5.50%
6.50%
7.50%
8.50%
9.50%
10.50%
11.50%
1989 1990 1991 1992 1993 1994 1995 1996
Year
Ret
urn
on a
sset
s
Figure 1. Trimmed mean return on assets (ROA) through time for three mutually exclusive sets of UK industrial firms listed on the LSE over the period 1989-1996: (1) the dotted line is the set of firms that had at least 3 outside directors every year in which they were listed (the always-in-compliance firms), (2) the dashed line is the set of firms that never had more than 2 outside directors any year in which they were listed (the never-in-compliance firms), and (3) the solid line is the remaining set of firms which comprise those that added a sufficient number of outside directors so as to come into compliance with the Cadbury Committee recommendation of at least 3 outside directors any year during 1989 through 1996 (the adopted-Cadbury firms). To determine into which set to classify a firm, we identified the number of outside directors each year for each firm from the Stock Exchange Yearbook. Accounting information is taken from Datastream. ROA is calculated as earnings before interest, taxes and depreciation divided by beginning-of-year total book value of assets.

33
5.50%
6.50%
7.50%
8.50%
9.50%
10.50%
11.50%
y-3 y-2 y-1 y y+1 y+2 y+3
Year
Ret
urn
on a
sset
s
Figure 2. Trimmed mean return on assets (ROA) in event time for three mutually exclusive sets of UK industrial firms listed on the LSE over the period 1989-1996. The solid line represents the set of firms that added a sufficient number of outside directors so as to come into compliance with the Cadbury Committee recommendation of at least 3 outside directors any time over the period 1989-1996. Year y is the year in which these firms adopted the Cadbury recommendation. The dotted line represents firms that were always in compliance with the Cadbury recommendation and that match the adopting firms on the basis of FTIC. The dashed line represents the set of firms that were never in compliance and that match the adopting firms on the basis of FTIC. To determine into which set to classify a firm, we identified the number of outside directors each year for each firm from the Stock Exchange Yearbook. Accounting information is taken from Datastream. ROA is calculated as earnings before interest, taxes and depreciation divided by beginning-of-year total book value of assets.
34
5.50%
6.50%
7.50%
8.50%
9.50%
10.50%
11.50%
y-3 y-2 y-1 y y+1 y+2 y+3
Year
Ret
urn
on a
sset
s
Figure 3. Trimmed mean return on assets (ROA) in event time for three mutually exclusive sets of UK industrial firms listed on the LSE over the period 1989-1996. The solid line represents the set of firms that added a sufficient number of outside directors so as to come into compliance with the Cadbury Committee recommendation of at least 3 outside directors any time over the period 1989-1996. Year y is the year in which these firms adopted the Cadbury recommendation. The dotted line represents firms that were always in compliance with the Cadbury recommendation and that match the adopting firms on the basis of FTIC and ROA in year y-1. The dashed line represents the set of firms that were never in compliance and that match the adopting firms on the basis of FTIC and ROA in year y-1. To determine into which set to classify a firm, we identified the number of outside directors each year for each firm from the Stock Exchange Yearbook. Accounting information is taken from Datastream. ROA is calculated as earnings before interest, taxes and depreciation divided by beginning-of-year total book value of assets.

35
Table 1 Financial and board characteristics for UK industrial firms listed on the London Stock Exchange over the period 1989 through 1996
Year
Variable 1989 1990 1991 1992 1993 1994 1995 1996
Panel A: Adopted-Cadbury firms Sample size 321 373 395 434 445 463 452 440 Percentage of firms in compliance at year end 3% 9% 15% 25% 54% 75% 89% 100% Board size (mean) 6.8 6.8 6.8 7.0 7.9 8.1 8.2 8.2 Percentage of outside directors (mean) 26.4% 26.5% 27.1% 29.6% 38.9% 40.3% 42.7% 44.9% Book value of assets (mean in millions) £ 194.2 £ 149.4 £ 186.4 £ 215.8 £ 262.5 £ 285.6 £ 312.6 £ 370.6 Market value of equity (mean in millions) £ 219.5 £ 226.8 £ 247.9 £ 277.3 £ 299.9 £ 293.6 £ 322.8 £ 342.0
Panel B: Always-in-compliance firms
Sample size 204 240 237 254 245 284 273 286 Board size (mean) 8.1 8.1 8.1 8.1 8.3 8.4 8.4 8.5 Percentage of outside directors (mean) 42.1% 44.3% 45.0% 43.4% 42.5% 44.1% 44.1% 45.7% Book value of assets (mean in millions) £ 547.7 £ 602.6 £ 684.9 £ 741.8 £ 670.6 £ 644.9 £ 740.6 £ 747.8 Market value of equity (mean in millions) £ 620.2 £ 448.7 £ 563.7 £ 613.6 £ 736.4 £ 682.3 £ 771.5 £ 904.4

36
Panel C: Never-in-compliance firms Sample size 175 190 182 193 192 190 182 176 Board size (mean) 6.5 6.3 6.2 6.5 6.8 7.0 7.0 7.1 Percentage of outside directors (mean) 16.7% 16.0% 17.7% 18.5% 19.4% 20.1% 21.3% 21.5% Book value of assets (mean in millions) £ 221.2 £ 256.0 £ 264.5 £ 252.7 £ 247.0 £ 211.4 £ 242.2 £ 231.6 Market value of equity (mean in millions) £ 97.5 £ 86.2 £ 92.2 £ 91.8 £ 100.5 £ 107.3 £ 139.6 £ 134.1
Descriptive statistics for publicly-traded UK industrial firms (with data on board composition and financial information) over the period 1989 through 1996. In the aggregate, the sample includes 1,124 firms that enter the analysis with at least one year of data. The sample is split into three mutually exclusive groups: (1) the set of firms that had at least 3 outside directors every year in which they were listed on the LSE over the period 1989 through 1996 (the always-in-compliance firms), (2) the set of firms that never had more than 2 outside directors any year in which they were listed over the period 1989 through 1996 (the never-in-compliance firms), and (3) the remaining set of firms which comprise those that added a sufficient number of outside directors so as to come into compliance with the Cadbury Committee recommendation of at least 3 outside directors any year during 1989 through 1996 (the adopted-Cadbury firms). To determine into which set to classify a firm, we identified the number of outside directors each year for each firm from the Stock Exchange Yearbook. Accounting information and share prices are taken from Datastream. Return on assets (ROA) is calculated as earnings before interest, taxes and depreciation divided by beginning-of-year total book value of assets.

37
Table 2
ROA and change in ROA for adopted-Cadbury firms and always-in-compliance firms listed on the London Stock Exchange over the period 1989 through 1996
Event Sample Adopted- Always-in- Difference Always-in- Difference year size Cadbury compliance in means compliance in means firms industry- (col. C industry- & (col. C (in %) matched minus performance- minus firms col. D) matched col. F) (in %) firms (in %) (A) (B) (C) (D) (E) (F) (G)
Panel A: Return on assets (mean ROA in percent) y-1 490 7.04% 9.45% 6.99% y 500 9.15 9.53 7.99 y+1 491 9.71 9.64 8.47 y+2 424 9.54 9.51 8.57 y+3 343 9.58 9.51 9.27
Panel B: Change in return on assets (mean ∆ROA in percent) y-1 to y+1 491 2.67%a 0.19% 2.48%a 1.48%b 1.19%b y-1 to y+2 424 2.50a 0.05 2.45a 1.58a 0.92b y-1 to y+3 343 2.54a 0.05 2.49a 2.28a 0.26 The sample includes 1,124 firms that enter the analysis with at least one year of data. We split the sample into three mutually exclusive groups: (1) the set of firms that had at least 3 outside directors every year in which they were listed on the LSE over the period 1989 through 1996 (the always-in-compliance firms), (2) the set of firms that never had more than 2 outside directors any year in which they were listed over the period 1989 through 1996 (the never-in-compliance firms), and (3) the remaining set of firms that comprises those that added a sufficient number of outside directors so as to come into compliance with the Cadbury Committee recommendation of at least 3 outside directors any year during 1989 through 1996 (the adopted-Cadbury firms). To determine into which set to classify a firm, we identified the number of outside directors each year for each firm from the Stock Exchange Yearbook. Accounting information to compute ROA is taken from Datastream. ROA is calculated as earnings before interest, taxes and depreciation divided by the total book value of assets. Industry matching is based on FTIC. Performance matching is based on ROA in year y-1. a and b indicate significance at the 0.01 and 0.05 level.

38
Table 3
ROA and change in ROA for adopted-Cadbury firms and never-in-compliance firms listed on the London Stock Exchange over the period 1989 through 1996
Event Sample Adopted- Never-in- Difference Never-in- Difference year size Cadbury compliance in means compliance- in means firms (in %) industry- (col. C industry- & (col. C (in %) matched minus performance- minus firms col. D) matched col. F) (in %) firms (in %) (A) (B) (C) (D) (E) (F) (G)
Panel A: Return on assets (mean ROA) y-1 490 7.04% 7.87% 7.17% y 500 9.15 7.77 7.28 y+1 491 9.71 8.30 7.69 y+2 424 9.54 8.54 8.37 y+3 343 9.58 8.92 8.50
Panel B: Change in return on assets (change in mean ROA) y-1 to y+1 491 2.67%a 0.44% 2.23a 0.52% 2.15%a y-1 to y+2 424 2.50a 0.67 1.82a 1.20b 1.30b y-1 to y+3 343 2.54a 1.05b 1.49b 1.33b 1.21b The sample includes 1,124 firms that enter the analysis with at least one year of data. We split the sample into three mutually exclusive groups: (1) the set of firms that had at least 3 outside directors every year in which they were listed on the LSE over the period 1989 through 1996 (the always-in-compliance firms), (2) the set of firms which never had more than 2 outside directors any year in which they were listed over the period 1989 through 1996 (the never-in-compliance firms), and (3) the remaining set of firms that comprises those that added a sufficient number of outside directors so as to come into compliance with the Cadbury Committee recommendation of at least 3 outside directors any year during 1989 through 1996 (the adopted-Cadbury firms). To determine into which set to classify a firm, we identified the number of outside directors each year for each firm from the Stock Exchange Yearbook. Accounting information to compute ROA is taken from Datastream. ROA is calculated as earnings before interest, taxes and depreciation divided by the total book value of assets. Industry matching is based on FTIC. Performance matching is based on ROA in year y-1. a and b indicate significance at the 0.01 and 0.05 level.

39
Table 4
ROA and change in ROA for adopted-Cadbury firms and their industry- and performance-matched always-in-compliance firms listed on the London Stock Exchange over the period 1989 through 1996
Industry- & Industry- & performance-matched performance-matched
Event Adopted- always-in- Difference Adopted- always-in- Difference year Cadbury firms compliance firms in means Cadbury firms compliance firms in means
Low Moderate High Low Moderate High Low Moderate High Pre Post Pre Post Pre Post ROA ROA ROA ROA ROA ROA ROA ROA ROA 1992 1993 1992 1993 1992 1993 (in %) (in %) (in %) (in %) (in %) (in %) (in %) (in %) (in %) (in %) (in %) (in %) (in %) (in %) (in %) (col. H (col. I (col. K (col. L minus minus minus minus col. J) col. K) col. M) col. N)
(A) (B) (C) (D) (E) (F) (G) (H) (I) (J) (K) (L) (M) (N) (O) (P)
Panel A: Return on assets (mean ROA in percent) y-1 -7.25% 9.96% 19.73% -6.90% 10.06% 19.18% 7.16% 6.76% 7.27% 6.77% y 0.66 10.10 19.55 -4.59 10.14 18.39 9.23 9.03 7.80 8.21 y+1 3.63 10.61 18.77 0.28 10.17 18.17 9.66 9.80 8.11 8.71 y+2 4.02 10.53 18.47 1.37 10.15 17.13 9.51 9.75 8.27 8.78 y+3 4.76 11.11 18.61 3.14 10.08 17.07 9.44 9.95 9.07 9.44
Panel B: Change in return on assets (mean ∆ROA in percent)
y-1 to y+1 10.88%a 0.65% -0.96% 7.18%a 0.11% -1.01% b 3.70%a 0.54% 0.05% 2.50%a 3.04%a 0.84% 1.94%a 1.66%a 1.10%b y-1 to y+2 11.27a 0.57 -1.26b 8.27a 0.09 -2.05a 3.00a 0.48 0.79 2.35a 2.99a 1.00b 2.01a 1.35a 0.98b y-1 to y+3 12.01a 1.15b -1.11b 10.04a 0.02 -2.11a 1.97a 1.13b 1.00b 2.28a 3.19a 1.80b 2.67a 0.48 0.52 The sample includes 1,124 firms that enter the analysis with at least one year of data. We split the sample into three mutually exclusive groups: (1) the set of firms that had at least 3 outside directors every year in which they were listed on the LSE over the period 1989 through 1996 (the industry- and performance-matched always-in-compliance firms), (2) the set of firms that never had more than 2 outside directors any year in which they were listed over the period 1989 through 1996 (the industry- and performance-matched never-in-compliance firms), and (3) the remaining set of firms that comprises those that added a sufficient number of outside directors so as to come into compliance with the Cadbury Committee recommendation of at least 3 outside directors any year during 1989 through 1996 (the adopted-Cadbury firms). To determine into which set to classify a firm, we identified the number of outside directors each year for each firm from the Stock Exchange Yearbook. Accounting information to compute ROA is taken from Datastream. ROA is calculated as earnings before interest, taxes and depreciation divided by the total book value of assets. Industry matching is based on FTIC. Performance matching is based on ROA in year y-1. a and b indicate significance at the 0.01 and 0.05 level.

40
Table 5
ROA and change in ROA for adopted-Cadbury firms and never-in-compliance firms listed on the London Stock Exchange over the period 1989 through 1996
Industry- & Industry- & performance-matched performance-matched
Event Adopted- never-in- Difference Adopted- never-in- Difference year Cadbury firms compliance firms in means Cadbury firms compliance firms in means
Low Moderate High Low Moderate High Low Moderate High Pre Post Pre Post Pre Post ROA ROA ROA ROA ROA ROA ROA ROA ROA 1992 1993 1992 1993 1992 1993 (in %) (in %) (in %) (in %) (in %) (in %) (in %) (in %) (in %) (in %) (in %) (in %) (in %) (in %) (in %) (col. B (col. C (col. D (col. K (col. L minus minus minus minus minus col. E) Col. F) col. G) col. M) col. N)
(A) (B) (C) (D) (E) (F) (G) (H) (I) (J) (K) (L) (M) (N) (O) (P)
Panel A: Return on assets (mean ROA in percent) y-1 -7.25% 9.96% 19.73% -6.28% 9.99% 18.19% 7.16% 6.76% 7.45% 6.95% y 0.66 10.10 19.55 -1.84 9.71 16.28 9.23 9.03 7.07 7.47 y+1 3.63 10.61 18.77 0.72 9.30 14.68 9.66 9.80 7.10 8.00 y+2 4.02 10.53 18.47 2.14 9.32 14.70 9.51 9.75 7.70 8.66 y+3 4.76 11.11 18.62 2.11 9.01 13.42 9.44 9.95 8.32 8.72
Panel B: Change in return on assets (mean DROA in percent)
y-1 to y+1 10.88%a 0.65% -0.96% 7.00%a -0.69% -3.51%a 3.88%a 1.34%b 2.55%a 2.50%a 3.04%a -0.35% 1.05%b 2.85%a 1.99%a y-1 to y+2 11.27a 0.57 -1.26b 8.42a -0.67 -3.49a 2.85a 1.24b 2.23a 2.35a 2.99a 0.25 1.71a 2.10a 1.28b y-1 to y+3 12.01a 1.15b -1.11b 8.39a -0.98 -4.77a 3.62a 2.13a 3.66a 2.28a 3.19a 0.87 1.77a 1.41b 1.42b The sample includes 1,124 firms that enter the analysis with at least one year of data. We split the sample into three mutually exclusive groups: (1) the set of firms that had at least 3 outside directors every year in which they were listed on the LSE over the period 1989 through 1996 (the industry- and performance-matched always-in-compliance firms), (2) the set of firms that never had more than 2 outside directors any year in which they were listed over the period 1989 through 1996 (the industry- and performance-matched never-in-compliance firms), and (3) the remaining set of firms that comprises those that added a sufficient number of outside directors so as to come into compliance with the Cadbury Committee recommendation of at least 3 outside directors any year during 1989 through 1996 (the adopted-Cadbury firms). To determine into which set to classify a firm, we identified the number of outside directors each year for each firm from the Stock Exchange Yearbook. Accounting information to compute ROA is taken from Datastream. ROA is calculated as earnings before interest, taxes and depreciation divided by the total book value of assets. Industry matching is based on FTIC. Performance matching is based on ROA in year y-1. a and b indicate significance at the 0.01 and 0.05 level.

41
Table 6
Regressions of the change in ROA on indicator variable for adopted-Cadbury (1) or not (0), log of firm assets, and an indicator variable for adopted-Cadbury before (0) or after (1) December 1992 for
U.K. industrial firms listed on the London Stock Exchange over the period 1989 through 1996 Adopted-Cadbury & industry-matching
firms’ changes in ROA (dependent variable = ∆ROA)
Adopted-Cadbury & industry- and performance-matching firms’ changes in ROA
(dependent variable = ∆ROA)Independent variable y-1 to y+1 y-1 to y+2 y-1 to y+3 y-1 to y+1 y-1 to y+2 y-1 to y+3
Panel A: Adopted-Cadbury firms matched with always-in-compliance firms Intercept 0.035 0.047 0.034 0.041 0.079b 0.093a Adopted-Cadbury indicator 0.027a 0.040a 0.038a 0.018a 0.021a 0.011 Log assets -0.003 -0.005 -0.005 -0.003 -0.006b -0.007a Adopted-Cadbury after 1992 indicator
-0.001 0.002 -0.003 -0.002 0.002 -0.004
No. of observations 882 848 686 882 848 692 Adj. R-squared 0.003 0.055 0.067 0.009 0.017 0.012
Panel B: Adopted-Cadbury firms matched with never-in-compliance firms Intercept 0.033 0.058 0.072 -0.004 0.112 a 0.075 Adopted-Cadbury indicator 0.027a 0.026a 0.012b 0.030a 0.020a 0.018a Log assets -0.002 -0.005 -0.005 0.000 -0.009a -0.006a Adopted-Cadbury after 1992 indicator
-0.001 0.002 -0.004 -0.001 -0.000 -0.006
No. of observations 882 848 686 882 848 686 Adj. R-squared 0.024 0.028 0.015 0.023 0.027 0.018 The dependent variable in each regression is the change in ROA over the interval indicated in the column heading. The independent variables are an indicator variable to identify whether a firm adopted Cadbury (1) or not (0), the log of book value of assets and an indicator identify whether the firm adopted Cadbury after 1992. The sample includes 1,124 firms that enter the analysis with at least one year of data. The sample constitutes three mutually exclusive groups: (1) the set of firms that had at least 3 outside directors every year in which they were listed on the LSE over the period 1989 through 1996 (the always-in-compliance firms), (2) the set of firms that never had more than 2 outside directors any year in which they were listed over the period 1989 through 1996 (the never-in-compliance firms), and (3) the remaining set of firms that comprises those that added a sufficient number of outside directors so as to come into compliance with the Cadbury Committee recommendation of at least 3 outside directors any year during 1989 through 1996 (the adopted-Cadbury firms). To determine into which set to classify a firm, we identified the number of outside directors each year for each firm from the Stock Exchange Yearbook. Accounting information for ROA is taken from Datastream. ROA is calculated as earnings before interest, tax and depreciation divided by beginning of year assets. Log assets is the logarithm of book assets as of the beginning of the year. Industry matching is based on FTIC. Performance matching is based on ROA in year y-1. The OLS regressions are reported with robust standard errors. a and b indicate significance at the 0.01 and 0.05 level.

42
Table 7
Stock price response to the appointments of directors of UK firms listed on the London Stock Exchange, 1989-1996
Sample Announcement period size excess return
Panel A: Outside and inside director appointments
Appointments that increase 326 0.25% outside directors to ≤ 2 (0.03)
Appointments that increase 626 0.44% outside directors to ≥ 3 (< 0.01)
Appointments of inside directors 940 0.17% (0.06)
Panel B: Director appointments classified by proportionate change in board composition
Appointments that increase the fraction 611 0.20% of inside directors by 0.20 or less (0.06)
Appointments that increase the fraction 250 0.13% of inside directors by 0.21 – 0.39 (0.17)
Appointments that increase the fraction 79 -0.03% of inside directors by 0.40 or more (0.65) Appointments that increase the fraction 332 0.16% of outside directors by 0.20 or less (0.08)
Appointments that increase the fraction 396 0.40% of outside directors by 0.21 – 0.39 (< 0.01)
Appointments that increase the fraction 224 0.59% of outside directors by 0.40 or more (< 0.01) The sample includes director appointments from the board rosters for the 1,124 firms that enter our analysis over the period 1989 through 1996. The total number of new director appointments was 1,988 of which 1,003 were outside directors and the remainder were inside directors. We initially split the sample of director appointments into three groups: (1) appointments that increase the number of outside directors to two or less, (2) appointments that increase the number of outside directors to three or more, and (3) inside director appointments. In subsequent analyses, we split the sample of all inside director appointments into

43
three sub-groups according to the increase in the fraction of inside directors on the board resulting from the board appointment: (1) appointments that increase the fraction of inside directors by 0.20 or less, (2) appointments that increase the fraction of inside directors by 0.21 to 0.39, and (3) appointments that increase the fraction of inside directors by 0.40 or more. We also repeat this analysis for outside director appointments. To conduct our event study, we use the market model procedure to estimate market model parameters using daily stock returns over the interval 153 trading days prior to the announcement day through 3 days prior to the announcement date. Stock returns are from Datastream. p-values are in parentheses.