the size and composition of corporate headquarters in
TRANSCRIPT
The Size and Composition of Corporate Headquarters in Multinational Companies: Empirical Evidence
CitationCollis, David J., David Young, and Michael Goold. "The Size and Composition of Corporate Headquarters in Multinational Companies: Empirical Evidence." Journal of International Management 18, no. 3 (September 2012): 260–275.
Published Versionhttp://www.sciencedirect.com/science/article/pii/S1075425312000415
Permanent linkhttp://nrs.harvard.edu/urn-3:HUL.InstRepos:9932218
Terms of UseThis article was downloaded from Harvard University’s DASH repository, and is made available under the terms and conditions applicable to Open Access Policy Articles, as set forth at http://nrs.harvard.edu/urn-3:HUL.InstRepos:dash.current.terms-of-use#OAP
Share Your StoryThe Harvard community has made this article openly available.Please share how this access benefits you. Submit a story .
Accessibility

THE SIZE AND COMPOSITION OF CORPORATE HEADQUARTERS IN MULTINATIONAL COMPANIES:
Empirical Evidence
David Collis
Harvard Graduate School of Business Administration
Morgan 211, Soldiers Field, Boston MA 02163, USA
[email protected] 617-495-6768 (Corresponding Author)
David Young
Ashridge Strategic Management Centre
71 Kingsway
London WC2B 6ST
United Kingdom
Michael Goold
Ashridge Strategic Management Centre
71 Kingsway
London WC2B 6ST
United Kingdom

Abstract
Based on a six country survey of nearly 250 multinationals (MNCs), this paper is the first empirical
analysis to describe the size and composition of MNC headquarters and to account for differences among
them.
Findings are that: MNC corporate headquarters are more involved in “obligatory” and value
creating and control functions than in operational activities: there are no systematic differences in the
determinants of the size and composition of corporate headquarters between MNCs and purely domestic
companies: as the geographic scope of an MNC increases two offsetting phenomena occur – headquarters
decrease their influence over operational units which ceteris paribus reduces the size of headquarters, but
the relative size of obligatory functions at headquarters increases with increased country heterogeneity.
The net effect is that the size of corporate headquarters expands as MNC geographic scope increases. The
notion of “administrative heritage” is validated as MNCs from different countries have substantially
different corporate headquarters - US headquarters are large (220 median staff for a 20,000 FTE MNC) and
European headquarters smaller (120).
Implications are drawn that countries will lose activities if domestic firms are acquired by foreign
MNCs, and that MNCs need to allow more subsidiary autonomy as their geographic scope increases.
KEYWORDS: Headquarters, Subsidiaries, Multinational Corporations, Organisation Design, Administrative
Heritage, International Strategy.
THE SIZE AND COMPOSITION OF CORPORATE HEADQUARTERS IN MULTINATIONAL COMPANIES:
Empirical Evidence
1. Introduction and motivation
Multinational corporations (MNCs) are a ubiquitous feature of the modern economy, accounting for
about one quarter of global output and one third of international trade (Jensen, 2006). Their
importance to economic activity increases as the global economy becomes increasingly integrated, and,
notwithstanding the interruption caused by the recent financial crisis and recession, that role is likely to
continue to expand (World Bank, 2010) since there remains substantial deviation from perfectly
integrated global markets (Ghemawat, 2011).
Given this importance of the multinational corporation there has been much research on its role
and functioning as an institution (Bartlett and Ghoshal, 1989; Birkinshaw et al., 2003; Rugman and
Verbeke, 2005). However, one aspect of that entity – the role headquarters plays within the MNC –
although it has seen interest from various disciplines, has been understudied. While corporate
headquarters in general, but not specifically in MNCs, have been the subject of research (Collis et al.,
2007, 2009; Markides, 2002), and while attention in the last decade has focused on the roles played by
country subsidiaries within an MNC (Birkinshaw and Hood, 1998; Holm and Pedersen, 2000), less
attention has been paid to the specific role that MNC headquarters perform. This paper represents an
attempt to remedy that dearth of research by explicitly examining the size and composition of
headquarters in multinational corporations.
At the macroeconomic level, decisions as to what activities occur at the headquarters location in the
home country affect the activities that take place in subsidiaries elsewhere. Taken to the extreme, this
raises the fear that unless corporate headquarters are based in a country, high value added
headquarters jobs will leave the country, so that, as was said of Australia, it will become merely a
“branch office economy” (Garnaut, 2002). This concern over the effect of nationality of ownership on
jobs (Reich, 1990) has led to government objections to takeovers of domestic companies (e.g., Canada’s
recent reaction to a bid for Potash, Erman, 2010). While prior studies have found limited substitution
between home country and foreign activities - for example, there was shown to be little or no impact on
R&D in Sweden after the acquisition of domestic firms by foreign MNCs (Bandick et al., 2010) -
understanding which activities take place in MNC headquarters should offer additional insight into this
important policy issue.
MNC executives have struggled to define an appropriate role for headquarters to effectively create
value from international activities. The frequent large scale reorganizations and rightsizing (in either
direction) of an MNC’s headquarters illustrate how unsure many are as to the optimal structure and
influence of that entity (Bartlett, 1983). The classic recent example is Coca Cola Enterprises that has
gone from slashing Atlanta headquarters by 6,000 employees in 2000 in order to push decision-making
into the countries, to reinstating people and tasks at Atlanta under a new CEO after 2004 (Ghemawat,
2007). Similarly, a recent turnaround at Kraft has been attributed to the decision to delegate substantial
authority from corporate headquarters to country management (Rosenfeld, 2009).
Strategists, organizational design, and international business scholars have therefore sought to
develop prescriptions for the optimal allocation of tasks between headquarters and country subsidiaries
(Bartlett and Ghoshal, 1989; Forsgren et al., 2005; Galbraith, 2000).1 For them, the challenge is to
balance the tensions inherent in operating internationally – achieving global efficiency and dynamic
arbitrage, while maintaining the flexibility to adapt to local market requirements (Bartlett and Ghoshal,
1989; Ghemawat, 2007). This has led to specific recommendations concerning headquarters design that
seek to balance the requirements of centralisation with decentralization (Bartlett and Ghoshal, 1989);
that illustrate how headquarters’ relations with subsidiaries depends on the international strategy and
underlying nature of the resource that underpins the competitive advantage of the MNC (Calori et al.,
2000; Porter, 1986; Rugman and Verbeke, 2001); and that show the effect of differences in the
institutional environments of countries in which the MNC operates on the allocation of activities to
those subsidiaries, and therefore on the responsibilities of headquarters2 (Birkinshaw et al., 1998;
Paterson and Brock, 2002).
While this work is valuable, there has been a dearth of empirical research that examines what
actually goes on at the headquarters of MNCs. This paper seeks to remedy that deficiency by analyzing
the size, composition, and determinants of activities at the corporate headquarters of a sample of 244
MNCs based in the US, UK, Germany, France, Netherlands, and Chile. Its aim is to answer basic
questions concerning, first, a description of the type and size of activities that are undertaken at
headquarters and, second, what determines those choices, including whether they differ from purely
domestic corporations; how they change as the geographic scope of the MNC expands; and whether
there are significant differences among countries. Its findings provide suggestions for policymakers
confronting the takeover of an important domestic firm by a foreign multinational, and MNC executives
struggling with the design of corporate headquarters and its relationship with foreign subsidiaries.
2. Related literature and hypotheses
There are two streams of literature that provide theoretical insight into the role of headquarters in
the MNC. The first is strategy research on the role of corporate headquarters in diversified or multi-
business corporations (Collis et al., 2007; Foss, 1997; Markides, 2002). This covers a broader set of firms
than simply MNCs but has direct applicability to the more specific phenomenon of headquarters in
companies that operate across borders since both address multi-market activity.3 The second is the
international business literature on the design of the headquarters-subsidiary relationship that
1 The intermediate role of regional headquarters has recently also been a focus of study (Enright, 2005).
2 Recently the impact of institutional factors on the location of headquarters itself has been investigated (Benito et al.,
2011; Laamanen et al., 2012). 3 Both multibusiness and multinational strategy address issues of value creation, and the design of organizations that
control delegated decision-making and coordinate activities across multiple markets. Of course, a corporation can be
both multi-business and multinational - as are most companies in our sample.
specifically addresses MNCs but which has most recently focused on the subsidiaries, rather than the
headquarter’s role (Birkinshaw and Hood, 1998).
2.1. Corporate headquarters
Research on corporate headquarters began with Chandler’s seminal work on the emergence of the
M-form corporation (Chandler, 1962). He identified the corporate headquarters, or “general office”,
separate from the operating units as the distinguishing feature of the M-form corporation, and first
classified the two unique functions of that entity as being “coordinate, appraise and plan goals and
policies” and “allocate resources”. In doing this he began to address the fundamental question for
multi-business entities of how to add value beyond that which the lines of business could generate by
themselves or through market contracts.
On revisiting the issue, and aware of advances in agency theory (Jensen and Meckling, 1976),
Chandler later reclassified the roles of headquarters into “entrepreneurial” (value creating), and
“administrative” (loss preventive) (Chandler, 1991). More recent observers have taken a more nuanced
approach by distinguishing more roles for the corporate office and arguing that the determinants of the
size of each will be different (Foss, 1997; Markides, 2002). In particular, Collis et al. classified the set of
activities performed at corporate headquarters to distinguish the “obligatory functions” required of any
corporate entity (tax and treasury, financial reporting, general management ) from “shared services”
that exploit scale economies but that are placed at headquarters rather than in a division for
convenience rather than economic reasons, “ control” activities that are required to minimize the
agency costs of delegating decision-making to operating units, and “value creating” or coordinative
functions that develop, allocate, and deploy valuable resources throughout the corporation and so
justify its existence as a multi-business entity (Collis et al., 2007).
Having identified the distinctive functions of corporate headquarters, it would be appealing to
formulate a comprehensive theory of their determinants. Unfortunately, given the current state of
knowledge and the range of perspectives that have been applied to the phenomenon – from
information processing, to agency and resource based theory – this has not yet been achieved. Instead,
the most that has been accomplished is to derive a set of hypotheses about the size and composition of
headquarters that each theory suggests and to test their individual validity. Research on which this
study is based, did just that and showed that the determinants of the size and roles of the various
headquarters functions differed depending on a variety of factors (Collis et al., 2007).
With regard to the size of headquarters, it was found that the absolute size of the firm has the
single most important effect. While there are substantial economies of scale in the operation of
headquarters (of the order of 25%, Collis et al., 2007), if nothing else, the information processing
requirements increase with firm size (Egelhoff, 1988), and so does the absolute size of headquarters.
With regard to the selection, relative size, and role of the functional activities that are performed at
headquarters, it is the corporate strategy, which has the greatest influence on the design of corporate

headquarters.4 The most salient evidence for this is the distinction between related and unrelated
diversification strategies that was originally found by Hill et al. (Hill et al., 1992), and confirmed by
others (Collis et al., 2007; Goold et al., 1994; Markides and Williamson, 1996). In particular, unrelated
diversifiers tend to have simpler divisional structures with financial control mechanisms and much less
influence on the operating businesses than related diversifiers, as well as fewer functional activities
represented at headquarters. As a result of these choices unrelated diversifiers have substantially
smaller headquarters than their more closely related counterparts.
Although it is difficult to directly measure corporate strategy, the research found that the size and
composition of headquarters is affected by a number of design choices that correlate with overall
corporate strategy and which can be measured directly (Collis et al., 2007). These include, among
others, the relatedness of the portfolio, organization structure, control mechanism, and the degree of
influence that headquarters exerts over the operating business units. Since the choices made for each
of these elements are co-determined and together define the corporate strategy, measuring these
variables identifies the underlying determinants of the size and composition of corporate headquarters.
This research primarily related to the management of product market diversification. One natural
question is whether the same determinants found in that work apply to geographic market
diversification. MNC’s might, for example, have a different mix of activities performed at headquarters
than purely domestic firms because of the difficulty coordinating across countries with widely varying
institutional structures and cultures.
2.2. Multinational companies
2.2.1. Overall Size and Determinants of MNC headquarters The international business literature began examining the role of headquarters in the multinational
corporation by focusing on a centralisation – decentralisation continuum as a way to resolve the classic
tradeoff inherent in any multinational between global efficiency and local responsiveness (Prahalad,
1975). With limited attention to the specific roles played by headquarters, the focus was on the degree
of delegation of authority to the country subsidiary organizations so the field identified a limited
number of generic strategies, perhaps best captured in Porter’s notion of multi-domestic and global
strategies (Porter, 1986). These were at the extremes of a continuum with very nearly all activities
replicated in, and devolved to the countries in the former case, and with a single central entity
coordinating worldwide activities in the latter. Obviously the size and role of headquarters would be
substantially different in these two strategies, with the presumption that firms with multi-domestic
strategies had a smaller headquarters with fewer functions than those with a global strategy. Bartlett
and Ghoshal then appealed for an organizational form to transcend the tradeoff, and introduced the
concept of the transnational as a coordinated network of country operations (Bartlett and Ghoshal,
4 In addition the home country’s institutional structure and the firm’s ownership structure (private versus public) were
found to have a substantial impact on the size and functions of corporate headquarters since these establish the market
failures which the corporate hierarchy can efficiently replace.
1989). Similarly, the notion of a heterarchy was introduced as that of a network linking subsidiary
centres of excellence within the MNC (Holm and Pedersen, 2000).
In principle, therefore, some measure of international strategy would be useful in understanding
the optimal design of MNC headquarters. Given the difficulties accurately identifying firm strategy,
either in self-reported surveys or from external sources, this paper uses those directly observable design
choices, which the corporate headquarters literature showed were correlated with strategic choices, as
surrogates for an MNC’s strategy.
Specifically, organisation structure has long been one of the most studied topics in international
business. Even though one of its primary researchers had earlier warned of the inappropriate obsession
MNCs had for continual reorganizations to find the one best structure (Bartlett, 1983), towards the end
of the 20th century a widespread belief emerged that the matrix structure was the solution for
managing MNCs (Bartlett and Ghoshal, 1989; Galbraith, 2000). Since then, structure per se is no longer
seen as the only solution to managing the tensions between countries, functions, and businesses
(Bartlett and Ghoshal, 1997). Nevertheless, every organization does require some formal hierarchy and
that choice will have a profound impact on the size and composition of corporate headquarters.
Similarly, the traditional discussion of decentralisation can be captured in the choice of control
system adopted by the firm. Agency theory suggests that the solution to the agency costs of delegated
decision-making can either be to monitor and reward outcomes or behaviors (Baiman et al., 1995;
Eisenhardt, 1985). In the context of multi-business corporations, this difference gets captured in the
choice between financial and strategic control systems (Collis et al., 2007; Goold and Campbell 1987). In
the MNC context, we should expect to see something similar as firms struggle to balance autonomy and
local responsiveness with the need for oversight and standardization (Young and Tavares, 2004).
Finally, the extent to which a headquarters function influences the activities of operating businesses
has been seen as critical to understanding the relationship between MNC headquarters and country
subsidiaries (Tomassen et al, 2012). Early approaches to this subject tended to conflate the location of
an activity and the locus of decision-making authority, so that a subsidiary would either be allowed to
have its own function, such as brand marketing, and be given authority to make decisions, or both
would be located at headquarters. It was Porter who suggested that these were two different
dimensions and that locating an activity in a particular country did not mean that decision rights for that
activity vested in that country (Porter, 1986). His configuration and coordination matrix illustrates that
these two dimensions are separable, so that the physical location of an activity does not necessarily
constrain the managerial role of headquarters in an MNC. This suggests that a focus on the influence
that headquarters has on subsidiary activities is appropriate. If an MNC has a small headquarters
marketing organisation but that entity controls global brand and product positioning, it is clear it plays
an important role within the company even if the bulk of marketing personnel are in foreign
subsidiaries. Thus research should track the degree of influence that headquarters has over the
countries, not just the presence of the activity and the number of personnel located in headquarters.
Given that these design elements are the same as those which the corporate strategy literature has
identified as determinants of the size of corporate headquarters, we can expect that the effect of any
given element would be the same for MNCs and domestic firms, even if the occurrence of those policy
choices might differ between the two types of firm:
Hypothesis 1. The effect of policy choices that are codetermined with the corporate strategy, but
particularly a) organization structure; b) control system; and c) degree of headquarters operating
influence, on the size of corporate headquarters will be the same in MNCs as in purely domestic
diversified firms.
2.2.2. Composition of MNC headquarters
The international strategic archetypes were broad brush in their recommendation for which
activities to place where in the MNC. The most nuanced in this regard was Bartlett and Ghoshal’s
recognition that the allocation of responsibilities should not be the same for every activity (Bartlett and
Ghoshal, 1989). An MNC should carefully differentiate the allocation of activities between subsidiaries
and headquarters according to the relative strength of the demands for localisation versus
centralisation for each activity. Thus, service, which had to be delivered on site in a country, was best
managed locally by the country subsidiary, while basic R&D, which was subject to substantial economies
of scale, was best managed by corporate headquarters. The strong suggestion from this research was
that headquarters should be active only in those activities that benefited from scale economies or were
corporate level resources for which the benefits of centralisation compensated for the loss of local
adaptation. In contrast, operational activities required to actually deliver the product or service to
customers would be located in each country.
As with the multi-business literature, international business then sought to identify factors
that explained the allocation of particular activities between domestic headquarters and country
subsidiaries. This research can be placed either within Dunning’s eclectic (OLI) theory of the MNC
(Dunning, 1998), or in Rugman and Verbeke’s related notions of country specific advantages (CSAs) and
firm specific advantages (FSAs) within their internalization theory of the MNC (Rugman and Verbeke,
2001). In Dunning’s work, locational (L) advantages which have to be internalized (I) inside the MNC can
be interpreted as those activities that must be performed locally, while factors that are central to
ownership (O) advantages are perhaps best undertaken at headquarters.5 Rugman and Verbeke are
more explicit in recognizing that CSAs can only be exploited if the firm has located the relevant activities
in the relevant countries. In contrast, FSAs, although in principle non-location bound, are more likely to
be located in headquarters since they vest in the corporation and not the locality.
These theories suggest that activities undertaken in foreign countries are different than those left in
the home country and undertaken at corporate headquarters. The obligatory public company functions,
by definition, have to be performed at corporate headquarters. The value–creating functions, such as
R&D, undertaken at corporate headquarters will also be different than those activities performed in the
5 Uniting the multi-business and multinational fields, firm specific advantages can be seen as the valuable resources that
underpin sustained competitive advantage (Collis, 1991; Wernerfelt, 1984).
geographic subsidiaries which relate to the direct operation of the business in a country and the
exploitation of its CSAs. This is confirmed by the frequency of occurrence of operational activities in
subsidiaries. Holm and Pedersen, for example, find in their sample of 1793 European subsidiaries that
17% conduct research, 57% development, 69% production, 87% logistics and distribution, 87%
purchasing, and 95% marketing and sales (Holm and Pedersen, 2000).
Both theories also suggest that country specific factors will have a substantial influence on activities
undertaken within an MNC subsidiary. MNCs are not just, as was assumed to be the case in the classic
lifecycle view of the MNC, the diffuser of home country capabilities to inert country subsidiary
recipients. Rather, the MNC seeks to access and develop capabilities in geographies in which it locates
(Alcacer and Chung, 2002; Ambos et al., 2010; Bartlett and Ghoshal, 1986). Valuable skills, knowledge
and capabilities do not just flow from the headquarters outwards to the subsidiaries, but reciprocal
flows from the subsidiaries to the headquarters, and horizontal flows among each other, can be equally
valuable (Andersson et al., 2007; Cantwell and Madambi, 2005; Frost et al, 2002; Forsgren et al., 2005).
This more sophisticated view of the MNC as a network or federation suggests a more important role for
subsidiaries and a correspondingly reduced role for headquarters in some value-creating functions,
particularly those relating to knowledge creation (Ciabuchi et al. 2012; Dellestrand and Kappen, 2011).
Given these differences across activities, we can propose:
Hypothesis 2. a) The incidence at MNC headquarters of obligatory functions (general management,
treasury and tax, financial reporting) will be higher than discretionary activities (value adding and
control functions related to HR, audit, corporate planning, IT); b) whose incidence, in turn, will be higher
than for operational functions (marketing, distribution, and production).
2.2.3. Effect of geographic scope on MNC headquarters With the typical MNC growth path beginning in similar countries (with the dimensions of similarity
being some combination of economic, cultural, administrative and geographic measures, [Ghemawat,
2007]) a limited geographic scope is likely to be accompanied by market homogeneity. As geographic
scope increases, the variation among countries in the MNC’s portfolio is likely to increase. The resulting
heterogeneity and complexity will exacerbate control issues and the need for local adaptation, both of
which should lead to a change in the relationship between headquarters and subsidiaries.
In particular, the number of potential interactions between countries increases with the square of
the number of countries in the corporate portfolio. There are more time zones, languages, accounting
standards, and legal and regulatory institutions to deal with, each of which increases the complexity of
the oversight task. The effect of this will be to increase the information processing requirements at
headquarters as they aggregate data to a common reporting standard, issue reports in multiple
languages etc. These demands will increase the burden on an MNC headquarters and so increase the
size of the obligatory functions.

Hypothesis 3. Increasing geographic scope will increase the size of obligatory MNC corporate
headquarters functions.
Given the importance of the CSAs in which an MNC operates to its configuration, as the scope of the
firm expands there are likely to be changes in the relationship between corporate headquarters and
foreign subsidiaries. More specifically, the discretionary (value-creating) functions will be less likely to
occur at headquarters since they must be delegated to geographic subsidiaries in order that they can
adapt to local requirements and capitalize on the CSA’s of the more diverse geographies. What remains
of these functions at MNC corporate headquarters will also be reduced in size as headquarters becomes
less influential in shaping subsidiary decisions.
Hypothesis 4. As the geographic scope of the MNC increases (a) corporate headquarters will become
less influential in subsidiary decision-making, (b) the number of discretionary functions at headquarters
will decrease, and (c) the size of those functions will decrease.
The net effect of these two effects will be settled by the empirical evidence.
Hypothesis 5. The overall size of MNC corporate headquarters will increase/decrease with increasing
geographic scope.
2.2.4. Country of origin
International business research identified another important influence on MNC headquarters – that
of a common “administrative heritage” for firms from the same geography (Bartlett and Ghoshal, 1989).
Bartlett and Ghoshal argued that the institutional context of the home country would impact an MNC’s
evolutionary path and so lead to durable differences in organization design. Postulating that the US,
Europe, and Japan would exhibit different strategic and organizational forms, Bartlett and Ghoshal
argued that US MNCs typically had an international structure, Europeans a multinational structure, and
Japanese MNCs a global structure. While not explicit about exactly how those design choices would
affect headquarters, they described profound differences in the role played by that entity across
countries. We would therefore expect to find very different sizes and structures for MNC corporate
headquarters in different countries with Japan having the largest and Europe the smallest. There have
been few tests of that hypothesis, although Collis et al. did find substantive differences in corporate
headquarters of all diversified firms, not just MNCs, across countries (Collis et al., 2009), therefore:
Hypothesis 6. The nationality of an MNC will affect the size and composition of corporate headquarters.
3. Data and methodology To understand the phenomenon of corporate headquarters in the MNC a survey was undertaken
because companies are not required to report specifically on their headquarters. The most relevant
publicly available data is SEC filings in the USA which include a line item for “corporate expenses”.
Unfortunately, this is a residual category after expense allocation to self-reported segments, so there is
no consistency across companies. In other countries, not even this level of detail is publicly available.
Data was originally collected by researchers from within each of seven countries between 1997 and
1999.6 Countries were selected to include representatives of the four dominant governance systems
(Albert, 1993) – Anglo-American, Continental European, Asian, and developing countries. The specific
choice of country was determined by contacts of the lead researchers. The survey instrument was
developed from a version originally employed in the UK in 1993 (Young and Goold, 1993). In five
countries the survey was exactly the same, being merely translated into the appropriate language. In
the US, some definitions were altered to recognise differences in contemporary usage – company
secretary, for example, has a very different connotation in the US than in the UK – and the order and
phrasing of some questions was amended. Unfortunately, the Japanese variant of the survey did not
include measures of geographic scope, invalidating its usefulness in this research.
In each country CEO’s of the largest corporations, identified as those with more than a certain
number of employees, were mailed the survey questionnaire. After initial responses, follow-up mailings
and phone calls took place to contact non-respondents. While the extent of these contacts varied by
country, final response rates were similar across countries, averaging about 20%. While larger
companies were more likely to respond, there is no reason to suspect survey bias. Follow up calls
indicated that non-respondents were disproportionately single business domestic entities that did not
feel the questions were relevant. A proportion of respondents did not report a total headcount for their
corporate staff and were excluded from all the statistical analyses.
Overall 244 out of the 351 firms surveyed in the six countries classified themselves as operating in
more than one country and therefore qualified as multinational corporations and are the primary
subject of this paper.
Key to the survey was the common definition of corporate headquarters as “staff functions and
executive management with responsibility for, or providing services to, the whole of (or most of) the
company”. While it may be theoretically hard to draw lines around the activities performed at
headquarters and in the business units and country subsidiaries (Markides, 2002), empirically it is easy
to define which employees report to “the corporate office” – the pragmatic definition being the
organizational entity that pays the salary.
Table 1 defines the variables used in our analyses including a set of aggregated variables
constructed from raw data. The size of corporate headquarters is expressed as the logarithm of the
number of corporate headquarters staff per 1000 employees because the underlying data is skewed
towards higher values, and the close alignment of the medians and geometric means suggests a roughly
lognormal distribution. Obligatory staff are defined as those in the five functions which very nearly
every company reported having – general management, legal, financial reporting and control, treasury,
6 Participants were M. Goold and D. Young of the Ashridge Strategic Management Centre in the UK, D. Collis then of
the Yale School of Management in the US, Georges Blanc of HEC in France, Rolf Buhner of Universtat Passau in
Germany, Jan Eppink of the Vrije Universiteit Amsterdam in the Netherlands, Gonzalo Jimenez of Universidad Adolfo
Ibanez in Chile, and Tadao Kagono of Kobe University in Japan. A more detailed description of the data can be found in
Collis et al., 2007.

and taxation. Discretionary staff included all remaining staff listed as being part of corporate
headquarters. Shared services was based on the number of service staff that were reported, expressed
as a proportion of the total corporate staff, and then placed in roughly equal categories of less than
20%, from 20% to 40%, or above 40%.
Because many of these large firms are diversified across many 4 digit SIC codes, we asked firms to
place themselves within one of twelve broad industry sectors, such as financial services or
telecommunications. Several survey questions asked for responses on a Likert scale across a number of
factors. Functional influence, for example, was assessed for human resources, R&D, marketing,
purchasing/logistics, and information technology. The responses were aggregated to form a single
overall influence score. Other questions asked respondents to place their firm in a category. Span of
control, for example, was an ordinal rank corresponding to the categories 1 to 3, 4 to 10, 11 to 30, or
more than 30 business units reporting directly to corporate headquarters. Similarly, organization
structures were categorized according to their degree of divisional complexity ranging from single
business, through single business unit divisions, to multi-business unit divisions, and matrix. Geographic
scope was measured both categorically – one, two or three continents – and as a cardinal measure.
Finally some variables, such as government ownership, were assigned binary values. Finally, a dummy
variable was introduced for the proportion of service staff at headquarters because this data was
missing for more than 5% of respondents. The shared services variable was then set to its reported
value when available, otherwise it was set to zero.
4. Results 4.1. Size and composition of activities undertaken at MNC headquarters
We begin by simply presenting the raw data on the size and composition of corporate headquarters
in MNCs. This data for domestic firms and for MNCs of varying geographic scope in Tables 2, 3 and 4
supports Hypotheses 2a and 2b.
The obligatory public company functions (corporate management, legal, treasury, tax, and financial
reporting) are nearly ubiquitous for MNCs with over 90% of corporations reporting them (Table 3). As
Hypothesis 2a suggests, the discretionary function including both control functions (internal audit and
IT), and value-creating roles (corporate development and HR) are less common in MNCs, although they
do occur in at least 75%7 of companies – the middle panel of Table 3. Activities related to the operations
of the business in the subsidiaries – marketing, purchasing, distribution, and, perhaps surprisingly, R&D,
shown in the bottom panel of Table 3 – support Hypothesis 2b since they have an even lower incidence.
Only about one third of MNCs have these functions at headquarters. It is apparent that subsidiaries and
headquarters activities are, by and large, complementary. Corporate headquarters performs the so-
called “obligatory” functions and a set of other control and value-creating functions, but limits its
overlap with the operational activities performed in the subsidiaries.
7 This is true with the exception of training and education, which in some companies is subsumed under HR.
4.2. Differences between MNCs and domestic firms
Table 2 illustrates that MNC headquarters staffs are smaller both in absolute size and as a share of
total employees than those of domestic firms (8.3 as opposed to 18.4 median staff per 000 employees).
Most of this difference in relative size is attributed to the substantially smaller discretionary staffs (5.1
versus 10.2 per 000 employees) although the obligatory staff functions are also somewhat smaller (3.0
versus 4.7 per 000 employees).
Indeed, there are no significant differences in the incidence of obligatory function between
domestic firms and MNCs. Similarly, those activities that, although not obligatory, nevertheless occur
frequently – the middle panel of Table 3 - also have only slightly less incidence in MNCs than domestic
firms. It is only those discretionary activities relating to the operations of the subsidiaries – marketing,
purchasing, distribution, and, perhaps surprisingly, R&D – which do show a substantial difference
between domestic firms and MNCs. While at least half of domestic firms have these functions at
headquarters (with the exception of logistics), it is only about a third of MNCs that do so and this
difference in incidence is significant at the 1% level.
Data on the relative size of these three functions at headquarters supports this analysis (Table 4).
The obligatory functions are somewhat smaller – on average about two thirds – in MNCs than domestic
firms. Other common control and value-creating functions, with the notable exception of IT, are about
half the size in MNCs and significantly different at the 1% level. It is the discretionary functions that
involve operations, which are much less common in MNC headquarters than domestically, that are also
relatively the smallest in MNCs (about one third the size of domestic firms). It is clear that MNC
headquarters are less involved in activities related to the operating businesses than their domestic
counterparts.
All of this is descriptive data. Since there are multiple factors affecting the size and composition of
corporate headquarters, analysis needs to determine if there are systematic differences between MNCs
and domestic firms. Scale economies (Collis et al., 2007), for example, will partially explain the
difference in headquarters size per 000 employees because MNCs in the sample are substantially larger
than domestic firms (14,138 versus 6,366 employees, Table 5). Similarly, MNCs are in less closely related
businesses (3.9 versus 5.0 relatedness score) and so their headquarters are less involved in exploiting
the linkages across businesses which in turn would require smaller corporate staffs (3.5 versus 4.7
linkages score). MNCs are also significantly more likely to have a sophisticated organization structure
(matrix and multi-business divisions) which was found to involve smaller headquarters staff (Collis et al.,
2007) – although even for the most geographically dispersed MNCs only 11% actually use the matrix.
In contrast, there are some organizational design elements that do not differ between domestic
firms and MNCs (Table 5). Spans of control are similar, as is the provision of shared services, and
perhaps more surprisingly, the type of control mechanism employed by headquarters. It was expected
that financial control systems would have been more frequently employed in MNCs, as they are in
unrelated diversifiers, because they can be implemented with less knowledge of, and wider variance

among operating units (Doz and Prahalad, 1981; Eisenhardt, 1985; Goold and Campbell, 1987). This was
not found to be the case.
However, the most important difference between MNCs and domestic firms that helps explain the
findings on the incidence and size of the specific functions performed at headquarters is the
substantially lower functional influence that MNC headquarters exert over their operating units (6.1
versus 8.3) which is significant at the 0.1% level. Confronted with the need to accommodate local
country differences, MNCs are less involved in the operations of their operating units. This is why they
have fewer of the operating functions performed at headquarters and why those units, when present,
are smaller than their domestic counterparts.
To understand whether there were systematic differences between domestic firms and MNCs we
used multivariate dependence techniques to model the determinants of corporate headquarters size in
a regression of additive functional form:
n
i
ii exa1
size rsHeadquarte
where xi is the set of variables and e the error term. The results are presented in the form of abridged
analyses of variance, with the signs of regression coefficients indicated (Table 6). For quantitative
variables the significance levels (estimated using F-values) are identical to the significance levels
calculated using t-values for the regression coefficients.
The regression is similar to that used in the original research on corporate headquarters in multi-
business corporations with the variables chosen to capture the key factors that theories suggested are
relevant (Collis et al., 2007). HQ1 shows the simplest form of the relationship, while HQ2 includes
organization design choices, and HQ3 the full set of policy choices which can be thought of as being
jointly determined with the overall strategy. Table 6 shows the results for all 244 MNCs in the sample.
These are similar to those for the original full sample of 600 firms, including Japan, reported earlier
(Collis et al., 2007) and are not significantly different from that for the domestic firms in the sample,
supporting hypothesis 1. Indeed, analysis of the regressions for the full sample of 351 firms showed that
the only terms that when interacted with MNC status showed significance were industry sector and
government ownership. Specifically, the effect of organisation structure (Hypothesis 1a), control system
(Hypothesis 1b), and corporate influence (Hypothesis 1c) on the size of corporate headquarters is not
significantly different between MNCs and domestic firms.
4.3. Effect of increasing geographic scope on MNC headquarters
We now examine how MNC corporate headquarters vary with geographic scope by comparing
MNCs that operate in one, two, or three or more continents. Table 2 shows that the relative number of
headquarters staff decreases as the geographic scope of the enterprise expands (with the exception of
two continent MNCs8), although the magnitude of that decrease is limited. As before, however, we
need to understand how the underlying policy choice variables alter with increasing geographic scope.
Table 5 shows that increasing the geographic scope of the MNC has the same effect as that observed
when a firm moves from being domestic to multinational. The average size of the three continent MNC
is larger than the one continent MNC (21,000 FTEs versus 5,177 respectively). Such MNCs are in less
related businesses (3.8 versus 4.4) - in particular only 2.9% of broad scope MNCs are in a single or
dominant business - and so seek to coordinate fewer linkages across businesses (3.5 versus 3.7), and
they are more likely to employ the matrix structure (10.6% versus 1.6%). Similarly, those factors that
were similar between MNCs and domestic firms do not seem to vary with MNC geographic scope – span
of control, control mechanism, and degree of shared services.
However, the most important difference between MNCs of differing geographic scope is also the
same as that which distinguishes MNCs and domestic firms. The degree of corporate headquarters
functional influence decreases as geographic scope increases (from 6.9 to 5.9) supporting Hypothesis
4a. This has a profound impact on the composition of MNC corporate headquarters and provides
evidence that as geographic distance and market heterogeneity increases, MNCs recognise the need for
autonomy to accommodate country differences by limiting their involvement in subsidiaries’ activities.
The effect of this can be seen in how the incidence and relative size of headquarters functions varies
with geographic scope (Tables 3 and 4). There seems to be little effect on obligatory functions, whose
incidence and relative size remains much the same across MNCs (3.29 and 3.14 per 000 employees for
one continent and three continent MNCs, respectively, Table 4). However, when adjusted for scale
economies, broad scope MNCs, which are much larger, will have relatively large numbers of staff at
corporate headquarters in these obligatory functions. At an average of four times the size of one
continent MNCs, three continent MNCs would have about half the number of obligatory staff per 000
employees if scale alone determined headquarters size. The fact that the actual number is equal
supports Hypothesis 3 and the notion that the increasing complexity of dealing with more, and more
varied countries, increases the information processing requirements at headquarters and so requires
proportionately more obligatory staff.
However the incidence of the intermediate discretionary functions, significantly increases with
geographic scope (middle panel of Table 3). This contradicts Hypothesis 4b and the notion that
increasing geographic scope leads to less discretionary corporate headquarters activity. Indeed, the
effect is so substantial that the incidence of these functions in a three continent MNC approaches that
of domestic firms, and even exceeds it for audit, HR, and IT. In order to retain control over a
heterogeneous and dispersed set of subsidiaries over which it has less direct operating influence, the
MNC headquarters appears to add functions to maintain the integrity of finances, human capital, and
information flows.
8 In several of the Tables MNCs active on two continents appear to be an anomaly (perhaps because of the small sample
size – only 39 companies).

The relative size of these discretionary functions in three continent MNCs is about the same when
corrected for scale as those functions in one continent MNCs (Table 4). Thus, as direct influence wanes
and organizational complexity increases, MNCs appear to compensate by installing small headquarters
staff in these areas in order to maintain some information flows on the activities of increasingly
dispersed subsidiaries, or perhaps to establish minimal governance standards that subsidiaries must
adhere to as they are otherwise allowed more autonomy.
The incidence of activities, such as marketing, that are directly related to the operations of the
geographic subsidiaries do not vary systematically with geographic scope, except distribution (Table 3).
However, the relative size of these functions decreases as geographic scope increases (Table 4). This
supports Hypothesis 4c and suggests that as scope and heterogeneity increase, headquarters becomes
less involved in operational activities by shrinking the size of those activities.9
Evidence on Hypothesis 4 concerning discretionary functions is, therefore, mixed. As MNCs increase
scope they retain relatively small headquarters activities in those discretionary functions that are
operational, but actually add some small activities in the discretionary functions that involve control and
value creation.
Two important results are apparent from this data. First, as geographic scope expands, the
informational demands on headquarters staff increases, which in turn increases headquarters size in the
obligatory functions (Hypothesis 3). However, offsetting this effect is the fact that as MNC scope
expands their influence over subsidiaries decreases and they attempt less coordination across
businesses (Hypothesis 4a). Ceteris paribus, this reduces the size of headquarters in broad scope MNCs
(Hypothesis 4b and 4c).
Multivariate regression was used to examine the net effect of these two offsetting forces on the
overall size of corporate headquarters in order to resolve Hypothesis 5. Table 6, which measured
geographic scope as a categorical variable, provides initial evidence that increasing scope increases the
overall size of headquarters since it is positive and significant in all three forms of the regression. Table
7 isolates the effect that geographic scope alone contributes to the relative size of corporate
headquarters. The first column shows that, relative to the size of headquarters in a firm active in one
continent, those active in three continents are substantially larger. The most interesting evidence,
however, is in the last column which is for the HQ3 regression incorporating all the policy variables. This
demonstrates that when controlling for the much higher degree of influence and coordination that
domestic firms and narrow scope MNCs have over their businesses, the largest headquarters are found
in MNCs with the broadest geographic scope at 1.82 times the median number of headquarters staff in
a one continent MNC. The three continent MNC is larger even than the domestic firm at only 1.21 times
9 The anomaly in this analysis is R&D since the size of this function in three continent MNCs is over 50% larger than
even domestic firms although the difference is not significant. Given that R&D is a potentially valuable corporate
resource or FSA and that the sample of industries in three continent MNCs was over-represented with R&D intensive
manufacturing and chemical industries (Table 5), we appear to have a sample bias towards “Global” MNC strategies that
create value by leveraging innovations from a large headquarters R&D function across many countries.
the size of a one continent MNC. Increasing geographic scope is therefore found empirically to increase
MNC headquarters size.
4.4. National differences in MNC headquarters
Table 6 shows a substantial and significant country effect on the size of corporate headquarters. To
further understand whether administrative heritage shapes MNC headquarters, we examined their
determinants in individual countries. A companion paper does this for all diversified corporations (Collis
et al., 2009). Here we were somewhat limited by the absence of Japanese data, and by the smaller
sample sizes of MNCs in some of the European countries, so the results are shown for Europe, USA, and
Chile (as the representative developing country). The larger sample paper had shown that, in fact, there
were significantly different US, Japanese, European and developing country models of corporate
headquarters, so the aggregation of European MNCs was less of a concern.10 Moreover, Bartlett and
Ghoshal argue for the existence of a European model of MNC structure (Bartlett and Ghoshal, 1989).
Figure 1 confirms that there are significant differences among the countries, and that the USA has
the largest MNC headquarters with, on average, about twice the number of employees in their MNC
headquarters than Europeans. The notion of administrative heritage therefore has support in the
radically different size of MNC headquarters across regions, confirming Hypothesis 6.
Table 8 explains where those higher numbers come from. US MNCs have substantially more
functions at headquarters than MNCs from other countries. In particular, the incidence of all the
discretionary and operating functions was highest in US MNCs. With regard to relative numbers of staff
in each function (Table 10), the US is not substantially higher, except for the IT and R&D functions,
where it is on average almost ten times the size of European firms. Given that 96% of US MNCs have a
headquarters IT function, compared to less than 70% of European MNCs, this difference in approach to
IT makes a substantial difference to the overall size of headquarters. The absolute size of the difference,
accounts for almost one quarter of the total headquarters. Others, have demonstrated the more
extensive adoption of IT by US firms (Bloom et al., forthcoming; Aral et al., 2006), so perhaps what is
occurring is that the large homogeneous domestic US market has encouraged the deployment of a
standardised IT system which is carried over into the international arena. The fact that R&D, which is
somewhat more frequently found in US MNC headquarters, is the largest single function – at 3.67
employees per 000 employees – in US MNCs deserves some similar explanation.
The determinants of MNC headquarters in a developing country, Chile, are harder to assess, partly
because the sample size is only 21 MNCs. Nevertheless Tables 8 and 9 do suggest that the MNC
headquarters in developing countries are different from developed countries, perhaps because of the
extent of family ownership and influence. With the exception of R&D and logistics, Chilean MNCs have
significantly fewer functions at headquarters than developed country MNCs. In contrast, for all
functions that they do operate at headquarters, except for R&D and, relative only to the US for IT,
10
No significant difference in the determinants of headquarters across European countries were found in the companion
paper (Collis et al., 2009).
Chilean MNCs have substantially more staff. The picture that emerges is of a more focused, but more
controlling headquarters.
5. Discussion
The paper has presented the first large scale empirical analysis of the size and composition of
headquarters in multinational corporations and reaches some valuable conclusions.
The activities that take place at corporate headquarters in MNCs appear to complement those
occurring in the geographic subsidiaries. While MNC headquarters have a full set of obligatory functions
and many value-creating and control functions, they have fewer functions related to the operations of
the businesses and these functions are also small (Hypothesis 2).
As a result of this configuration of activities, MNC headquarters do look different than those in
domestic firms. They tend to employ more complex organization structures, including the matrix, but
are not more likely to utilize financial control systems. At first blush they are smaller than their domestic
counterparts, but this is only because of their larger size and that they manage the relationship with
their businesses in a fundamentally different way. Most importantly, MNCs choose to exert less
influence and are less involved in coordinating linkages across their businesses than domestic firms.
Nevertheless, the underlying determinants of the size of headquarters in MNCs are similar to those
of all large corporations. While MNCs might make different choices than domestic firms for policies, the
effect of those choices on corporate headquarters remains the same. Similar scale domestic firms and
MNCs that each, for example, pursued a strategy involving less corporate influence on operating units,
would have similar size corporate headquarters. The factors that affect organizational design in multi-
market entities can, therefore, be seen as universal (Hypothesis 1). Size of firm, portfolio relatedness,
degree of influence on and linkages between businesses, country of origin, ownership structure, and
industry sector – all exert the same influence on the design of corporate headquarters, whether
domestic or MNC, that agency, information processing, and resource based theory would suggest (Collis
et al., 2007). The analysis therefore supports a view that the underlying drivers of control of delegated
decision-making and coordination to create value across markets, along with requirements for
obligatory functions, are common to all multi-market corporations, whether multi-product or multi-
country.
The analysis confirms that as geographic scope increases, the informational complexity of dealing
with a more heterogeneous set of countries requires a larger headquarters in the obligatory functions
(Hypothesis 3).
However, as geographic scope increases, MNCs decrease their influence over subsidiaries
(Hypothesis 4a). This is probably a conscious choice that MNCs make in order to increase the autonomy
of their foreign subsidiaries, allowing them to make adaptations to serve their local markets more
effectively and capitalize on the CSAs of increasingly heterogeneous product and factor markets. In turn,
this reduction in influence is accompanied by a reduction in the size, if not the incidence of
headquarters functions that relate to operational activities (Hypothesis 4c). This would reduce the size

of corporate headquarters. What was surprising was that the reduction in influence was accompanied
by an increase in the incidence of some discretionary, potentially value-adding headquarters functions
(disproving Hypothesis 4b). These appear to be small informational or standard setting roles in the
audit, HR and IT functions that seek to maintain some understanding of, and control over what is
occurring in increasingly more autonomous and heterogeneous foreign subsidiaries.11
The analysis then confirms that as geographic scope increases the informational complexity of
dealing with many heterogeneous countries, which requires a larger headquarters in the obligatory
functions, outweighs the reduction in headquarters size that accompanies an increase in subsidiary
autonomy. As a result, as geographic scope increases, the overall size of corporate headquarter
controlled for other factors increases (Hypothesis 5), such that an MNC operating on three continents
will have 80% more headquarters personnel than one that operates only on one Continent.
There is a noticeable country effect on the size and roles of MNC headquarters which strongly
supports the notion that an organization’s administrative heritage has profound implications on its
formal structure (Hypothesis 6). The US has much larger corporate headquarters than European firms,
such that for a typical MNC operating on three Continents and employing 20,000, the US company
would have 255 staff in headquarters and the European firm only 124. This is not surprising given
Bartlett and Ghoshal’s description of the differences between European (multinational) and US
(international) MNC structures. Headquarters in a developing countryappear to be different again,
with a more focused set of functions but larger staffs in those functions than in developed countries.
We would like to draw normative conclusions from this analysis in order to develop prescriptions
for the design of MNC headquarters. However, attempts to relate performance to the sample firms
were difficult. Collis et al., in the larger sample, were only able to find a positive correlation between
performance and headquarters size – and could not determine the direction of causation (Collis et al.,
2007). In this smaller sample, and with the important variable of global scope to be included, it was hard
to find any relationship. We are therefore forced to acknowledge that the findings of the paper are
descriptive rather than prescriptive. Nevertheless, there does seem to be a compelling argument
emerging from the analysis that MNCs must reduce their degree of intervention in subsidiary operations
as they expand their scope. To compensate they can add small headquarters staffs in critical functional
areas, presumably as a conduit to provide some information on the activities of subsidiaries, or perhaps
to establish the basic global operating parameters for the entity – particularly around audit, HR, and IT.
One normative question this finding raises is whether it is only companies that are in businesses
that can be operated with minimal intervention by corporate headquarters that can truly go global, or
whether any company can continually expand its geographic scope simply by decreasing the extent of
influence from headquarters? Our data is not longitudinal so we cannot identify the underlying causal
relationship. What we can do is to examine the cross-sectional differences between domestic firms and
MNCs to determine if there are systematic differences that might suggest only certain industries were 11
It is possible that, as the size of companies increase, discrete units can be justified for a role that was previously
performed within another unit. The training and education activity, for example, might be occurring within the corporate
HR department in smaller, narrower geographic scope MNCs.
amenable to the “global” strategy (Table 5). This shows a significant difference between the industry
sectors of narrow and broad geographic scope firms. Domestic companies are disproportionately in the
retailing, consumer, and utilities sectors, while broad scope MNCs are disproportionately in
manufacturing, chemicals and pharmaceuticals (nearly half of three continent MNCs). These differences
are more likely to be explained by the underlying economics of the industries – substantial global
economies of scale in manufacturing, for example - than by limitations on the ability of global retailers,
for example, to cede centralized control. This would suggest that firms can adjust their organizational
design to accommodate increased global scope, particularly since MNCs in capital intensive industries
with “global” strategies are expected to be relatively centralized (Porter, 1986).
For policymakers, the implications appear to support a careful approach to acquisition by a foreign
MNC. The activities which take place at headquarters are different from, but complementary to those
occurring in the geographic subsidiaries. With the possible exception of R&D, it does not appear that
MNC headquarters substitute for local activities, rather they appear to continue to allow for local
adaptation in the operational activities conducted within the subsidiaries. Indeed, as their geographic
scope increases, MNC headquarters become less influential in operating decisions, and, although they
add some functions at headquarters, those are typically small. As a result, although the relocation of
headquarters to a different country would lead to the loss of jobs in those obligatory and some
distinctive value creating headquarters functions, they might be offset by an increase in local
operational jobs. Moreover, we did not examine the physical location of headquarters jobs (Birkinshaw
et al., 2006; Laamanen et al., 2012), and some of these could perhaps be left in the country even as they
report to the new headquarters location. Losing an MNC headquarters will, therefore, likely lead to the
loss of certain activities in that country that could justify the concern protectionist policy makers have
with regard to the nationality of ownership.
There are obvious limitations with this study. No Asian country was included in the sample. Given
the expected difference in the administrative heritage of MNCs from that Continent, it is unfortunate
not to be able to present such evidence. However, Japan was included in the original survey and while
that data did not discriminate between domestic firms and MNCs, given the sample covered Japan’s
largest corporations it is a reasonable assumption that the results hold for Japanese MNCs. Indeed, if we
acknowledge that there are no differences in the determinants of headquarters in domestic firms and
MNCs, we can argue that Japan does show its own form of headquarters. Specifically, Japanese firms
have the largest headquarters of any country in the sample – such that on average a Japanese firm
employing 20,000 would have 467 staff at headquarters (Collis et al., 2009). As with the difference
between US and European firms, the explanation for this larger size is the Japanese employment of
more intervention and influence on the activities of the businesses that requires a much higher
incidence of functions at headquarters and more staff in each function. This finding would provide more
support for the importance of a national administrative heritage – in this instance for the “global”
organizational design that Bartlett and Ghoshal identified as typical in Japanese firms (Bartlett and
Ghoshal, 1989).
The surveys were completed at the end of the last century and so cannot capture recent trends in
headquarters – subsidiary relationships. Updating the sample would be ideal and might suggest
whether the dramatic emergence of India and China has led to further devolution of decision-rights to
the subsidiaries in order to accommodate increased market heterogeneity.
The identity of the countries in which the MNC was active was not included in the survey. Instead
we relied on a simple measure of geographic scope in which the MNC was active. Given that the theory
of the MNC places great measure on the country specific advantages of the countries in which it is
active, this anonymity of location is a possible drawback. However, since we were focused exclusively
on the role of headquarters, it is not as problematic since variation among subsidiaries will be less
critical to its design. The possibility that an MNC’s domestic operations, as discrete from its corporate
headquarters, could be performing activities for foreign subsidiaries was not captured in the survey data
and is another possible limitation to the validity of the findings.
Lastly, it was not possible to design a survey instrument that directly captured the “international
strategy” being pursued by the sample MNCs, such as the difference between a “multi-domestic” and a
“global” MNC. Given the importance of strategy to the design of corporate headquarters – notably in
the difference revealed between related and unrelated diversifiers – and the acknowledged link
between strategy and structure in international business, this was a disappointment. Ideally, including a
strategic measure, perhaps as a combination of the share of international sales, the number of country
subsidiaries, and perhaps some product market positioning (e.g., Calori et al., 2000) would have
informed the analysis. Nevertheless, the use of policy choices that are correlated with overall strategy
provided an alternative to the use of a single strategy construct.
6. Conclusion
In spite of these shortcomings, which leaves plenty of scope for additional research, the paper does
reach some important conclusions from the first large scale empirical analysis of MNC headquarters.
Notable among those findings is that MNC headquarters are primarily involved with so-called
“obligatory” functions and some value creating and control functions, but much less so with operational
activities. Nevertheless, a single, although wide-ranging, set of factors determine the size of
headquarters in both MNCs and domestic firms. This suggests that the underlying theoretical
frameworks which shape our understanding of corporate design and from which those relationships are
derived are applicable to any multimarket organization, whether multi-product or multi-country. MNC
headquarters do however alter as the scope and heterogeneity of their global market presence
expands. In order to accommodate the need for local responsiveness across increasingly diverse
markets, MNCs decrease their influence over operating units. This policy choice reduces the size of their
headquarters. However, the variety and complexity of managing their international presence requires
proportionately larger staffs for the obligatory tasks and small additional, perhaps informational,
discretionary functions. The net effect is that the size of MNC corporate headquarters actually increases
as their geographic scope expands. Lastly, there are economically significant differences in the
headquarters of MNCs from different regions that provide support for the notion of a country’s
administrative heritage as an important determinant of MNC organizational design.

References Albert, M., 1993. Capitalism against Capitalism. Whurr, London, UK.
Alcacer, J., Chung, W., 2002. Knowledge Seeking and Location Choice of Foreign Direct Investment in the
United States. Management Science 48 (12), 1534-1554.
Ambos, T., Andersson, U., Birkinshaw, J., 2010. What are the Consequences of Initiative-Taking in
Multinational Subsidiaries? Journal of International Business Studies 41, 1009-1118.
Andersson, U., Forsgren, M., Holm, U. 2007. Balancing Subsidiary Influence in the Federative MNC: A
Business Network View. Journal of International Business Studies 38 (4), 802-818.
Aral, S., Brynjolfsson, E., Wu, D., 2006. Which Came First, IT or Productivity? Virtuous Cycle of Investment
and Use in Enterprise Systems. Available at SSRN: http://ssrn.com/abstract=942291.
Baiman, S., Larcker, D., Rajan, M., 1995. Organizational Design for Business Units. Journal of Accounting
Research 33, 205-229.
Bandick, R., Gorg, H., Karpaty, P., 2010. Foreign Acquisitions, Domestic Multinationals, and R&D Discussion
Paper #5252 IZA. Institute for the Study of Labor. Bonn, Germany.
Bartlett, C., 1983. Get Off the Reorganization Merry-go-Round. Harvard Business Review 61 (2), 138-146.
Bartlett C., Ghoshal S., 1986. Tap Your Subsidiaries for Global Reach. Harvard Business Review 64 (6), 87-94.
Bartlett C., Ghoshal S., 1989. Managing Across Borders: The Transnational Solution. Harvard Business School
Press, Boston, MA.
Benito, G., Lunnan, R., Tomassen S., 2011. Distant Encounters of the Third Kind: Multinational Companies
Locating Divisional Headquarters Abroad. Journal of Management Studies 48 (2), 373–394.
Birkinshaw, J., Hood, N. (Eds.), 1998. Multinational Corporate Evolution and Subsidiary Development.
Macmillan, London, UK.
Birkinshaw, J., Hood, N., Jonsson, S., 1998. Building Firm-Specific Advantages in Multinational Corporations:
The Role of Subsidiary Initiative. Strategic Management Journal 19, 221-241.
Birkinshaw, J., Ghoshal, S., Markides, C., Stopford, J., Yip G. (Eds.), 2003. Future of the Multinational
Company. Wiley, NY.
Birkinshaw, J., Braunerhjelm, P., Holm, U., Terjesen, S., 2006. Why do some Multinational Corporations
Relocate their Headquarters Overseas? Strategic Management Journal 27, 681-700.
Bloom, N., Sadun, R., Van Reenen, J., Forthcoming. Americans Do I.T. Better: U.S. Multinationals and the
Productivity Miracle. American Economic Review.
Calori, R., Atamer, T., Nunes, P., 2000. The Dynamics of International Competition Sage: London, UK.
Cantwell, J., Mudambi, R., 2005. MNE Competence-Creating Subsidiary Mandates. Strategic Management
Journal 26 (12), 1109-1128.
Chandler, A., 1962. Strategy and Structure: Chapters in the History of the American Industrial Enterprise.
MIT Press, Cambridge, MA.
Chandler, A., 1991. The Functions of the HQ Unit in the Multibusiness Firm. Strategic Management Journal.
Winter Special Issue 12, 31-50.
Ciabushci, F., Forsgren, M., Martin, O., 2012. Headquarters Involvement and Efficiency of Innovation
Development and Transfer in Multinationals: A Matter of Sheer Ignorance? International Business Review
21, 130-144.
Collis, D., 1991. A Resource Based Analysis of Global Competition: The Case of the Bearings Industry.
Strategic Management Journal 12, 49-68.
Collis, D., Young, D., Goold, M., 2007. The Size, Structure, and Performance of Corporate Headquarters.
Strategic Management Journal 28, 383-407.
Collis, D., Young, D., Goold, M., 2009. International Differences in the Size and Roles of Corporate
Headquarters: An Empirical Examination. Working Paper #10-044. Harvard Business School, Boston, MA.
Dellestrand, H., Kappen, P., 2011. Headquarters Allocation of Resources to Innovation Transfer Projects
within the Multinational Enterprise. Journal of International Management 17, 263-277.
Doz, Y., Prahalad, C., 1981. Headquarter Influence and Strategic Control in MNCs. Sloan Management
Review 23 (1), 15-29.
Dunning, J., 1998. Location and the Multinational Enterprise: A Neglected Factor. Journal of International
Business Studies 29, 45-66.
Egelhoff, W., 1988. Organizing the Multinational Enterprise: An Information Processing Perspective.
Ballinger, Cambridge, MA.
Eisenhardt, K., 1985. Control: Organizational and Economical Approaches. Management Science 31, 134-
149.
Enright, M., 2005. The Roles of Regional Management Centers. Management International Review Special
Issue, 81-100.
Erman, B., 2010. Ad Hoc Takeover Rulings only Bruise Canada’s Reputation, Globe and Mail 11/3/10
accessed at http://m.theglobeandmail.com/globe-investor/investment-ideas/streetwise/ad-hoc-takeover-
rulings-only-bruise-canadas-reputation/article1784893/?service=mobile.

Forsgren, M., Holm, U., Johanson, J., 2005. Managing the Embedded Mulitnational: A Business Network
View. Edward Elgar, Cheltenham, UK.
Foss, N., 1997. On the Rationales of Corporate Headquarters. Industrial and Corporate Change 6 (2), 313-
338.
Frost, T., Birkinshaw, J., Ensign, P., 2002. Centers of Excellence in Multinational Corporations. Strategic
Management Journal 23, 997-1018.
Galbraith, J. 2000. Designing the Global Corporation. Jossey-Bass, San Francisco, CA.
Garnaut, R., 2002. Australia as a Branch Office Economy. Australian Journal of Agricultural and Resource
Economics 46 (3), 447-461.
Ghemawat, P., 2007. Redefining Global Strategy: Crossing Borders in a World Where Differences Still
Matter. Harvard Business School Press, Boston, MA.
Ghemawat, P., 2011. World 3.0. Harvard Business School Press, Boston, MA.
Goold, M., Campbell, A., 1987. Strategies and Styles: The Role of the Centre in Managing Diversified
Corporations. Blackwell, Oxford, UK.
Goold, M., Campbell, A., Alexander, M., 1994. Corporate-Level Strategy: Creating Value in the Multibusiness
Company. Wiley, NY.
Hewett, K., Roth, M., Roth, K., 2003. Conditions Influencing Headquarters and Foreign Subsidiary Roles in
Marketing Activities and Their Effects on Performance. Journal of International Business Studies. 34, 567-
585.
Hill, C., Hitt, M., Hoskisson, R. 1992. Cooperative versus Competitive Structures in Related and Unrelated
Diversified Firms. Organization Science 3, 501-521.
Holm, U., Pedersen, T., 2000. The Centres of Excellence Project – Methods and some Empirical Findings, in:
Holm, U. and Pdersen, T. (Eds.), The Emergence and Impact of MNC Centers of Excellence: A Subsidiary
Perspective. Macmillan, London, UK, pp. 23-39.
Jensen, N., 2006. Nation-States and the Multinational Corporation: Apolitical Economy of Foreign
Investment. Princeton University Press, Princeton, NJ.
Jensen, M., Meckling, W., 1976. Theory of the Firm: Managerial Behavior, Agency Costs, and Ownership
Structure. Journal of Financial Economics 3, 305-360.
Laamanen, T., Simula T., Torstila, S., 2012. Cross-border Relocations of Corporate Headquarters in Europe.
Journal of International Business Studies 43 (2), 187–210.
Luo, Y., 2003. Market-Seeking MNEs in an Emerging Market: How Parent- Subsidiary Links Shape Overseas
Success. Journal of International Business Studies 34, 290-309.
Markides, C., 2002. Corporate Strategy: The Role of the Centre, in: Pettigrew, A., Thomas, H., Whittington,
R. (Eds.), Handbook of Strategy and Management, Sage, London, UK, pp. 98-112.
Markides, C., Williamson, P., 1996. Corporate Diversification and Organisational Structure: A Resource
Based View. Academy of Management Journal 39, 340-367.
O’Donnell, S., 2000. Managing Foreign Subsidiaries: Agents of Headquarters or an Interdependent Network?
Strategic Management Journal 21, 525-548.
Paterson, S., Brock, D., 2002. The Development of Subsidiary- Management Research: Review and
Theoretical Analysis. International Business Review 11, 139-163.
Porter, M., 1986. Competition in Global Industries: A Conceptual Framework, in: Porter, M. (Ed.),
Competition in Global Industries, Harvard Business School Press, Boston, MA.
Prahalad, C., 1975.The Strategic Process in a Multinational Corporation. Dissertation. Harvard Graduate
School of Business Administration, Boston, MA.
Reich, R., 1990. Who is Us? Harvard Business Review 90 (1), 53-64.
Rosenfeld, I., 2009. Inside the Kraft Foods Transformation. Strategy + Business 56. Accessed at
www.strategy-business.com/article/09307?rssid=consumer_products&gko=399b2&utum_source=feed on
12/2/10.
Rugman, A., Verbeke, A., 2001. Subsidiary-Specific Advantages in Multinational Enterprises. Strategic
Management Journal 22, 237-250.
Rugman, A., Verbeke, A., 2005. Analysis of Multinational Strategic Management. Ed. Elgar, Cheltenham, UK.
Teece, D., 1985. Multinational Enterprise, Internal Governance, and Industrial Organization. American
Economic Review 75 (2), 233-238.
Tomassen, S., Benito, G., Lunnan, R., 2012. Governance Costs in Foreign Direct Investments: A MNC
Headquarters Challenge. Journal of International Management (forthcoming).
Wernerfelt, B., 1984. A Resource-Based View of the Firm. Strategic Management Journal 5 (2), 171-180.
World Bank, 2010. Global Economic Prospects: Fiscal Headwinds and Recovery. World Bank, Washington.
Young, D., Goold, M., 1993. Effective Headquarters Staff: A Guide to the Size, Structure and Role of
Corporate Headquarters Staff in the UK. Ashridge Strategic Management Centre, London, UK.
Young, S., Tavares, A., 2004. Centralisation and Autonomy: Back to the Future. International Business
Review 13, 215-237.

Fig. 1. Headquarters staff by region.
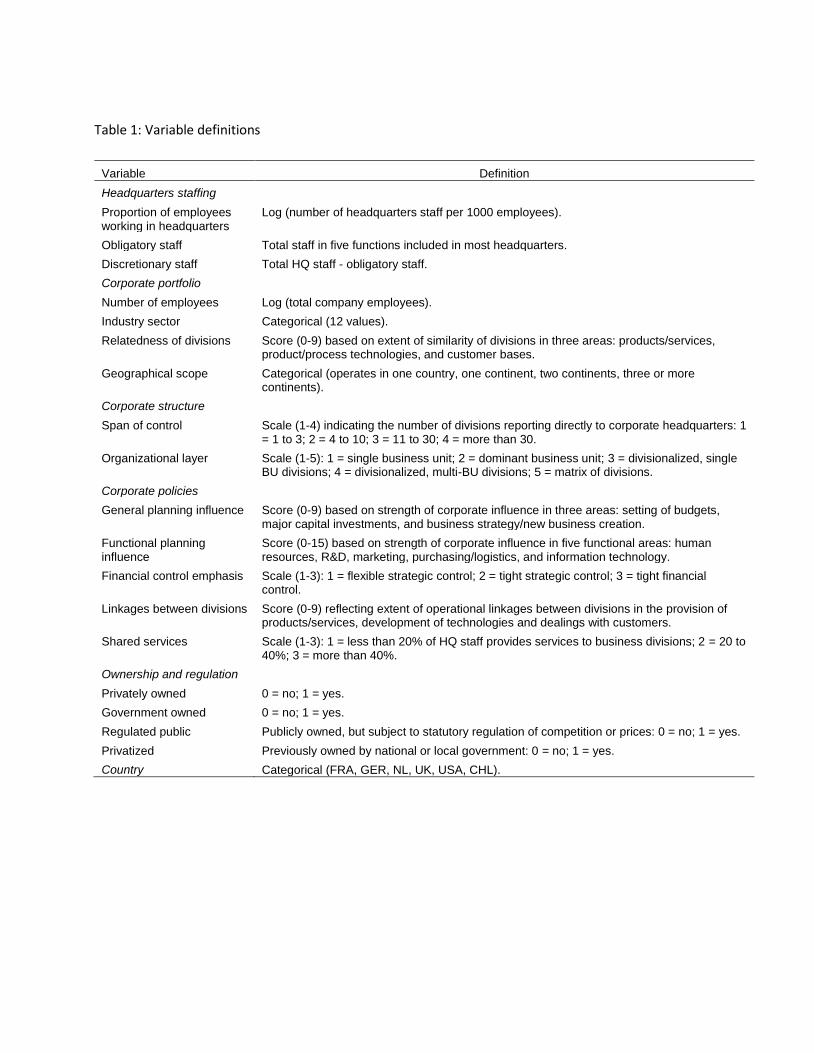
Table 1: Variable definitions
Variable Definition
Headquarters staffing
Proportion of employees working in headquarters
Log (number of headquarters staff per 1000 employees).
Obligatory staff Total staff in five functions included in most headquarters.
Discretionary staff Total HQ staff - obligatory staff.
Corporate portfolio
Number of employees Log (total company employees).
Industry sector Categorical (12 values).
Relatedness of divisions Score (0-9) based on extent of similarity of divisions in three areas: products/services, product/process technologies, and customer bases.
Geographical scope Categorical (operates in one country, one continent, two continents, three or more continents).
Corporate structure
Span of control Scale (1-4) indicating the number of divisions reporting directly to corporate headquarters: 1 = 1 to 3; 2 = 4 to 10; 3 = 11 to 30; 4 = more than 30.
Organizational layer Scale (1-5): 1 = single business unit; 2 = dominant business unit; 3 = divisionalized, single BU divisions; 4 = divisionalized, multi-BU divisions; 5 = matrix of divisions.
Corporate policies
General planning influence Score (0-9) based on strength of corporate influence in three areas: setting of budgets, major capital investments, and business strategy/new business creation.
Functional planning influence
Score (0-15) based on strength of corporate influence in five functional areas: human resources, R&D, marketing, purchasing/logistics, and information technology.
Financial control emphasis Scale (1-3): 1 = flexible strategic control; 2 = tight strategic control; 3 = tight financial control.
Linkages between divisions Score (0-9) reflecting extent of operational linkages between divisions in the provision of products/services, development of technologies and dealings with customers.
Shared services Scale (1-3): 1 = less than 20% of HQ staff provides services to business divisions; 2 = 20 to 40%; 3 = more than 40%.
Ownership and regulation
Privately owned 0 = no; 1 = yes.
Government owned 0 = no; 1 = yes.
Regulated public Publicly owned, but subject to statutory regulation of competition or prices: 0 = no; 1 = yes.
Privatized Previously owned by national or local government: 0 = no; 1 = yes.
Country Categorical (FRA, GER, NL, UK, USA, CHL).

Table 2: Size of headquarters staff by geographic scope
Geographic scope Domestic All MNCs
One
continent Two
continents
Three or more
continents
Total HQ staff
N 107 244 64 39 141
Median number of staff 176 122 54 70 210 Median staff per 1000 employees 18.4 8.3
10.5 5.9 9.9
Obligatory HQ staff
N 74 190 50 33 107
Median number of staff 36 35 22 28 62 Median staff per 1000 employees 4.7 3.0
3.3 2.5 3.1
Discretionary HQ staff
N 74 190 50 33 107
Median number of staff 94 62 38 40 92 Median staff per 1000 employees 10.2 5.1
5.4 2.7 5.9

Table 3: Incidence of functions at headquarters
Percentage of companies reporting function at headquarters
Function One
country All
MNCsa
One
continent Two
continents
Three or more
continentsb
General corporate management 98% 94% 94% 100% 92%
Legal & company secretary 93% 96% 92% 100% 96%
Treasury 95% 95% 94% 100% 95%
Taxation 91% 92% 81% 97% 96%***
Financial reporting & control 94% 97% 95% 92% 99%
Internal audit 85% 82% 78% 63% 89%***
Pensions/payroll/benefits administration 82% 75% 59% 79% 81%**
Human resources/career development 83% 82% 69% 82% 89%**
Training & education 65% 58% 48% 50% 64%
Government & public relations 87% 83% 75% 84% 87%
Corporate planning/development 90% 85% 77% 84% 90%*
Information systems/telecommunications 75% 72% 58% 66% 81%**
Research & development 50% 33%** 34% 16% 38%*
Marketing/commercial services 57% 37%*** 42% 29% 36%
Purchasing/inbound logistics 60% 42%** 38% 37% 46%
Distribution/outbound logistics 33% 16%*** 27% 5% 15%**
Other 88% 88% 78% 87% 93%
N 103 238
64 38 136
Notes:
Significance: Chi squared for difference between a) one country and all MNCs b) across MNC scope p<.05 *, p<.01**, p<.001 ***.

Table 4: Size of functions at headquarters
Median number of staff per 1000 employees
Function One
country All
MNCsa
One continent
Two continents
Three or more
continentsb
General corporate management 0.80 0.52* 0.80 0.53 0.46**
Legal & company secretary 1.00 0.56* 0.50 0.48 0.71
Treasury 0.86 0.39** 0.50 0.27 0.39*
Taxation 0.49 0.31** 0.25 0.23 0.32
Financial reporting & control 0.95 0.81 0.85 0.81 0.79
Obligatory functions 4.66 3.00
3.29 2.54 3.14
Internal audit 0.91 0.39** 0.50 0.27 0.40*
Pensions/payroll/benefits administration 1.34 0.58** 1.11 0.61 0.54*
Human resources/career development 0.95 0.49*** 0.67 0.33 0.46
Training & education 0.61 0.22*** 0.33 0.15 0.20
Government & public relations 0.75 0.33** 0.26 0.22 0.36
Corporate planning/development 0.48 0.34*** 0.50 0.26 0.34* Information systems/ telecommunications 3.40 0.79***
1.77 0.26 0.71
Research & development 2.00 1.02 0.49 0.76 (4) 3.33
Marketing/commercial services 2.00 0.54** 1.09 0.35 (9) 0.51
Purchasing/inbound logistics 2.00 0.79 1.41 0.93 0.64
Distribution/outbound logistics 2.15 1.12 2.26 - 0.36
Other 3.33 1.29*** 1.47 1.11 1.53
Discretionary functions 10.22 5.09
5.44 2.73 5.89 Notes:
Medians calculated for those companies reporting staff in the function. Not estimated for two companies or fewer. N varies from function to function. N shown for fewer than ten companies.
Significance: F test applied to one-way Anova of Log (function staff per 1000 employees) for a) one country versus all MNCs b) across MNC scope p<.05 *, p<.01 **, p<.001 ***.
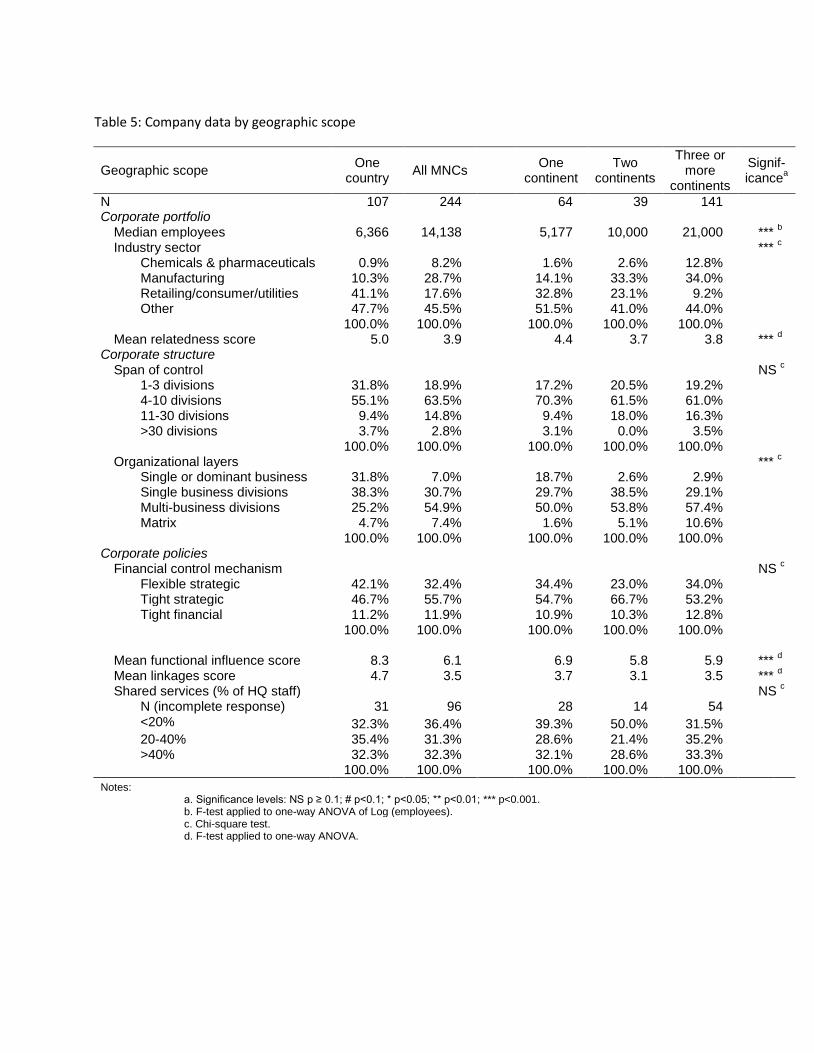
Table 5: Company data by geographic scope
Geographic scope One
country All MNCs
One
continent Two
continents
Three or more
continents
Signif-icance
a
N 107 244 64 39 141 Corporate portfolio
Median employees 6,366 14,138 5,177 10,000 21,000 *** b
Industry sector *** c
Chemicals & pharmaceuticals 0.9% 8.2% 1.6% 2.6% 12.8% Manufacturing 10.3% 28.7% 14.1% 33.3% 34.0% Retailing/consumer/utilities 41.1% 17.6% 32.8% 23.1% 9.2% Other 47.7% 45.5% 51.5% 41.0% 44.0% 100.0% 100.0% 100.0% 100.0% 100.0%
Mean relatedness score 5.0 3.9 4.4 3.7 3.8 *** d
Corporate structure Span of control NS
c
1-3 divisions 31.8% 18.9% 17.2% 20.5% 19.2% 4-10 divisions 55.1% 63.5% 70.3% 61.5% 61.0% 11-30 divisions 9.4% 14.8% 9.4% 18.0% 16.3% >30 divisions 3.7% 2.8% 3.1% 0.0% 3.5%
100.0% 100.0% 100.0% 100.0% 100.0% Organizational layers ***
c
Single or dominant business 31.8% 7.0% 18.7% 2.6% 2.9% Single business divisions 38.3% 30.7% 29.7% 38.5% 29.1% Multi-business divisions 25.2% 54.9% 50.0% 53.8% 57.4% Matrix 4.7% 7.4% 1.6% 5.1% 10.6%
100.0% 100.0% 100.0% 100.0% 100.0% Corporate policies
Financial control mechanism NS c
Flexible strategic 42.1% 32.4% 34.4% 23.0% 34.0% Tight strategic 46.7% 55.7% 54.7% 66.7% 53.2% Tight financial 11.2% 11.9% 10.9% 10.3% 12.8% 100.0% 100.0% 100.0% 100.0% 100.0%
Mean functional influence score 8.3 6.1 6.9 5.8 5.9 ***
d
Mean linkages score 4.7 3.5 3.7 3.1 3.5 *** d
Shared services (% of HQ staff) NS c
N (incomplete response) 31 96 28 14 54 <20% 32.3% 36.4% 39.3% 50.0% 31.5% 20-40% 35.4% 31.3% 28.6% 21.4% 35.2% >40% 32.3% 32.3% 32.1% 28.6% 33.3% 100.0% 100.0% 100.0% 100.0% 100.0%
Notes: a. Significance levels: NS p ≥ 0.1; # p<0.1; * p<0.05; ** p<0.01; *** p<0.001. b. F-test applied to one-way ANOVA of Log (employees). c. Chi-square test. d. F-test applied to one-way ANOVA.

Table 6: Determinants of the size of MNC headquarters
Log(HQ staff per 1000 employees) - Analysis of variance (Type III sums of squares)
HQ1
HQ2
HQ3
Corporate portfolio
Number of employees 7.841 - ***
6.993 - ***
7.980 - ***
Industry sector 4.995
**
5.037
**
4.927
***
Relatedness 0.334 +
0.350 +
0.010 - Geographic scope 1.717 + **
2.183 + **
1.914 + **
Corporate structure Span of control
0.049 +
0.008 + Organizational layers
1.423 - **
0.509 - #
Corporate policies General influence
0.288 - Functional influence
3.234 + ***
Financial control
0.318 + Linkages
0.119 +
Shared services
1.756 + ***
Services data missing
1.181 + **
Ownership & regulation Privately owned 0.432 +
0.406 +
0.059 +
Government owned 3.773 + ***
3.667 + ***
2.047 + ***
Regulated public 0.138 -
0.111 -
0.226 - Privatized 1.243 + **
1.403 + **
0.842 + *
Country 9.448
***
8.422
***
5.777
***
Shared variance 4.181
5.517
11.350
Corrected model 34.103
***
35.561
***
42.547
***
Residual 39.257
37.799
30.813
Corrected total 73.360
73.360
73.360
RMS residual 0.423
0.417
0.382 R squared 0.465
0.485
0.580
Adjusted R squared 0.406
0.423
0.516 N 244
244
244
+ and - indicate the sign of the regression coefficient for quantitative variables.
Significance levels: # p<0.1; * p<0.05; ** p<0.01; *** p<0.001.

Table 7: Relative size of corporate headquarters and geographic scope
Geographic scope N
Relative number of headquarters staff - controlled for:
All variables except
corporate structure and
policies (HQ1)
All variables except corporate
policies (HQ2)
All variables (HQ3)
Primarily in one country 107 x1.48 x1.34 x1.21
In a number of countries on one continent 64 x1.00 x1.00 x1.00
Primarily on two continents 39 x1.02 x1.13 x1.13
Three or more continents 141 x1.68 x1.91 x1.82
Significance 351 p<0.05 p<0.01 p<0.01
Table 8: Incidence of functions at MNC headquarters by region
Function Europe USA Chile All
General corporate management 93% 92% 100% 94%
Legal & company secretary 96% 100% 86% 96%
Treasury 93% 100% 100% 95%
Taxation 95% 94% 71% 92%
Financial reporting & control 99% 91% 90% 97%
Internal audit 81% 92% 62% 82%
Pensions/payroll/benefits administration 74% 94% 33% 75%
Human resources/career development 85% 87% 48% 82%
Training & education 55% 79% 19% 58%
Government & public relations 85% 87% 62% 83%
Corporate planning/development 85% 94% 67% 85% Research & development 28% 42% 52% 33%
Marketing/commercial services 31% 57% 29% 37%
Purchasing/inbound logistics 33% 75% 29% 42%
Distribution/outbound logistics 7% 40% 29% 16% Information systems & telecommunications 68% 96% 43% 72%
Other 88% 100% 57% 88%
N 164 53 21 238
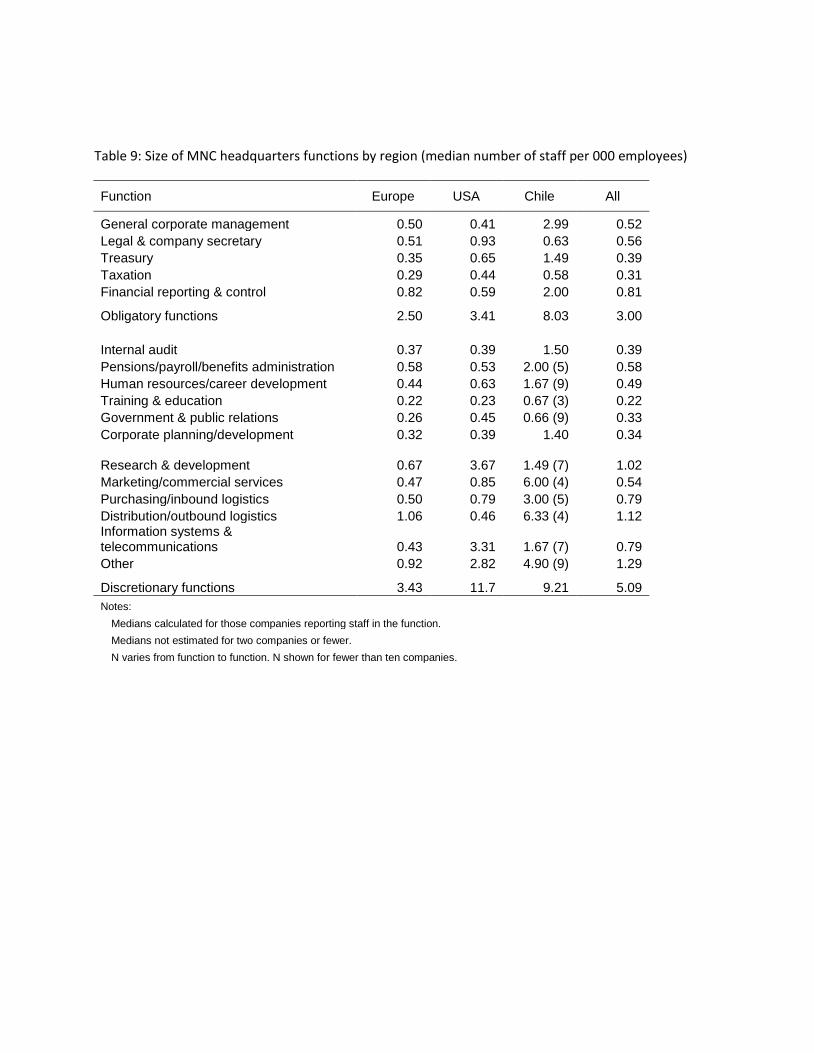
Table 9: Size of MNC headquarters functions by region (median number of staff per 000 employees)
Function Europe USA Chile All
General corporate management 0.50 0.41 2.99 0.52
Legal & company secretary 0.51 0.93 0.63 0.56
Treasury 0.35 0.65 1.49 0.39
Taxation 0.29 0.44 0.58 0.31
Financial reporting & control 0.82 0.59 2.00 0.81
Obligatory functions 2.50 3.41 8.03 3.00
Internal audit 0.37 0.39 1.50 0.39
Pensions/payroll/benefits administration 0.58 0.53 2.00 (5) 0.58
Human resources/career development 0.44 0.63 1.67 (9) 0.49
Training & education 0.22 0.23 0.67 (3) 0.22
Government & public relations 0.26 0.45 0.66 (9) 0.33
Corporate planning/development 0.32 0.39 1.40 0.34 Research & development 0.67 3.67 1.49 (7) 1.02
Marketing/commercial services 0.47 0.85 6.00 (4) 0.54
Purchasing/inbound logistics 0.50 0.79 3.00 (5) 0.79
Distribution/outbound logistics 1.06 0.46 6.33 (4) 1.12 Information systems & telecommunications 0.43 3.31 1.67 (7) 0.79
Other 0.92 2.82 4.90 (9) 1.29
Discretionary functions 3.43 11.7 9.21 5.09
Notes:
Medians calculated for those companies reporting staff in the function.
Medians not estimated for two companies or fewer.
N varies from function to function. N shown for fewer than ten companies.