bms college of engineering department of civil engineering ...coeut.iitm.ac.in/umcsp/pdfweb/1b5ppt...
TRANSCRIPT

BMS College of Engineering
Department of Civil Engineering
Bangalore – 560019
COMPREHENSIVE TRANSPORTATION PLANNING FOR
SELECTED ZONES IN BANGALORE CITY
Principal Investigator : Dr. H .S. Jagadeesh
Professor
Co-Investigator : Shri. H. S. Sathish
Selection Grade Lecturer

Project :Comprehensive Transportation
Planning for Selected Zones in Bangalore City
Objectives of the Project:
a) To collect and review information on development of GIS based Transport
Planning.
b) To develop GIS database of urban transportation system.
c) To develop database with details collected and collated from different
agencies.
d) To develop Multiple Parameter Model for various travel demand dimensions
which would account for Demographic and Socio-Economic Factors.
e) To study the modal choice of the people including the Metro Rail and other
existing public transit modes.
f) To Calibrate and validate Transport planning model for the selected wards.
g) To develop Economic and Financial Analysis.

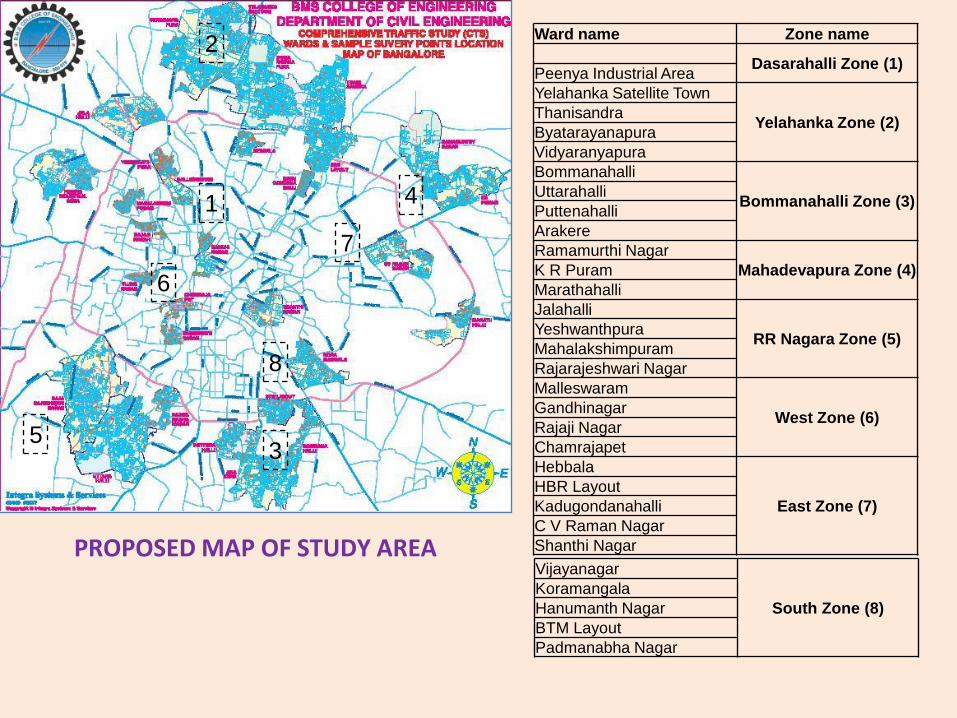
Project Area Details
For this study, 30 newly added wards (Bruhut Bengaluru Mahanagara
Palike) have been considered:
• Average Population of each ward :30000
• Sample size : 1.5%
• Type of Survey : House hold Survey
• No. of sample Collected : 3450
1
2
35
6
4
7
8
PROPOSED MAP OF STUDY AREA
Ward name Zone name
Dasarahalli Zone (1)Peenya Industrial Area
Yelahanka Satellite Town
Yelahanka Zone (2)Thanisandra
Byatarayanapura
Vidyaranyapura
Bommanahalli
Bommanahalli Zone (3)Uttarahalli
Puttenahalli
Arakere
Ramamurthi Nagar
Mahadevapura Zone (4)K R Puram
Marathahalli
Jalahalli
RR Nagara Zone (5)Yeshwanthpura
Mahalakshimpuram
Rajarajeshwari Nagar
Malleswaram
West Zone (6)Gandhinagar
Rajaji Nagar
Chamrajapet
Hebbala
East Zone (7)
HBR Layout
Kadugondanahalli
C V Raman Nagar
Shanthi Nagar
Vijayanagar
South Zone (8)
Koramangala
Hanumanth Nagar
BTM Layout
Padmanabha Nagar

BANGALORE MAP DIGITIZED IN AUTOCAD

WARD
WO
RK
EDU
CA
TIO
N
BU
SIN
ESS
SHO
PPIN
G
SOC
IAL
REC
REA
TIO
N
HO
SPIT
AL
OTH
ER
PUR
POSE
S
RET
UR
N H
OM
E
Arakere 166 65 22 95 0 0 4 1 0
Bommanahalli 171 45 27 82 0 0 1 0 0
BTM 149 48 41 97 4 0 3 1 0
Byatarayanapura 134 43 24 83 0 0 4 16 0
Chamrajpet 137 61 44 130 5 0 16 3 1
CV raman nagar 158 48 14 90 1 0 4 3 0
Gandhinagar 126 88 42 97 0 10 3 1 0
Hanumanth nagar 133 63 38 123 0 0 11 2 0
HBR Layout 176 25 13 67 5 0 5 3 0
Hebbal 133 55 17 88 0 0 4 25 1
Jalahalli 141 78 34 92 4 1 4 0 0
Kadugondanahalli 119 37 84 72 0 0 4 52 1
Koramangala 153 26 11 95 3 0 6 3 0
KR Puram 135 40 26 96 0 0 22 15 0
Mahalaxmipuram 122 27 46 101 9 0 15 2 0
Malleswaram 95 99 55 77 11 12 6 0 0
Marathalli 150 47 21 103 2 0 18 0 0
Padmanabhanagar 132 55 41 136 8 0 7 0 0
Peenya 145 75 17 113 1 3 3 0 0
Puttenhalli 199 55 7 71 0 0 22 5 0
Rajajinagar 144 72 24 100 8 7 10 2 0
Rajarajeshwari nagar 143 86 29 92 2 15 9 1 0
Ramamurthy nagar 161 36 8 93 0 0 14 6 0
Shantinagar 140 78 26 77 2 9 8 2 0
Thanisandra 124 26 36 79 2 1 4 18 0
Uttarahalli 220 51 18 93 4 1 18 2 0
Vidyaranyapura 144 65 30 129 3 0 7 3 0
Vijaynagar 145 86 15 70 1 34 3 0 0
Yelahanka 143 42 12 79 3 0 3 9 0
Yeshwantpur 122 62 38 115 2 10 15 0 0
TOTAL 4051 1684 860 2835 80 101 252 175 3
Ward Wise Trip Sheet

1. Trip Distribution for Selected zones in Bangalore using
Fratar Method
2. Work Trip Distribution by Gravity Model
3. Studies on Adequacy of Sampling for Urban Transport
Planning - A Case Study of Bangalore
Sub Projects Till Date
Using the survey data, socio economic details and
previous day travel details, following sub projects
have been completed:

Outcome of Work
• This study is concluded with O-D table is successively corrected and
balanced in 2nd iteration.
• Present 454 trips for the year 2011 obtained from house hold
interview survey has been projected as 499 trips for the year 2021 for
1.5% sample size considered.
• Fratar method is applicable for a moderate growth rate of 1.1 to
1.50.
Trip Distribution for Bangalore Roads using
Fratar Method

Work Trip Distribution by Gravity Model
Objectives :
1. To identify the travel pattern of the residents of study area.
2. To study the pattern of work based trips considering the travel
time, distance and travel cost.
3. To develop Friction factors and socio economic adjustment
factors.
4. To develop a gravity model for distributing the trips between
the zones.

• The analysis of work based trips by mode of travel indicate that
majority of work trips are performed by two wheeler followed by bus.
The cost of travel for work trips ranges from Rs 500-2000 per month.
• The analysis of work based trips by length of travel indicates that the
majority of the people travel 5 to 10 km every day to perform work trips.
• The travel time was replaced by friction factor assuming low
impedance value as the base value.
• After the third iteration, it was found that a satisfactory agreement was
reached between the desired and actual attraction figures. Balancing
procedure yielded improved Gravity model prediction on a cell by cell
basis.
Outcome of Project
Work Trip Distribution by Gravity Model

Objectives :
• To determine the statistics of sampling and to establish the confidence
levels for the attributes size of the family, per capita income, distance
travelled, travel time and travel cost respectively.
• The histograms, frequency distribution curves and Ogive curves are
plotted and statistical parameters are determined for the various
attributes. Also the coefficient of skewness and kurtosis are
determined for the various attributes.
Studies on Adequacy of Sampling for Urban
Transport Planning - A Case Study of
Bangalore.

• The data obtained from House Hold Interview was stratified in the
range of 0-15%, 10-25% and 100%.
• The total number of households interviewed was 3450 and the
stratification was made into three divisions as 450 households, 875
households and 3450 households respectively.
• The percentage of stratified data works out to be 13% for 450
households, 21.37% for 750 households and 100% for 3450
households.
• The statistical parameters considered for analysis are Mean,
Standard Deviation and Coefficient of variation.
Studies on Adequacy of Sampling for Urban
Transport Planning - A Case Study of
Bangalore.

• From the statistical parameters analyzed it can be concluded that asthe sample size increases, the standard deviation for the size of thefamily as attribute increases. This indicates that as the sample sizeincreases the scatter also increases for this attribute.
• The attribute per capita income has a gradual reduction of coefficientof variation with increase in sample size which indicates higherreliability at large sample size is obtained for this attribute.
• The standard error of estimate (e) at 95% confidence level has adecreasing trend with the increase in sample size for all the attributesconsidered.
Conclusions Drawn
Studies on Adequacy of Sampling for Urban
Transport Planning - A Case Study of
Bangalore.

• From the histograms of various attributes for stratified data, it can be
concluded that the attributes per capita income and distance travelled
show a normal tendency with symmetrical behavior where as the
remaining attributes size of the family, travel time and travel cost are
skewed to the right.
• The coefficient of skewness is negative for the attributes per capita
income and travel cost for lower sample size.
• As the sample size increases the negative skewness disappears
exhibiting positive trend.
• Similarly the coefficient of kurtosis is negative and it exhibits positive
kurtosis as sample size increases.
Conclusions Drawn
Studies on Adequacy of Sampling for Urban
Transport Planning - A Case Study of
Bangalore.
