blood pressure and blood flow - … e non-e blood pressure blood flow palpatory method (riva-rocci...
TRANSCRIPT
Blood Pressure and Blood Flow

In 1714, Stephen Hales opened an artery of a horse, inserted a brass tube, and measured the pressure of the blood. This was a careful, scientific experiment had two outcomes
1. The heart exerts pressure in order to pump blood;
2. However, another result of the experiment was the horse's death.
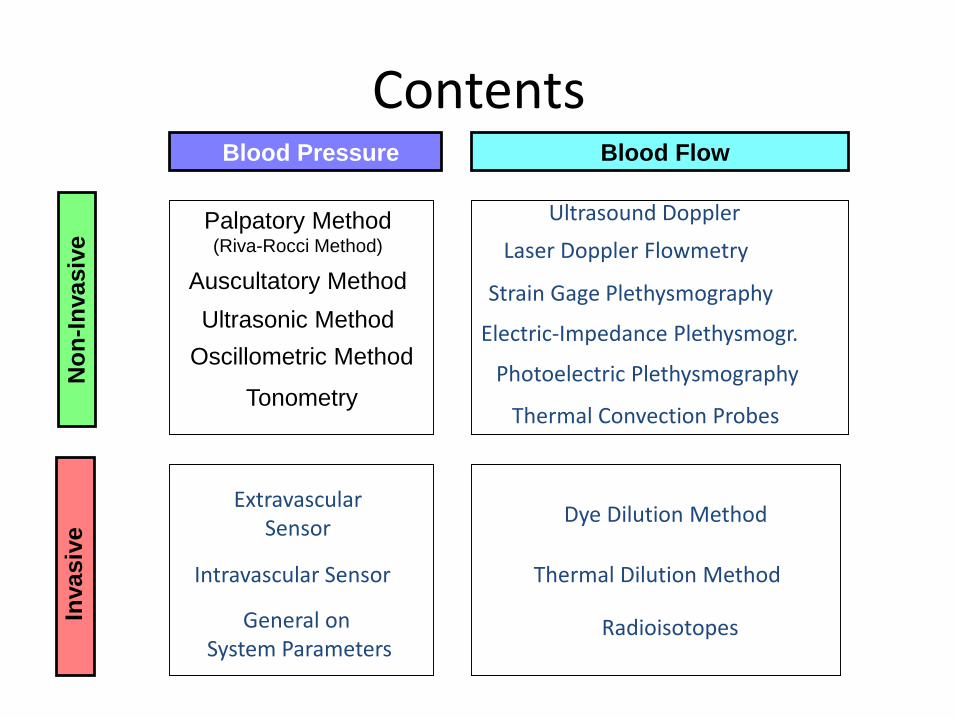
ContentsIn
vasiv
eN
on
-In
vasiv
e
Blood Pressure Blood Flow
Palpatory Method(Riva-Rocci Method)
Auscultatory Method
Ultrasonic Method
Oscillometric Method
Tonometry
Extravascular Sensor
Intravascular Sensor
Ultrasound Doppler
Laser Doppler Flowmetry
Dye Dilution Method
Thermal Dilution Method
Strain Gage Plethysmography
Electric-Impedance Plethysmogr.
Photoelectric Plethysmography
Radioisotopes
Thermal Convection Probes
General on System Parameters
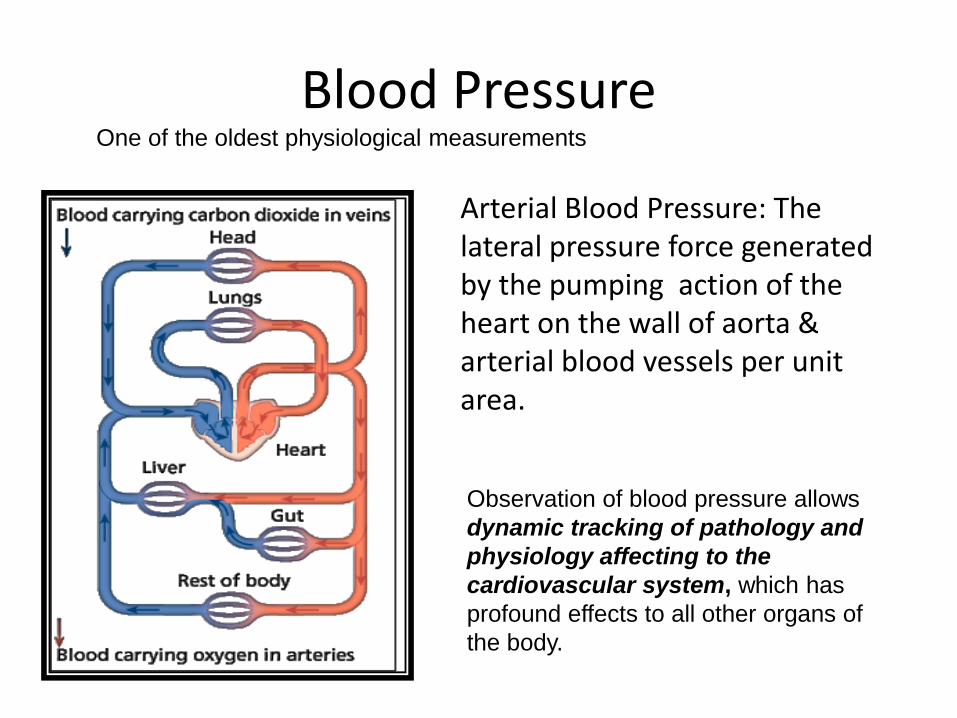
Blood PressureOne of the oldest physiological measurements
Observation of blood pressure allows
dynamic tracking of pathology and
physiology affecting to the
cardiovascular system, which has
profound effects to all other organs of
the body.
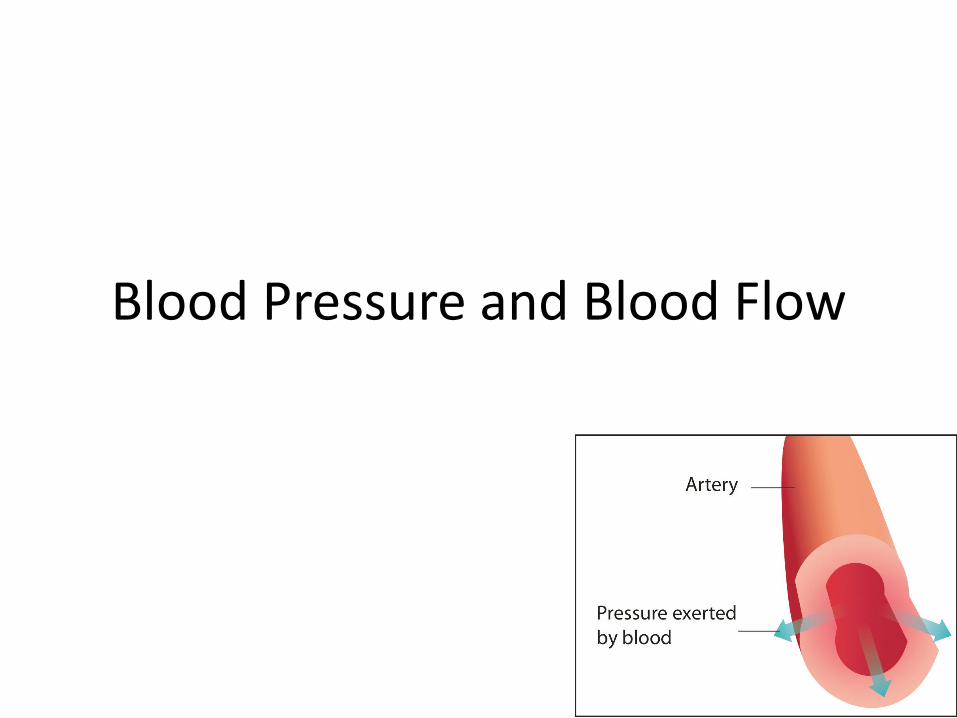
Arterial Blood Pressure: The lateral pressure force generated by the pumping action of the heart on the wall of aorta & arterial blood vessels per unit area.
Blood Pressure (1)
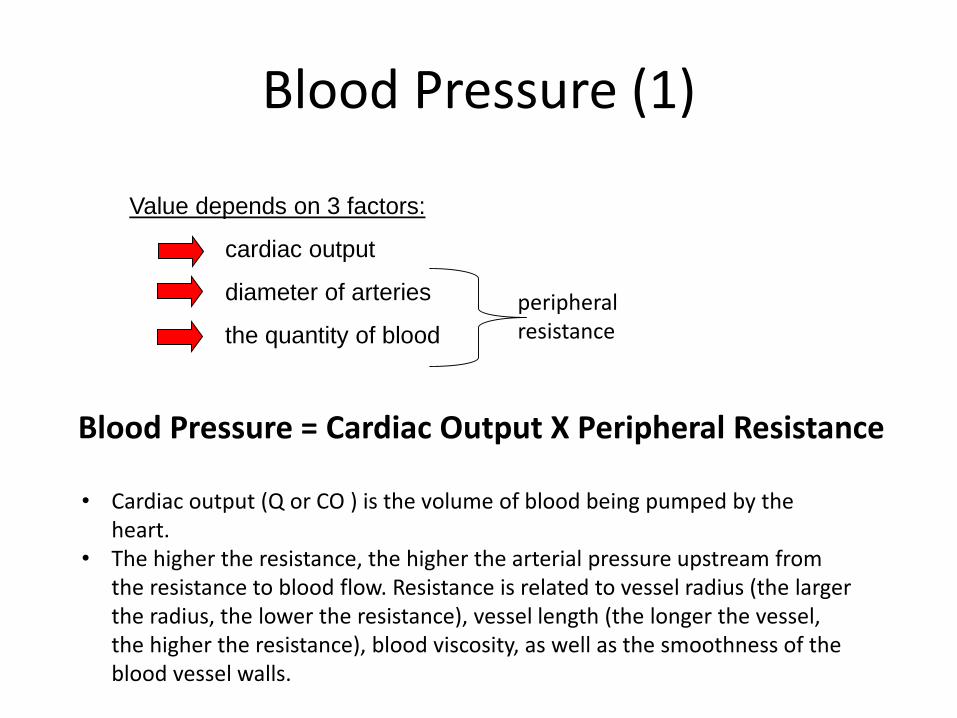
Value depends on 3 factors:
cardiac output
diameter of arteries
the quantity of blood
peripheralresistance
• Cardiac output (Q or CO ) is the volume of blood being pumped by the heart.
• The higher the resistance, the higher the arterial pressure upstream from the resistance to blood flow. Resistance is related to vessel radius (the larger the radius, the lower the resistance), vessel length (the longer the vessel, the higher the resistance), blood viscosity, as well as the smoothness of the blood vessel walls.
Blood Pressure = Cardiac Output X Peripheral Resistance
Blood Pressure (2)
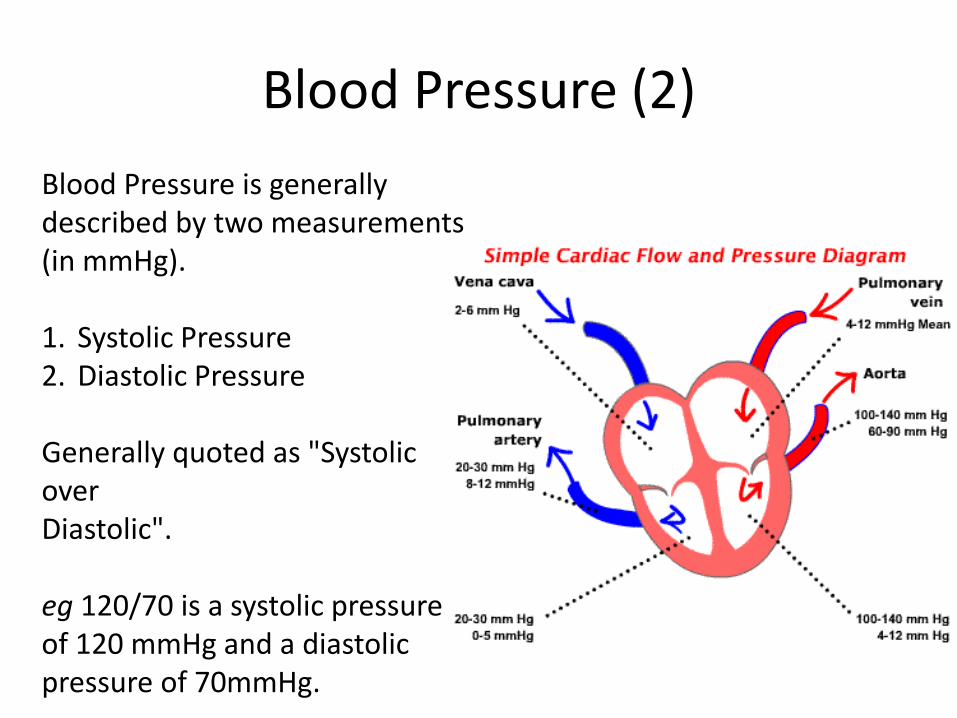
Blood Pressure is generally described by two measurements (in mmHg).
1. Systolic Pressure2. Diastolic Pressure
Generally quoted as "Systolic over Diastolic".
eg 120/70 is a systolic pressure of 120 mmHg and a diastolic pressure of 70mmHg.
Blood Pressure (3)
Systolic Blood Pressure
Systolic Pressure is the arterial pressure when the heart is beating (i.e. during the systole).It is, broadly speaking, the highest pressure present in the arterial (and vascular) system.It is a reflection of how hard the heart is pumping.
Blood Pressure (4)
Diastolic Blood Pressure
Diastolic Pressure is the arterial pressure when the heart is not beating (i.e. during the diastole).It is, broadly speaking, the lowest pressure present in the arterial system.It is a reflection of resistance the heart is pumping into.
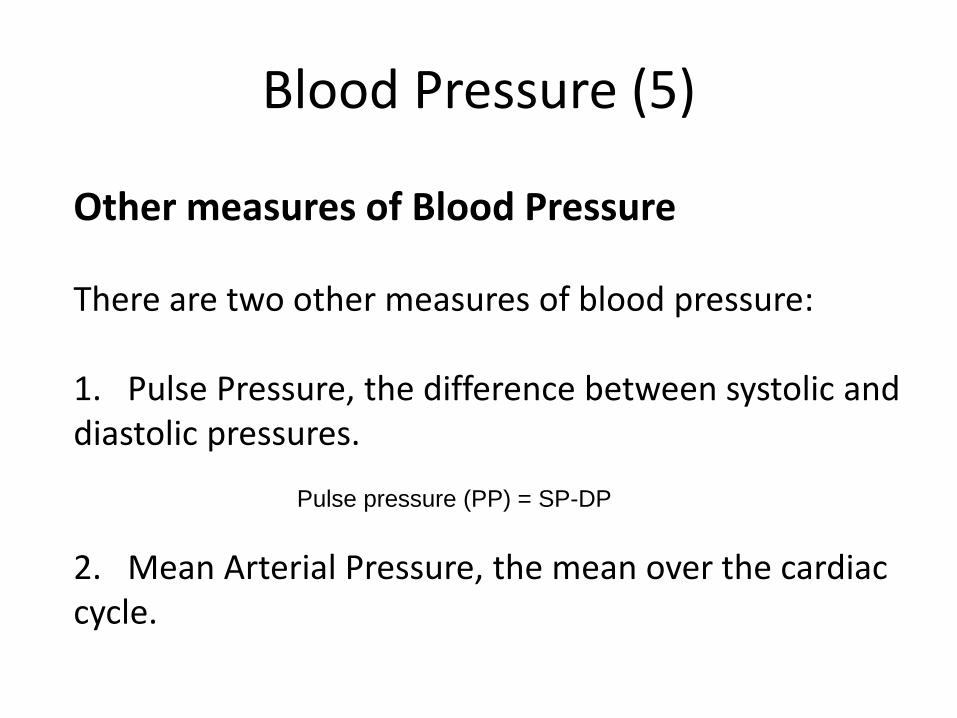
Blood Pressure (5)
Other measures of Blood Pressure
There are two other measures of blood pressure:
1. Pulse Pressure, the difference between systolic anddiastolic pressures.
2. Mean Arterial Pressure, the mean over the cardiaccycle.
Pulse pressure (PP) = SP-DP
Blood Pressure (6)
MP = 2DP/3+SP/3
Mean pressure (MP)
1. average pressure during one cardiac cycle
2. driving force of the peripheral perfusion.
3. an estimate can be done by using an empirical formula:
SP and DP may vary significantly throughout the arterial system but
MP is quite uniform (in normal situations)
High value increases the risk of heart attack and strokes
Low value increases the risk of lower oxygen perfusion e.g. in brain
However, the ’normal values’ differ from person to another

Blood Pressure (3)
Indirect Methodsin
Blood Pressure Measurements
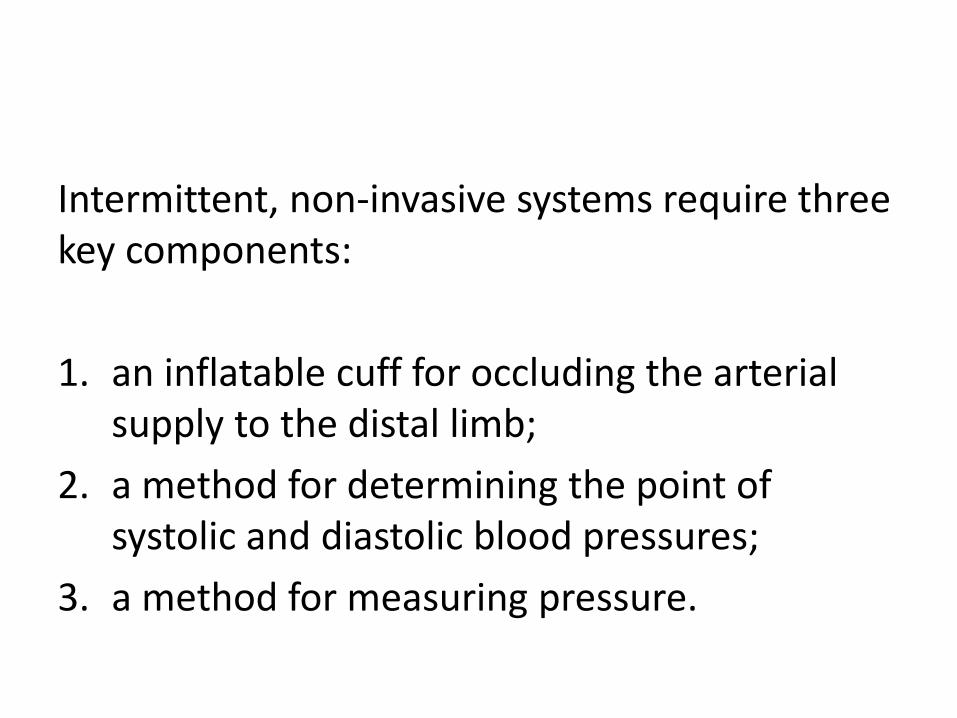
Intermittent, non-invasive systems require three key components:
1. an inflatable cuff for occluding the arterial supply to the distal limb;
2. a method for determining the point of systolic and diastolic blood pressures;
3. a method for measuring pressure.

There are many methods for determining Blood Pressure. We shall consider following 3 of them in detail and other methods in general:
1. The Method of Korotkoff (Auscultatory Method)
2. Oscillometry
3. Pulse Transit Time
The most common indirect methods are auscultation and oscillometry
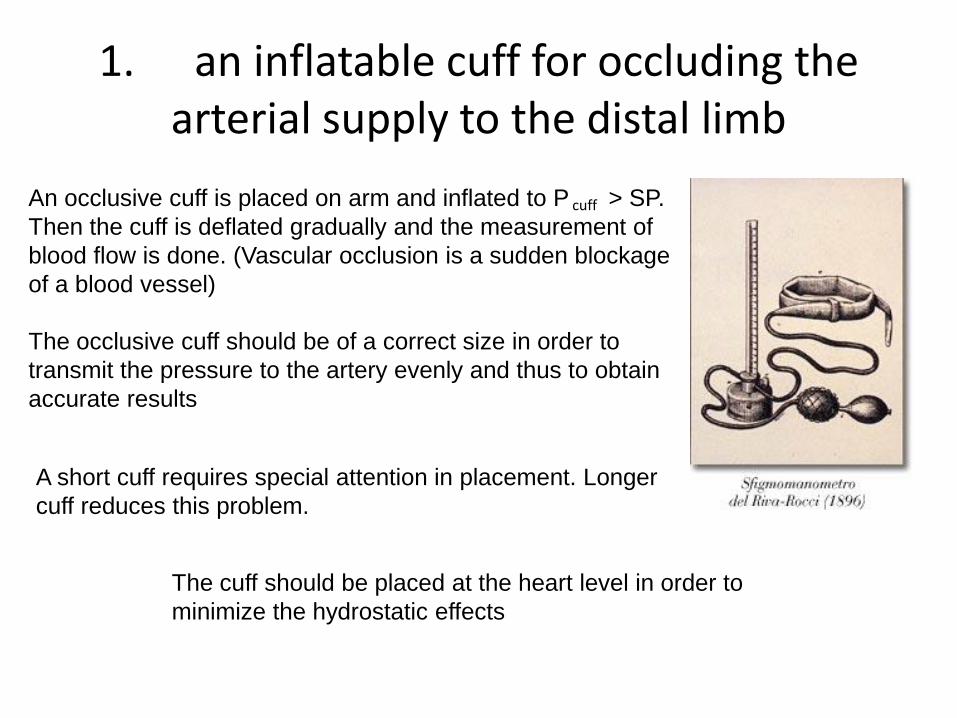
An occlusive cuff is placed on arm and inflated to P > SP.
Then the cuff is deflated gradually and the measurement of
blood flow is done. (Vascular occlusion is a sudden blockage
of a blood vessel)
cuff
The occlusive cuff should be of a correct size in order to
transmit the pressure to the artery evenly and thus to obtain
accurate results
A short cuff requires special attention in placement. Longer
cuff reduces this problem.
The cuff should be placed at the heart level in order to
minimize the hydrostatic effects
1. an inflatable cuff for occluding the arterial supply to the distal limb
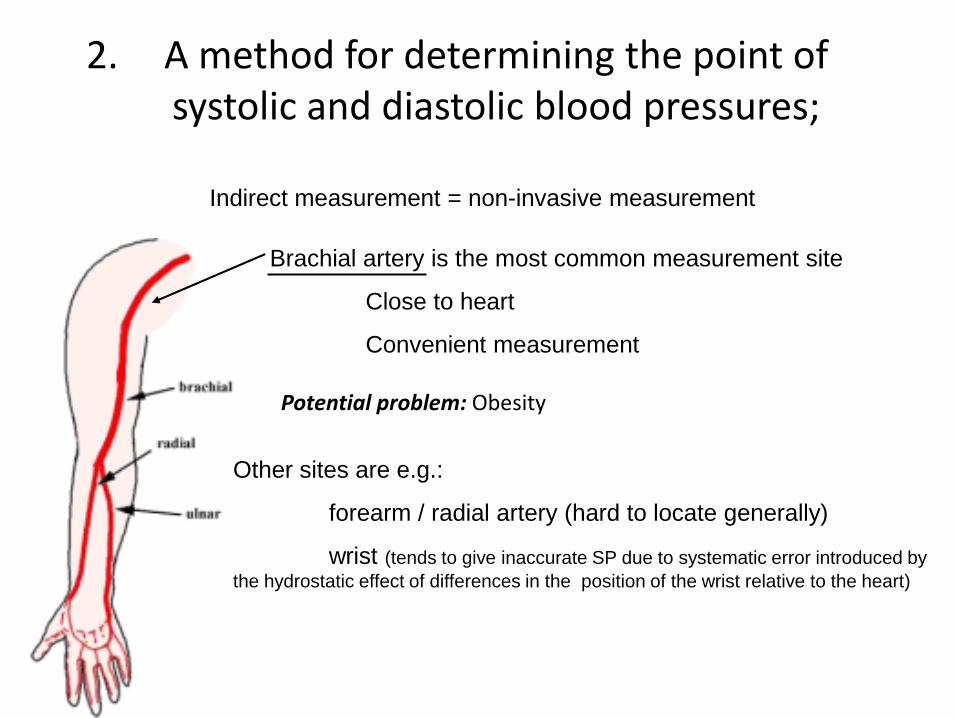
2. A method for determining the point of systolic and diastolic blood pressures;
Indirect measurement = non-invasive measurement
Brachial artery is the most common measurement site
Close to heart
Convenient measurement
Other sites are e.g.:
forearm / radial artery (hard to locate generally)
wrist (tends to give inaccurate SP due to systematic error introduced by
the hydrostatic effect of differences in the position of the wrist relative to the heart)
Potential problem: Obesity
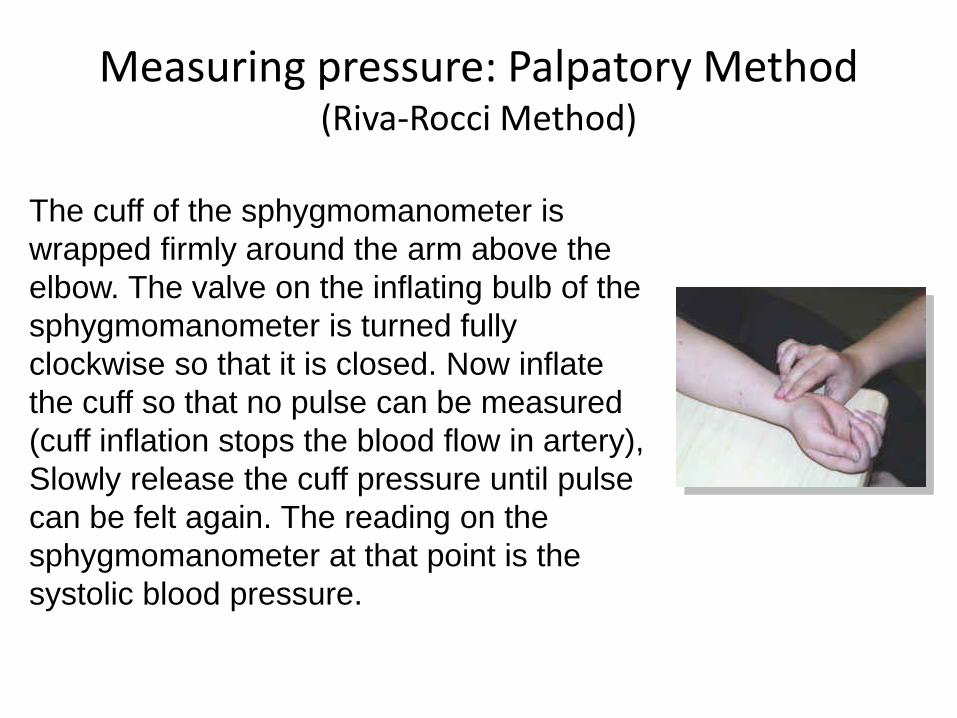
Measuring pressure: Palpatory Method (Riva-Rocci Method)
The cuff of the sphygmomanometer is
wrapped firmly around the arm above the
elbow. The valve on the inflating bulb of the
sphygmomanometer is turned fully
clockwise so that it is closed. Now inflate
the cuff so that no pulse can be measured
(cuff inflation stops the blood flow in artery),
Slowly release the cuff pressure until pulse
can be felt again. The reading on the
sphygmomanometer at that point is the
systolic blood pressure.
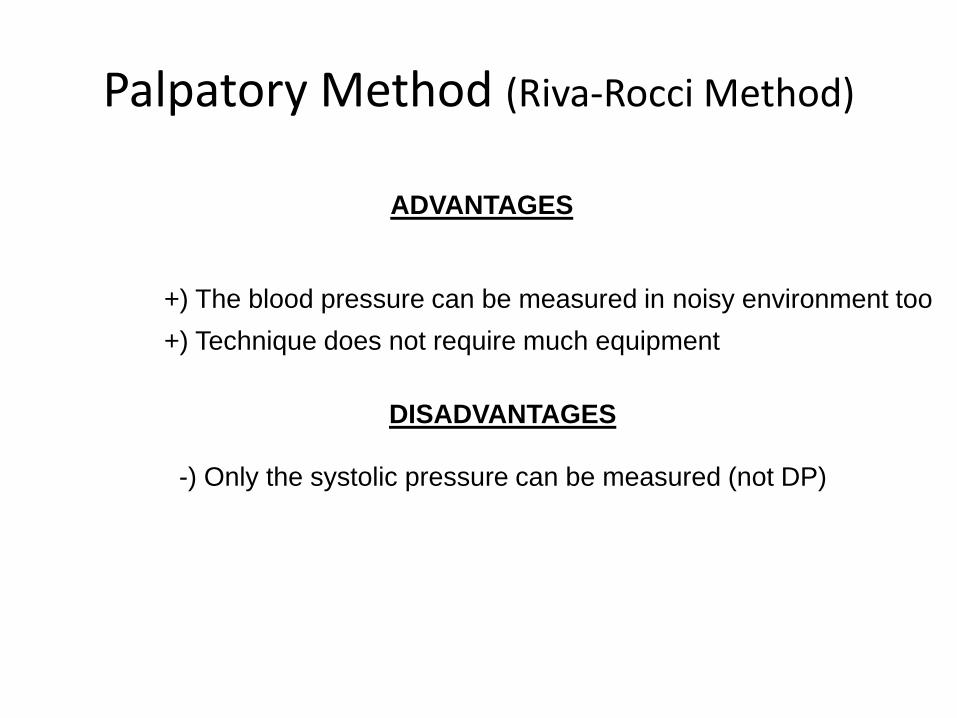
Palpatory Method (Riva-Rocci Method)
+) The blood pressure can be measured in noisy environment too
ADVANTAGES
-) Only the systolic pressure can be measured (not DP)
DISADVANTAGES
+) Technique does not require much equipment
Ultrasonic Method
A transcutaneous (through the skin)
Doppler sensor is applied here.
The motion of blood-vessel walls
in various states of occlusion is
measured.
The frequency difference between
transmitted (8 MHz) and received
signal is 40-500 Hz and it is
proportional to velocities of the wall motion and the blood.
The vessel opens and closes with
each heartbeat when
DP < P < SPcuff
Ultrasonic Method (cont.)
+) Can be also used in noisy environment
ADVANTAGES & DISADVANTAGES
+) Can be used with infants and hypotensive individuals
-) Subject’s movements change the path from sensor to vessel
Blood flow towards or away from the Doppler probe, reflects sound waves causing a change in frequency that is detected using the same Doppler probe. As Doppler is so sensitive, this technique is usually reserved for the measurement of low pressures, e.g. vascular insufficiency.

The Method of Korotkoff
• Introduced by Russian Army physician N. Korotkoff in 1905.
• Relies of blocking, or occluding, the flow of arterial blood for a short period of time.
Also known as Auscultatory Method OR Flow Occlusion
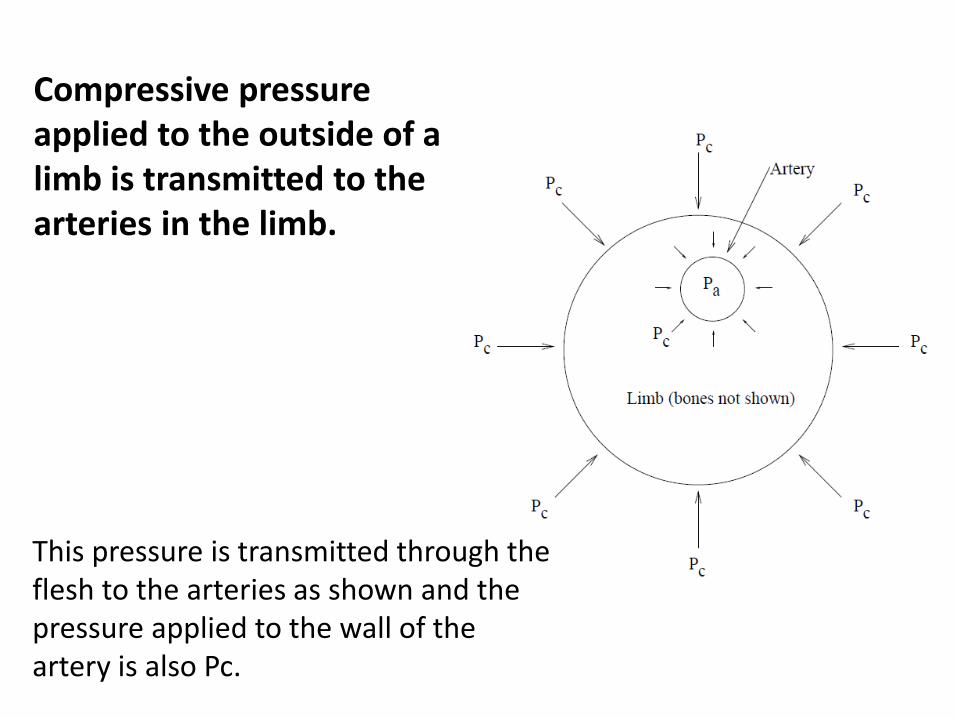
Compressive pressure applied to the outside of a limb is transmitted to the arteries in the limb.
This pressure is transmitted through theflesh to the arteries as shown and the pressure applied to the wall of the artery is also Pc.
The Method of Korotkoff: Flow Occlusion
• It is necessary to occlude the flow of blood in arteries for two major methods (Korotkoff and Oscillometry) of measuring Blood Pressure.
• To achieve this, compressive pressure is applied evenly around the limb.
• The pressure is transmitted to the underlying blood vessels.
• The pressure difference between the inside of a blood vessel and the surrounding tissue (the transmural pressure) is lowered.
The Method of Korotkoff: Flow Occlusion
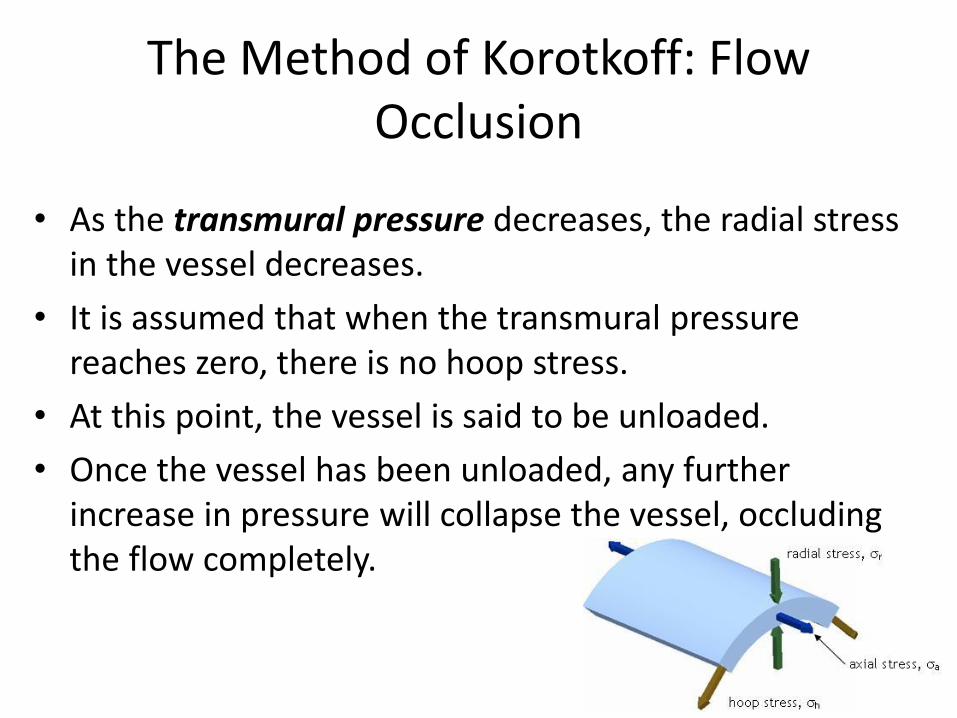
• As the transmural pressure decreases, the radial stress in the vessel decreases.
• It is assumed that when the transmural pressure reaches zero, there is no hoop stress.
• At this point, the vessel is said to be unloaded.
• Once the vessel has been unloaded, any further increase in pressure will collapse the vessel, occluding the flow completely.
The Method of Korotkoff: Flow Occlusion
• This is achieved by using an occlusive cuff which is wrapped around the limb.
• If a limb is partially occluded then a cardiac synchronous sound is still present in the limb distal to the occlusion. This is called Korotkoffsound.
The Method of Korotkoff: Flow Occlusion
• These sounds are what clinicians listen for when they take Blood Pressure using a cuff and stethoscope.
• They are only present if an artery is partially occluded.
• Different degrees of occlusion result in different types of sound.
The Method of Korotkoff: Flow Occlusion
• Initially, the cuff is inflated to a sufficient pressure to completely occlude the cuff.
• The pressure is slowly dropped (2−3 mmHg s−1)
• Then four or five different ’phases’ of Korotkoffsounds
The Method of Korotkoff: Flow Occlusion
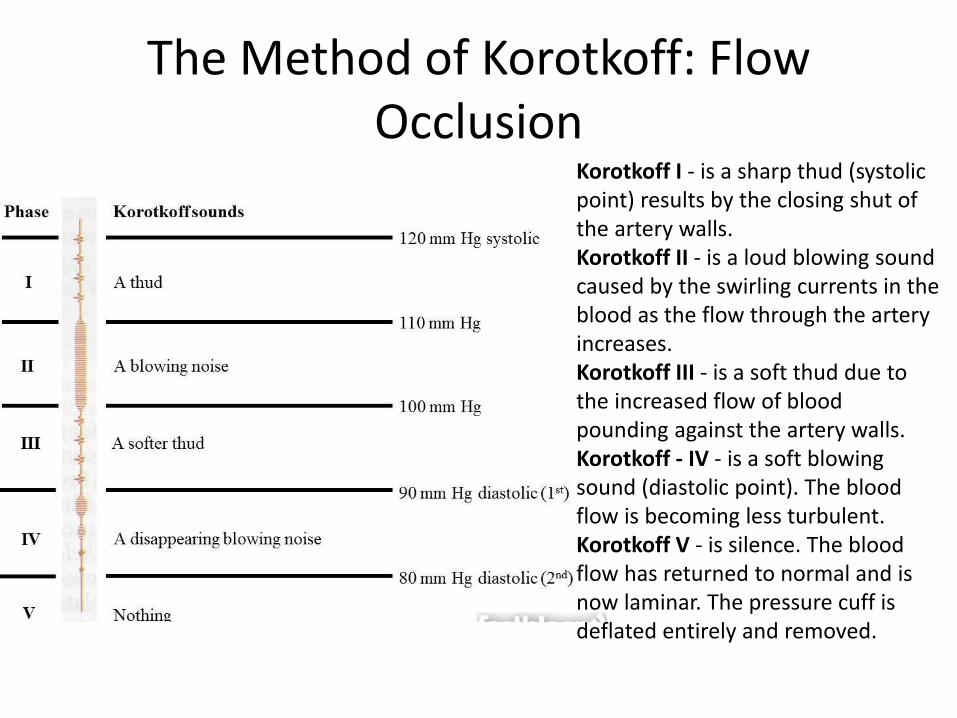
The Method of Korotkoff: Flow Occlusion
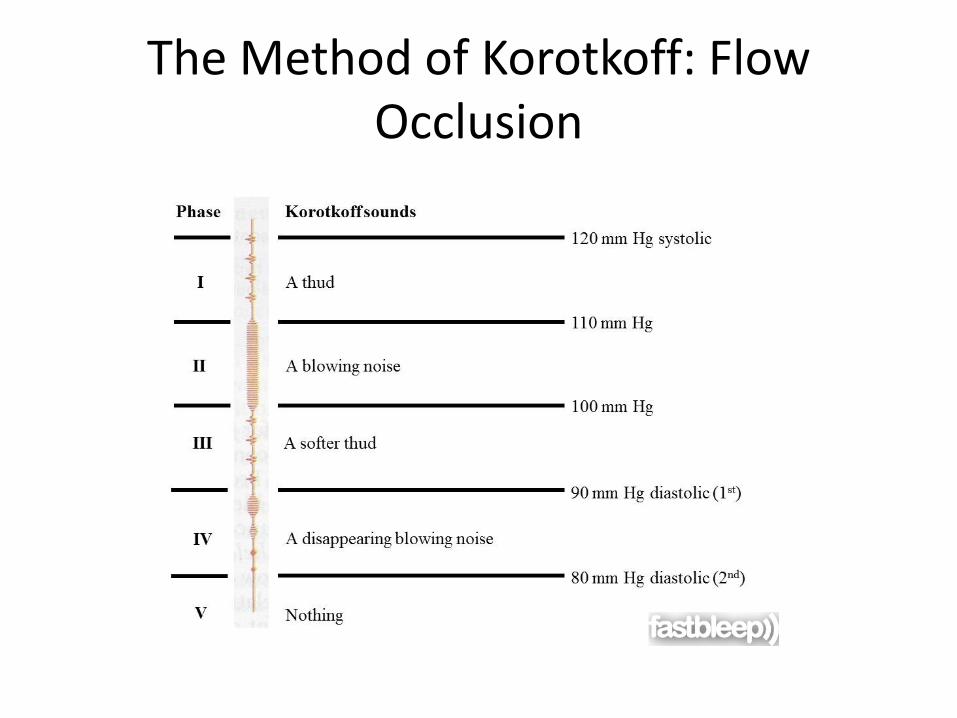
Korotkoff I - is a sharp thud (systolic point) results by the closing shut of the artery walls.Korotkoff II - is a loud blowing sound caused by the swirling currents in the blood as the flow through the artery increases.Korotkoff III - is a soft thud due to the increased flow of blood pounding against the artery walls.Korotkoff - IV - is a soft blowing sound (diastolic point). The blood flow is becoming less turbulent.Korotkoff V - is silence. The blood flow has returned to normal and is now laminar. The pressure cuff is deflated entirely and removed.
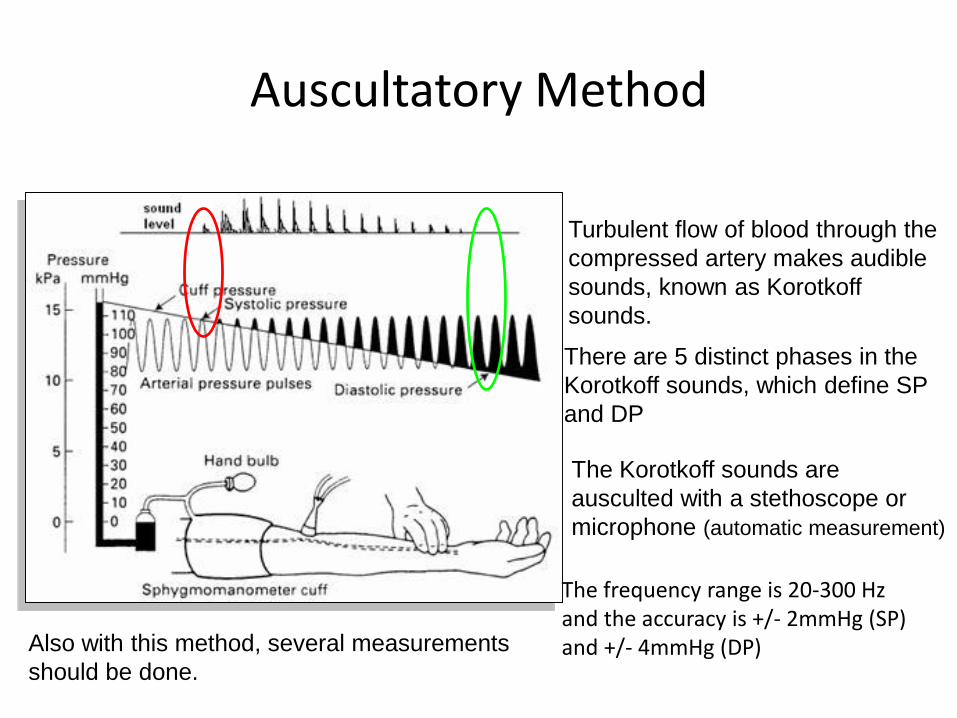
Auscultatory Method
The Korotkoff sounds are
ausculted with a stethoscope or
microphone (automatic measurement)
Turbulent flow of blood through the
compressed artery makes audible
sounds, known as Korotkoff
sounds.
There are 5 distinct phases in the
Korotkoff sounds, which define SP
and DP
Also with this method, several measurements
should be done.
The frequency range is 20-300 Hzand the accuracy is +/- 2mmHg (SP)and +/- 4mmHg (DP)
Auscultatory Method (cont.)
-) The observations differ from observer to another
-) A mechanical error might be introduced into the system e.g. mercury
leakage, air leakage, obstruction in the cuff etc.
-) The observations do not always correspond with intra-arterial pressure
-) Auscultatory tecnique cannot be used in noisy environment
+) Auscultatory technique is simple and does not require much
equipment
ADVANTAGES
DISADVANTAGES
Automating the Korotkoff method
Three phase process:
1. The cuff is inflated to slightly (20−30mmHg) above systolic pressure.
2. The cuff is deflated slowly and the audio signal from a microphone placed distal to the cuff is analyzed to determine the current phase of Korotkoff sounds.
3. Once Phase IV has been identified, the cuff is deflated rapidly and the pressures are reported.

Automating the method
Two things to do:
1. Control the cuff.
2. Analyse the Korotkoff sounds.
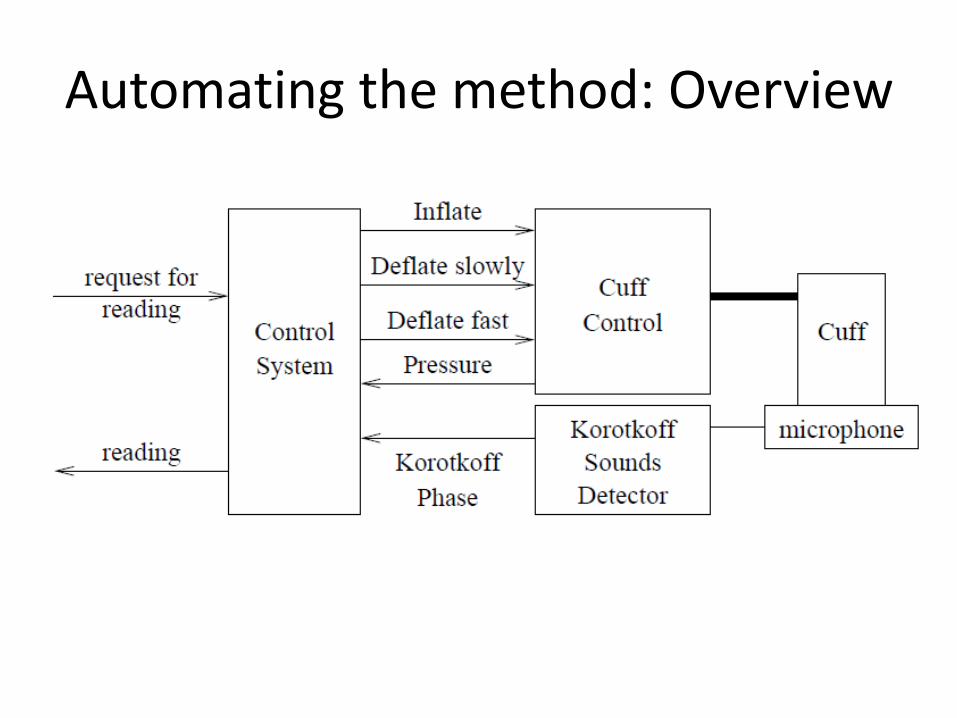
Automating the method: Overview
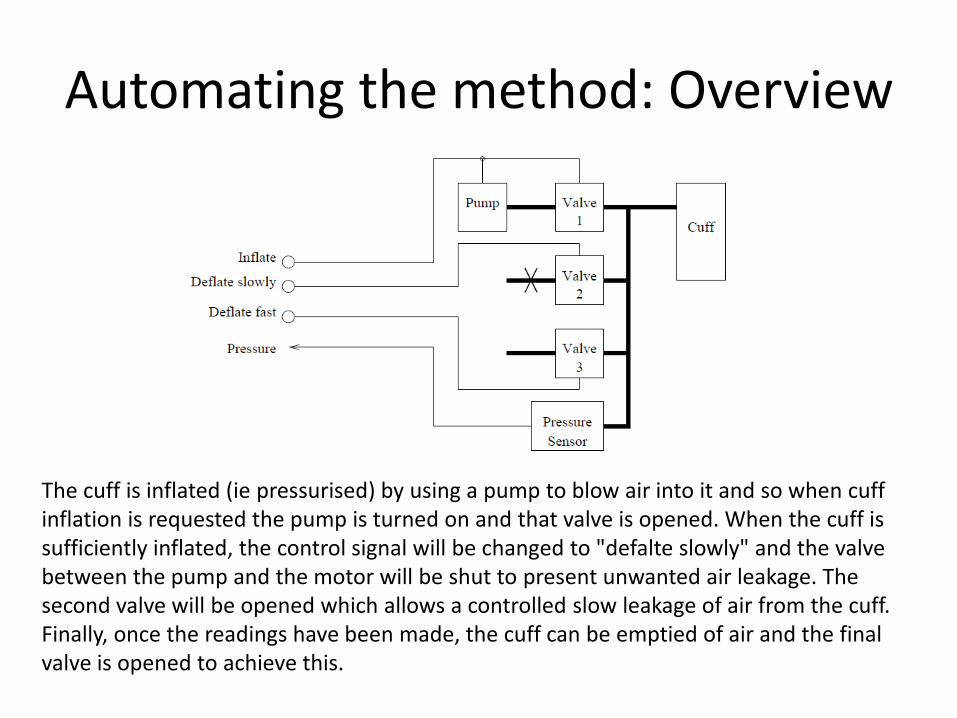
The cuff is inflated (ie pressurised) by using a pump to blow air into it and so when cuff inflation is requested the pump is turned on and that valve is opened. When the cuff is sufficiently inflated, the control signal will be changed to "defalte slowly" and the valve between the pump and the motor will be shut to present unwanted air leakage. The second valve will be opened which allows a controlled slow leakage of air from the cuff. Finally, once the readings have been made, the cuff can be emptied of air and the final valve is opened to achieve this.
Automating the method: Overview
Automating the method:
However, Korotkoff sounds are hard to automatically detect and analyze.
First, it is necessary to separate the Korotkoff sounds from the background noise (including the noise of the heart beating). Second, assessing which phase a particular sound implies is a complex signal processing task which requires a complex combination of hardware and software processing and, probably, the implementation of either a non−linear pattern matching system of the use of rule based systems.
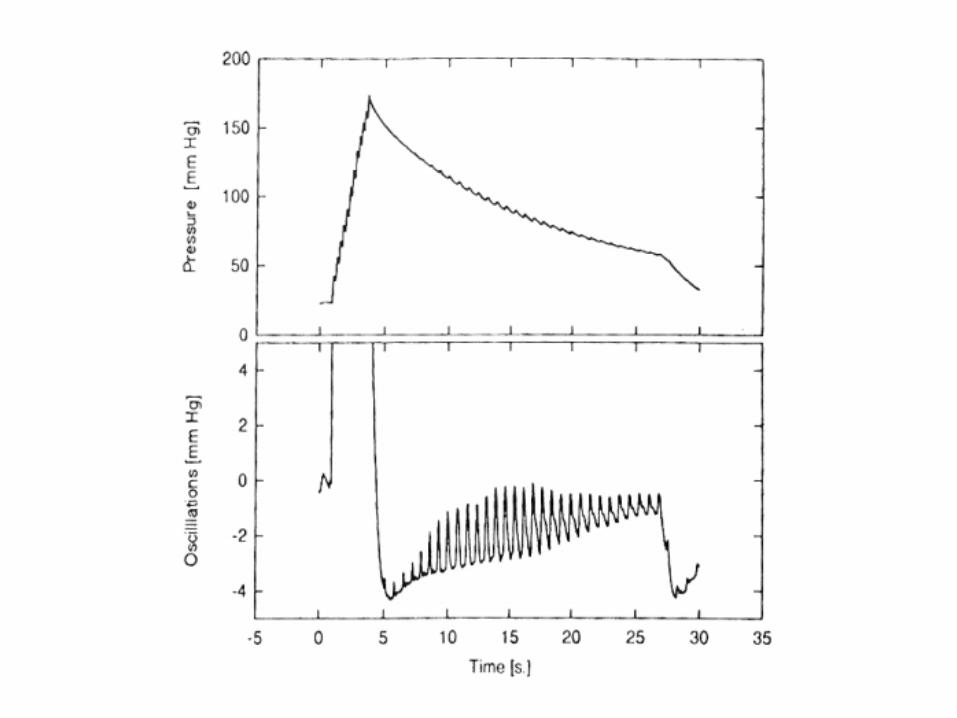
The pressure in the vessel fluctuated with the beating of the heart.
The magnitude of these pressure fluctuations (oscillations) varied with the applied pressure.
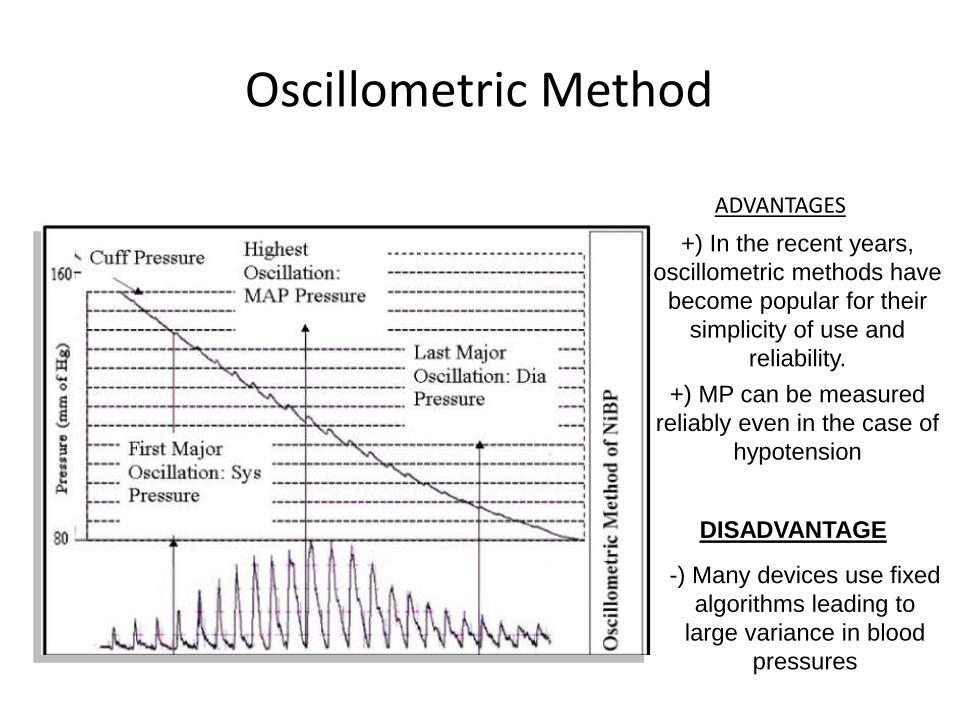
Oscillometric Method
During oscillometric blood pressure measurements, the inflated cuff detects the pulsation of the artery wall as a pressure vibration. The interpretation of these small variable amplitude vibrations provides a blood pressure value. Each specific manufacturer has it’s own technology of interpreting these oscillations.
With some assumptions, It might seem logical to assume that:
• The start of the fluctuations occurred at systolic pressure.
• The end of the fluctuations occurred at diastolic pressure.
Oscillometric Method:Fluctuations
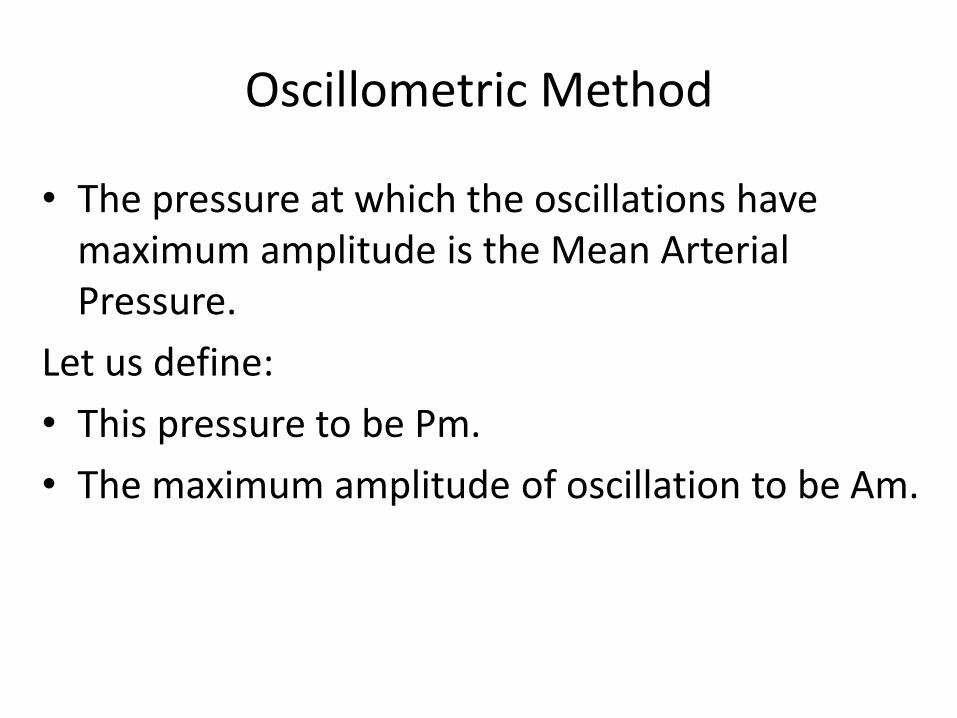
• The pressure at which the oscillations have maximum amplitude is the Mean Arterial Pressure.
Let us define:
• This pressure to be Pm.
• The maximum amplitude of oscillation to be Am.
Oscillometric Method
• From this we need to infer the Systolic and Diastolic pressures.
• There is no analytical way to do this. Therefore, a pragmatic solution has been adopted:
• Empirical studies have been done to infer how the Systolic and Diastolic Pressures (Ps and Pd) relate to the MAP.
Oscillometric Method
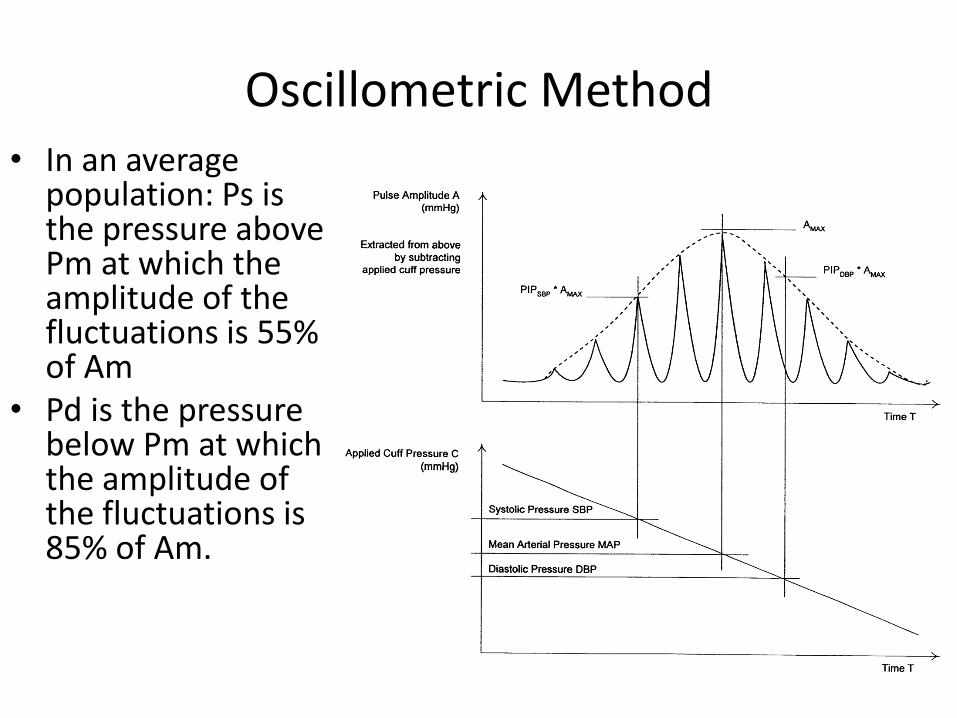
• In an average population: Ps is the pressure above Pm at which the amplitude of the fluctuations is 55% of Am
• Pd is the pressure below Pm at which the amplitude of the fluctuations is 85% of Am.
Oscillometric Method
• It is therefore possible to design a system for determining Blood Pressure using oscillometry.
• The cuff control system developed for the Method of Korotkoff can be used.
• Combined with a pressure measurement system.
System Overview
Oscillometric Method
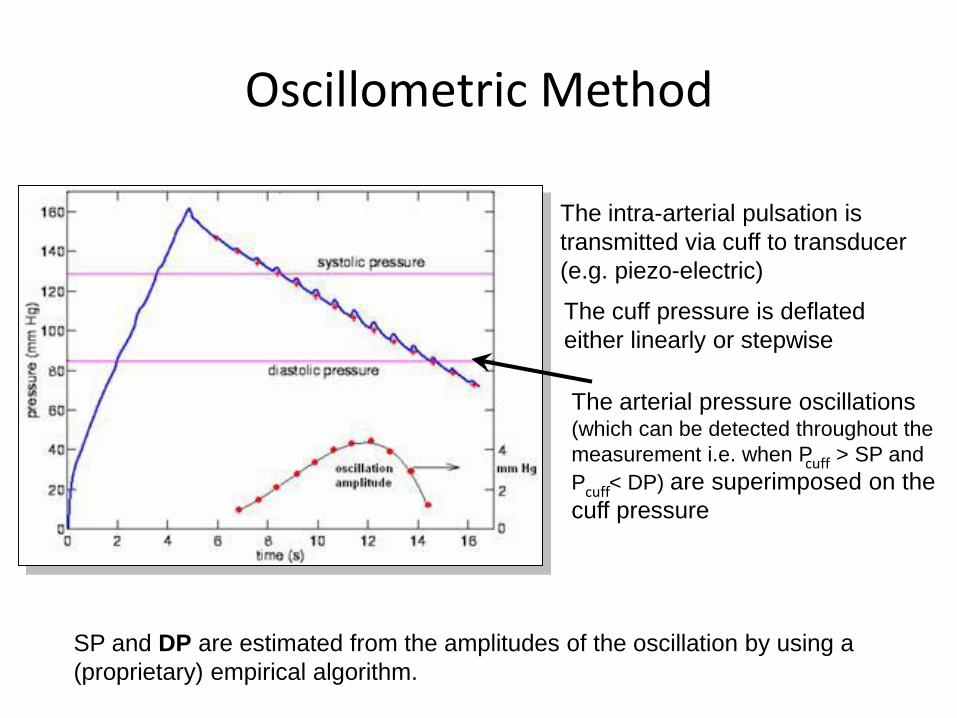
The intra-arterial pulsation is
transmitted via cuff to transducer
(e.g. piezo-electric)
The arterial pressure oscillations (which can be detected throughout the
measurement i.e. when P > SP and
P < DP) are superimposed on the
cuff pressure
SP and DP are estimated from the amplitudes of the oscillation by using a
(proprietary) empirical algorithm.
cuff
cuff
The cuff pressure is deflated
either linearly or stepwise
The Oscillometric signal
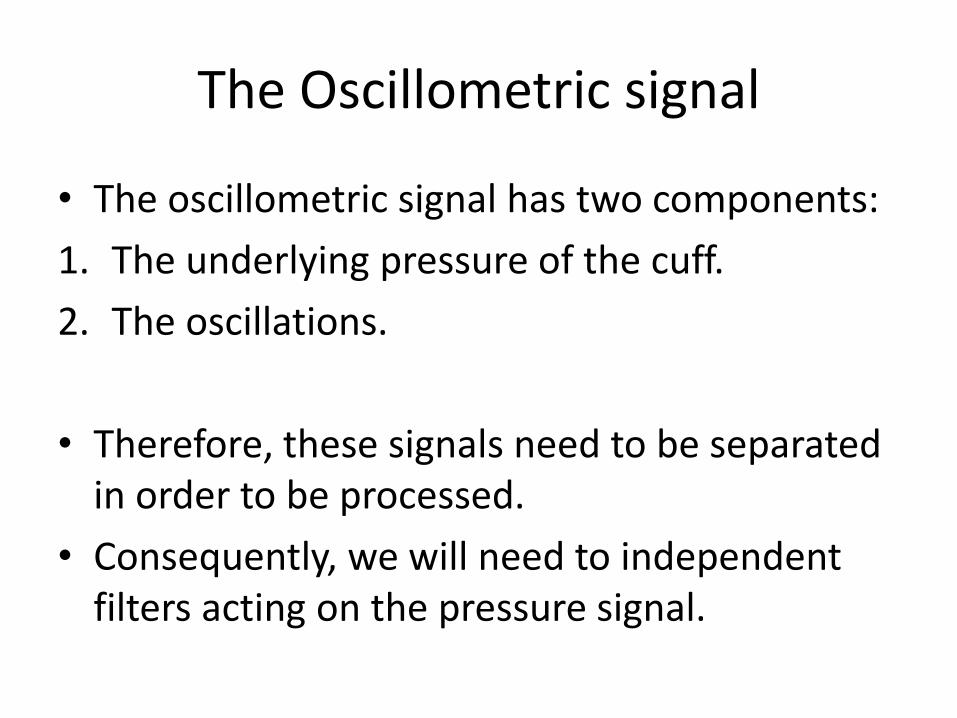
• The oscillometric signal has two components:
1. The underlying pressure of the cuff.
2. The oscillations.
• Therefore, these signals need to be separated in order to be processed.
• Consequently, we will need to independent filters acting on the pressure signal.
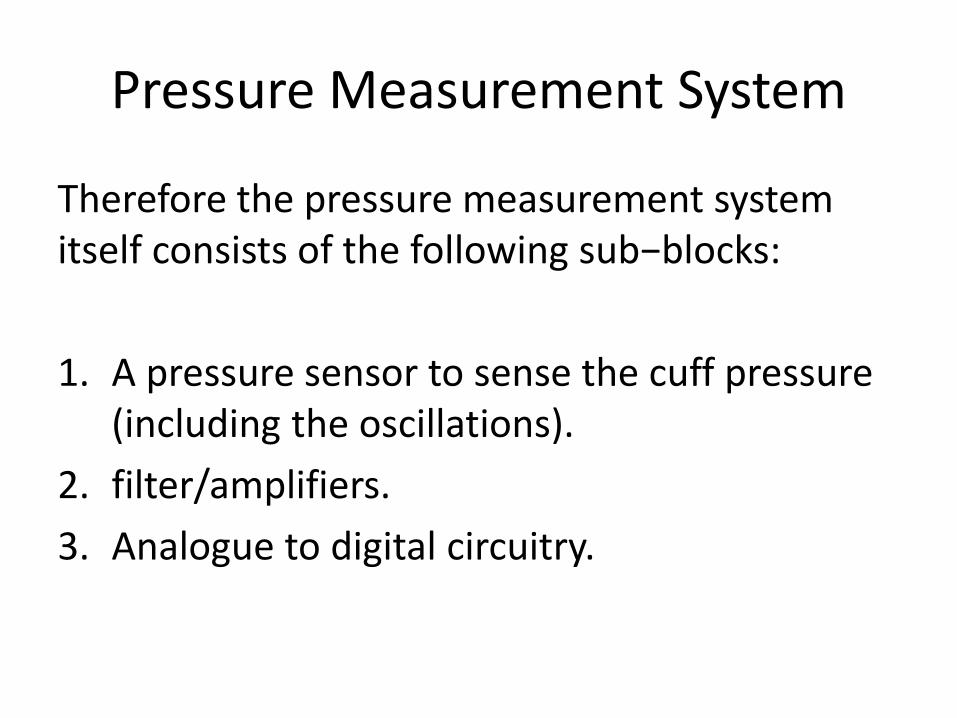
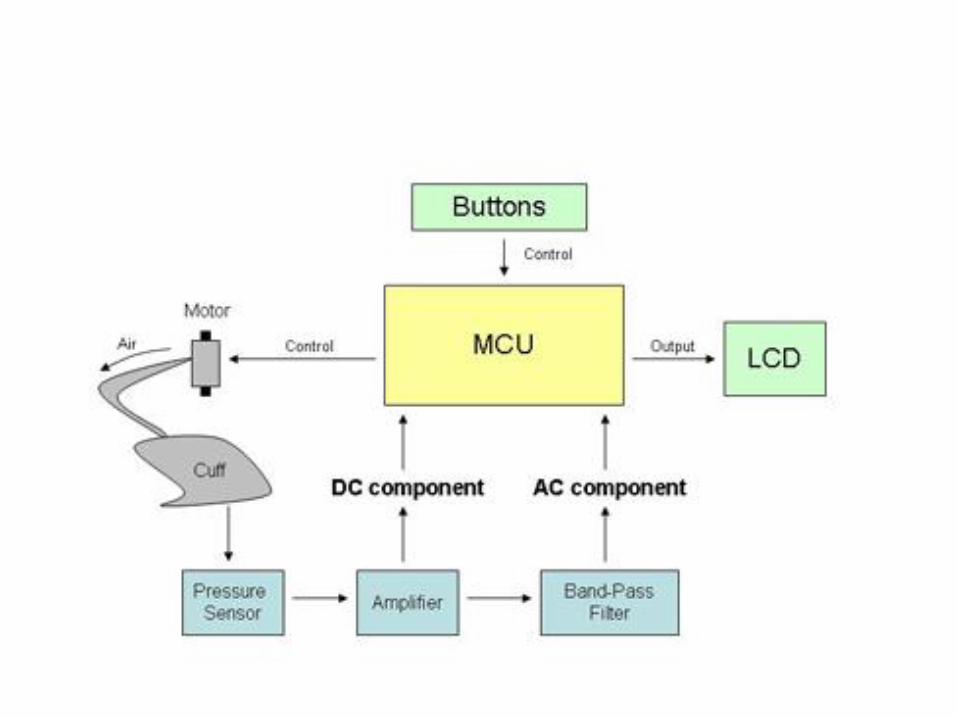
Pressure Measurement System
Therefore the pressure measurement system itself consists of the following sub−blocks:
1. A pressure sensor to sense the cuff pressure (including the oscillations).
2. filter/amplifiers.
3. Analogue to digital circuitry.
Oscillometric Method
DISADVANTAGE
-) Many devices use fixed
algorithms leading to
large variance in blood
pressures
+) In the recent years,
oscillometric methods have
become popular for their
simplicity of use and
reliability.
ADVANTAGES
+) MP can be measured
reliably even in the case of
hypotension

Hardware design
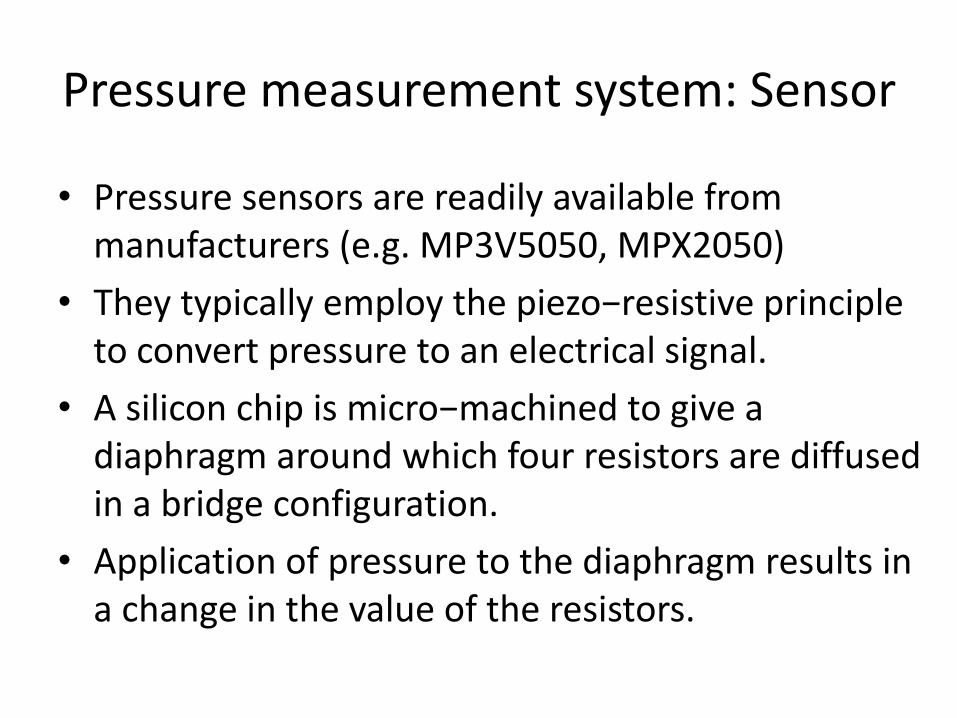
Pressure measurement system: Sensor
• Pressure sensors are readily available from manufacturers (e.g. MP3V5050, MPX2050)
• They typically employ the piezo−resistive principle to convert pressure to an electrical signal.
• A silicon chip is micro−machined to give a diaphragm around which four resistors are diffused in a bridge configuration.
• Application of pressure to the diaphragm results in a change in the value of the resistors.
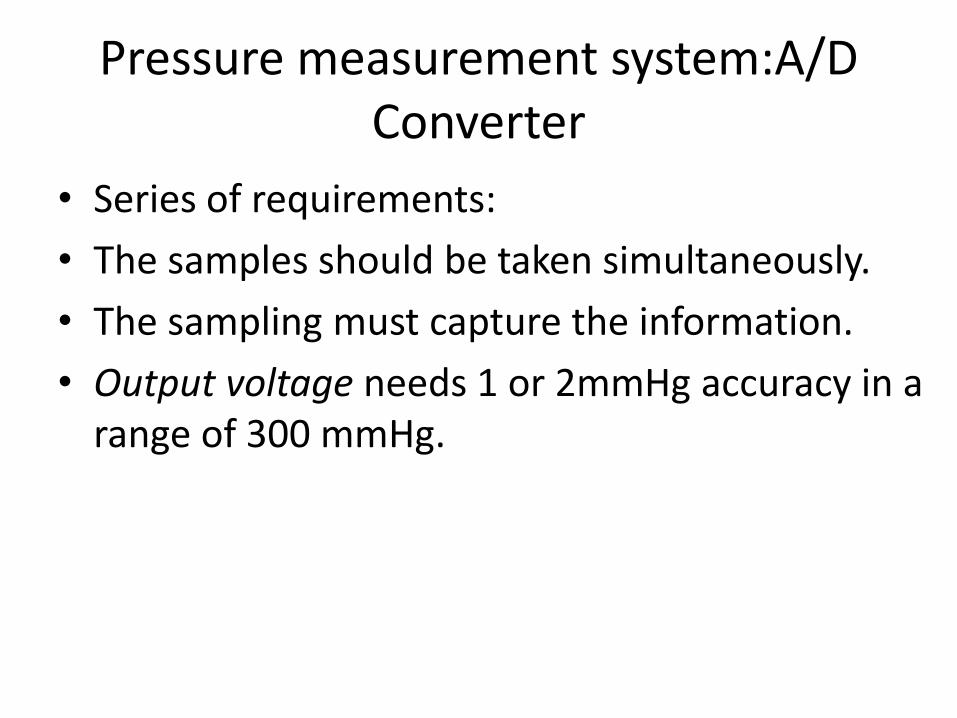
Pressure measurement system:A/D Converter
• Series of requirements:
• The samples should be taken simultaneously.
• The sampling must capture the information.
• Output voltage needs 1 or 2mmHg accuracy in a range of 300 mmHg.
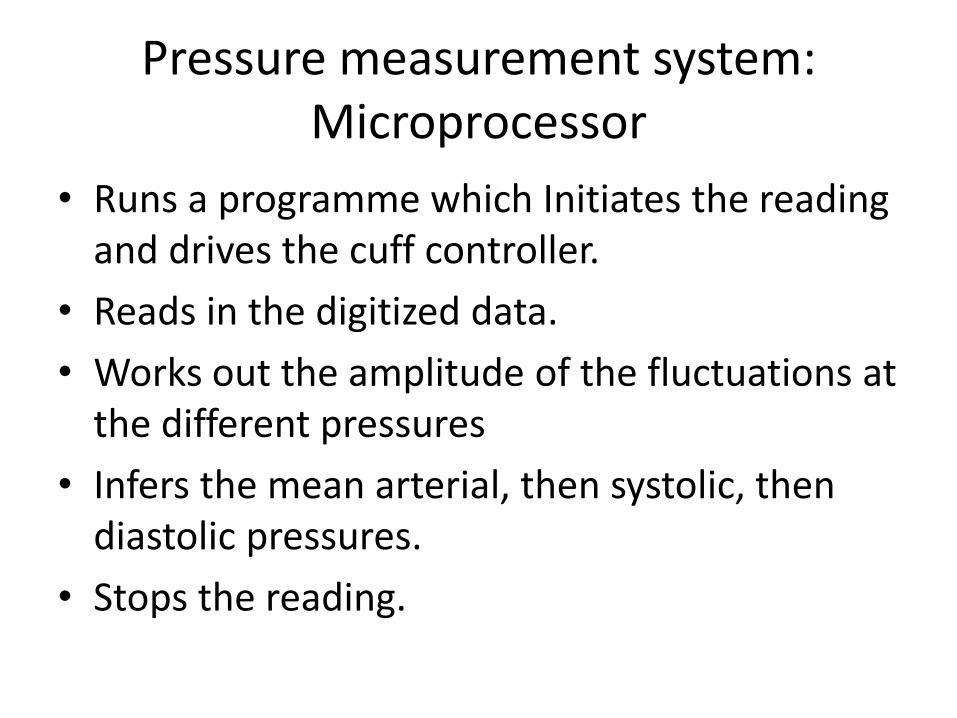
Pressure measurement system: Microprocessor
• Runs a programme which Initiates the reading and drives the cuff controller.
• Reads in the digitized data.
• Works out the amplitude of the fluctuations at the different pressures
• Infers the mean arterial, then systolic, then diastolic pressures.
• Stops the reading.
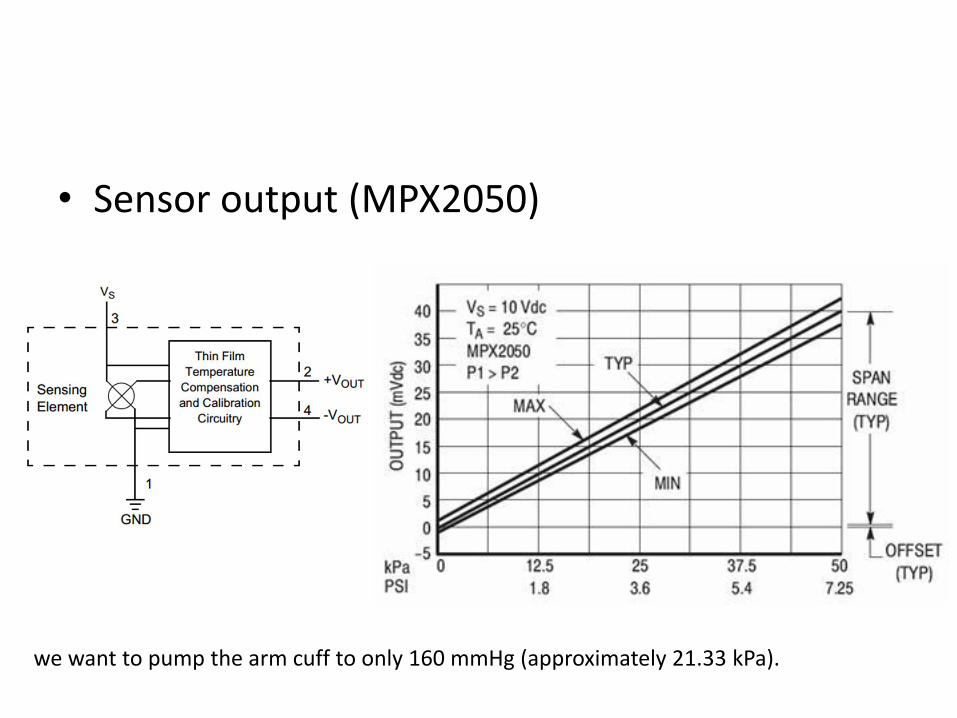
• Sensor output (MPX2050)
we want to pump the arm cuff to only 160 mmHg (approximately 21.33 kPa).
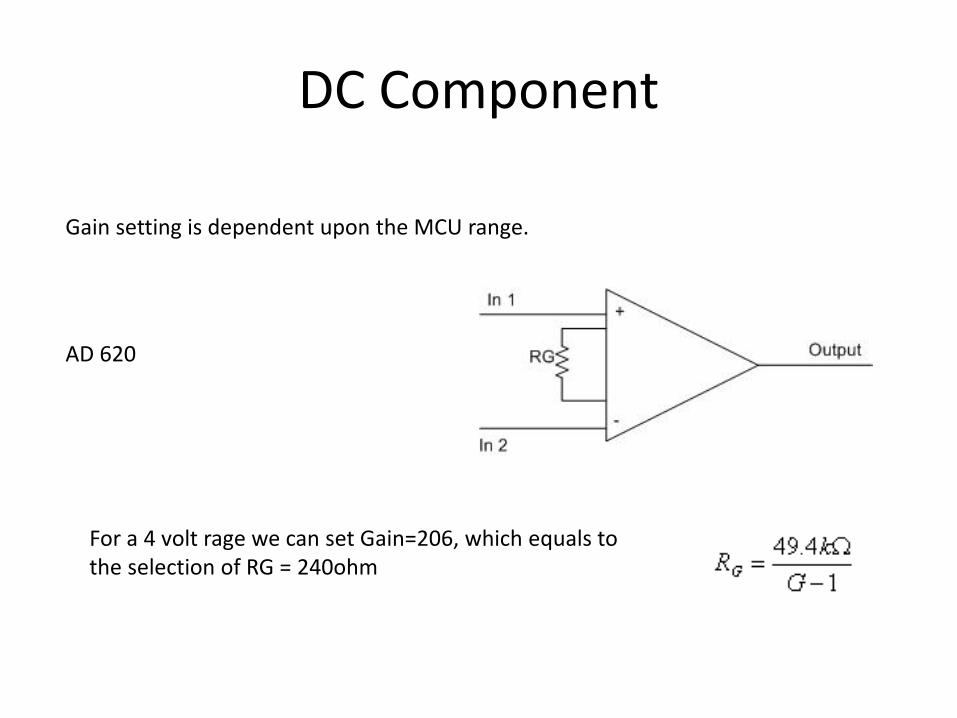
DC Component
AD 620
Gain setting is dependent upon the MCU range.
For a 4 volt rage we can set Gain=206, which equals to the selection of RG = 240ohm
AC component
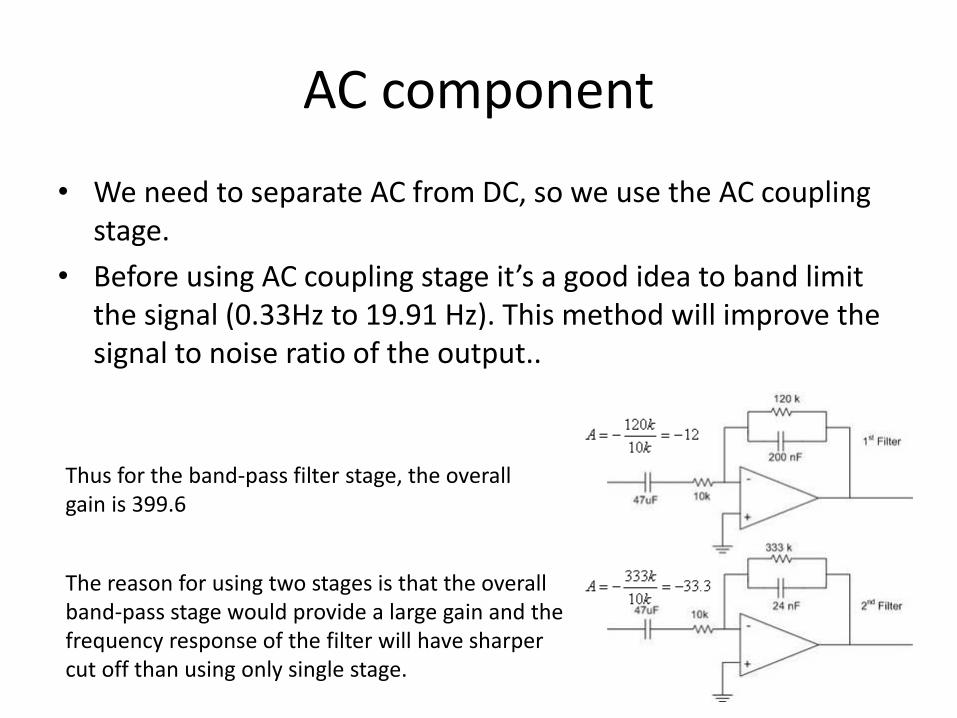
• We need to separate AC from DC, so we use the AC coupling stage.
• Before using AC coupling stage it’s a good idea to band limit the signal (0.33Hz to 19.91 Hz). This method will improve the signal to noise ratio of the output..
Thus for the band-pass filter stage, the overall gain is 399.6
The reason for using two stages is that the overall band-pass stage would provide a large gain and the frequency response of the filter will have sharper cut off than using only single stage.
AC component
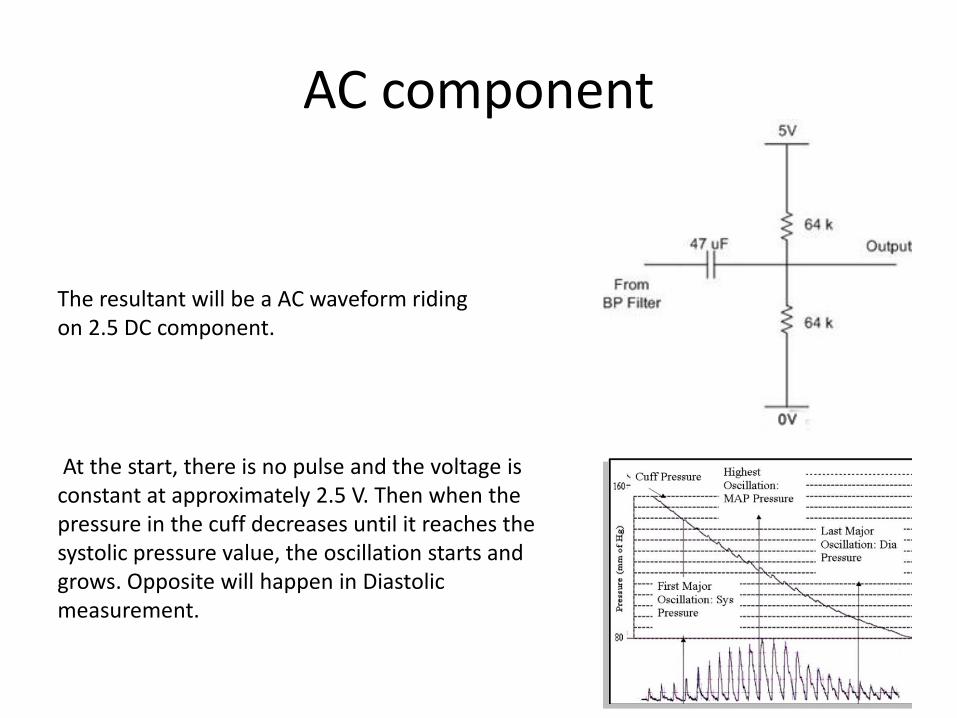
The resultant will be a AC waveform riding on 2.5 DC component.
At the start, there is no pulse and the voltage is constant at approximately 2.5 V. Then when the pressure in the cuff decreases until it reaches the systolic pressure value, the oscillation starts and grows. Opposite will happen in Diastolic measurement.
1. Systolic pressure measurement
At the start, there is no pulse and the voltage is constant at approximately 2.5 V. Then when the pressure in the cuff decreases until it reaches the systolic pressure value, the oscillation starts and grows. When it crosses a threshold, the pressure measurement is the systolic pressure.
2. Pulse rate measurement
Pulse rate can be measured after Systolic pressure because at this point the oscillation of the waveform is strongest. Usually time interval of few peaks are calculated and averaged to find out the pulse rate.
3. Diastolic pressure measurement
While the cuff is deflating, at some point before the pressure reaches diastolic pressure, the amplitude of the oscillation will
decrease.
Problems encountering the design
1. Duration of measurement
• Complete measurement take roughly 1.5 min.
• The cuff inflation and deflation should not be more than 10 seconds.
2. Accuracy
All the measurements are mainly dependent on the waveforms from the circuit and the pressure sensor is very sensitive to even a slight movement of the user.
Time period of the waveform gives Heart rate and it usually stays constant. The pressure measurements are dependent upon the amplitude of the voltage so they are more prone to errors
Problems encountering the design
3. Design Safety
• Cuff pressure can harm the arm so it should not go beyond a limit.
• Must have emergency stop and deflate
4. Interference with other people/equipment
5. Usability
Summary
• Blood Pressure can be determined by observing oscillations in the pressure of a cuff while the pressure of that cuff is deflated from above systolic to below diastolic.
• The pressure at which the oscillations are of greatest amplitude is the Mean Arterial Pressure.
• Systolic and Diastolic can be inferred from that pressure on the basis of empirical studies comparing them with the oscillation amplitude ratios.
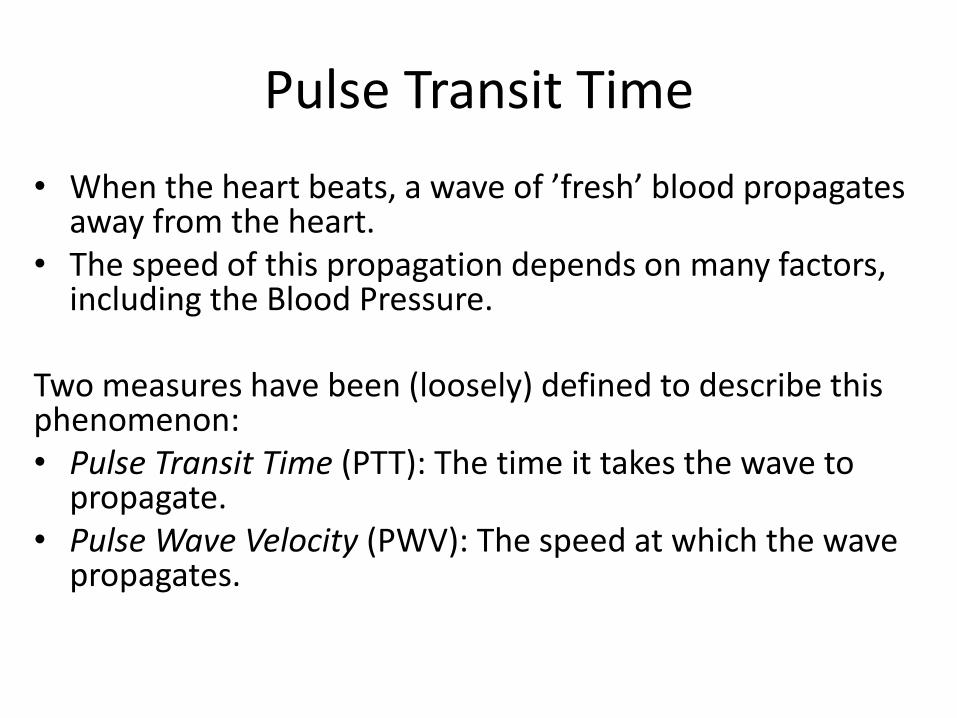
Pulse Transit Time
• When the heart beats, a wave of ’fresh’ blood propagates away from the heart.
• The speed of this propagation depends on many factors, including the Blood Pressure.
Two measures have been (loosely) defined to describe this phenomenon:• Pulse Transit Time (PTT): The time it takes the wave to
propagate.• Pulse Wave Velocity (PWV): The speed at which the wave
propagates.
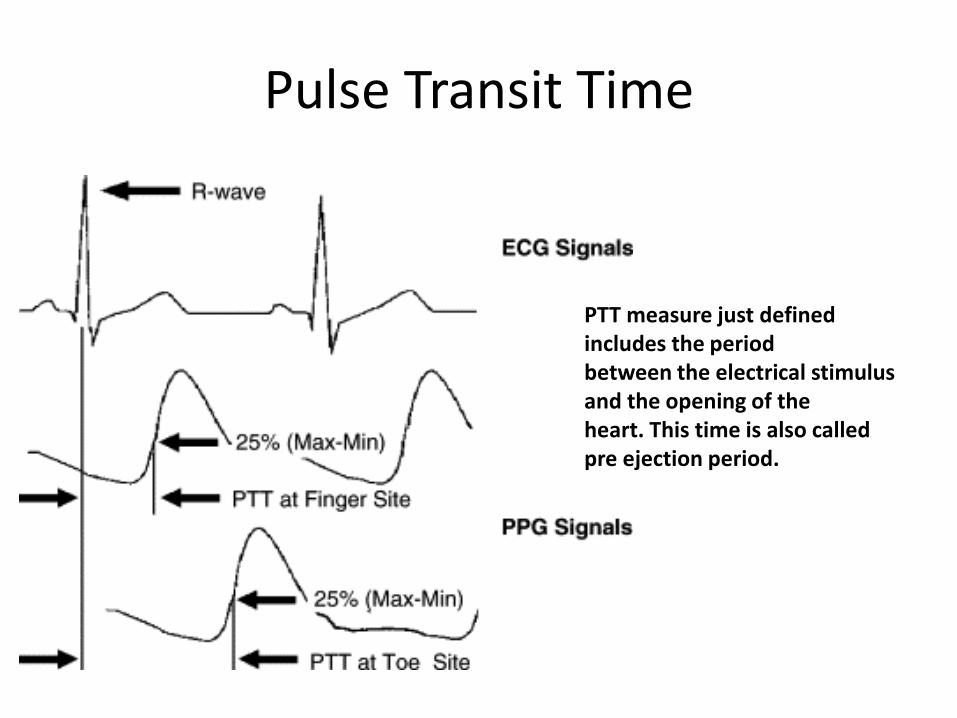
PTT measure just defined includes the periodbetween the electrical stimulus and the opening of theheart. This time is also called pre ejection period.
Pulse Transit Time
Pulse Transit Time
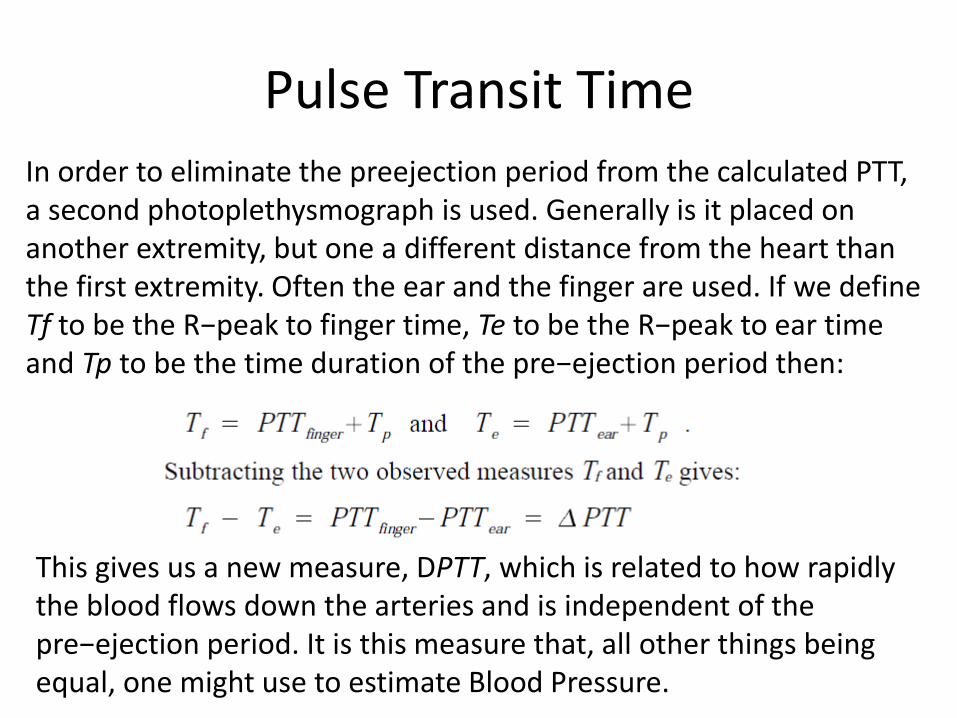
In order to eliminate the preejection period from the calculated PTT, a second photoplethysmograph is used. Generally is it placed on another extremity, but one a different distance from the heart than the first extremity. Often the ear and the finger are used. If we define Tf to be the R−peak to finger time, Te to be the R−peak to ear time and Tp to be the time duration of the pre−ejection period then:
This gives us a new measure, DPTT, which is related to how rapidly the blood flows down the arteries and is independent of the pre−ejection period. It is this measure that, all other things being equal, one might use to estimate Blood Pressure.
PTT: Estimating Blood Pressure
This is an indirect method of measurement. There are three problems which need to be overcome to estimate blood pressure from PTT measurements.
1. There are changes in PTT which are not related to Blood Pressure (e.g. bending the arm).
2. The relationship between the PTT measure and Blood Pressure is non−linear and needs to be carefully characterized.
3. Factors other than Blood Pressure (including age related effects) affect the absolute value of the PTT measurement.
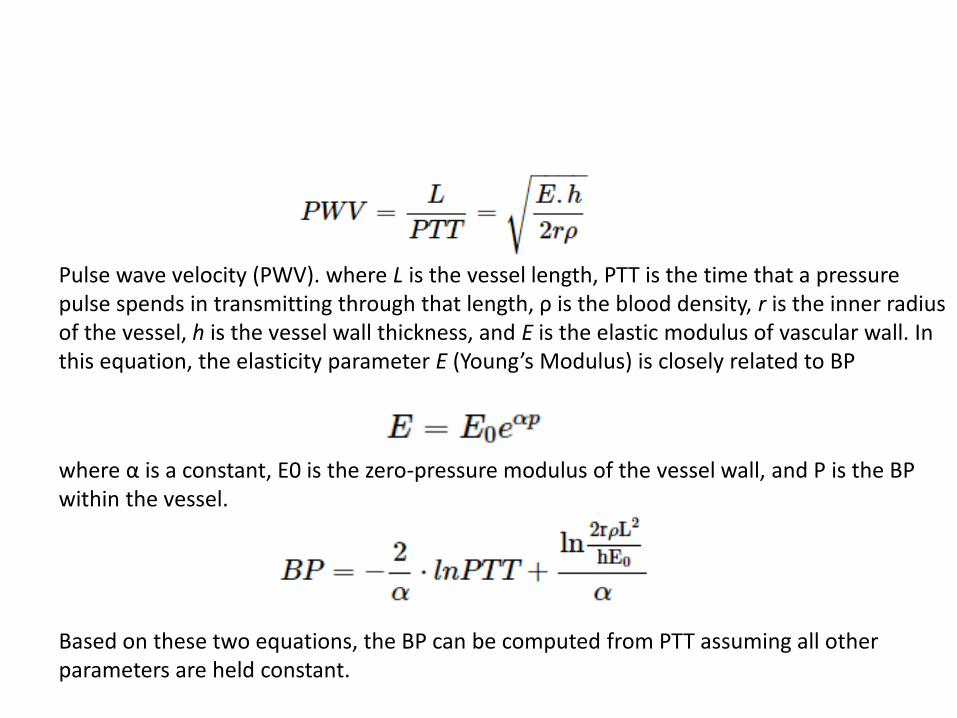
Pulse wave velocity (PWV). where L is the vessel length, PTT is the time that a pressure pulse spends in transmitting through that length, ρ is the blood density, r is the inner radius of the vessel, h is the vessel wall thickness, and E is the elastic modulus of vascular wall. In this equation, the elasticity parameter E (Young’s Modulus) is closely related to BP
where α is a constant, E0 is the zero-pressure modulus of the vessel wall, and P is the BP within the vessel.
Based on these two equations, the BP can be computed from PTT assuming all other parameters are held constant.
Drawbacks: There are many physical factors that influence cardiac output and BP, such as the blood volume, resistance of the blood vessels, and blood thickness. BP is the product of cardiac output and peripheral resistance. In practice, each individual's autonomic nervous system responds to and regulates all these interacting factors. When BP decreases, the nervous system is stimulated. In response, hear rate (HR) increases in an effort to increase cardiac output and the arterial walls contract to increase BP
PTT: Estimating Blood Pressure
However, despite these problems a system has been developed and is being marketed which gives continuous BP using PTT for anaesthetized patients.
Also some other devices are in market which gives continuous blood pressure monitoring non-invasively.
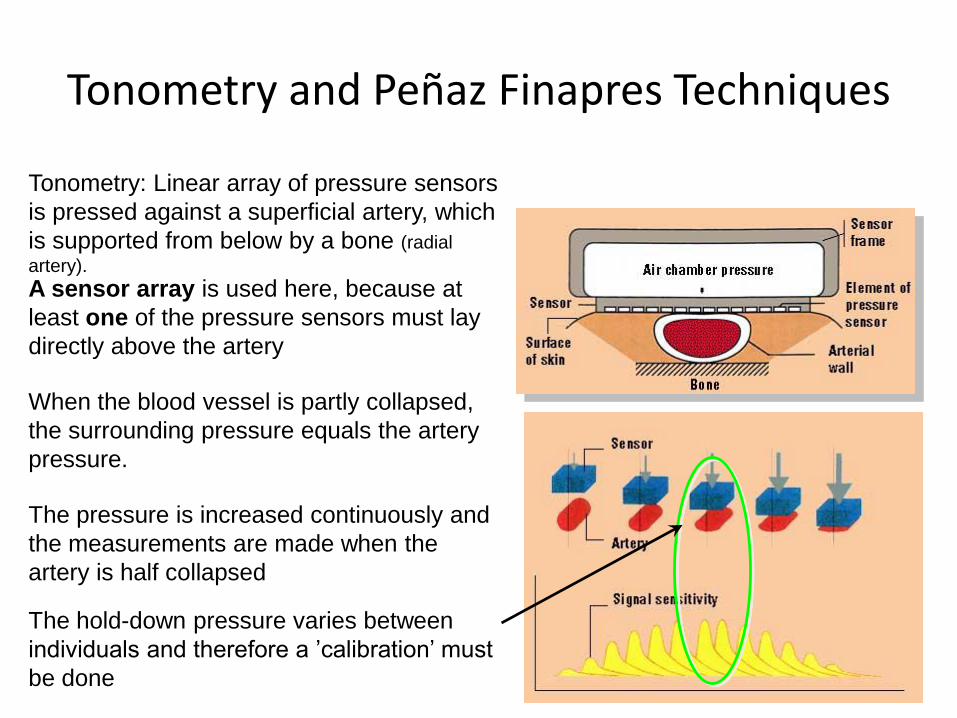
Tonometry and Peñaz Finapres Techniques
A sensor array is used here, because at
least one of the pressure sensors must lay
directly above the artery
Tonometry: Linear array of pressure sensors
is pressed against a superficial artery, which
is supported from below by a bone (radial
artery).
The pressure is increased continuously and
the measurements are made when the
artery is half collapsed
When the blood vessel is partly collapsed,
the surrounding pressure equals the artery
pressure.
The hold-down pressure varies between
individuals and therefore a ’calibration’ must
be done
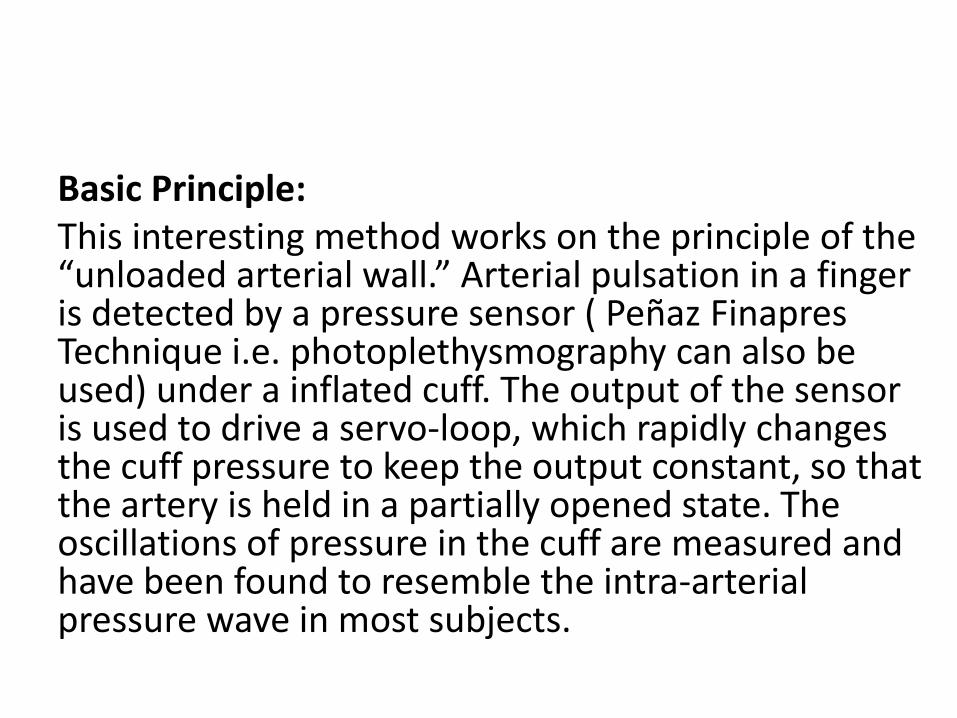
Basic Principle: This interesting method works on the principle of the “unloaded arterial wall.” Arterial pulsation in a finger is detected by a pressure sensor ( Peñaz FinapresTechnique i.e. photoplethysmography can also be used) under a inflated cuff. The output of the sensor is used to drive a servo-loop, which rapidly changes the cuff pressure to keep the output constant, so that the artery is held in a partially opened state. The oscillations of pressure in the cuff are measured and have been found to resemble the intra-arterial pressure wave in most subjects.
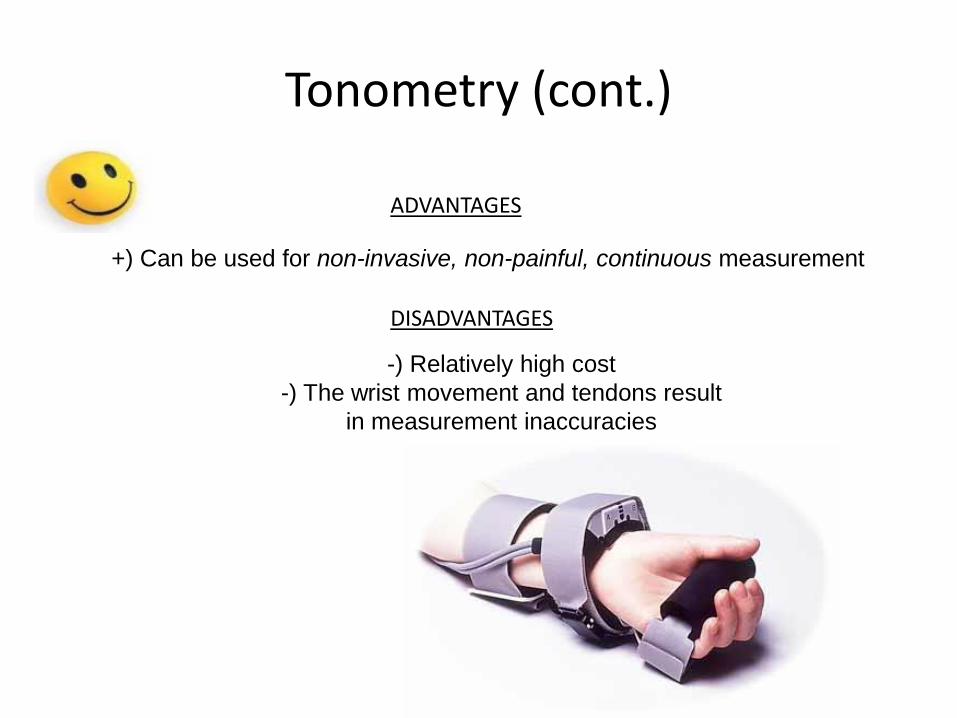
Tonometry (cont.)
ADVANTAGES
+) Can be used for non-invasive, non-painful, continuous measurement
DISADVANTAGES
-) Relatively high cost
-) The wrist movement and tendons result
in measurement inaccuracies
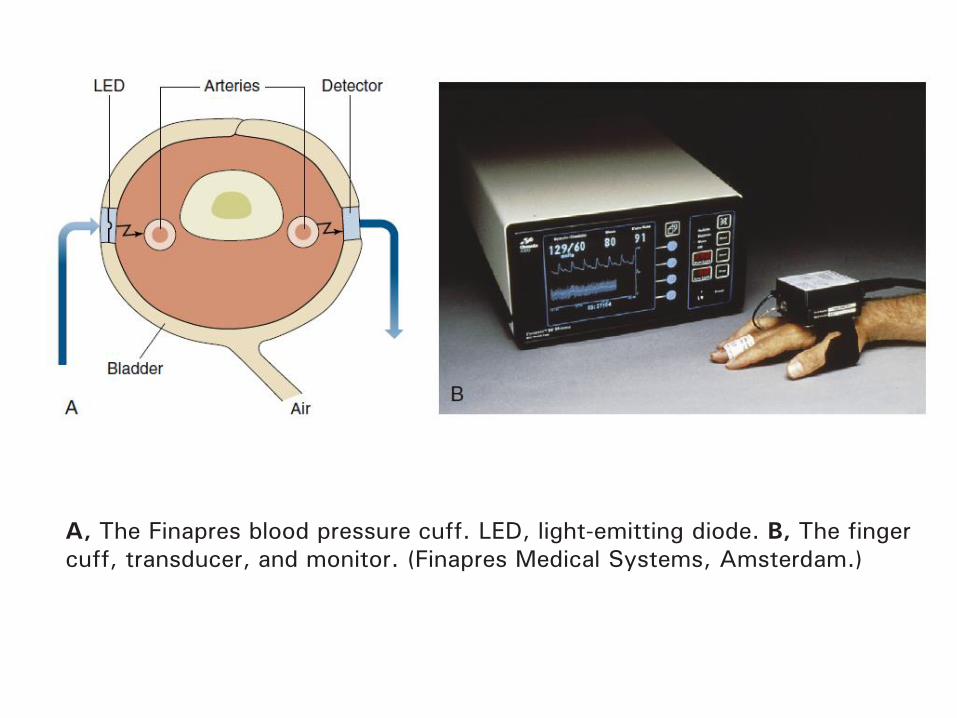
A, The Finapres blood pressure cuff. LED, light-emitting diode. B, The finger
cuff, transducer, and monitor. (Finapres Medical Systems, Amsterdam.)
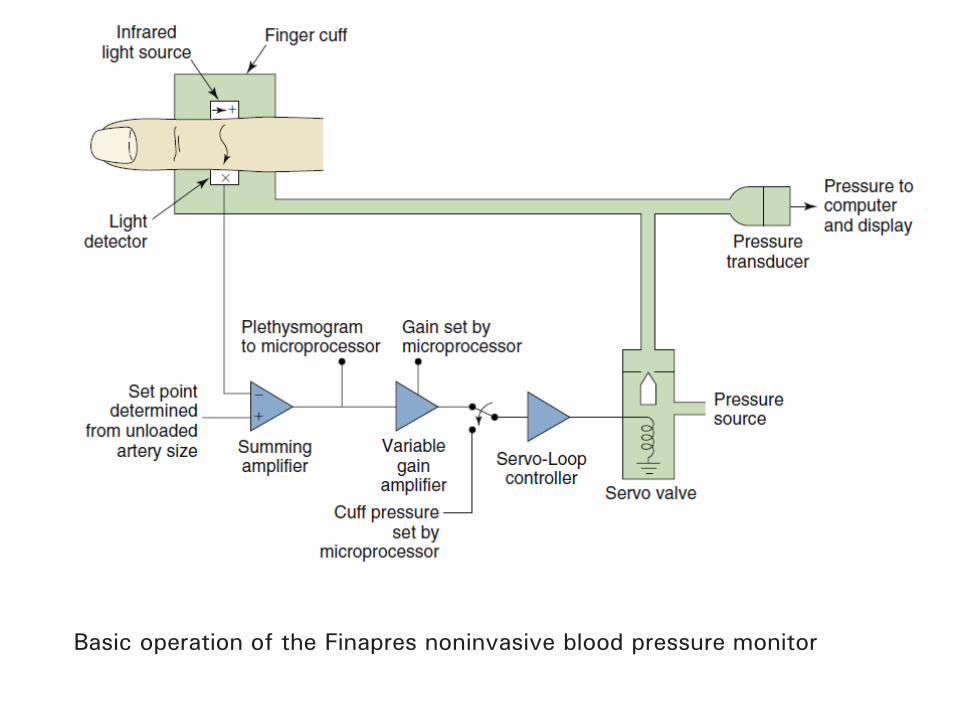
Basic operation of the Finapres noninvasive blood pressure monitor
1. Low peripheral perfusion states reduce the useful signal thus negatively affecting accuracy.
2. When functioning perfectly, the Peñaz method accurately measures the blood pressure in the finger, which may or may not correlate with central arterial pressure.
3. In the case of vascular disease or physiologic vasoconstriction, such as in hypothermia, blood pressure in the finger can be very low or even essentially absent, whereas the patient may be centrally hypertensive.
4. A pressure sensor is subjected to environmental pressure conditions.
Direct Methodsin
Blood Pressure Measurements
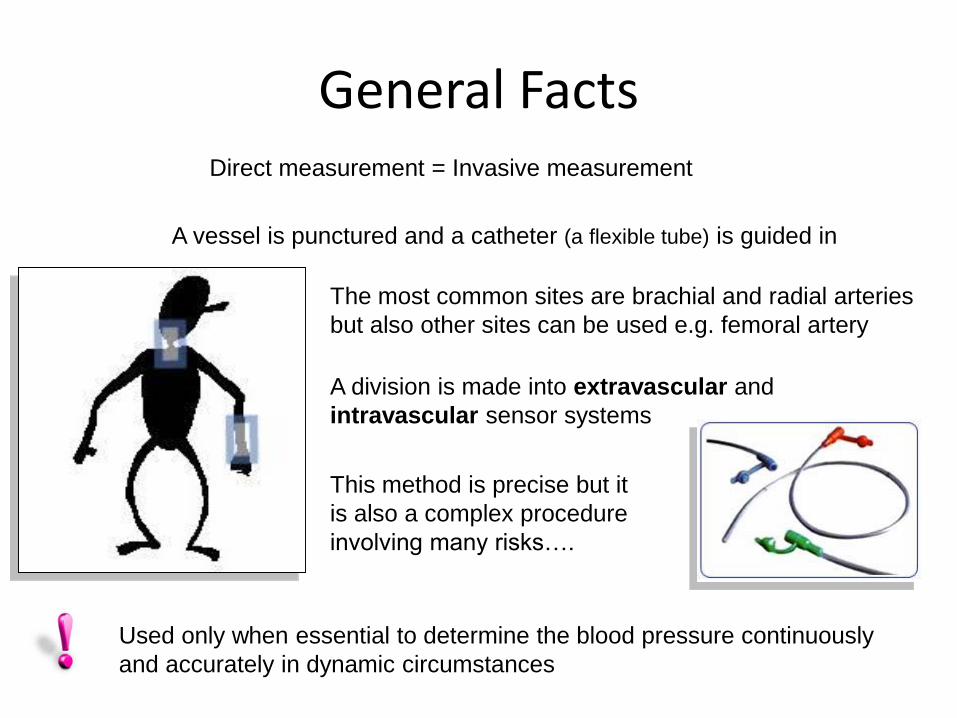
General FactsDirect measurement = Invasive measurement
Used only when essential to determine the blood pressure continuously
and accurately in dynamic circumstances
A vessel is punctured and a catheter (a flexible tube) is guided in
The most common sites are brachial and radial arteries
but also other sites can be used e.g. femoral artery
A division is made into extravascular and
intravascular sensor systems
This method is precise but it
is also a complex procedure
involving many risks….
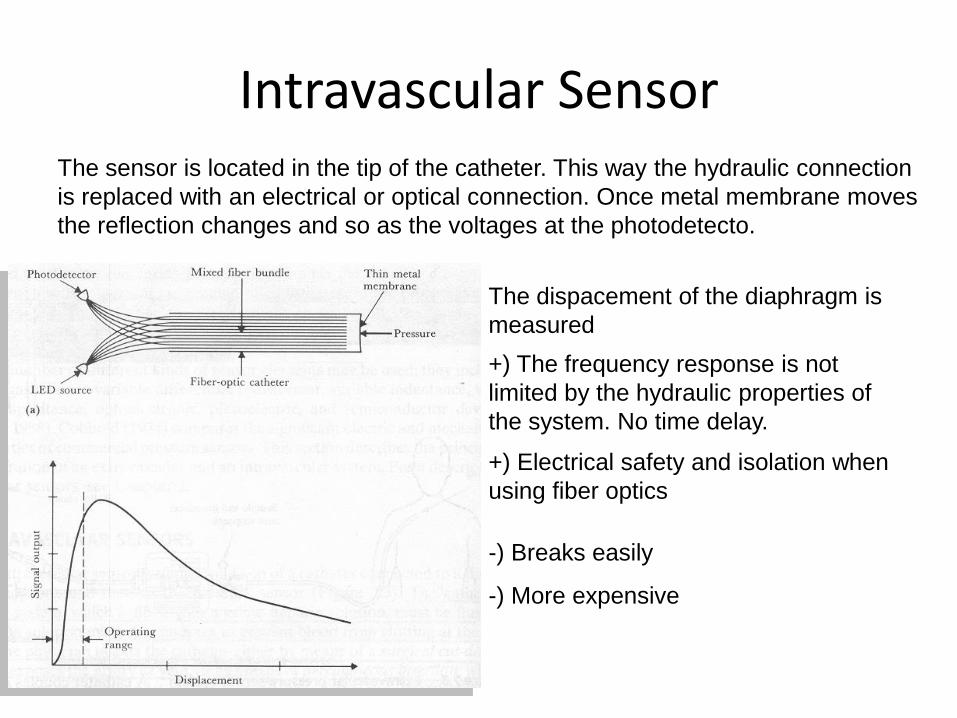
Intravascular Sensor The sensor is located in the tip of the catheter. This way the hydraulic connection
is replaced with an electrical or optical connection. Once metal membrane moves
the reflection changes and so as the voltages at the photodetecto.
+) The frequency response is not
limited by the hydraulic properties of
the system. No time delay.
-) Breaks easily
-) More expensive
+) Electrical safety and isolation when
using fiber optics
The dispacement of the diaphragm is
measured
Intravascular Sensor
The transducer is at the tip of the catheter in this type of device. Then the measured signal is not affected by the hydraulics of the fluid in the catheter. The catheter diameter is larger in this class of transducers.
The catheter in this type of device is filled with a saline
solution, which transmits the pressure to a chamber that
houses the transducer assembly. As a minor disadvantage,
this structure affects the measured pressure through the
dynamic behavior of the catheter. As the catheter has a
known behavior, this effect can be minimized to
Insignificant levels through computational compensation.
Extravascular Sensor
Extravascular Sensor
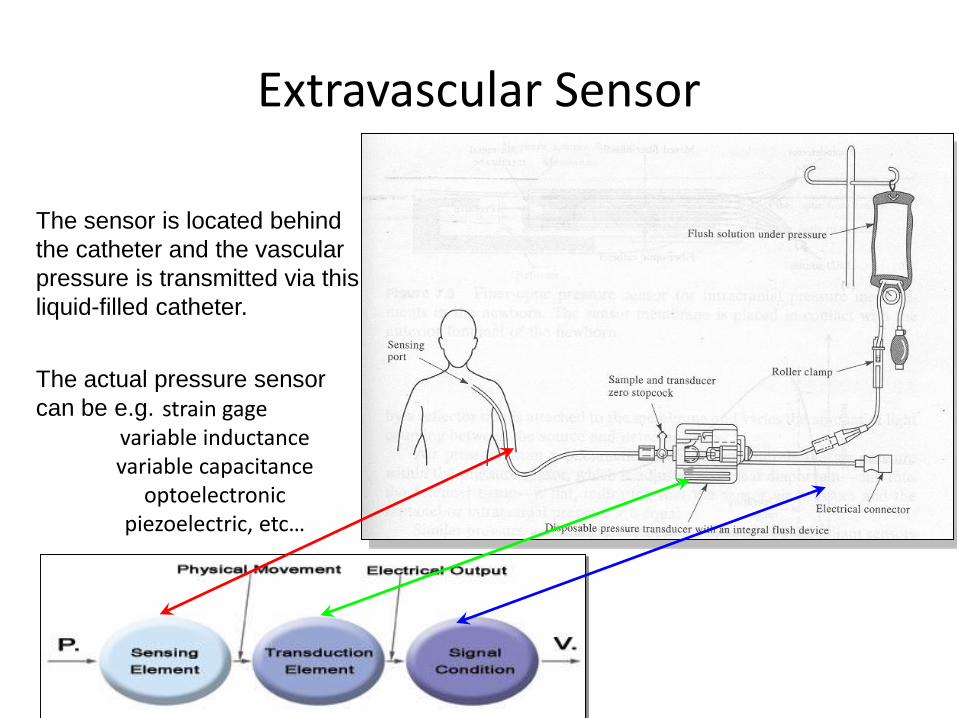
The sensor is located behind
the catheter and the vascular
pressure is transmitted via this
liquid-filled catheter.
The actual pressure sensor
can be e.g. strain gagevariable inductancevariable capacitance
optoelectronicpiezoelectric, etc…
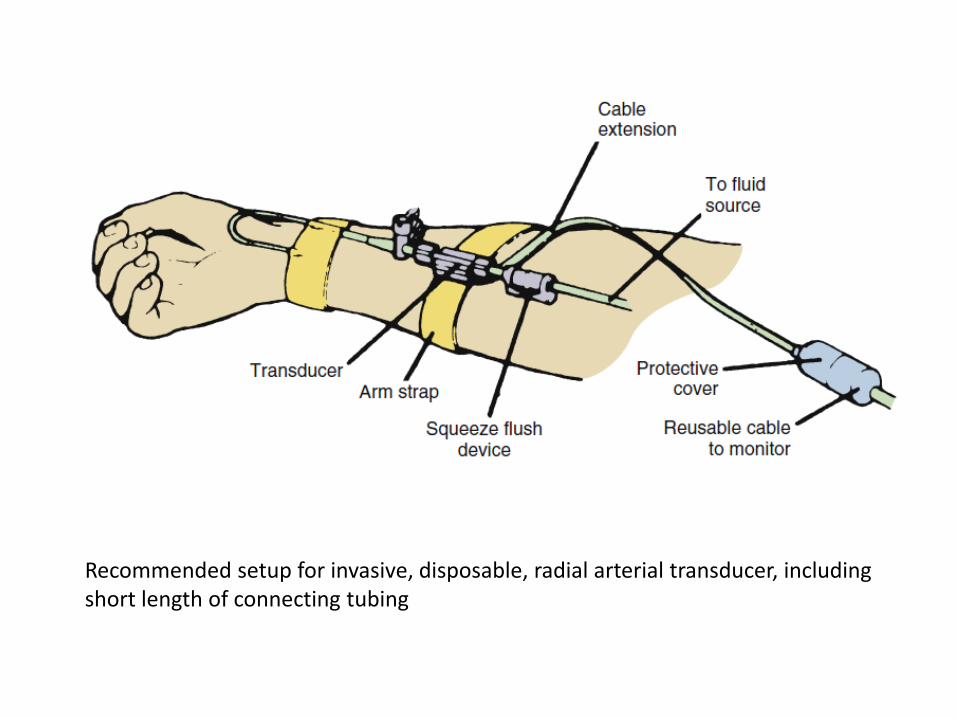
Recommended setup for invasive, disposable, radial arterial transducer, including short length of connecting tubing
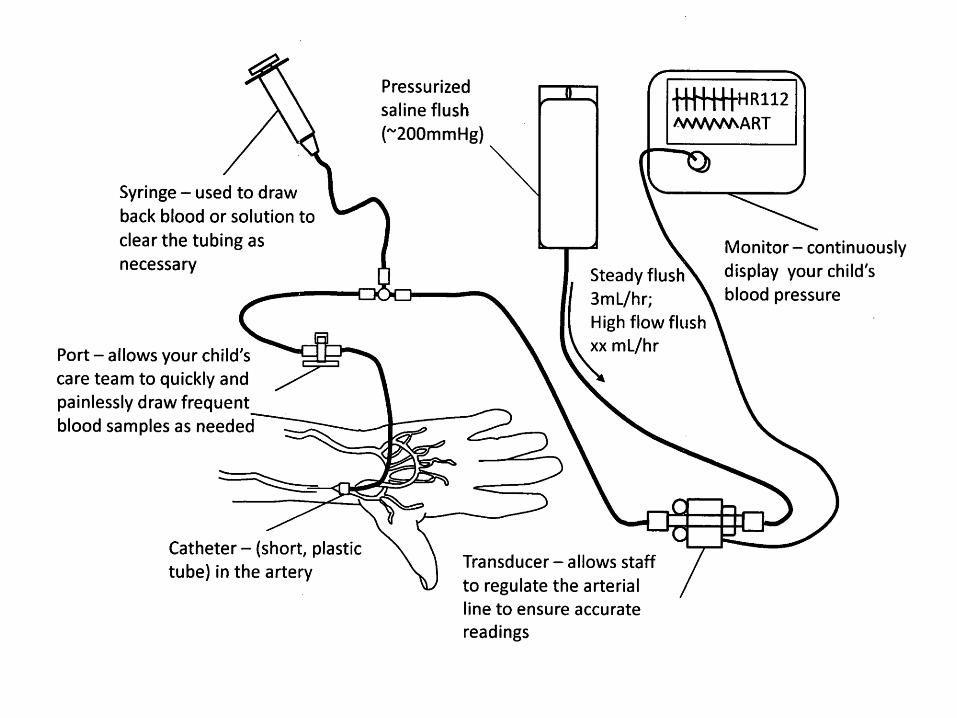
The usual method of invasive blood pressure monitoring consists of the percutaneous insertion of a small-bore (18- to 22-gauge) plastic catheter into a peripheral artery. The catheter is physically connected via high-pressure plastic tubing to an electronic pressure transducer and display unit. The transducer is a sterile, miniature, self-contained assembly that contains the electromechanical components within a clear plastic case. Most transducers incorporate an integral mechanism for providing a continuous, slow flush of sterile solution through the tubing and catheter to prevent clotting. In addition, a mechanism for rapid manual flushing is provided. The entire assembly is designed for single-patient use at a cost of approximately 2000Rs per patient.
Extravascular Sensor (cont.)The hydraylic link is the major source of errors. The system’s natural
frequency may be damped and degraded due (e.g.):
• too narrow catheter
• too long tubing
• various narrow connections
• air bubbles in the catheter
The catheter-sensor system must be flushed with saline solution every few
minutes in order to prevent blood from clotting.
.
Design considerations
• Damping of the system
• Resonance of the system
• Arterial catheter must be short and with the maximum gauge possible
• Column of saline must be as short as possible
• The catheter and tubing must be stiff walled
• The transducer diaphragm must be a rigid as possible
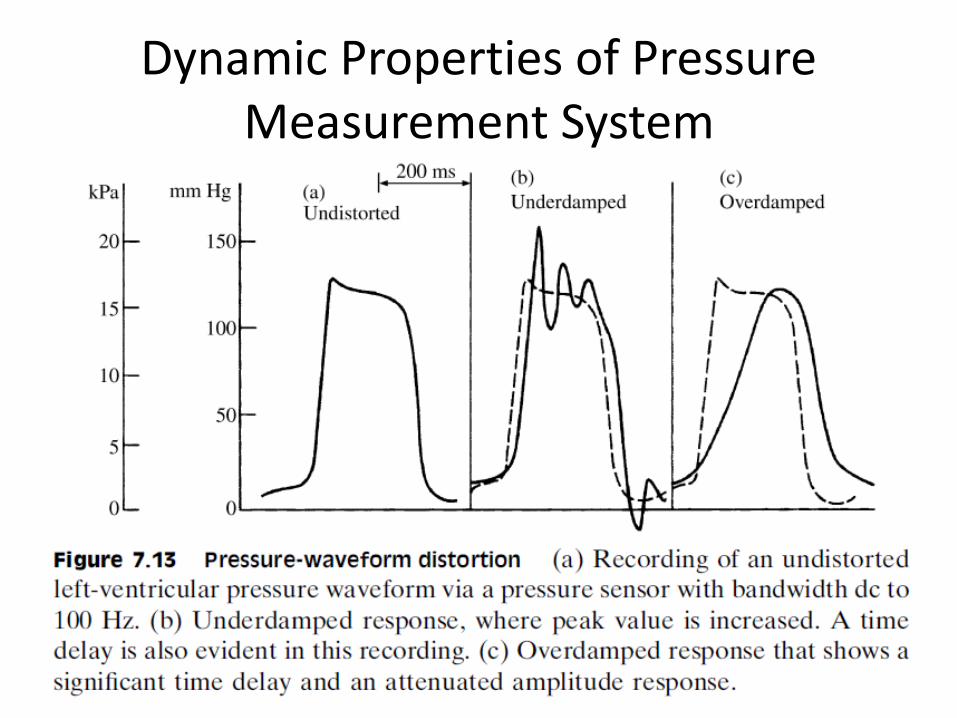
Dynamic Properties of Pressure Measurement System
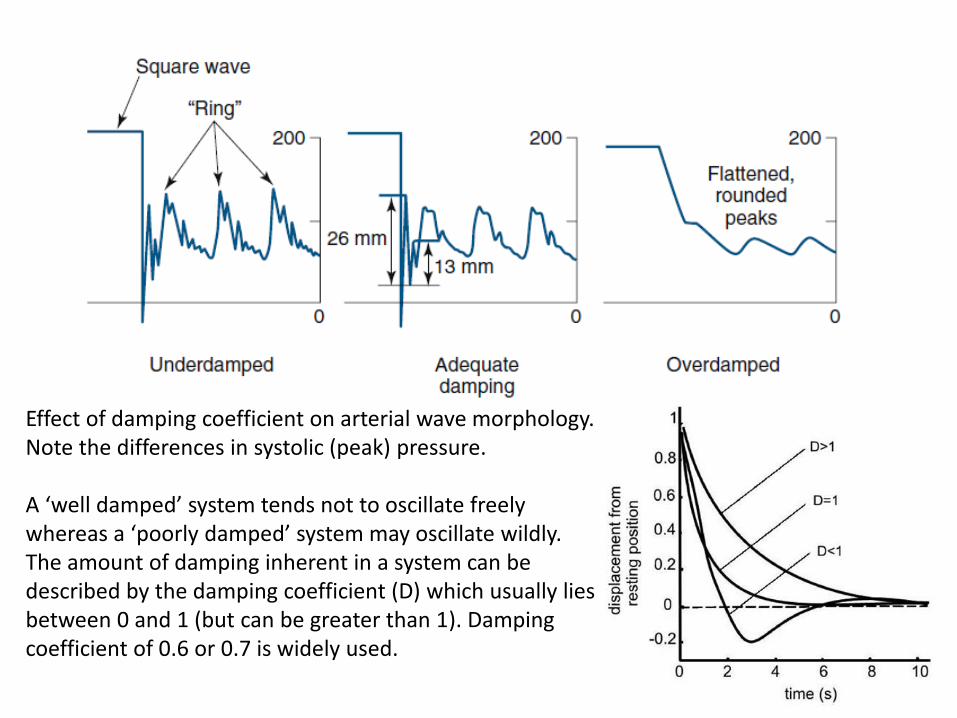
Effect of damping coefficient on arterial wave morphology. Note the differences in systolic (peak) pressure.
A ‘well damped’ system tends not to oscillate freely whereas a ‘poorly damped’ system may oscillate wildly. The amount of damping inherent in a system can be described by the damping coefficient (D) which usually lies between 0 and 1 (but can be greater than 1). Damping coefficient of 0.6 or 0.7 is widely used.
Dynamic Properties of Pressure Measurement System
Errors in measurement of dynamic pressure can have serious consequences in the clinical situation. For instance, an underdamped system can lead to overestimation of pressure gradients across stenotic(narrowed) heart valves.
If the input of energy into a system is occurring at the same frequency (or close to) the natural frequency, a phenomenon called resonance occurs and the output amplitude of the oscillations is greatly magnified. In the case of intra-arterial blood pressure monitoring this could lead to over-reading of the systolic blood pressure. Arterial pulsation is a complex sine wave and is composed of many individual sine waves. It is therefore important that the natural frequency of the measuring equipment (the catheter and column of saline etc) does not correspond to any of the component frequencies of the arterial pulsation input.
This is achieved by making sure that the natural frequency of the measuring system is raised above any of the component frequencies of the arterial sine waveform. So we need to perform harmonics analysis of blood pressure wave in order to find out the natural frequency.
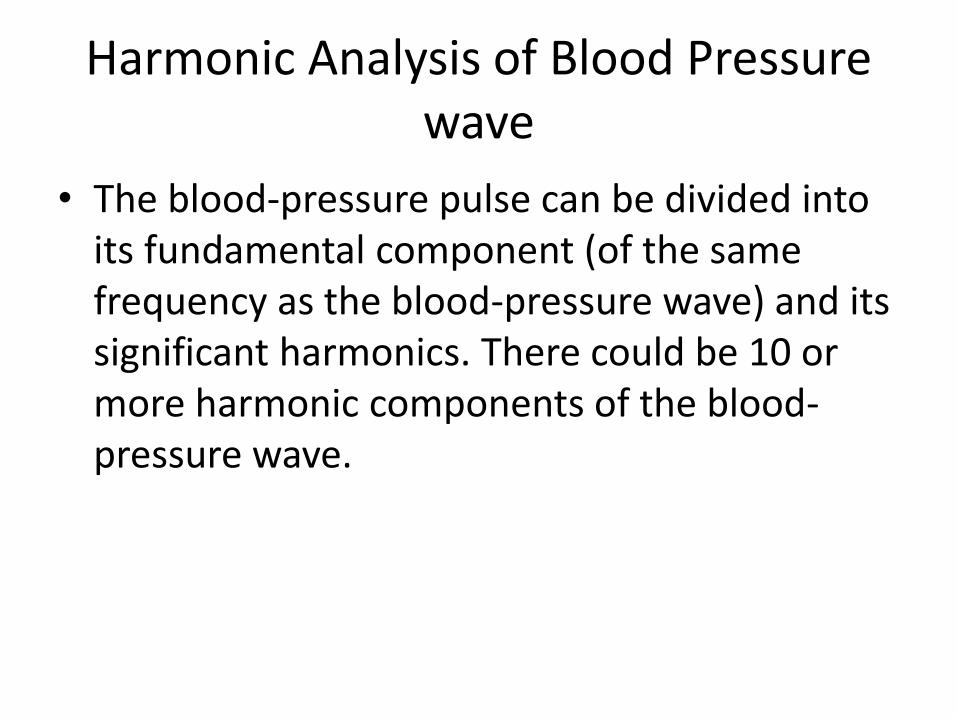
Harmonic Analysis of Blood Pressure wave
• The blood-pressure pulse can be divided into its fundamental component (of the same frequency as the blood-pressure wave) and its significant harmonics. There could be 10 or more harmonic components of the blood-pressure wave.
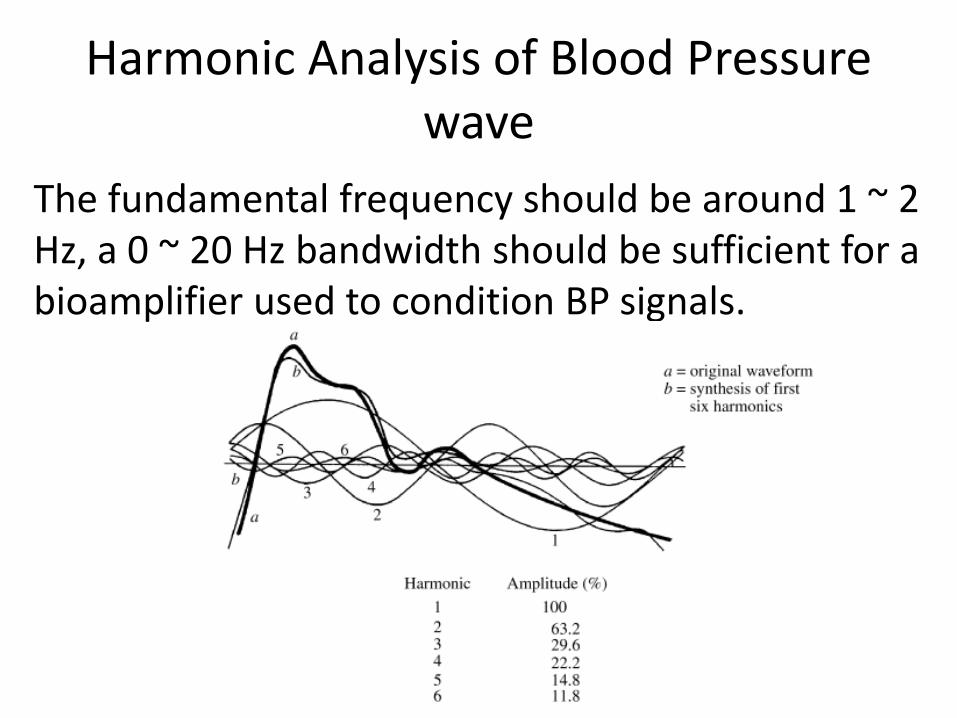
Harmonic Analysis of Blood Pressure wave
The fundamental frequency should be around 1 ~ 2 Hz, a 0 ~ 20 Hz bandwidth should be sufficient for a bioamplifier used to condition BP signals.
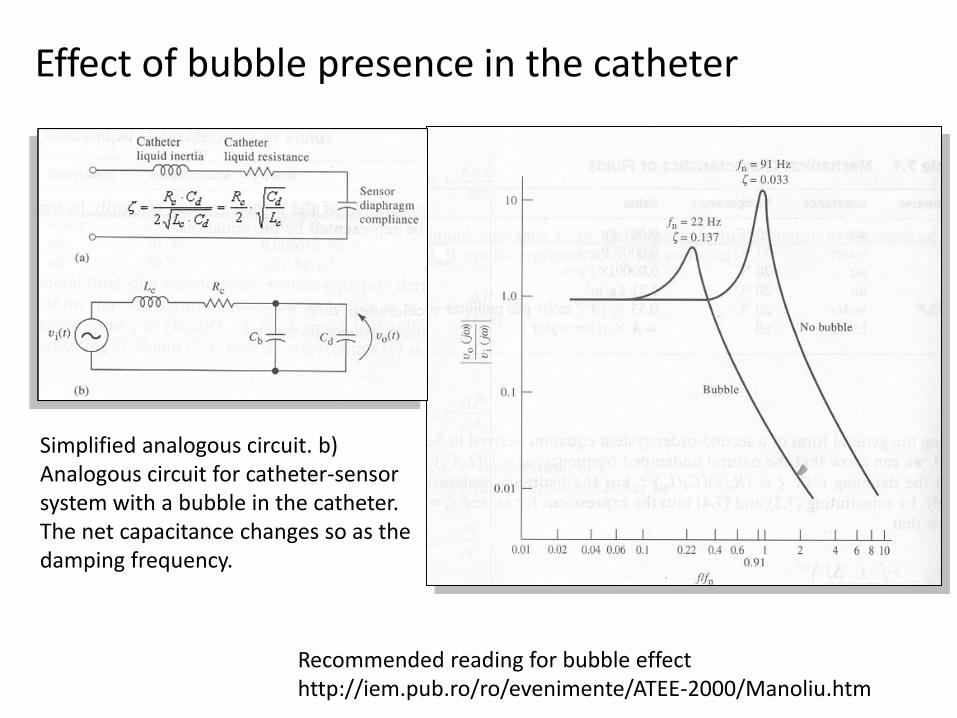
Effect of bubble presence in the catheter
Simplified analogous circuit. b) Analogous circuit for catheter-sensor system with a bubble in the catheter. The net capacitance changes so as the damping frequency.
Recommended reading for bubble effecthttp://iem.pub.ro/ro/evenimente/ATEE-2000/Manoliu.htm
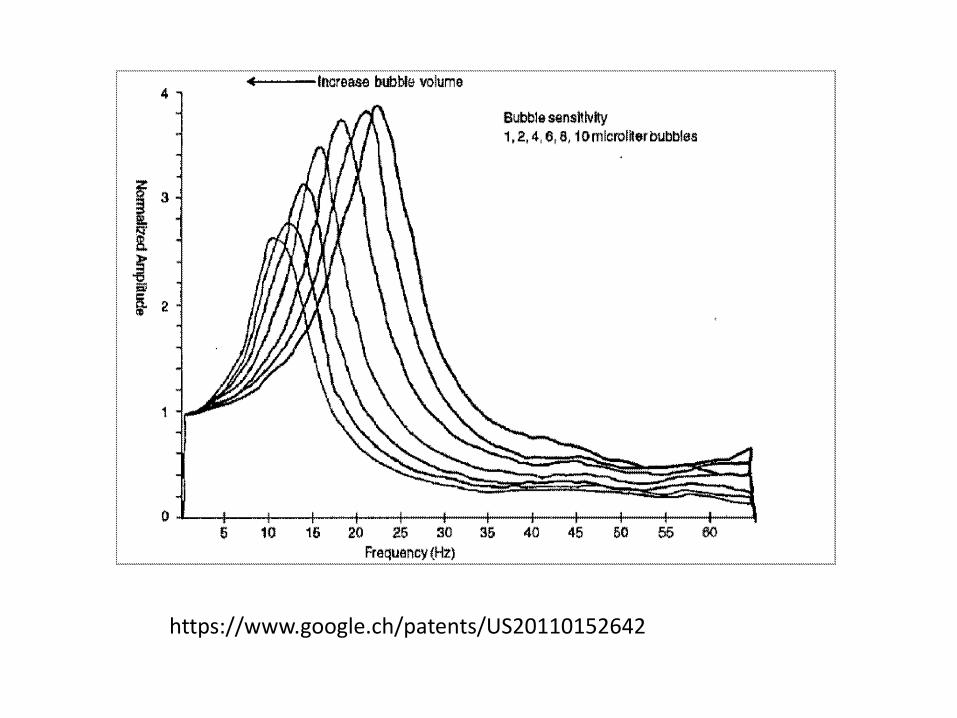
https://www.google.ch/patents/US20110152642
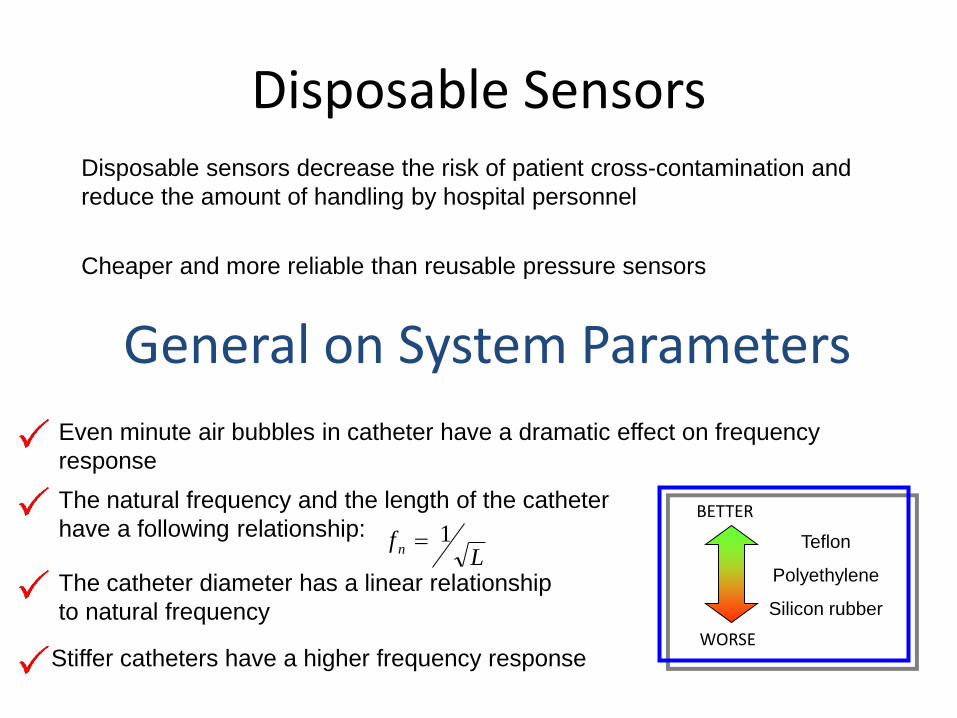
Disposable SensorsDisposable sensors decrease the risk of patient cross-contamination and
reduce the amount of handling by hospital personnel
Cheaper and more reliable than reusable pressure sensors
General on System Parameters
Even minute air bubbles in catheter have a dramatic effect on frequency
response
The natural frequency and the length of the catheter
have a following relationship:
The catheter diameter has a linear relationship
to natural frequency
Lf n
1
Stiffer catheters have a higher frequency response
Teflon
Polyethylene
Silicon rubber
BETTER
WORSE
Indirect Methodsin
Blood Flow Measurements
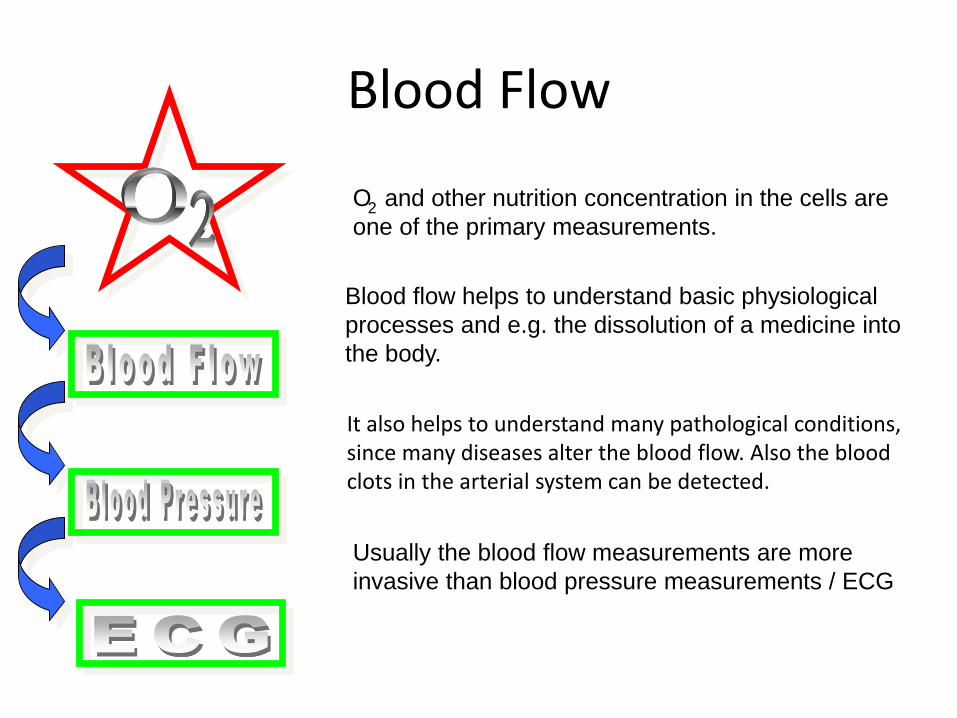
Blood Flow
O and other nutrition concentration in the cells are
one of the primary measurements.2
Blood flow helps to understand basic physiological
processes and e.g. the dissolution of a medicine into
the body.
Usually the blood flow measurements are more
invasive than blood pressure measurements / ECG
It also helps to understand many pathological conditions,since many diseases alter the blood flow. Also the bloodclots in the arterial system can be detected.
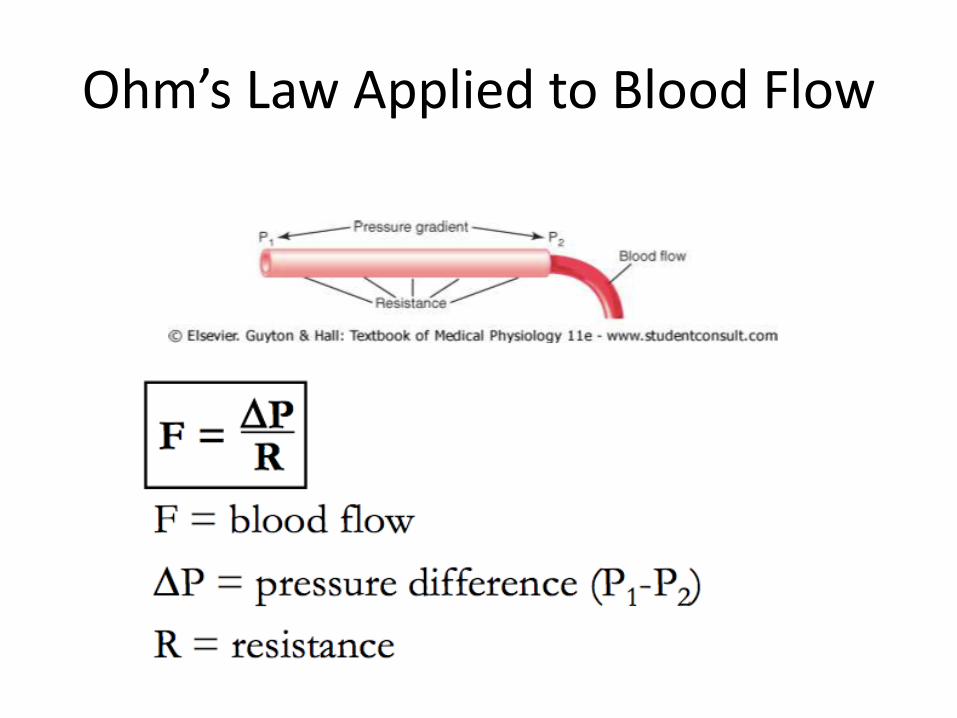
Ohm’s Law Applied to Blood Flow
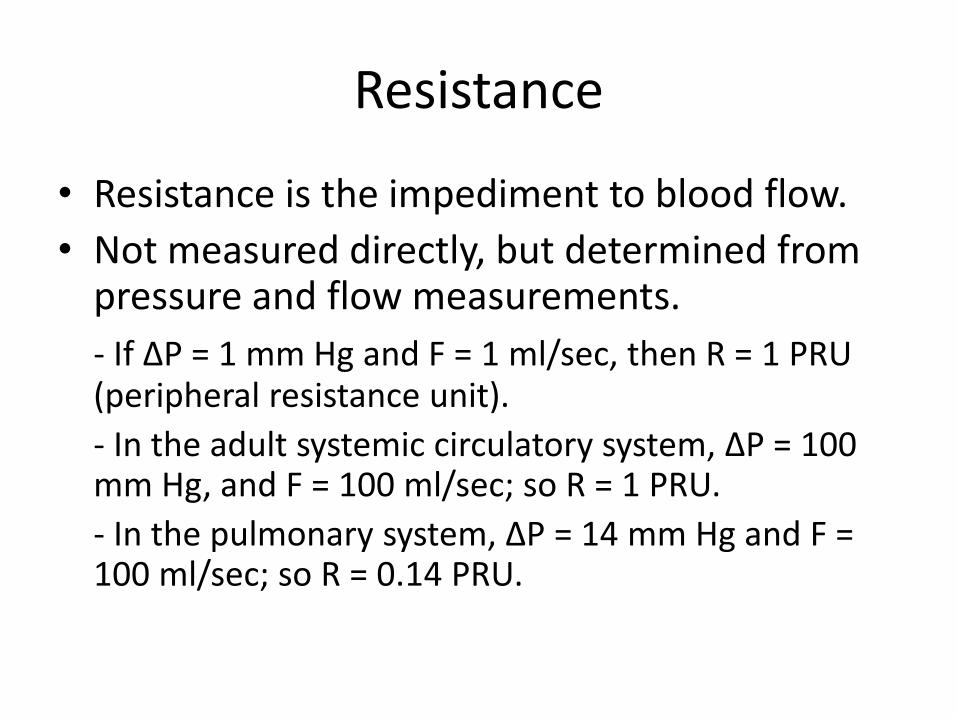
Resistance
• Resistance is the impediment to blood flow.
• Not measured directly, but determined from pressure and flow measurements.
- If ΔP = 1 mm Hg and F = 1 ml/sec, then R = 1 PRU (peripheral resistance unit).
- In the adult systemic circulatory system, ΔP = 100 mm Hg, and F = 100 ml/sec; so R = 1 PRU.
- In the pulmonary system, ΔP = 14 mm Hg and F = 100 ml/sec; so R = 0.14 PRU.
Conductance
• Conductance is the opposite of resistance:
Conductance = 1/resistance
• Conductance may be easier to conceptualize than resistance and is sometimes easier to use in calculating the total resistance of parallel vessels.
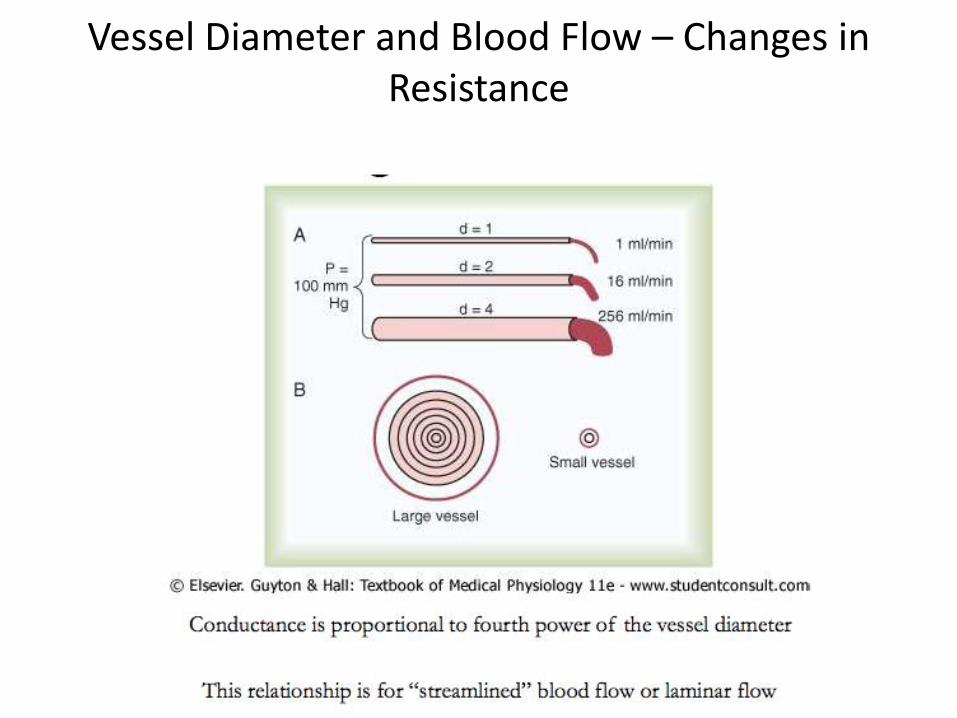
Vessel Diameter and Blood Flow – Changes in Resistance
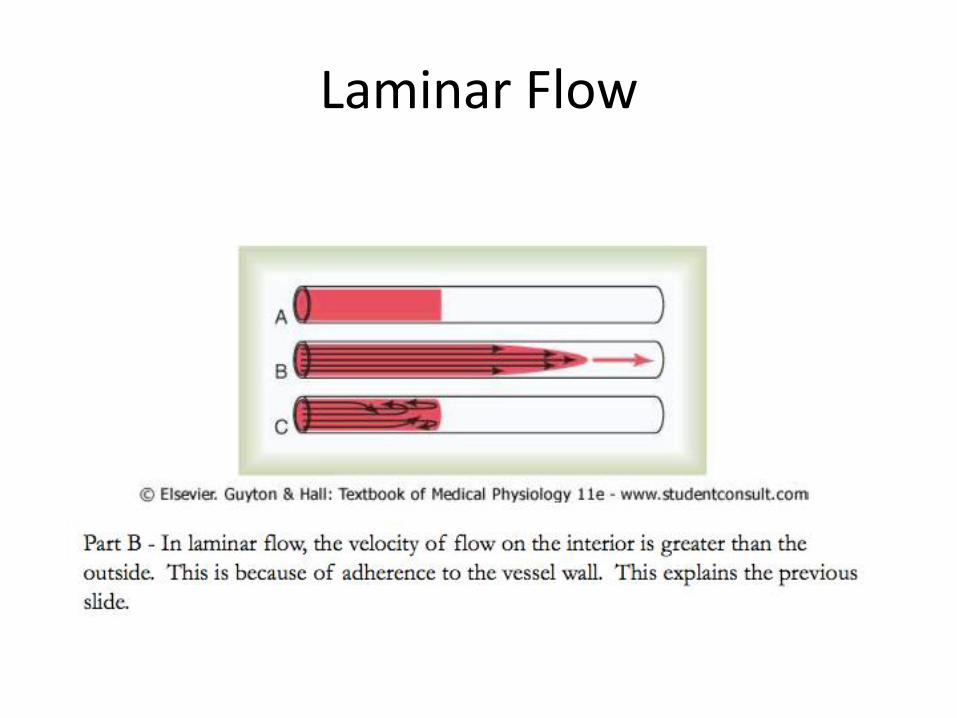
Laminar Flow

Poiseuille’s Law
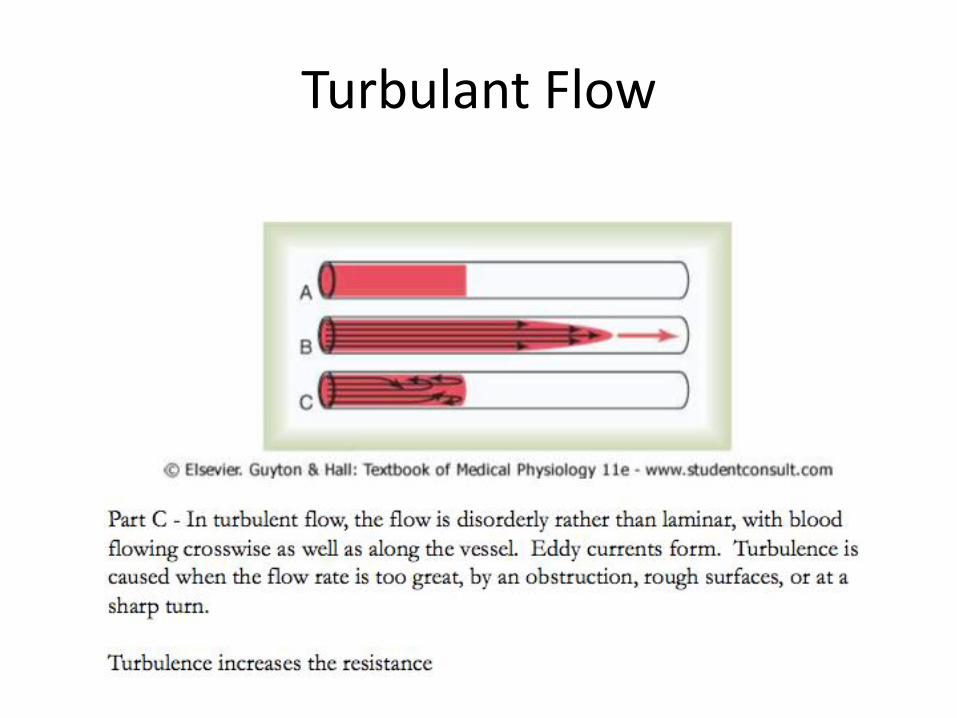
Turbulant Flow
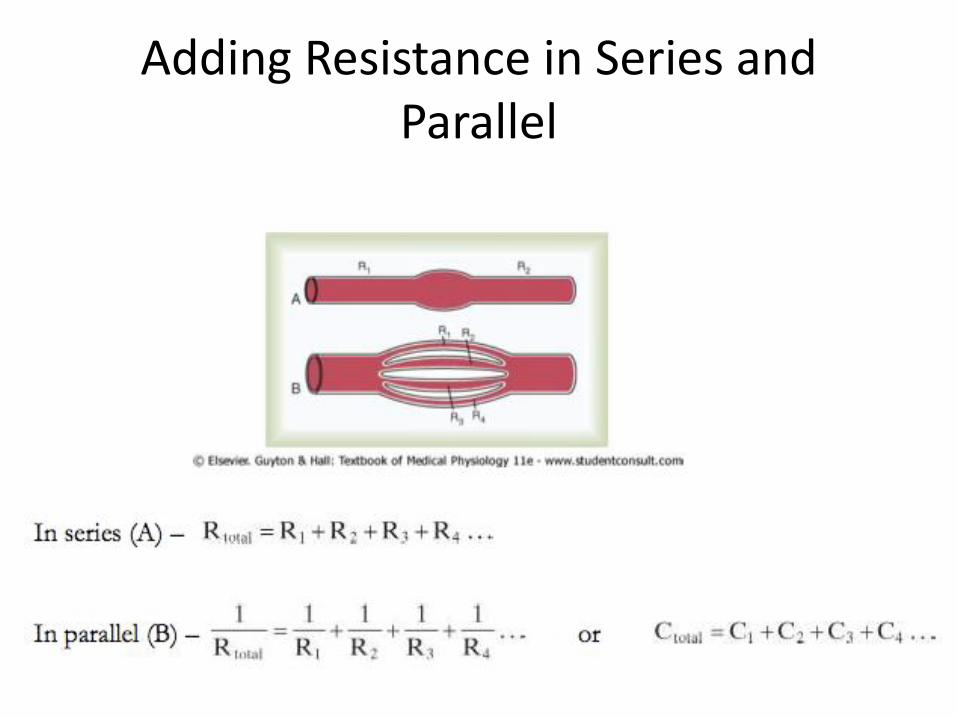
Adding Resistance in Series and Parallel

Effect of Viscosity on Resistance and Blood Flow
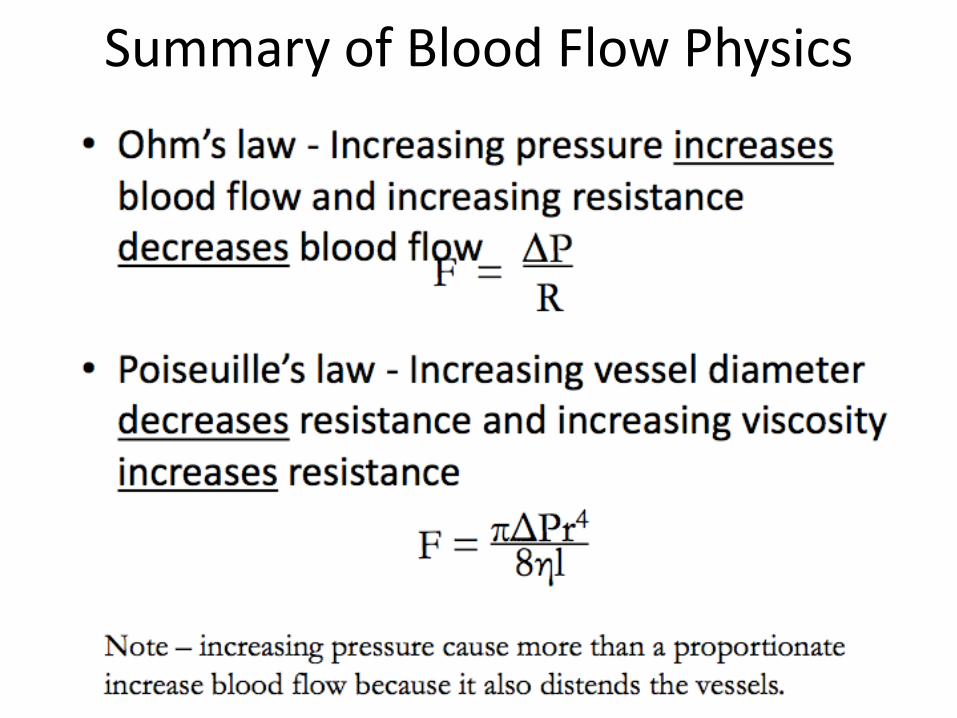
Summary of Blood Flow Physics
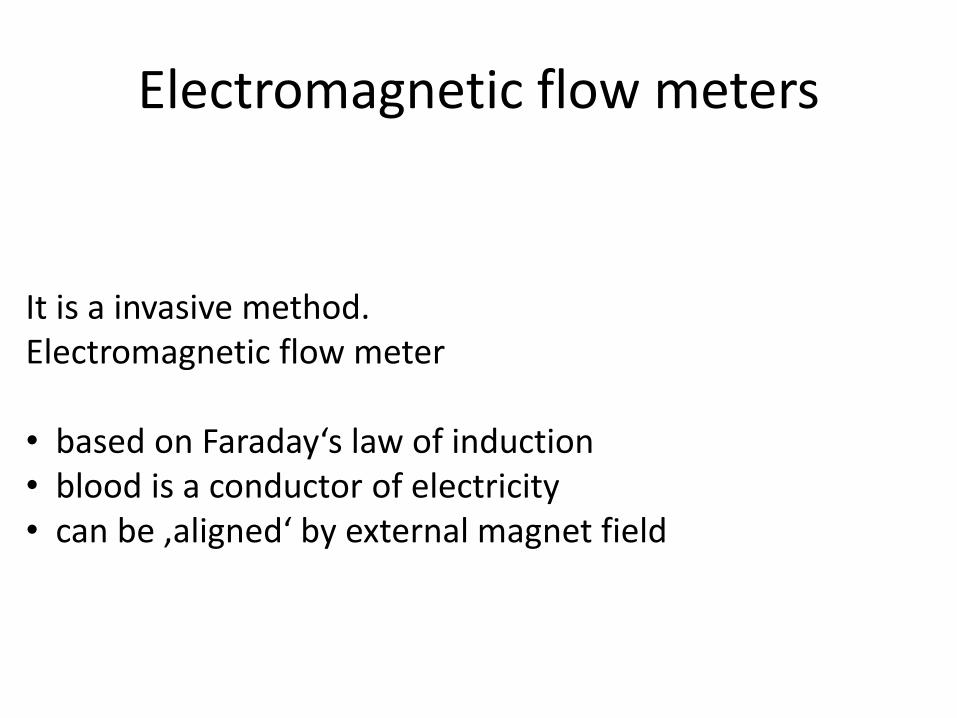
Electromagnetic flow meters
It is a invasive method.Electromagnetic flow meter
• based on Faraday‘s law of induction • blood is a conductor of electricity • can be ‚aligned‘ by external magnet field
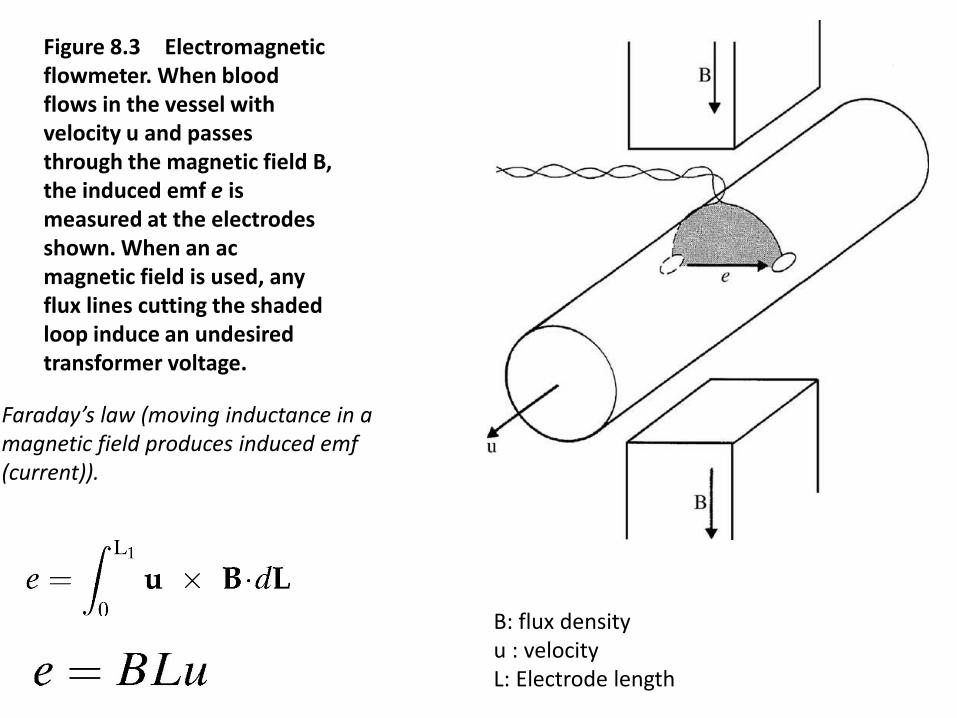
Figure 8.3 Electromagnetic flowmeter. When blood flows in the vessel with velocity u and passes through the magnetic field B, the induced emf e is measured at the electrodes shown. When an ac magnetic field is used, any flux lines cutting the shaded loop induce an undesired transformer voltage.
Faraday’s law (moving inductance in a magnetic field produces induced emf(current)).
B: flux densityu : velocity L: Electrode length
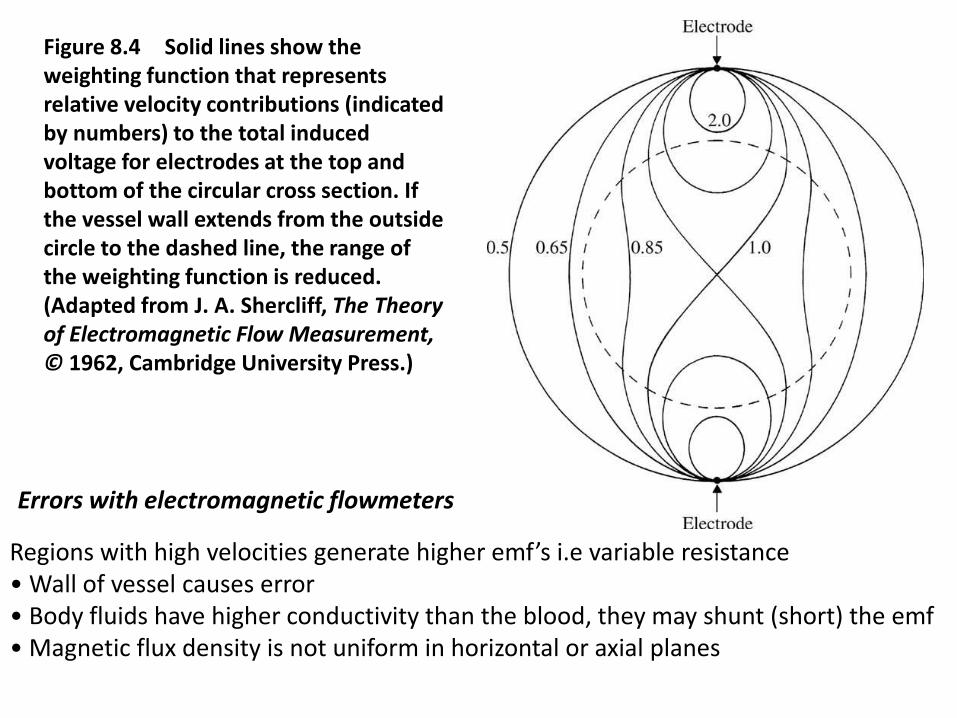
Figure 8.4 Solid lines show the weighting function that represents relative velocity contributions (indicated by numbers) to the total induced voltage for electrodes at the top and bottom of the circular cross section. If the vessel wall extends from the outside circle to the dashed line, the range of the weighting function is reduced. (Adapted from J. A. Shercliff, The Theory of Electromagnetic Flow Measurement, © 1962, Cambridge University Press.)
Regions with high velocities generate higher emf’s i.e variable resistance• Wall of vessel causes error• Body fluids have higher conductivity than the blood, they may shunt (short) the emf• Magnetic flux density is not uniform in horizontal or axial planes
Errors with electromagnetic flowmeters
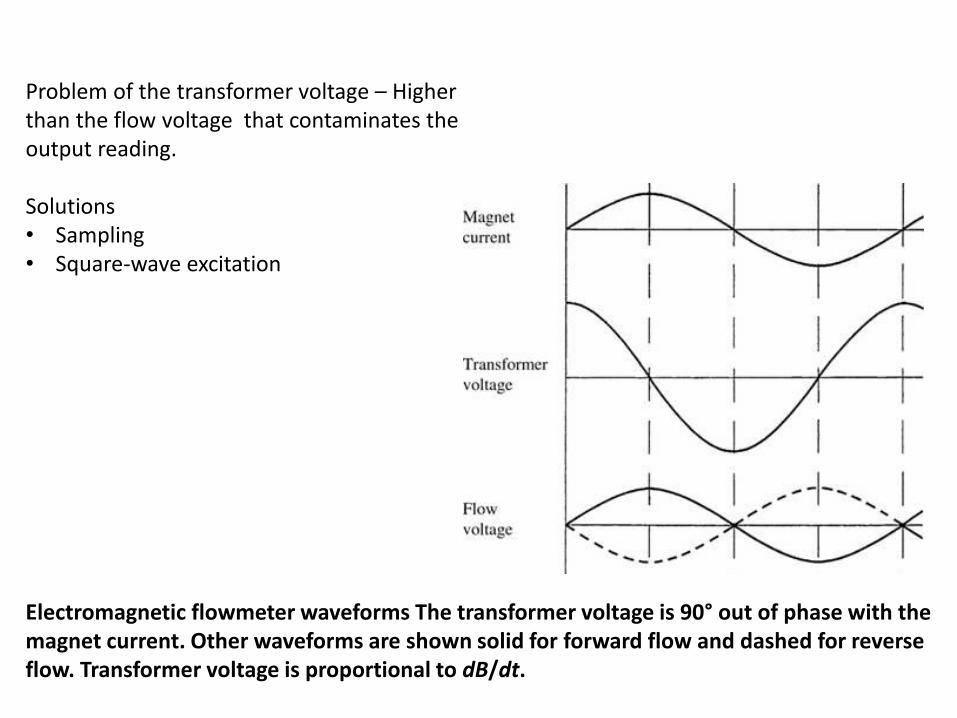
Problem of the transformer voltage – Higher than the flow voltage that contaminates the output reading.
Solutions • Sampling • Square-wave excitation
Electromagnetic flowmeter waveforms The transformer voltage is 90° out of phase with the magnet current. Other waveforms are shown solid for forward flow and dashed for reverse flow. Transformer voltage is proportional to dB/dt.
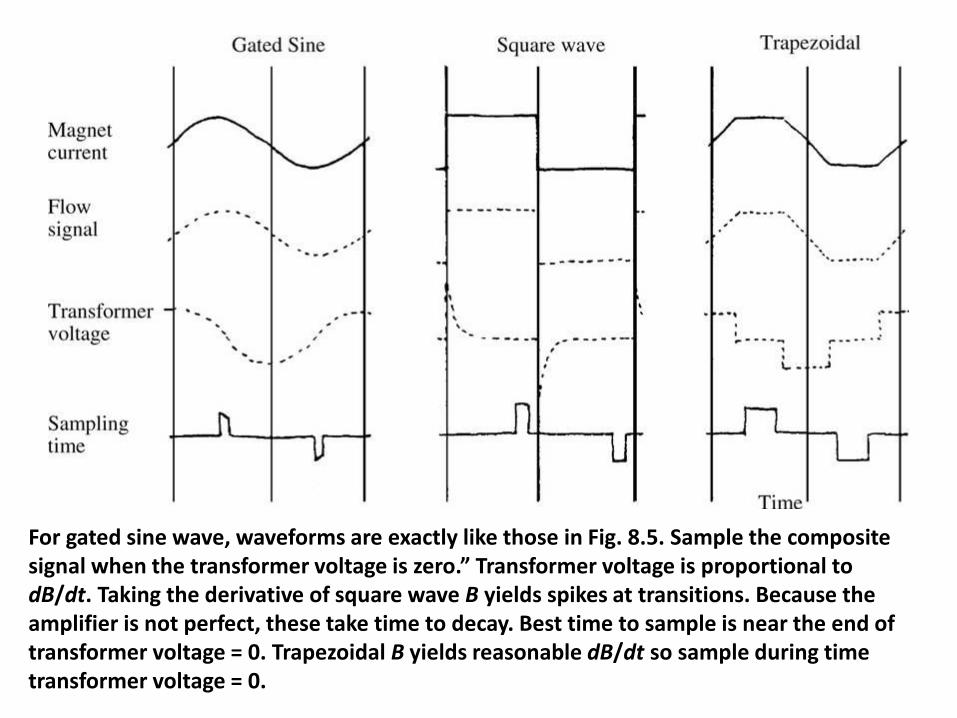
For gated sine wave, waveforms are exactly like those in Fig. 8.5. Sample the composite signal when the transformer voltage is zero.” Transformer voltage is proportional to dB/dt. Taking the derivative of square wave B yields spikes at transitions. Because the amplifier is not perfect, these take time to decay. Best time to sample is near the end of transformer voltage = 0. Trapezoidal B yields reasonable dB/dt so sample during time transformer voltage = 0.
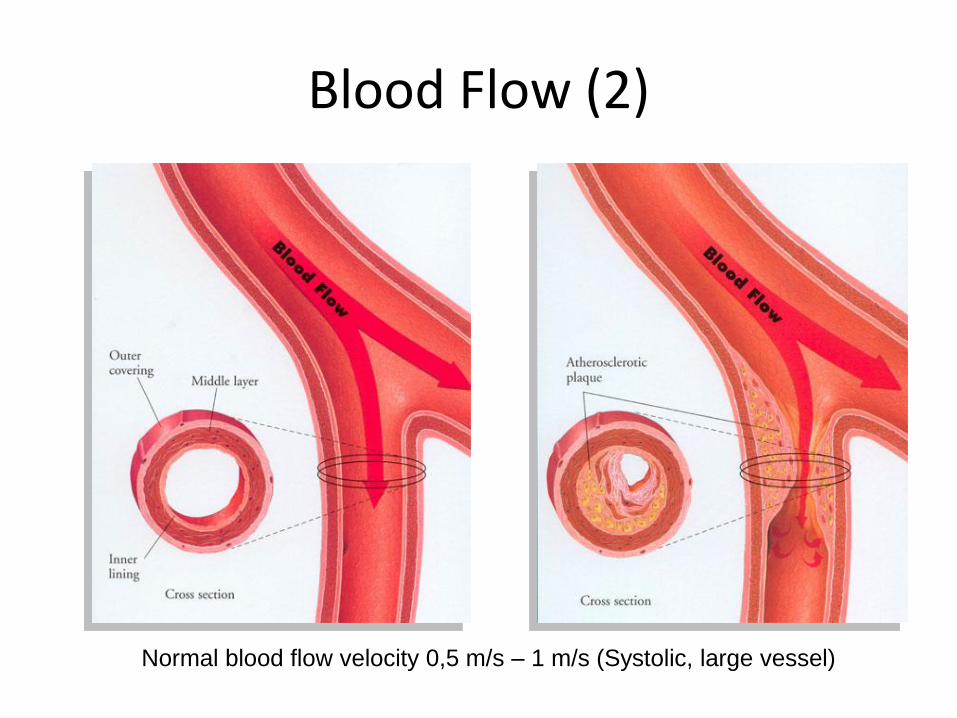
Blood Flow (2)
Normal blood flow velocity 0,5 m/s – 1 m/s (Systolic, large vessel)
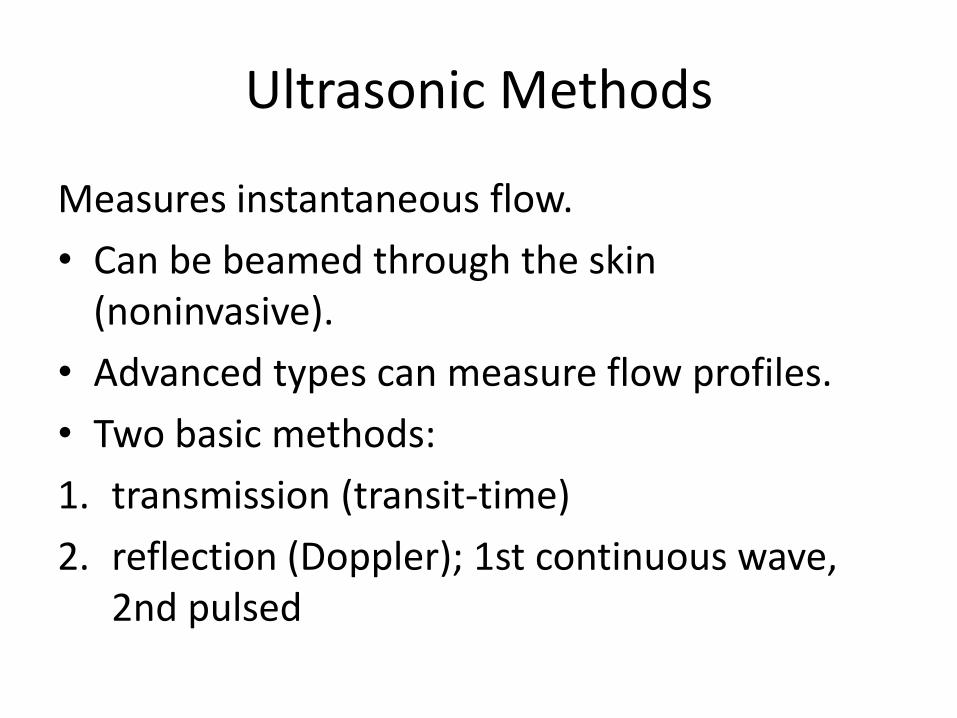
Ultrasonic Methods
Measures instantaneous flow.
• Can be beamed through the skin (noninvasive).
• Advanced types can measure flow profiles.
• Two basic methods:
1. transmission (transit-time)
2. reflection (Doppler); 1st continuous wave, 2nd pulsed
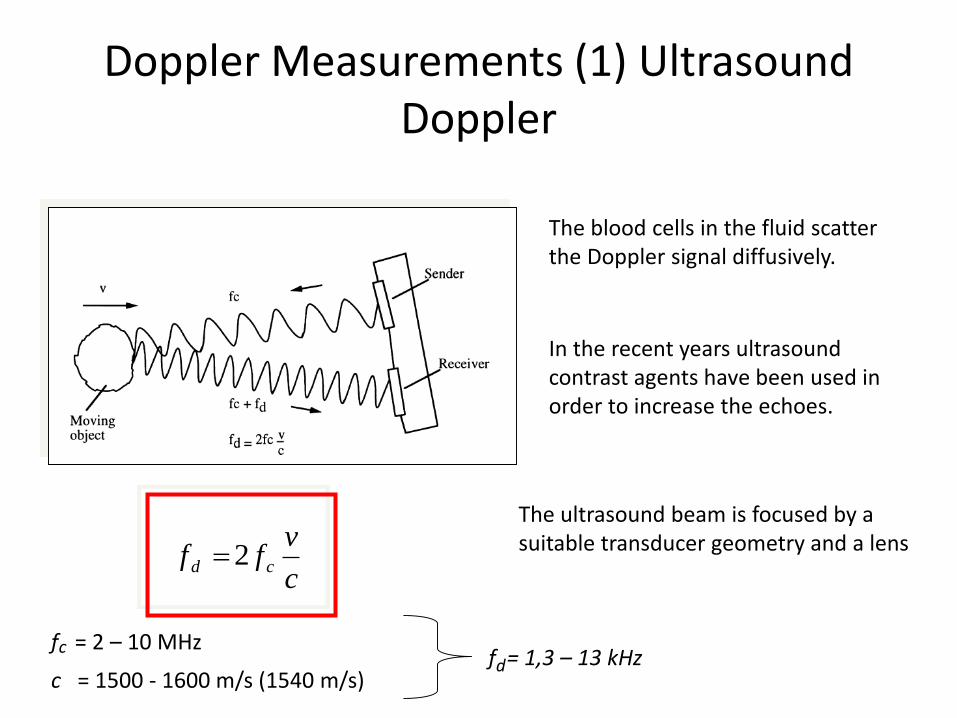
Doppler Measurements (1) Ultrasound Doppler
The blood cells in the fluid scatter the Doppler signal diffusively.
In the recent years ultrasound contrast agents have been used in order to increase the echoes.
c
vff cd 2
f = 2 – 10 MHzc
c = 1500 - 1600 m/s (1540 m/s)f = 1,3 – 13 kHzd
The ultrasound beam is focused by a suitable transducer geometry and a lens
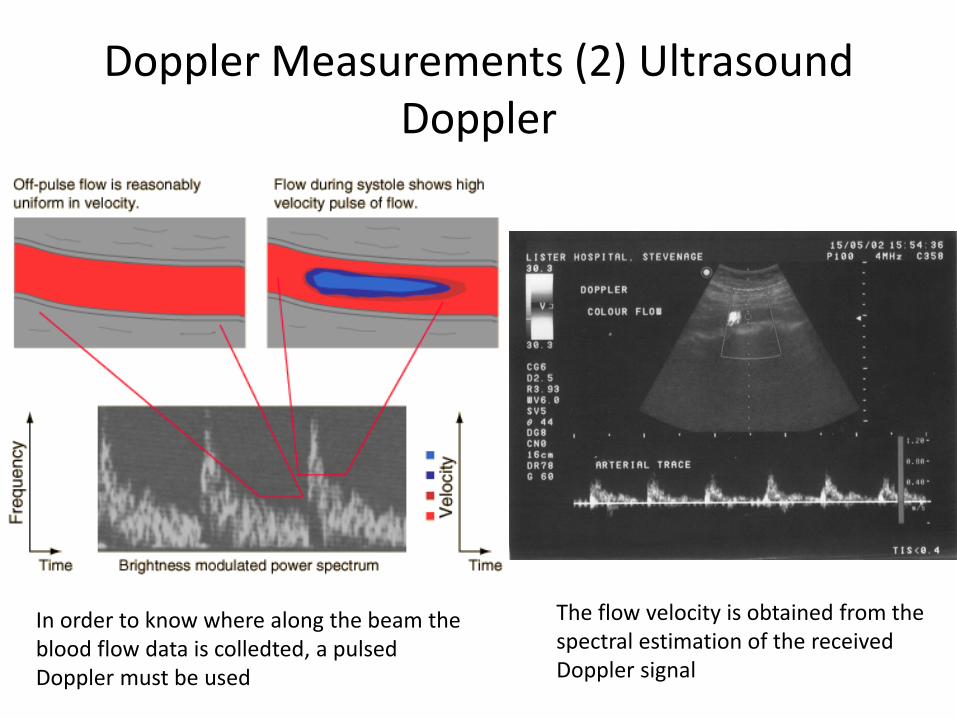
Doppler Measurements (2) Ultrasound Doppler
The flow velocity is obtained from the spectral estimation of the received Doppler signal
In order to know where along the beam the blood flow data is colledted, a pulsed Doppler must be used
Doppler Measurements (3) Ultrasound Doppler
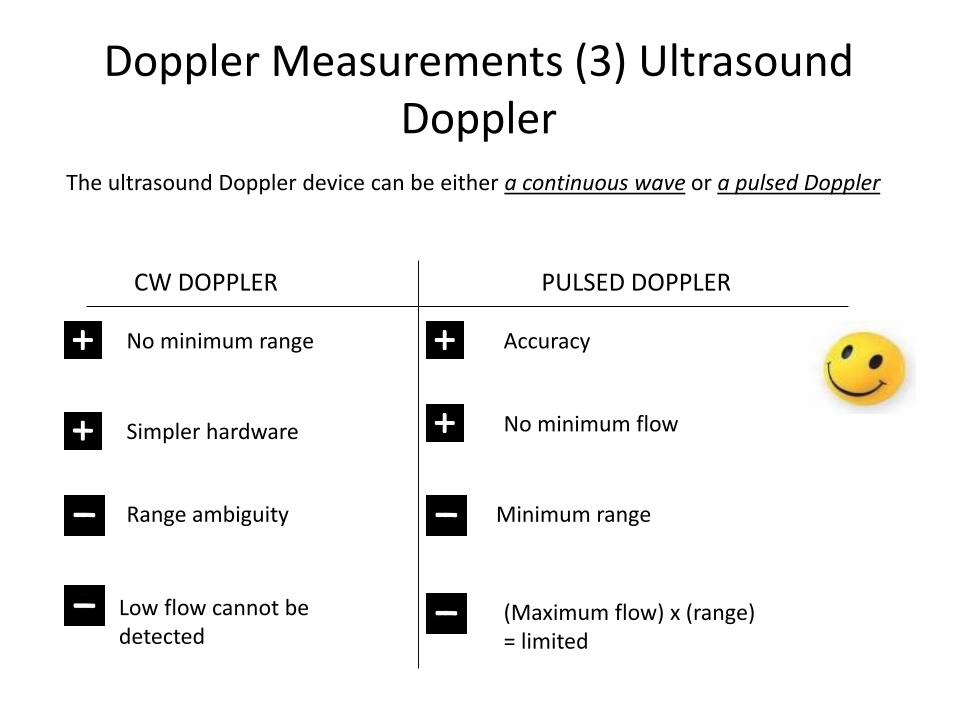
The ultrasound Doppler device can be either a continuous wave or a pulsed Doppler
CW DOPPLER PULSED DOPPLER
Range ambiguity
Low flow cannot be detected
No minimum range
Simpler hardware
Minimum range
Accuracy
No minimum flow
(Maximum flow) x (range)= limited
Doppler Measurements (4) Ultrasound Doppler
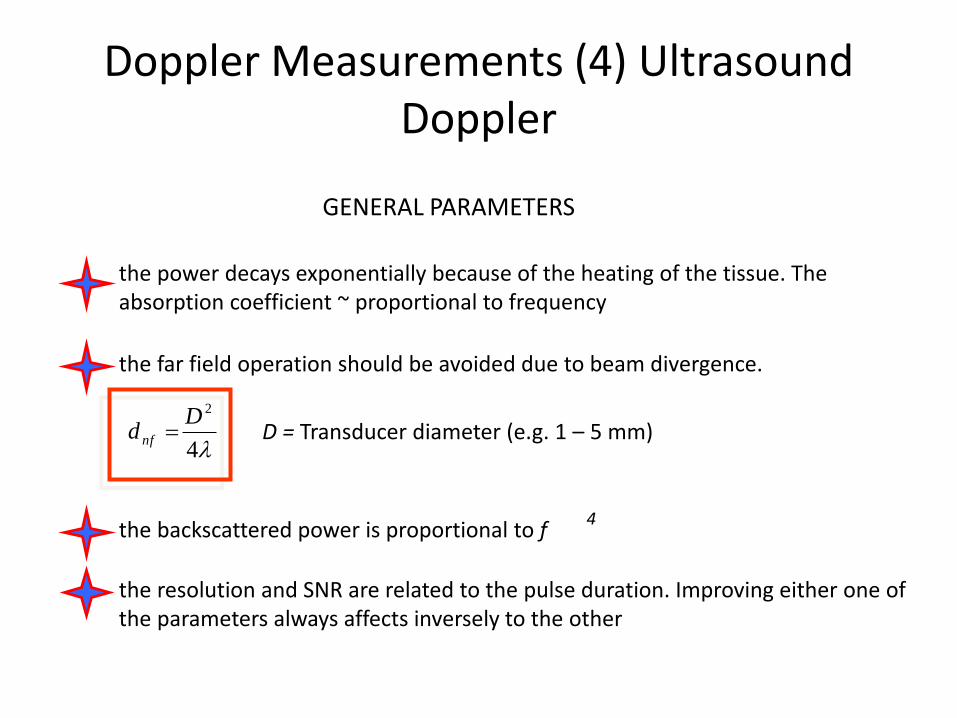
GENERAL PARAMETERS
the power decays exponentially because of the heating of the tissue. The absorption coefficient ~ proportional to frequency
the far field operation should be avoided due to beam divergence.
4
2Dd nf D = Transducer diameter (e.g. 1 – 5 mm)
the backscattered power is proportional to f4
the resolution and SNR are related to the pulse duration. Improving either one of the parameters always affects inversely to the other
Direct Methodsin
Blood Flow Measurements

Indicator Dilution Methods (1)Dye Dilution Method
A bolus of indicator, a colored dye (indocyanine green, cardiogreen), is rapidly injected in to the vessel. The concentration is measured in the downstream
The blood is drawn through a colorimetric cuvette and the concentration is measured using the principle of absorption photometry
amount of dye
peak CAvg. flow
dttTc
QF
t
bbb
1
0
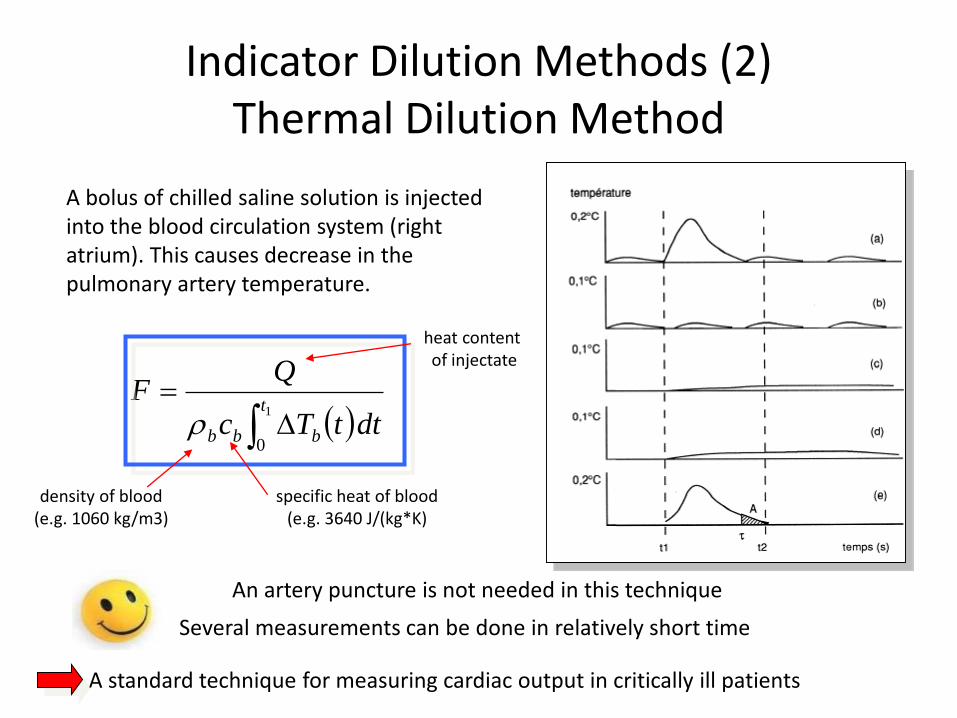
Indicator Dilution Methods (2)Thermal Dilution Method
A bolus of chilled saline solution is injected into the blood circulation system (right atrium). This causes decrease in the pulmonary artery temperature.
A standard technique for measuring cardiac output in critically ill patients
An artery puncture is not needed in this technique
heat content of injectate
Several measurements can be done in relatively short time
density of blood(e.g. 1060 kg/m3)
specific heat of blood(e.g. 3640 J/(kg*K)
Plethysmographyin
Blood Flow Measurements
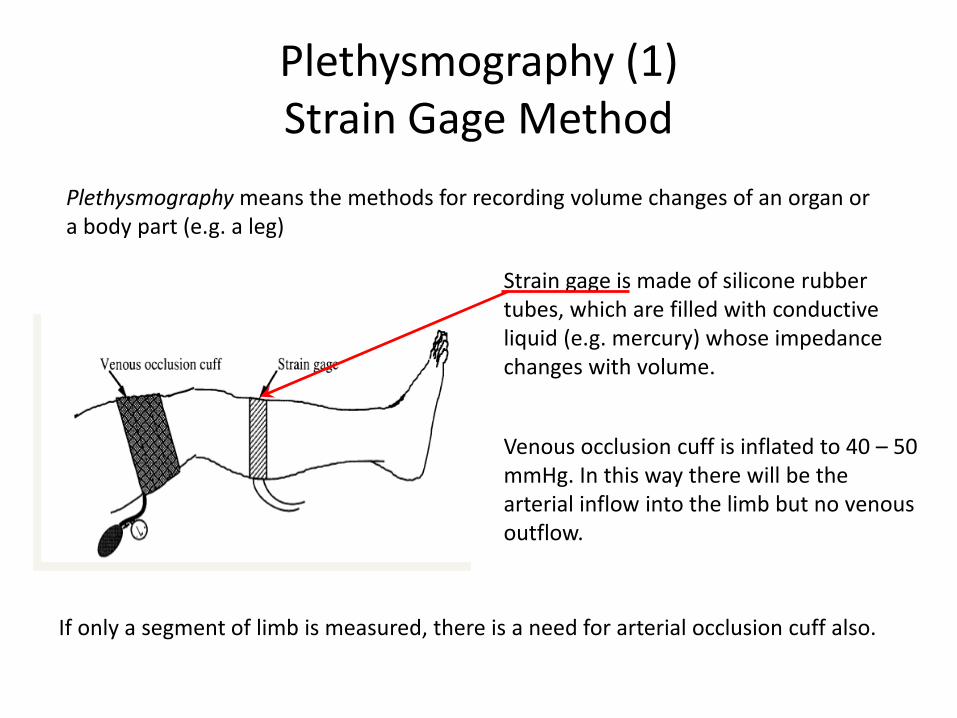
Plethysmography (1)Strain Gage Method
Plethysmography means the methods for recording volume changes of an organ or a body part (e.g. a leg)
Strain gage is made of silicone rubber tubes, which are filled with conductive liquid (e.g. mercury) whose impedance changes with volume.
Venous occlusion cuff is inflated to 40 – 50 mmHg. In this way there will be the arterial inflow into the limb but no venous outflow.
If only a segment of limb is measured, there is a need for arterial occlusion cuff also.
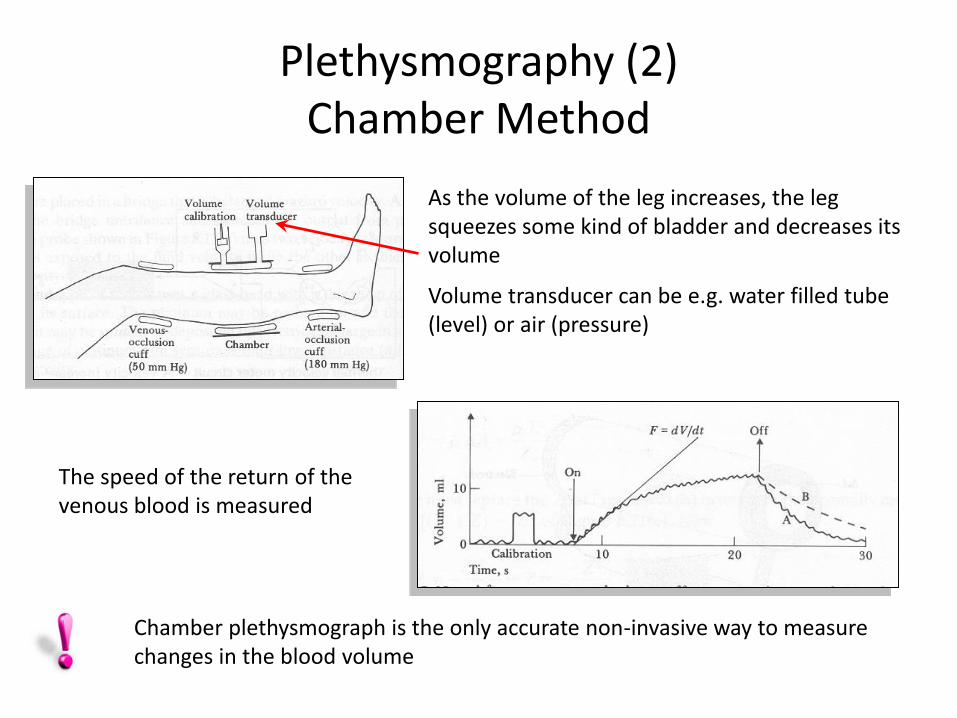
Plethysmography (2)Chamber Method
Chamber plethysmograph is the only accurate non-invasive way to measure changes in the blood volume
As the volume of the leg increases, the leg squeezes some kind of bladder and decreases its volume
Volume transducer can be e.g. water filled tube (level) or air (pressure)
The speed of the return of the venous blood is measured
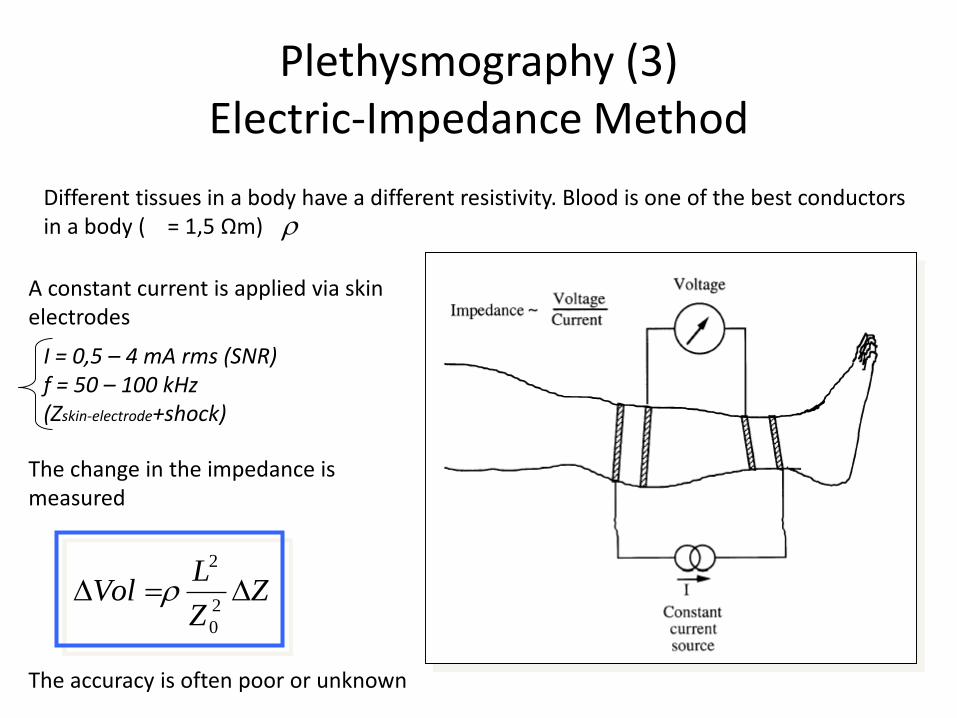
Plethysmography (3)Electric-Impedance Method
Different tissues in a body have a different resistivity. Blood is one of the best conductors in a body ( = 1,5 Ωm)
A constant current is applied via skin electrodes
The change in the impedance is measured
The accuracy is often poor or unknown
I = 0,5 – 4 mA rms (SNR)f = 50 – 100 kHz (Zskin-electrode+shock)
ZZ
LVol
2
0
2
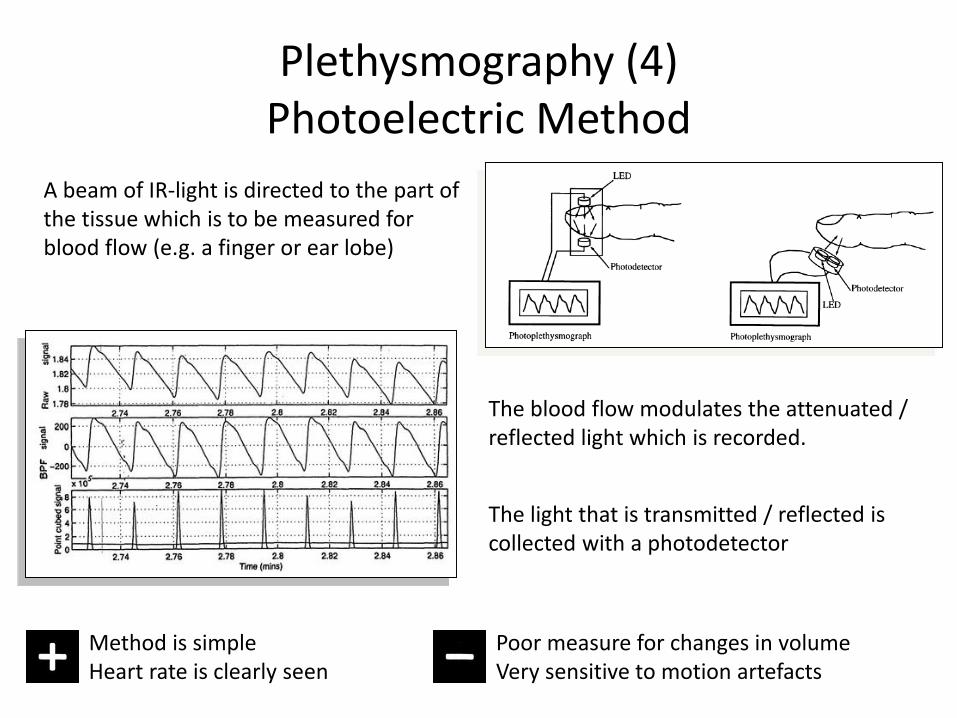
Plethysmography (4)Photoelectric Method
A beam of IR-light is directed to the part of the tissue which is to be measured for blood flow (e.g. a finger or ear lobe)
The light that is transmitted / reflected is collected with a photodetector
The blood flow modulates the attenuated / reflected light which is recorded.
Poor measure for changes in volumeVery sensitive to motion artefacts
Method is simple Heart rate is clearly seen
Other Methodsin
Blood Flow Measurements
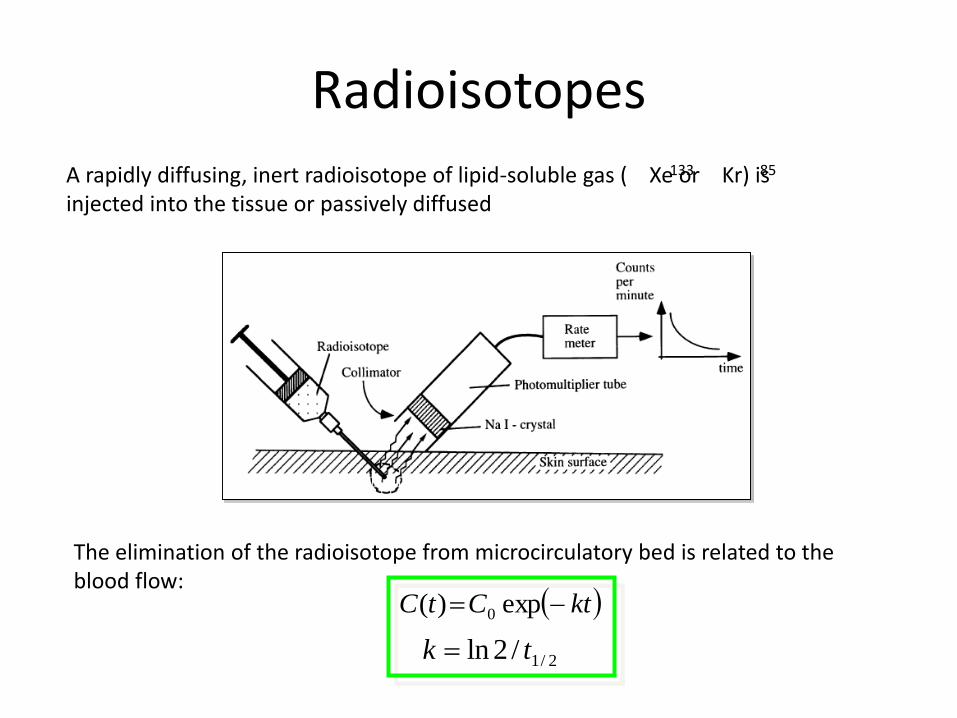
Radioisotopes
A rapidly diffusing, inert radioisotope of lipid-soluble gas ( Xe or Kr) is injected into the tissue or passively diffused
133 85
The elimination of the radioisotope from microcirculatory bed is related to the blood flow:
ktCtC exp)( 0
2/1/2ln tk
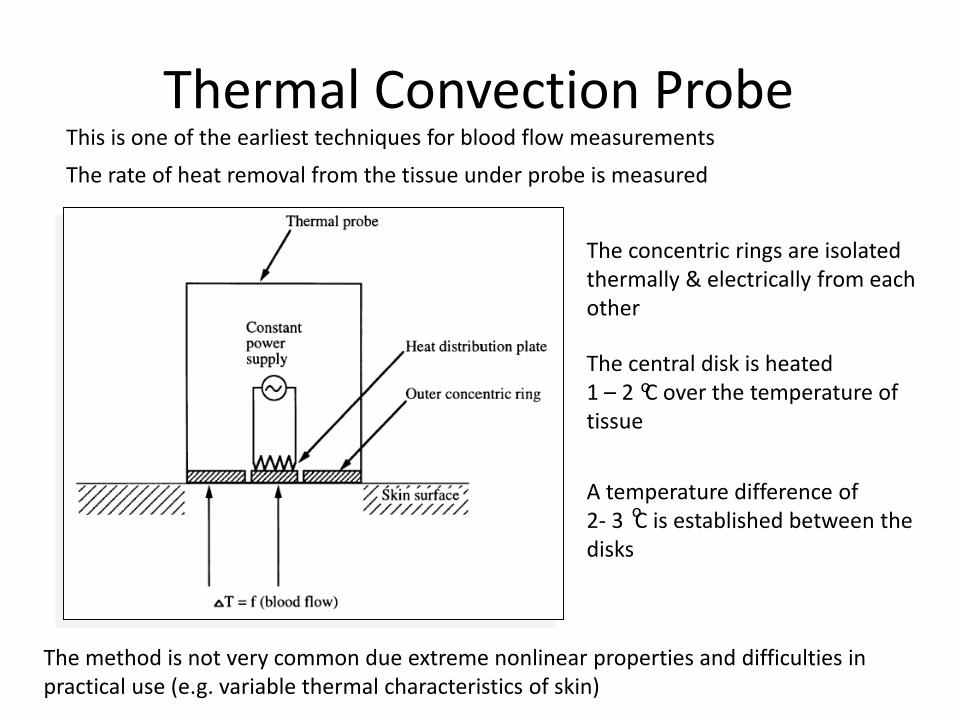
Thermal Convection Probe
The rate of heat removal from the tissue under probe is measured
The concentric rings are isolated thermally & electrically from each other
The central disk is heated 1 – 2 C over the temperature of tissue
A temperature difference of 2- 3 C is established between the disks
o
o
The method is not very common due extreme nonlinear properties and difficulties in practical use (e.g. variable thermal characteristics of skin)
This is one of the earliest techniques for blood flow measurements
Summary (1)
BLOOD PRESSURE
Describes the physiology and pathology of cardiocvascular system
”Normal” values are 120 / 80 mmHgHigh values may lead to heart attack and strokes
Low values may lead to low oxygen perfusion
All direct methods require skin punctuation and a use of catheter. Methods are used only when continuous and
accurate measurements are needed.
Almost all indirect methods rely on an occlusive cuff which is placed on the bracial artery. The actual measurement is done when the cuff is deflated
Summary (2)
BLOOD FLOW
Used for understanding physiological processes (e.g. medicine dissolution). Also used for locating clots in arteries
Usually more invasive methods are used than with blood pressure measurements
Normal velocity is 0,5 - 1 m/s
Indirect measurements are done by using ultrasound or plethysmographic method
Direct measurements are done by dilution methods (dye / thermal)