blend membrane fabricated via thermally induced phase
TRANSCRIPT

Polyolefins Journal, Vol. 4, No. 2 (2017)IPPI DOI:10.22063/poj.2017.1466
INTRODUCTION
Membrane technology is a good alternative to other conventional separation methods because of its numer-ous advantages such as lower energy consumption, high efficiency and environmental friendly aspects [1, 2]. Microfiltration (MF) and ultrafiltration (UF) are widely used in various separation industries such as the dairy and food industries, water treatment and biotech-
nology [3]. However, the performance of MF and UF membranes technologies has been largely limited by the severe flux decline, which occurs during the filtra-tion of solution [4]. Flux decline during filtration is an undesirable phenomenon, which can be caused by con-centration polarization and fouling [5]. Both of them lead to a significant increase in hydraulic resistance against permeate flow through the membrane pores [6].
In general, the fouling phenomenon is explained by
* Corresponding Author - E-mail: [email protected]
Study on the fouling behavior of HDPE/PE-g-MA/EVA blend membrane fabricated via thermally induced phase
separation methodSetareh Heidari1,2, Yoones Jafarzadeh1,2*, Mahdi Seyfollahi Samarin1,2, Reza Yegani1,2
1 Faculty of Chemical Engineering, Sahand University of Technology, Tabriz, Iran2 Membrane Technology Research Center, Sahand University of Technology, Tabriz, Iran
Received: 3 January 2017, Accepted: 17 May 2017
ABSTRACT
In this study, neat HDPE and HDPE/PE-g-MA/EVA blend membranes were fabricated via thermally induced phase separation (TIPS) method and their fouling behaviors were examined using filtration of BSA protein.
Membranes were characterized using FESEM, AFM, ATR-FTIR analyses and porosity measurement. Fouling behavior of membranes was analyzed using the resistance-in-series (RIS), classic and combined pore blocking models. The results of RIS model revealed that the magnitude of inherent, reversible and irreversible resistances decreased from 0.611 ×10¹³m-1 and ,1.578 ×1013m-1 and 0.525 ×10¹³m-1 for the neat membrane to 0.237 ×10¹³m-1, 0.789 ×10¹³m-1 and 0.154×10¹³m-1 for the blend membrane, respectively. None of the classical Hermia’s models were able to accurately predict fouling during the entire filtration run. The results obtained from the combined pore blocking model indicated that the combined cake formation-intermediate blocking model provided good prediction of fouling mechanism for both the membranes. However, comparison between fitted parameters showed that much greater fouling occurred for pure HDPE membrane. The key reasons for such different fouling behaviors were mainly attributed to the difference in hydrophobicity as well as the distribution of pore size on the surface of the pure and blend membranes. Polyolefins J (2017) 4: 235-251
Keywords: HDPE/PE-g-MA/EVA membrane; TIPS method; Resistance-in-series model; Pore blocking model.
ORIGINAL PAPER

236
Study on the fouling behavior of HDPE/PE-g-MA/EVA blend membrane fabricated via thermally induced phase separation method
Polyolefins Journal, Vol. 4, No. 2 (2017)
IPPI
various mechanisms including cake or gel formation, adsorption (within the pores and/or on the membrane surface) and particle precipitation. Based on the rela-tive size of pores and solutes, four different possible mechanisms such as cake formation, complete, inter-mediate and standard blockages have been proposed. Each of these mechanisms may occur individually, but two or more mechanisms are also likely to occur, si-multaneously [7].
In order to improve the performance and efficiency of the membrane processes, it is essential to minimize the undesirable membrane fouling. Influential param-eters on the membrane fouling have been classified into three main categories including membrane materials, feed properties and operating conditions. Characteris-tics like membrane initial materials [8], pore size [9], hydrophilicity/hydrophobicity [10, 11] and surface roughness [12, 13] are considered in membrane mate-rial category. Feed properties consist of feed concentra-tions [14], pH [15, 16] and particle size [17]. Operating conditions include temperature [18], cross flow veloc-ity [19] and transmembrane pressure [16, 20].
Among polymeric membranes, polyolefin mem-branes such as high density polyethylene (HDPE) and polypropylene (PP) membranes have been used in membrane processes due to their unique character-istics such as high chemical resistance and thermal stability, excellent processability and low cost [21, 22]. However, these hydrophobic membranes are eas-ily fouled because proteins are likely adsorbed onto the hydrophobic surfaces rather than the hydrophilic surfaces [10, 11, 23, 24]. Therefore, increasing the hydrophilicity of hydrophobic polymer membranes can enhance their antifouling property [25, 26]. To do this, modification of membrane materials may be considered. There are several modification methods such as grafting, plasma treatment, coating, chemical modification and blending. Among them, blending is preferred due to the advantages such as more stability, easy operation, providing modification of membrane internal pores, avoiding extra manufacturing steps and suitability for mass production of hollow fiber mem-branes [27, 28].
In our previous work, high density polyethylene/ethylene vinyl acetate (HDPE/EVA) blend mem-branes with and without polyethylene-graft-maleic
anhydride (PE-g-MA) compatibilizer were prepared and characterized and the results showed that the wa-ter flux and mechanical tensile of blended membranes were higher than those of neat HDPE membrane [29]. Moreover, it was revealed that HDPE/EVA/PE-g-MA membrane with the ratio of 87.5:10:2.5 was the opti-mum membrane. In the present work, microfiltration of bovine serum albumin (BSA) protein solution us-ing pure HDPE and optimum HDPE/PE-g-MA/EVA blend membranes was carried out. Antifouling prop-erties of membranes were evaluated using the resis-tance-in-series (RIS) model. The main drawback of the RIS model, however, is this assumption that all above mentioned resistances are in series with each other [30]. Therefore, RIS model does not give any mechanistic information regarding the type and time dependency of fouling phenomena. To overcome this issue, pore blocking fouling models as the most com-prehensive fouling models were also used to investi-gate the dominant fouling mechanisms in microfiltra-tion of BSA protein. THEORYResistance-in-series modelThe resistance-in-series (RIS) model, consisting of membrane resistance, reversible and irreversible re-sistances, has been particularly applied to analyze the flux decline and to express the fouling mechanism in UF and MF membranes [31, 32]. This model is de-scribed as follows:
tRPJ
µ∆
= (1)
where J is the flux (m3m-2s-1), µ is the dynamic viscos-ity of solvent at operating condition (Pa.s), ∆P is the transmembrane pressure (Pa) and Rt is the total filtra-tion resistance (m-1). Rt consists of various resistances that result in a flux decline as follows:
Rt = Rm + Rr + Ri (2)
where Rm is the inherent membrane resistance, Rr is the hydraulic resistance due to such reversible phe-nomena as concentration polarization and cake forma-tion, and Ri is the hydraulic resistance due to irrevers-ible deposition in the matrix of membrane or on the surface of membrane, such as irreversible adsorption
237
Heidari S. et al.
Polyolefins Journal, Vol. 4, No. 2 (2017)
IPPI
or internal pore blocking [32]. Rr is usually considered as the sum of concentration polarization resistance (Rcp) and cake layer resistance (Rc). The dimensions of all resistances are presented in m-1. In order to iden-tify the contribution of each term to the membrane fouling, first Rm was calculated by measuring the pure water flux (PWF) through an origin membrane (J0). Then total hydraulic resistance (Rt) was calculated by measuring the BSA protein solution flux through the membrane (J). The sum of Rcp + Rc + Ri could be cal-culated by subtracting Rm from Rt.
The fouled membrane was then used to filter pure water, and Rm + Rc + Ri was calculated by measuring water flux (J1). By subtracting Rm from Rm + Rc + Ri the sum of Rc + Ri was calculated. After that, the fouled membrane was cleaned physically, and the cake layer was gently removed from the membrane surface. The sum of Rm + Ri was calculated by measuring the PWF (J2) through the cleaned membrane. Then, Ri was ob-tained by subtracting Rm from Rm + Ri. Finally, Rc was calculated by subtracting Ri from Rc+Ri. Prevailing resistance was determined by using the ratio of each component to the total hydraulic resistances. Govern-ing equations used in the present paper are described as below:
0m J
PRµ∆
= (3)
m2
i RJPR −
µ∆
= (4)
im1
c RRJPR −−
µ∆
= (5)
tt J
PRµ∆
= (6)
)RRR(RR icntpc
++−= (7)
Pore blocking modelsFor a constant pressure microfiltration process, flux decline can be expressed by the equation that was sug-gested by Hermans and Bredee as below [33]:
m2
2
)Vdtd(K
Vdtd
= (8)
where t is the filtration time, V is the filtration volume, K is the resistance coefficient and m is the blocking in-
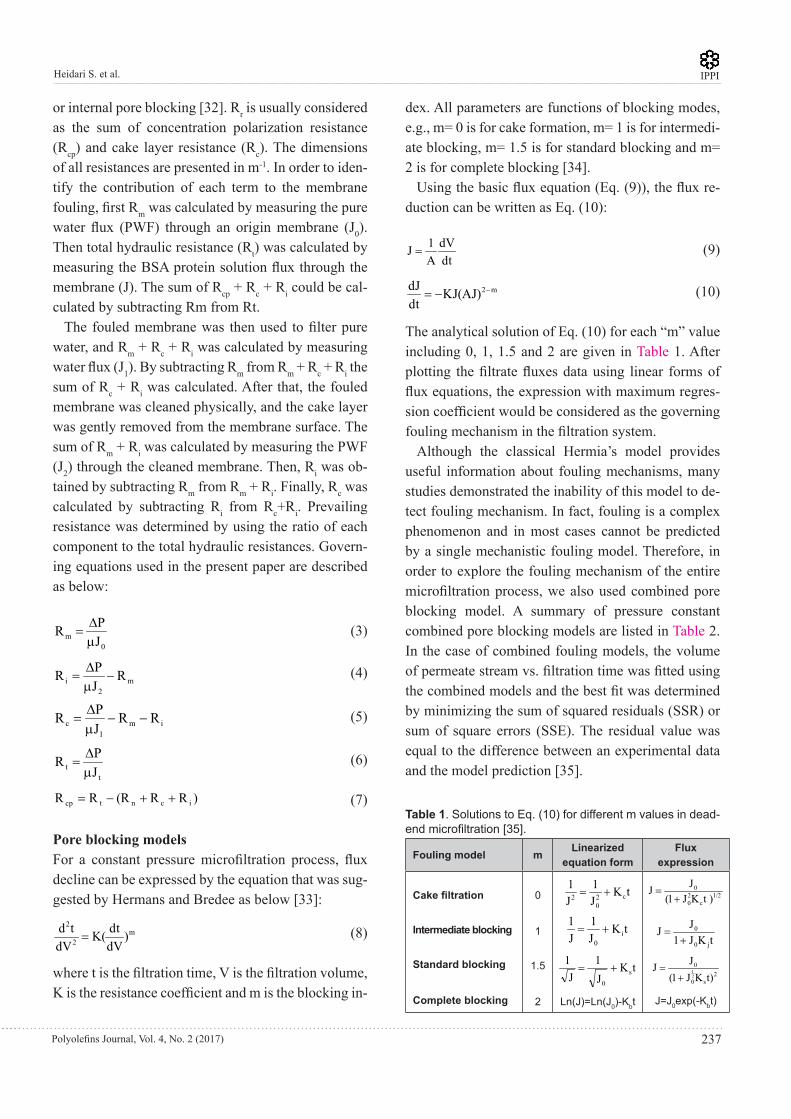
dex. All parameters are functions of blocking modes, e.g., m= 0 is for cake formation, m= 1 is for intermedi-ate blocking, m= 1.5 is for standard blocking and m= 2 is for complete blocking [34].
Using the basic flux equation (Eq. (9)), the flux re-duction can be written as Eq. (10):
tdVd
A1J
= (9)
m2)JA(JKtdJd
−−= (10)
The analytical solution of Eq. (10) for each “m” value including 0, 1, 1.5 and 2 are given in Table 1. After plotting the filtrate fluxes data using linear forms of flux equations, the expression with maximum regres-sion coefficient would be considered as the governing fouling mechanism in the filtration system.
Although the classical Hermia’s model provides useful information about fouling mechanisms, many studies demonstrated the inability of this model to de-tect fouling mechanism. In fact, fouling is a complex phenomenon and in most cases cannot be predicted by a single mechanistic fouling model. Therefore, in order to explore the fouling mechanism of the entire microfiltration process, we also used combined pore blocking model. A summary of pressure constant combined pore blocking models are listed in Table 2. In the case of combined fouling models, the volume of permeate stream vs. filtration time was fitted using the combined models and the best fit was determined by minimizing the sum of squared residuals (SSR) or sum of square errors (SSE). The residual value was equal to the difference between an experimental data and the model prediction [35].
Table 1. Solutions to Eq. (10) for different m values in dead-end microfiltration [35].
Fouling model m Linearizedequation form
Fluxexpression
Cake filtration
Intermediate blocking
Standard blocking
Complete blocking
0
1
1.5
2
tKJ1
J1
c20
2 +=
tKJ1
J1
i0
+=
tKJ1
J1
s0
+=
Ln(J)=Ln(J0)-Kbt
1/2c
20
0
) tKJ1(JJ
+=
tKJ1JJ
j0
0
+=
2s0
0
)tKJ1(JJ
21
+=
J=J0exp(-Kbt)

238
Study on the fouling behavior of HDPE/PE-g-MA/EVA blend membrane fabricated via thermally induced phase separation method
Polyolefins Journal, Vol. 4, No. 2 (2017)
IPPI
EXPERIMENTAL
MaterialsHigh density polyethylene (HDPE, grade: EX3, Mw=119500, MFI=0.35) was provided by Amirkabir Petrochemical Company and used as the main compo-nent of the membrane matrix. Ethylene vinyl acetate (EVA, grade:8430, ρ= 0.932) was provided by Hyun-dai Petrochemical of Korea and used as the polymer modifier. Polyethylene-graft-maleic anhydride (PE-g-MA, grade:MB-226, MFI=4.5) was purchased from Pluss Polymers, India and used as the compatibilizing agent. Bovine serum albumin (BSA, Mw=67 kDa), purchased from Sigma-Aldrich, was used as organic model foulant to evaluate the membrane performance. Phosphate buffered saline (PBS, pH=7.4) was pre-pared by adding a certain amounts of buffer salts to deionized water. Paraffin oil and acetone as diluent and extracting agent, respectively, were purchased from Merck. All chemicals were used as received, un-less otherwise described.
Preparation of BSA solution as model foulantStock BSA protein solution was prepared by dissolv-ing 1.0 g BSA in 1 L phosphate buffer solution in or-der to obtain the suspensions used in fouling and flux decline experiments. During the microfiltration pro-cess, the temperature and pH of suspension were kept constant at 4-8°C and 7.4, respectively.
Preparation of pure HDPE membraneHDPE membranes were prepared via thermally-in-
duced phase separation. 20 wt. % HDPE and 80 wt. % paraffin oil were fed to a glass vessel and sealed. The sealed glass vessel was kept in a silicone oil bath at 160°C and the mixture was melt-blended for approxi-mately 2 h. The solution was allowed to degas for 30 min and then cast on a pre-heated glass plate using an applicator. The glass plate was transferred into the water bath (60°C) and kept for about 10 min. Then, it was transferred to another water bath (30°C) and again was kept for another 10 min, to induce phase separation. After 24 h, the membrane was detached from the glass plates, and immersed into acetone to extract diluents and dried at oven for 24 h. Details of the preparation of HDPE membranes via thermally-induced phase separation are available in [34].
Preparation of HDPE/PE-g-MA/EVA blend membrane A mixture containing 17.5 wt.% HDPE, 2.0 wt.% EVA, 0.5 wt.% PE-g-MA and 80 wt.% paraffin oil was melt blended using a sealed glass vessel kept in a silicon oil bath at 160°C to prepare HDPE/PE-g-MA/EVA blend membrane. The other procedures were similar to the method mentioned in the previous section.
ATR-FTIR analysesIn order to investigate the chemical structure and the type of functional groups created on the blend mem-brane, ATR-FTIR analysis was carried out by an infra-red spectroscopy apparatus (Bruker, Tensor 27).
Static contact angle measurement and AFM analysisThe degree of hydrophilicity/hydrophobicity of the
Table 2. Some of the combined fouling models at constant pressure [36].Models Expressions Fitted parameters
Cake filtration-complete blocking(CFCBM)
Cake filtration- intermediate blocking(CFIBM)
Cake filtration-standard blocking(CFSBM)
( ))1Jk21JK
K(exp1(KJV
20c2
0c
b
b
0 −+−−=
( ))1tJk21JK
K1(nLK1V
20c
0c
i
i
−++=
)31)( arccos
31
3 2 cos(
K2V
S
+
α−
πβ=
C3
2S
0C3
S3 K3
tK4-JK3
K4728
ββ+
β=α
C
2S
0C
S
K3tK2-
JK3K4
94
+=β
)s(K, msK
1b2C
−
)m(K, msK
1i2C
−
)m(K, msK
1S2C
−

239
Heidari S. et al.
Polyolefins Journal, Vol. 4, No. 2 (2017)
IPPI
membranes was determined by the contact angle mea-surement. The static contact angle of a drop of water on the membrane surface was measured by a contact angle goniometer (PGX, Thwing-Albert Instrument Co.). The contact angle of each sample was measured 5 times and the average value was reported. In order to analyze the surface roughness of prepared mem-branes, atomic force microscopy (AFM) examinations were carried out using a Nanosurf Mobile S micro-scope. The tapping mode was used to map the mem-brane morphology at the room conditions. Samples were prepared by cutting the membranes with a size of 5 × 5 mm.
Porosity measurementThe overall porosity of the membranes was calculated by the following equation [34]:
100)1(%
polymer
membrane ×rr
−=ε (11)
Also, the membrane density (rmembrane) for pure mem-brane was determined by mass of membrane divided by membrane volume and for blend membranes was calculated by the following equation [37]:
2211P xx ×r+×r=r (12)
where rp is the polymer density, and r1 and r2 are densities of the polymers in the mixture; x1 and x2 are mass fractions of the polymers in the mixture.
FESEM, pore size distribution and mean pore diameter The morphology of the fabricated membranes was characterized by a field emission scanning electron microscope (FESEM, MIRA3 Tescan) with an accel-erating voltage of 1.0 kV. Cross-section samples were prepared by fracturing the membranes in the liquid ni-trogen. All samples were coated with gold by sputter-ing before observation to make them conductive. The FESEM images were used to measure the mean pore diameter and the pore size distribution of the mem-branes using Image J analyzer software. In this meth-od, each pore is supposed to be disconnected from its neighbors and was assumed to be circular.
PWF measurementThe PWF of fabricated membranes was determined
using an in-house prepared dead-end filtration system with a 4.9 cm2 effective membrane area. The sche-matic diagram of the dead-end microfiltration set-up is shown in Figure 1. To minimize the impact of com-paction, the pre-wetted membranes were compacted for about 30 min at 2 bar. Then the pressure was re-duced to 1 bar and after reaching steady state, water flux was calculated using the following equation:
tAVJ
= (13)
where J is the water flux (Lm-2h-1), V is the permeate volume (L), A is the surface area (m2), and t is the filtration time (h).
Membrane performanceMembrane rejection was calculated by measuring the concentration of BSA in both permeate and feed solu-tions according to the following equation:
100CC
1(%)Rf
p ×
−= (14)
where Cp and Cf are the values of BSA concentrations in the permeate and BSA solutions, respectively. The concentration of BSA protein in permeate was deter-mined using a spectrophotometer at the absorption wavelength of 280 nm.
Filtration experiments and fouling analyses In order to evaluate the protein anti-fouling character-istics of pure and blend membranes, the membranes were tested in a dead-end filtration system (Figure 1) filled with BSA protein solution. The procedure was described in detail in the previous studies [34,
Figure 1. Schematic of the microfiltration and pure water flux setup.

240
Study on the fouling behavior of HDPE/PE-g-MA/EVA blend membrane fabricated via thermally induced phase separation method
Polyolefins Journal, Vol. 4, No. 2 (2017)
IPPI
38]. The solution was prepared by dissolving 1.0 g of BSA powder in 1 L of standard phosphate buffer sa-line (PBS) solution. All of fouling experiments were operated under a constant pressure of 1 bar and stir-ring speed of 400 rpm for 300 min. The conditions applied to investigate the fouling with membranes are presented in Table 3.
RESULTS AND DISCUSSION
ATR-FTIR analysesThe results of ATR-FTIR analysis for HDPE mem-brane and HDPE/PE-g-MA/EVA membrane are shown in Figure 2. The characteristic peaks of EVA are ob-served in the spectra of HDPE/PE-g-MA/EVA blend membrane. The bands at 1720-1750 cm-1 and 1000-1300 cm-1 could be attributed to the stretching vibra-tion of C=O and C-O, respectively [39]. The bands in the wavelength range of 2700-2950 cm-1 and 1460 cm-1 could be attributed to the C-H bond stretching vibration and CH2 bond bending vibration of HDPE membrane. Obtained results show that EVA molecules are successfully blended into the HDPE matrix.
Static contact angle, porosity measurement, AFM analysis and pure water permeation fluxThe results of static contact angle measurement, mean pore diameter, porosity and pure water flux (PWF) of the pure and blend membranes are shown in Table 4. It can be seen that the contact angle of HDPE membrane decreased after adding EVA. As mentioned in our pre-vious work [29], decrease in contact angle could be attributed to the presence of polar groups in the struc-ture of EVA. The obtained results also revealed that the porosity of blend membranes is higher than that of pure HDPE membrane.
The results of PWF indicated that the addition of
EVA to the polymeric mixture increased the water per-meability (by nearly 260%). Therefore, blend mem-brane had a higher permeability as expected. Howev-er, there was some doubt as to whether a slight change in the contact angle and porosity was responsible for the remarkable increase in the water permeability.
In order to clarify the issue, AFM analysis was per-formed, and results are shown in Figure 3. AFM im-ages show that surface roughness of the blend mem-brane is higher than that of pure membranes. The degree of roughness amplifies the wettability of the surface toward its intrinsic properties [34, 38]. For a surface like polyethylene in which the contact angle is greater than 90°, roughening will increase the contact angle. On the other hand, due to the polar functional groups of EVA molecules, membrane hydrohphilic-ity increases and contact angle decreases. Thus, the two aforementioned contrary factors controlling the final contact angle balance the hydrophilic property of blend membrane, and therefore no discernible change is achieved.
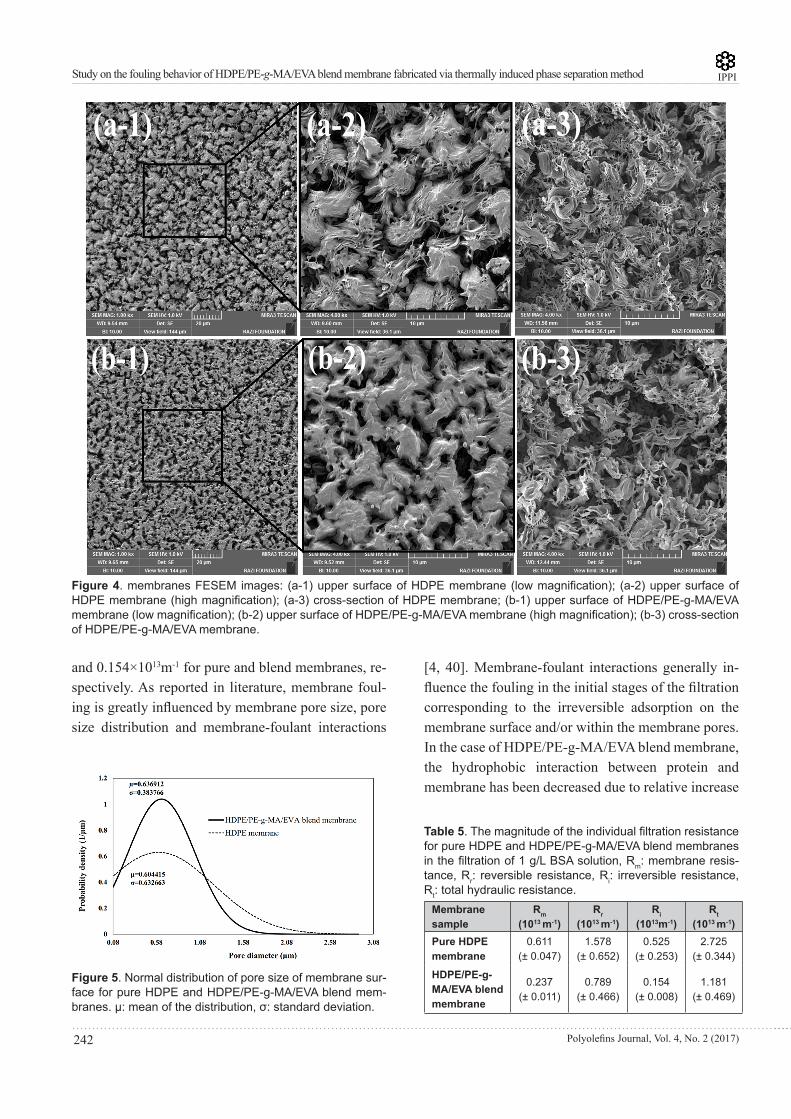
FESEM analysis and pore size distributionThe surface and cross-section morphologies of blend and pure membranes are shown in Figure 4. From cross-section FESEM images, it can be seen that both the membranes have leafy structure in which the poly-
Table 3. Operating conditions for fouling experiments.
Step TMP(bar)
Temperature(°C)
Time(min) pH
membrane area (cm2)
Membranethickness (µm) Feed stream
Pure water flux measurementFouling experimentRinsingPhysical cleaningRinsing
1111
20±56±220±520±520±5
4530020
20
7±0.17.4
7±0.17±0.17±0.1
4.94.94.94.94.9
230230
Pure waterBSA SolutionPure waterPure waterPure water
Figure 2. ATR-FTIR spectra of pure HDPE and HDPE/PE-g-MA/EVA blend membranes.

241
Heidari S. et al.
Polyolefins Journal, Vol. 4, No. 2 (2017)
IPPI
mer leaves are randomly connected to each other. This is due to the solid-liquid phase separation of paraffin oil-HDPE system. Although, blend membrane showed a slight decrease in the surface porosity, it exhibited a remarkable increase in the bulk porosity. However, the higher bulk porosity of blend membrane may be related to the presence of PE-g-MA. When the dope solution of HDPE/ PE-g-MA/EVA was quenched in water bath, more water molecules may be entrapped
within crystalized polymer due to the affinity between PE-g-MA and water and consequently, bulk porosity of the blend membrane increased in comparison with pure membrane. It is mainly due to the fact that the existence of EVA decreases the crystallinity of HDPE polymer and hence results in higher porosity with re-spect to the pure membranes [29].
The pore size distribution curves of the pure and blend membranes are shown in Figure 5, in which the X-axis represents the membrane pore diameter, dp (µm) and the Y-axis also shows the probability den-sity. It is revealed that for pure HDPE membrane, the distribution of pore sizes is wider than that of blend membrane. The surface of pure membrane also has a higher portion of small and very big pores than that of blend membrane. In other word, compatibilizing agent keeps the EVA molecules mainly in the bulk of the membrane and results in uniform distribution of pore size rather than the pure membrane. More evi-dences on this issue are available in our previous pub-lished work [29].
Fouling behavior Resistance-in-series modelBoth membranes were examined under the same con-ditions; therefore, any difference in the fouling behav-iors could be attributed to the surface properties of the fabricated membrane. Table 5 represents the magni-tude of the membrane inherent resistance, reversible resistance including concentration polarization and cake layer resistances, irreversible resistance and total hydraulic resistance. Comparing the Rm values; 0.611 ×10¹³m-1 and 0.237 ×10¹³m-1 for pure and blend mem-branes, respectively, confirms that the inherent resis-tance of pure membrane is higher than that of blend membrane in the filtration of BSA solution. The results show that Ri and Rr for pure membrane are also higher than those for blend membrane. Total fouling resis-tance and irreversible fouling resistance reduce from 2.725 ×10¹³m-1 and 0.525 ×10¹³m-1 to 1.181×10¹³m-1
Table 4. Characteristics of the pure HDPE and HDPE/PE-g-MA/EVA blend membranes.
Membrane sample Contact angle (deg.) Mean pore diameter ofmembrane surface (µm) Porosity (%) Pure water
flux (L/m2h)Pure HDPE membraneHDPE/PE-g-MA/EVA blend membrane
115 ± 498 ± 5
0.6040.637
63 ± 5.0068 ± 3.60
58.87± 4.63150.88 ± 7.12
Figure 3. AFM images of (a) pure HDPE and (b) HDPE/PE-g-MA/EVA blend membranes.
(a)
(b)
242
Study on the fouling behavior of HDPE/PE-g-MA/EVA blend membrane fabricated via thermally induced phase separation method
Polyolefins Journal, Vol. 4, No. 2 (2017)
IPPI
and 0.154×10¹³m-1 for pure and blend membranes, re-spectively. As reported in literature, membrane foul-ing is greatly influenced by membrane pore size, pore size distribution and membrane-foulant interactions
[4, 40]. Membrane-foulant interactions generally in-fluence the fouling in the initial stages of the filtration corresponding to the irreversible adsorption on the membrane surface and/or within the membrane pores.In the case of HDPE/PE-g-MA/EVA blend membrane, the hydrophobic interaction between protein and membrane has been decreased due to relative increase
Figure 4. membranes FESEM images: (a-1) upper surface of HDPE membrane (low magnification); (a-2) upper surface of HDPE membrane (high magnification); (a-3) cross-section of HDPE membrane; (b-1) upper surface of HDPE/PE-g-MA/EVA membrane (low magnification); (b-2) upper surface of HDPE/PE-g-MA/EVA membrane (high magnification); (b-3) cross-section of HDPE/PE-g-MA/EVA membrane.
Figure 5. Normal distribution of pore size of membrane sur-face for pure HDPE and HDPE/PE-g-MA/EVA blend mem-branes. µ: mean of the distribution, σ: standard deviation.
Table 5. The magnitude of the individual filtration resistance for pure HDPE and HDPE/PE-g-MA/EVA blend membranes in the filtration of 1 g/L BSA solution, Rm: membrane resis-tance, Rr: reversible resistance, Ri: irreversible resistance, Rt: total hydraulic resistance. Membranesample
Rm
(1013 m-1) Rr
(1013 m-1) Ri
(1013m-1) Rt
(1013 m-1) Pure HDPEmembrane
0.611(± 0.047)
1.578(± 0.652)
0.525(± 0.253)
2.725(± 0.344)
HDPE/PE-g- MA/EVA blendmembrane
0.237(± 0.011)
0.789(± 0.466)
0.154(± 0.008)
1.181(± 0.469)
243
Heidari S. et al.
Polyolefins Journal, Vol. 4, No. 2 (2017)
IPPI
in surface hydrophilicity. On the other hand, studies showed that the adsorption capacity increased with in-creasing the membrane pore size [41, 42]. Although, the blend membrane exhibited a slight increase in mean pore diameter, it had a more uniform distribu-tion of pore size than that of pure membrane. In other words, for the blend membrane, the portion of very large pores is lower than that of pure membrane, as shown in Figure 5. According to the statements, it seems reasonable that the pure HDPE membrane ex-hibits a higher irreversible fouling resistance. It might be due to the stronger hydrophobic–hydrophobic in-teractions with BSA molecules as well as higher ca-pacity for pore blocking.
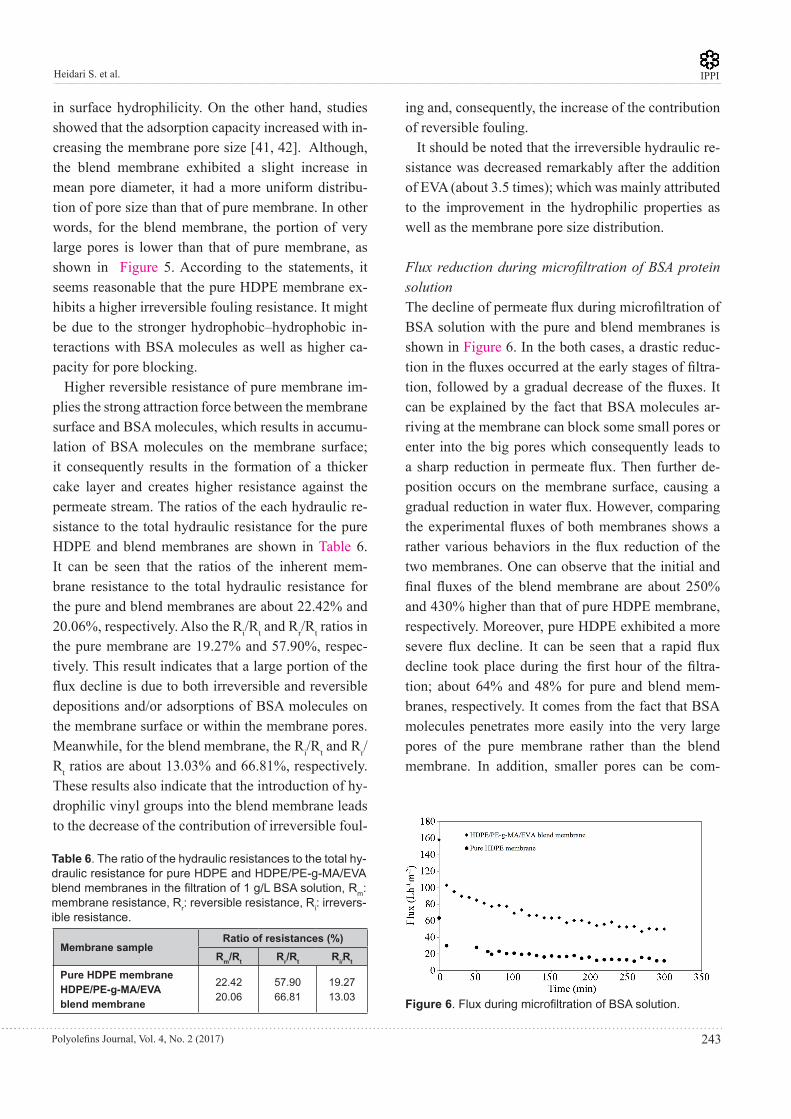
Higher reversible resistance of pure membrane im-plies the strong attraction force between the membrane surface and BSA molecules, which results in accumu-lation of BSA molecules on the membrane surface; it consequently results in the formation of a thicker cake layer and creates higher resistance against the permeate stream. The ratios of the each hydraulic re-sistance to the total hydraulic resistance for the pure HDPE and blend membranes are shown in Table 6. It can be seen that the ratios of the inherent mem-brane resistance to the total hydraulic resistance for the pure and blend membranes are about 22.42% and 20.06%, respectively. Also the Ri/Rt and Rr/Rt ratios in the pure membrane are 19.27% and 57.90%, respec-tively. This result indicates that a large portion of the flux decline is due to both irreversible and reversible depositions and/or adsorptions of BSA molecules on the membrane surface or within the membrane pores. Meanwhile, for the blend membrane, the Ri/Rt and Rr/Rt ratios are about 13.03% and 66.81%, respectively. These results also indicate that the introduction of hy-drophilic vinyl groups into the blend membrane leads to the decrease of the contribution of irreversible foul-
ing and, consequently, the increase of the contribution of reversible fouling.
It should be noted that the irreversible hydraulic re-sistance was decreased remarkably after the addition of EVA (about 3.5 times); which was mainly attributed to the improvement in the hydrophilic properties as well as the membrane pore size distribution.
Flux reduction during microfiltration of BSA protein solution The decline of permeate flux during microfiltration of BSA solution with the pure and blend membranes is shown in Figure 6. In the both cases, a drastic reduc-tion in the fluxes occurred at the early stages of filtra-tion, followed by a gradual decrease of the fluxes. It can be explained by the fact that BSA molecules ar-riving at the membrane can block some small pores or enter into the big pores which consequently leads to a sharp reduction in permeate flux. Then further de-position occurs on the membrane surface, causing a gradual reduction in water flux. However, comparing the experimental fluxes of both membranes shows a rather various behaviors in the flux reduction of the two membranes. One can observe that the initial and final fluxes of the blend membrane are about 250% and 430% higher than that of pure HDPE membrane, respectively. Moreover, pure HDPE exhibited a more severe flux decline. It can be seen that a rapid flux decline took place during the first hour of the filtra-tion; about 64% and 48% for pure and blend mem-branes, respectively. It comes from the fact that BSA molecules penetrates more easily into the very large pores of the pure membrane rather than the blend membrane. In addition, smaller pores can be com-
Table 6. The ratio of the hydraulic resistances to the total hy-draulic resistance for pure HDPE and HDPE/PE-g-MA/EVA blend membranes in the filtration of 1 g/L BSA solution, Rm: membrane resistance, Rr: reversible resistance, Ri: irrevers-ible resistance.
Membrane sampleRatio of resistances (%)
Rm/Rt Rr/Rt Ri/Rt
Pure HDPE membrane HDPE/PE-g-MA/EVAblend membrane
22.4220.06
57.9066.81
19.2713.03 Figure 6. Flux during microfiltration of BSA solution.

244
Study on the fouling behavior of HDPE/PE-g-MA/EVA blend membrane fabricated via thermally induced phase separation method
Polyolefins Journal, Vol. 4, No. 2 (2017)
IPPI
pletely blocked by the BSA molecules. Therefore, in the case of pure membrane, more severe flux decline at the early stages of filtration was probably due to the higher extent of the pore blocking. In order to explore the fouling mechanism, the pore blocking analysis us-ing the Hermia’s model and combined pore blocking models were carried out, which their results are dis-cussed in the next sections.
Pore blocking mechanismsHermia’s modelAlthough, the RIS model provided useful information regarding the portions of reversible and irreversible fouling resistances, the governing fouling mechanism is not distinguished yet. Therefore, the classical Hermia’s models as well as the combined pore blocking-cake fil-tration models were applied to determine the dominant fouling mechanism. In this regard, flux experiment data was substituted in the flux equation of Hermia’s models and fitted the linear regression. The best fit was select-ed based on the comparison between the magnitudes of R2 values and the dominant fouling mechanism was determined. The values of fitted parameters, K factors and the degree of fitness (coefficients of determination (R2)) for the pure and blend membranes are presented in Table 7. The fitting of cake and blocking mechanisms for the pure and blend membranes are also shown in Figures 7 and 8, respectively.
As shown in Table 7, in the case of blend membrane, all of R2 values (except complete blocking mecha-nism) are relatively high (R2>0.9) which can be at-tributed to the relatively small changes in the flux data with time. By comparing the magnitude of R2 values, it is concluded that cake filtration (m=0) followed by intermediate blocking (m=1) are the most appropriate fouling mechanisms. It means that at the initial stage of filtration, some protein molecules partially blocked the pores while the rest settled on the others that previ-
ously deposited. At the later stage, cake layers formed and covered the membrane surface.
As shown in Figure 7 , none of the classical models were able to accurately predict the experimental fluxes decline and the fouling mechanisms for pure HDPE membrane. It is also in accordance with the low mag-nitude of R2 values, which are presented in Table 7. However, it should be mentioned that the R2 values can only be compared between different mechanisms under the same conditions. It is not correct to compare these values between the same mechanism and the dif-ferent fouling experiments. In other words, higher R2 value does not necessarily mean that it gives better fits to experimental data [43, 44].
Moreover, both the membranes exhibited the least fitting of complete mechanism with the experimen-tal data. This observation can be explained as follow: complete blocking occurs when the membrane pores are approximately equal to or smaller than the particle size. A BSA molecule is a prolate ellipsoid with the dimension of 14.09 × 4.16 × 4.16 nm [7]. As it was observed in the “FESEM analysis and pore size distri-bution” section, average pore diameters for pure and blend membranes were 0.604 and 0.637 µm, respec-tively, which are larger than the BSA molecule size. However, because of the wide distribution of pore sizes, especially in the case of pure membrane, there are pores with the same size or even smaller than the size of BSA molecule. Hence, pore blocking can occur during complete blocking type. But because the pores of the low fraction are smaller than the size of BSA, the possibility of this mechanism is the lowest in com-parison with the other mechanisms. Low overall BSA rejections, 66.419% and 65.431% for pure and blend membranes, respectively, also confirm this observa-tion. Details in membranes rejection will be discussed in the “Membrane performance” section.
According to the physical concept of Hermia’s pa-
Table 7. Values of K in Hermia’s fouling model and coefficients of determination (R2) for pure HDPE and HDPE/PE-g-MA/EVA blend membranes in the filtration of 1 g/L BSA solution.
Membrane samplem=0 m=1 m=1.5 m=2
k R2 k R2 k R2 k R2
Pure HDPE membrane HDPE/PE-g-MA/EVAblend membrane
0E-5 2.00
1.10E-6
0.8207
0.9626
2.00E-4
4.00E-5
0.8603
0.9412
4.00E-4
2.00E-4
0.8496
0.9085
3.60E-3
2.70E-3
0.8072
0.8572

245
Heidari S. et al.
Polyolefins Journal, Vol. 4, No. 2 (2017)
IPPI
rameters (K value) presented by Bowen et al. [7], these parameters can be used to compare the severity of membrane fouling which means that the values of fitted parameters are higher for the more fouled mem-brane [43, 44]. As a result, since all of Kcf, Ki , Ks and Kc parameters for blend membrane were lower than those of pure membrane, blend membrane exhibited lower fouling.
Combined pore blocking modelsIn order to explore the multiple mechanisms involved during the microfiltration of BSA solution, we used three pore blocking combined models including cake filtration-complete blocking model (CFCBM), cake filtration-intermediate blocking model (CFIBM) and cake filtration-standard blocking model (CFSBM). The best fit was selected based on minimizing the sum of squared residuals (SSR) or sum of square er-
rors (SSE). The values of SSE for both the membranes are presented in Table 8. Moreover, the results of ex-perimental filtrated volume and model predictions for pure and blend membranes are shown in Figures 9 and 10, respectively.
The results show that for the pure and blend mem-branes, combination of intermediate blocking and cake filtration (CFIBM) models fit very well with the experimental data. As per this model, intermedi-ate pore blocking occurs in the beginning of filtration and then followed by the cake formation in longer filtration time intervals. Moreover, the values of Kc for pure membrane (1.03-3.0 × 10⁶ s/m2) are higher than those for blend membrane (5.64-11.45 × 10⁴ s/m2). As shown in Figure 5, the width of the size distri-bution curve is decreased by the addition of EVA. So, the blend membrane is less susceptible to pore block-ing due to the absence of very large pores. Moreover,
Figure 7. Identification of HDPE membrane fouling mechanisms in the filtration of 1 g/L Collagen solution by classical Hermia’s model: (a) cake formation, (b) intermediate blocking, (c) standard blocking, (d) complete blocking model.
(a) (b)
(c) (d)

246
Study on the fouling behavior of HDPE/PE-g-MA/EVA blend membrane fabricated via thermally induced phase separation method
Polyolefins Journal, Vol. 4, No. 2 (2017)
IPPI
incorporation of polar EVA molecules into the HDPE matrix decreases the attraction tendency between the hydrophobic BSA molecules and relatively hydrophil-ic membrane surface, which followed by a very thin water film is continually formed on the membrane sur-face and prevents direct contact between the solutes and the membrane surface [40].
It should be noted that although the blend membrane has no fully hydrophilic surface, however, the wetta-bility of blend membrane is more than that of pure
HDPE membrane. In the case of pure membrane, BSA molecules penetrate more easily into the very large pores of the membrane. In addition, strong attraction force between BSA molecules and pure membrane accelerate the rate of cake formation. Therefore, as expected, the pure membrane exhibited more severe fouling than that of the blend membrane. It is also observed that at each experiment, the value of Kb is the lowest in comparison with other fitted parameters, which is consistent with the results of classical Her-
Table 8. Model parameters and SSE values for pure HDPE and HDPE/PE-g-MA/EVA blend membranes. CFCBM: cake filtra-tion-complete blocking, CFIBM: cake filtration-intermediate blocking and CFSBM: cake filtration-standard blocking models.
Membrane sample Models SSE×10-3 J0(m⁄s) ×10-5 Fitted parameters
Pure HDPE membrane CFCBMCFIBMCFSBM
13.6684.82644.8632
1.51.11.3
Kc = 3E+6 s/m2 , Kb = 4E-6 s-1
Kc = 2E+6 s/m2 , Ki = 1 m-1
Kc = 1.03E+6 s/m2 , Ks = 6 m-1
HDPE/PE-g-MA/EVA blend membraneCFCBMCFIBMCFSBM
2.57921.99826.7406
2.92.93.2
Kc = 1.145E+5 s/m2 , Kb = 1E-12 s-1
Kc = 1.02E+5 s/m2 , Ki = 2.03E-1 m-1
Kc = 5.64E+4 s/m2 , Ks = 7.5E-1 m-1
Figure 8. Identification of HDPE/PE-g-MA/EVA membrane fouling mechanism in the filtration of 1 g/L Collagen solution by clas-sical Hermia’s model: (a) cake formation, (b) intermediate blocking, (c) standard blocking, (d) complete blocking model.
(a) (b)
(c) (d)

247
Heidari S. et al.
Polyolefins Journal, Vol. 4, No. 2 (2017)
IPPI
mia’s models.The values of the K parameters were also applied to
clarify the individual contribution of the two mecha-nisms in each combined models. In the case of CFCBM and CFIBM models, the ratios of KcJ0
2/Kb and KcJ0/Ki indicate the contribution of the cake formation with contributions of both complete and intermediate block-ings, respectively. Also, the ratio of KcJ0/Ks indicates the contribution of cake formation to the contribution of standard blocking for CFSBM model [35]. The re-sults are presented in Table 9. The values of KcJ0
2/Kb are 168.75 and 9.63×10⁷; KcJ0/Ki are 22 and 14.57, and KcJ0/Ks are 2.23 and 2.4 for pure and blend membrane, respectively. These results clearly imply that for both the membranes the main contribution of each combined model was the cake formation.
Membrane performanceThe rejection of pure and blend membranes were ex-amined by measuring the concentration of BSA pro-tein in the feed and permeate streams and results were
summarized in Table 10. As can be seen, the penetra-tion of BSA molecule through both the membranes is approximately high. It can be explained by the fact that the average pore diameter of both MF membranes was larger than the BSA molecular size. Hence, BSA molecules were able to pass through the membrane pores. As mentioned before, after the initial stages of filtration, the cake layer was created and covered the whole membrane surface. At this stage, we can expect total or high membrane rejection. Therefore, a large portion of the protein in the permeate phase should be corresponded to the penetration of proteins at the initial period of filtration. This behavior also indicted that the intermediate pore blocking mechanism did not occur individually at the initial stage of filtration. This behavior can be explained in terms of the suc-cessive or simultaneous pore blocking and cake fil-tration mechanisms during protein microfiltration, as described by Bowen et al. [7]. As mentioned before, for both the membranes, interme-diate blocking is the dominant pore blocking mecha-
Table 9. Contribution of each individual model in the com-bined model for pure HDPE and HDPE/PE-g-MA/EVA blend membranes in the filtration of 1 g/L BSA solution.
Figure 9. Experimental filtration volume data and combined fouling models for pure HDPE membrane in separation of 1 g/L BSA solution. CFCBM: cake filtration-complete blockage model, CFIBM: cake filtration-intermediate blockage model, CFSBM: cake filtration-standard blockage model.
Figure 10. Experimental filtration volume data and com-bined fouling models for HDPE/PE-g-MA/EVA blend mem-brane in separation of 1 g/L BSA solution. CFCBM: cake filtration-complete blockage model, CFIBM: cake filtration-intermediate blockage model, CFSBM: cake filtration-stan-dard blockage model.
Membrane sample Kc J02/Kb Kc J0/Ki Kc J0/Ks
Pure HDPE membrane 168.75 22 2.23
HDPE/PE-g-MA/EVAblend membrane 9.63E+7 14.57 2.4
Table 10. Rejection performance of pure HDPE and HDPE/PE-g-MA/EVA blend membranes.
Case Rejection (%)Pure HDPE membrane
HDPE/PE-g-MA/EVA blend membrane
66.4 ± 1.3
65.7± 0.9

248
Study on the fouling behavior of HDPE/PE-g-MA/EVA blend membrane fabricated via thermally induced phase separation method
Polyolefins Journal, Vol. 4, No. 2 (2017)
IPPI
nism which was followed by the cake formation. More-over, since the major fractions of pores are larger than the molecular size of BSA, the particles can easily enter into the pores. This statement is in agreement with the results of pore blocking models, in which the values of the measured as well as the fitted parameters corre-sponding to the standard blocking were noticeable in comparison with the other mechanisms.
On the other hand, although mean pore diameter of the blend membrane is relatively higher than that of the pure membrane, both the membranes however exhibited almost the same rejection. This observation can be explained as follow. For hydrophobic foulants, during the initial stage of the filtration, rejection is mainly determined by the size exclusion effects (ste-rical effects) and hydrophobic interactions between the foulant and the membrane surface. Sterical effect refers to a sieving mechanism; particles bigger than the membrane pores are retained by the membrane, while the smaller particles are able to pass through the pores. Moreover, rejection can be influenced by the foulant-membrane interaction forces. Since the most commercial polymeric membranes are made from hydrophobic polymers, hydrophobic/adsorptive inter-actions have a significant impact on the rejection. It arises from the hydrophobic-hydrophobic interactions between the membrane and the foulant. Because of the tendency of the particles to the membrane, the particles can easily penetrate into the pores. These particles can move through the membrane pores and, consequently, transfer to the permeate side. Eventually, increasing the transmission of particles leads to a decrease in re-jection percentage. As a result, for hydrophobic fou-lants, increasing membrane hydrophobicity (increas-ing contact angle) leads to an increase of the solute mass transfer. This phenomenon increases the rate of penetration of particles into the membrane. Therefore, the rejection observed is less than the expected values obtained based on the sterical effects. Obtained results were in good agreement with the results reported in literature. In addition, Figure 5 shows a wide pore size distribution, especially in the pure membrane. As re-ported in literature, pore size distribution might con-siderably affect the particles removal which should be further taken into consideration [45]. According to the results presented in the “Hermia’s model” section,
penetration of particles into the pure membrane was higher than that of blend membranes. This means that for pure membrane at the beginning of the filtration stage, hydrophobic interactions and pore size distribu-tion had large effects on the transition of BSA.
On the other hand, during the filtration stage, a cake layer which is formed on the surface of the membrane changes the performance of the membrane dramati-cally. In fact, the cake itself acts as a filtration media for subsequently arriving particles [46]. At the begin-ning of the cake formation, rejection by the cake layer depends strongly on the structural and physical char-acteristics of the cake layer (e.g. thickness and com-pressibility). The cake layer grows in the course of the filtration stage, so that a compact and thick layer is formed, providing high resistance against the perme-ation stream. At this stage, one can expect total or high membrane rejection. As mentioned in the “Resistance-in-series model” section, the magnitude of cake resis-tance on the pure membrane was about 2 times as large as that on the blend membrane. It means that the cake layer on the surface of pure membrane was thicker and less permeable than that on the pure membrane, there-fore, it has a greater impact on the particle removal. In conclusion, it seems that we should expect a higher initial rejection for the blend membrane. In contrast, this behavior is expected for the pure membrane in longer filtration times. Moreover, it was concluded that the dominant removal mechanism in pure mem-brane was the absorption of BSA molecules within the cake layer rather than the size exclusion and hydro-phobic/hydrophobic interactions. Some studies also have reported the rejection rates of 69.2% and 49.5% during microfiltration of BSA using PVDF and PES/CA microporous membranes, respectively [47, 48].
CONCLUSION
Pure HDPE and HDPE/PE-g-MA/EVA blend mem-branes were fabricated via TIPS method. Several struc-tural characterizations such as FESEM micrograph, AFM and ATR-FTIR analyses, porosity and contact an-gle measurements were carried out to confirm the suc-cessful fabrication of blend membrane, in which a uni-form distribution of blending polymers was obtained.
249
Heidari S. et al.
Polyolefins Journal, Vol. 4, No. 2 (2017)
IPPI
Image J analyzer was used to quantify the mean pore diameter and pore size distribution on the membrane surface. Fouling resistances and pore blocking mech-anism were identified using the resistance-in-series (RIS) and Hermia’s models, respectively.
The RIS model suggested that the addition of EVA in the HDPE matrix decreased the irreversible fouling portion. Combined blocking models revealed that the decline in permeation was mainly due to the cake for-mation and intermediate pore blocking, which simul-taneously occurred for both the membranes. However, comparison between fitted parameters showed that more sever fouling occurred in the case of pure mem-brane. The key reasons for such different fouling be-haviors were mainly attributed to the difference in hy-drophobicity as well as the distribution of pore size on the surface of pure and blend membranes. As a result, because of higher permeability as well as higher foul-ing resistance, the blend membrane is a better choice for filtration process than the pure HDPE membrane.
REFERENCES
1- Bertin D, Leblanc M, Marque SRA, Siri D (2010) Polypropylene degradation: Theoretical and experimental investigations. Polym Degrad Stabil 95: 782-791
2- Gugumus F (2002) Re-examination of the thermal oxidation reactions of polymers 3. Various reactions in polyethylene and polypropylene. Polym Degrad Stabil 77: 147-155
3- Ying Q, Zhao Y, Liu Y(1991) A study of thermal oxidative and thermal mechanical degradation of polypropylene. Makromol Chem 192: 1041-1058
4- Wang X, Wang B, Song L, Wen P, Tang G, Hua Y (2013) Antioxidant behavior of a novel sulfur-bearing hindered phenolic antioxidant with a high molecular weight in polypropylene. Polym Degrad Stabil 98: 1945-1951
5- Voigt W, Todesco R (2002) New approaches to the melt stabilization of polyolefins. Polym Degrad Stabil 77: 397-402
6- Richaud E, Fayolle B, Verdu J (2011) Polypropylene stabilization by hindered phenols - Kinetic aspects. Polym Degrad Stabil 96: 1-11
7- Allen N S, Edge M (1992) Fundamentals of polymer degradation and stabilization.3rd ed., Elsevier, 22-51
8- Marques M, Oliveira R, Araujo R, Amantes B (2014) In situ stabilization of polypropylene by lignin using a Ziegler-Natta catalyst. Polyolefins J 1: 17-24
9- Kim T H, Oh DR (2004) Melt grafting of maleimides having hindered phenol antioxidant onto low molecular weight polyethylene. Polym Degrad Stabil 84: 499-503
10- Shi X, Wang J, Jiang B, Yang Y (2013) Hindered phenol grafted carbon nanotubes for enhanced thermal oxidative stability of polyethylene. Polymer 54: 1167-1176
11- Jahanmardi R, Assempour H (2008) Effects of galbanic acid on thermal and thermo-oxidative stabilities of LLDPE. Iran Polym J 17: 799-806
12- Sabnis RW (2007) Handbook of acid-base indicators. CRC Press, 361-390
13- Abbehausen C, Formiga ALB, Sabadini E, Yoshida IVP (2010) A β-cyclodextrin/siloxane hybrid polymer: Synthesis, characterization and inclusion complexes. J Braz Chem Soc 21: 1867-1876
14- Jahanmardi R, Pourattar P, Soleimani H, Shohani N (2016) Effects of thymolphthalein on thermo-oxidative stability of high density polyethylene in melt and solid states. Int J Ind Chem, in press
15- Yang R, Liu Y, Yu J, Wang K (2006) Thermal oxidation products and kinetics of polyethylene composites. Polym Degrad Stabil 91: 1651-1657
16- Zeynalov E B, Allen N S (2006) Modelling light stabilizers as thermal antioxidants. Polym Degrad Stabil 91: 3390-3396
17- Mohammadhosseini M, Jahanmardi R (2014) Investigating effect of ferric stearate on stabilization efficiency of a phenolic antioxidant during thermal oxidation of polyethylene. Iran Polym J 23: 801-807
18- Ma Z, Wen X, Zhao F, Xia Y, Huang X, Waite D, Guan J (2013) Effect of temperature variation on membrane fouling and microbial community structure in membrane bioreactor. Bioresource Technol 133: 462-468
19- Sim S, Taheri A, Chong T, Krantz W, Fane A

250
Study on the fouling behavior of HDPE/PE-g-MA/EVA blend membrane fabricated via thermally induced phase separation method
Polyolefins Journal, Vol. 4, No. 2 (2017)
IPPI
(2014) Colloidal metastability and membrane fouling–Effects of crossflow velocity, flux, salinity and colloid concentration. J Membrane Sci 469: 174-187
20- Mourouzidis-Mourouzis S, Karabelas A (2006) Whey protein fouling of microfiltration ceramic membranes—pressure effects. J membrane Sci 282: 124-132
21- Behboudi A, Jafarzadeh Y, Yegani R, Akbari A (2017) Preparation and characterization of polyethylene/glass fiber composite membrane prepared via thermally induced phase separation method. Polyolefins J 4: 199-210
22- Fonouni M, Yegani R, Anarjani S, Tavakoli A (2016) Anti-fouling behaviors of surface functionalized high density polyethylene membrane in microfiltration of bovine serum albumin protein. Polyolefins J 4: 13-26
23- Abdelrasoul A, Doan H, Lohi A (2013) A mechanistic model for ultrafiltration membrane fouling by latex. J Membrane Sci 433: 88-99
24- Yuan W, Zydney AL (1999) Humic acid fouling during microfiltration. J Membrane Sci 157: 1-12
25- Jafarzadeh Y, Yegani R (2015) Thermal, mechanical, and structural properties of ZnO/polyethylene membranes made by thermally induced phase separation method. J Appl Polym Sci 132 (30): 42337.
26- Jafarzadeh Y, Yegani R, Tantekin-Ersolmaz S (2015) Effect of TiO2 nanoparticles on structure and properties of high density polyethylene membranes prepared by thermally induced phase separation method. Polym Adv Technol 26: 392-398
27- Kang S, Asatekin A, Mayes AM, Elimelech M (2007) Protein antifouling mechanisms of PAN UF membranes incorporating PAN-g-PEO additive. J Membrane Sci 296: 42-50
28- Rajabzadeh S, Maruyama T, Ohmukai Y, Sotani T, Matsuyama H (2009) Preparation of PVDF/PMMA blend hollow fiber membrane via thermally induced phase separation (TIPS) method. Separ Purif Technol 66: 76-83
29- Shokri E, Yegani R, Heidari S, Shoeyb Z (2015) Effect of PE-g-MA compatibilizer on the structure and performance of HDPE/EVA blend
membranes fabricated via TIPS method. Chem Eng Res Des 100:237-247
30- Chang I-S, Field R, Cui Z (2009) Limitations of resistance-in-series model for fouling analysis inmembrane bioreactors: A cautionary note. Desalin Water Treat 8: 31-36
31- Chang I-S, Kim S-N (2005) Wastewater treatment using membrane filtration—effect ofbiosolids concentration on cake resistance. Process Biochem 40: 1307-1314
32- Gésan-Guiziou G, Boyaval E, Daufin G (1999) Critical stability conditions in crossflow microfiltration of skimmed milk: transition to irreversible deposition. J Membrane Sci 158: 211-222
33- Hermans P, Bredée H (1936) Principles of the mathematical treatment of constant-pressure filtration. J Soc Chem Ind 55: 1-4
34- Jafarzadeh Y, Yegani R (2015) Analysis of fouling mechanisms in TiO2 embedded high density polyethylene membranes for collagen separation. Chem Eng Res Des 93: 684-695
35- Bolton G, LaCasse D, Kuriyel R (2006) Combined models of membrane fouling: Development and application to microfiltration and ultrafiltration of biological fluids. J Membrane Sci 277: 75-84
36- Akbari A, Yegani R, Razavi M, Alikhani M (2011) Preparation of high density polyethylene (HDPE) membranes via thermally induced phase separation. In: Proceeding of the 7th International Chemical Engineering Congress and Exhibition
37- Mansourizadeh A,Azad AJ (2014) Preparation of blendpolyethersulfone/cellulose acetate/poly-ethylene glycol asymmetric membranes for oil–water separation. J Polym Res 21: 1-9
38- Jafarzadeh Y, Yegani R, Sedaghat M (2014) Preparation, characterization and fouling analysis of ZnO/polyethylene hybrid membranes for collagen separation. Chem Eng Res Des 94:417-427
39- Majid RA, Ismail H, Taib RM (2010) Effects of polyethylene-g-maleic anhydride on properties of low density polyethylene/thermoplastic sago starch reinforced kenaf fibre composites. Iran Polym J 19: 501-510
40- Lalia BS, Kochkodan V, Hashaikeh R, Hilal

251
Heidari S. et al.
Polyolefins Journal, Vol. 4, No. 2 (2017)
IPPI
N (2013) A review on membrane fabrication: Structure, properties and performance relationship. Desalination 326: 77-95
41- Nghiem LD, Hawkes S (2009) Effects of membrane fouling on the nanofiltration of trace organic contaminants. Desalination 236: 273-281
42- Yunos MZ, Harun Z, Basri H, Ismail AF (2014) Studies on fouling by natural organic matter (NOM) on polysulfone membranes: Effect of polyethyleneglycol (PEG). Desalination 333: 36-44
43- Amin INHM, Mohammad AW, Markom M, Peng LC, Hilal N (2010) Analysis of deposition mechanism during ultrafiltration of glycerin-rich solutions. Desalination 261: 313-320
44- Vela MCV, Blanco SA, García JL, Rodríguez EB (2008) Analysis of membrane pore blocking models applied to the ultrafiltration of PEG. Separ purif Technol 62: 489-498
45- Siddiqui MU, Arif AFM, Bashmal S (2016) Permeability-selectivity analysis of microfiltration and ultrafiltration membranes: effect of pore size and shape distribution and membrane stretching. membranes 6: 40
46- Donovan R.P. (1985) Fabric filtration for combustion sources, CRC Press, New York, NY.
47- Liu SH, Xu ZL, Liu M, Wei YM, Guo F (2017) Preparation and characterization of PES/CA microporous membranes via reverse thermally induced phase separation process. Polymer Engineering & Science, In Press, DOI: 10.1002/pen.24545
48- Zhang Q, Lu X, Zhao L (2014) Preparation of polyvinylidene fluoride (PVDF) hollow fiber hemodialysis membranes. Membranes 4: 81-95