blast fragmentation optimization at tarkwa · pdf fileblast fragmentation optimization at...
TRANSCRIPT

The Southern African Institute of Mining and Metallurgy Surface Mining 2008
Alexandra Amiel
Page 113
BLAST FRAGMENTATION OPTIMIZATION AT TARKWA GOLD
MINE USING 6 SIGMA METHODOLOGIES
Miss Alexandra Amiel
Goldfields Ghana Ltd
Tarkwa Gold Mine
Abstract:
Tarkwa Gold Mine is owned by Gold Fields Ghana, IAMGOLD and the Government of
the Republic of Ghana in a 71%, 19% and 10% ratio. The mine is operated by Gold
Fields Ghana. This large, low-grade, open pit, gold mining operation is located in
Tarkwa, in the Western Region of Ghana, approximately 320 kilometres by road, west
of Accra, the capital of Ghana, West Africa.
In the Financial year ended June 2007, the operation mined a total of 108 million tonnes
of which 22 million tonnes was ore. The mined ore is processed through three gyratory
crushers supplying two heap leach pads (North and South) and a carbon-in-leach (CIL)
plant.
Before the 6 Sigma project commenced, the current fragmentation was resulting in sub-
optimal feed size to these crushers. It was decided to use 6 Sigma methodology to
improve the fragmentation. A defect was defined as a fragmentation analysis indicating
less than 95% passing 750mm. The objective was to improve fragmentation in order to
achieve a constant throughput to the north heap leach crusher of 1500 t/hr, a 5%
increase in pit loading efficiency and a 50% decrease in rock breaker hours, equipment
damage costs and in-pit sheeting costs respectively.
However, this was not to be achieved at the expense of grade control as Tarkwa is
exploiting a low grade, high volume deposit and therefore ore dilution must be kept to a
minimum.
This paper is intended to take the reader through the various 6 Sigma phases of the
project (Define – Measure – Analyse – Improve – Control) which have resulted in a
10% reduction in loading times, of which half has been attributed to improved
fragmentation, as well as a substantial increase in blasted stocks.
The focus has been on both drilling and blasting parameters as both processes had to be
taken into account. These parameters are technical but personnel factors were also
identified and dealt with as they arose.
In order to measure the impact of any change in the process parameters on the
fragmentation size distribution, cameras have been acquired. One has been installed
looking into the bowl of the north crusher and the other one was dedicated to field
observation, of individual blasts. Both are used for on-going fragmentation analysis.
At Tarkwa, mining efficiency is strongly dependent on good fragmentation as well as
the presence of un-blasted “toes” on the pit floors. Crusher throughput depends on an
The Southern African Institute of Mining and Metallurgy Surface Mining 2008
Alexandra Amiel
Page 114
acceptable ore fragment size. Compliance to plan with regards to actual hole depths was
temporarily monitored by manual hole dipping, but, this is now being replaced with a
fully automated Drill Data Management system developed by Sandvik and Modular
Mining.
The Six Sigma methodologies, using control charts based on data collected in the field,
allowed the mine to improve methods with regards to the control of blasted material. It
also enforced the implementation of a quality control programme encompassing the
entire Drill and Blast process.
1. Introduction
The primary objectives of the optimisation are to maximise crusher throughput and
minimise loading times. The greatest influence on both can be realised through
improved fragmentation of the blasted ore and waste within the pit.
The measure of the effect of the size distribution of the blasted material was done via:
√ Analysis of pictures taken in the pit, after the blast, or from a camera newly
installed facing the bowl of the north crusher. This was done with software
acquired from Split Engineering
√ Monitoring of the rock breaker hours
√ Continuous monitoring of loading times for all the mine’s excavators
After the first phases of the 6 Sigma methodology, Define – Measure – Analyse, the
Improve phase will introduce new procedures and their effect will be evaluated by
monitoring the effects of such changes in blasting and mining parameters that affect
fragmentation.
2. Tarkwa Gold Mine
2.1 Location and history
Tarkwa Gold Mine is located in Southern Ghana, approximately 320 kilometres by
road, west of Accra, capital of Ghana. It is an open pit gold mining operation situated 5°
north and 2° west.
The current mining area is 56 square kilometres.

The Southern African Institute of Mining and Metallurgy Surface Mining 2008
Alexandra Amiel
Page 115
Figure 1: Map of Africa and Ghana. Location of Tarkwa
The summary of the mining history given hereunder is based on the work of (Griffis, et
al. 2002), Brown (2000), Smith (1996), Spathelf (2002), Karpeta (2002) and the
unpublished reports of Cole (2004 – Abosso Deeps review of previous work) and
Morcombe (2005). Records of The Ghana Chamber of Mines have also been used.
Small-scale gold mining activities are thought to have taken place in the Tarkwa district
for several centuries. In 1877, rumours of extensive artisanal workings led Marie-
Joseph Bonnat to investigate the Taquah area, where he subsequently acquired a 40-
year mining lease in 1878. In 1888, the concession passed into the hands of the British
registered Tarkwa and Abosso Gold Mining Company. The company was reconstructed
twice, once the following year and again in 1900.
The company known as “Taquah and Abosso Mines Limited” came into existence in
1927 as a result of the reconstruction and amalgamation process, including the, Abosso,
Adja Bippo and Cinnamon Bippo Mines and the Taquah Mine located within the
Tarkwa town itself.
Amalgamated Banket Areas was registered in 1935 comprising of the Abontiakoon and
Taquah properties. This was followed by the opening up and development of the
Mantraim, Pepe and Akontansi properties.
In 1961 the State Gold Mining Company was registered and this organisation took over
operations. Amalgamated Banket Areas was later incorporated in to Tarkwa Goldfields
in late 1972.
In 1992 the State Gold Mining Company invited Gold Fields to perform due diligences
of both Prestea Goldfields and Tarkwa Goldfields and Gold Fields took over operations
at Tarkwa in July 1993.
Surface mining operations commenced in 1997 and underground operations were
discontinued in 1999 once the ore in the underground syncline was exhausted.
The Southern African Institute of Mining and Metallurgy Surface Mining 2008
Alexandra Amiel
Page 116
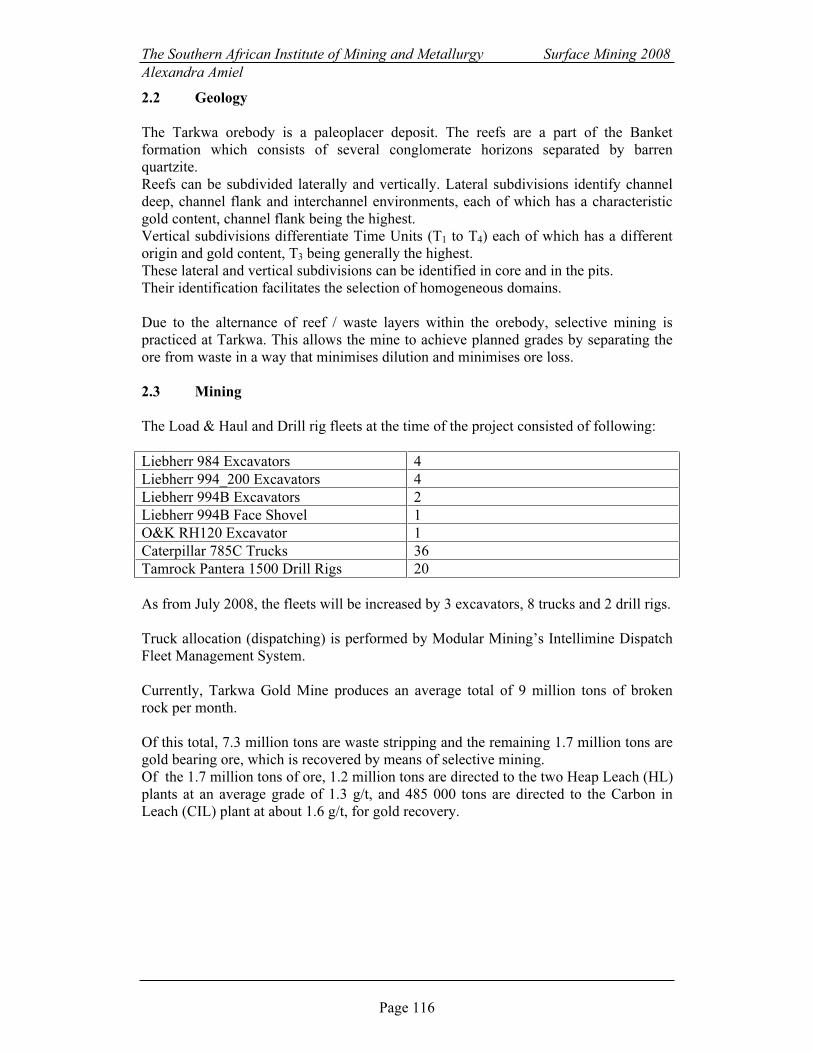
2.2 Geology
The Tarkwa orebody is a paleoplacer deposit. The reefs are a part of the Banket
formation which consists of several conglomerate horizons separated by barren
quartzite.
Reefs can be subdivided laterally and vertically. Lateral subdivisions identify channel
deep, channel flank and interchannel environments, each of which has a characteristic
gold content, channel flank being the highest.
Vertical subdivisions differentiate Time Units (T1 to T
4) each of which has a different
origin and gold content, T3 being generally the highest.
These lateral and vertical subdivisions can be identified in core and in the pits.
Their identification facilitates the selection of homogeneous domains.
Due to the alternance of reef / waste layers within the orebody, selective mining is
practiced at Tarkwa. This allows the mine to achieve planned grades by separating the
ore from waste in a way that minimises dilution and minimises ore loss.
2.3 Mining
The Load & Haul and Drill rig fleets at the time of the project consisted of following:
Liebherr 984 Excavators 4
Liebherr 994_200 Excavators 4
Liebherr 994B Excavators 2
Liebherr 994B Face Shovel 1
O&K RH120 Excavator 1
Caterpillar 785C Trucks 36
Tamrock Pantera 1500 Drill Rigs 20
As from July 2008, the fleets will be increased by 3 excavators, 8 trucks and 2 drill rigs.
Truck allocation (dispatching) is performed by Modular Mining’s Intellimine Dispatch
Fleet Management System.
Currently, Tarkwa Gold Mine produces an average total of 9 million tons of broken
rock per month.
Of this total, 7.3 million tons are waste stripping and the remaining 1.7 million tons are
gold bearing ore, which is recovered by means of selective mining.
Of the 1.7 million tons of ore, 1.2 million tons are directed to the two Heap Leach (HL)
plants at an average grade of 1.3 g/t, and 485 000 tons are directed to the Carbon in
Leach (CIL) plant at about 1.6 g/t, for gold recovery.
The Southern African Institute of Mining and Metallurgy Surface Mining 2008
Alexandra Amiel
Page 117
2.4 Processing
Currently, an average of 1.4 million tons of Heap Leach ore and 410,000 tons of
CIL/Mill ore is crushed on a monthly basis.
Primary crushing reduces the bulk ore to a fragment size of about 100 mm, from where
the CIL material goes straight to the mill.
The HL material goes through secondary and tertiary crushers to reduce the fragment
size to an average of 8 to 12 mm, before it gets routed on a series of conveyors to the
agglomeration plants.
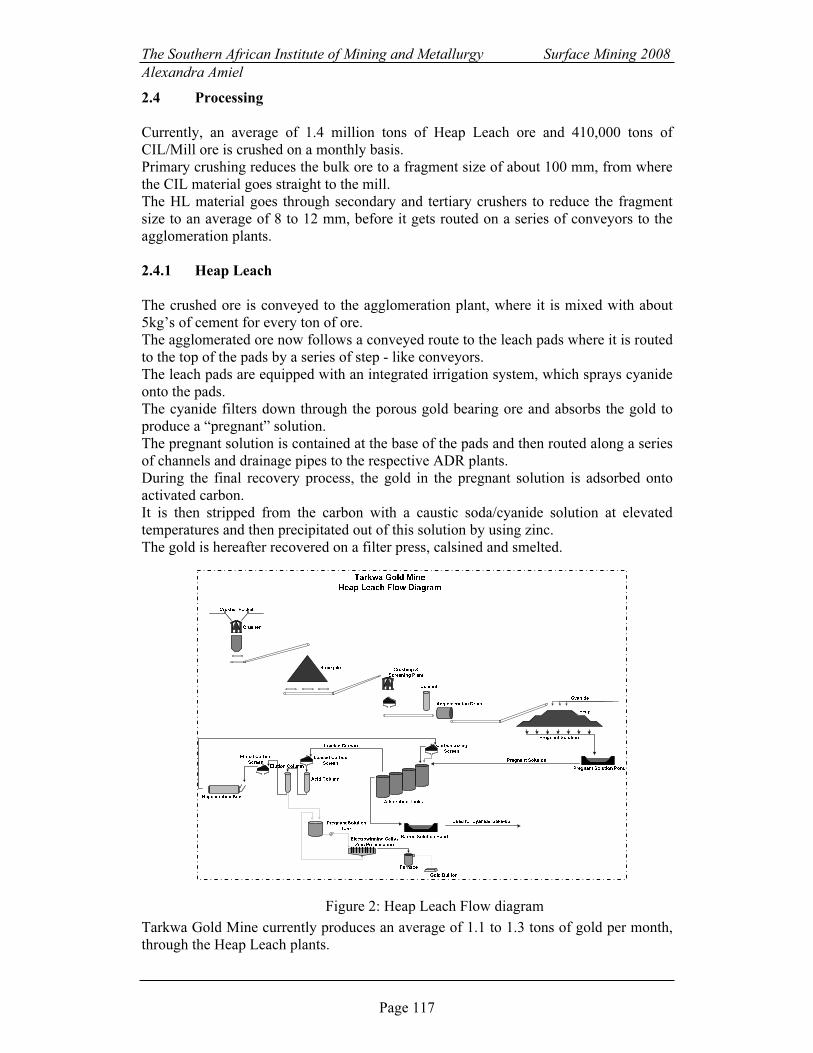
2.4.1 Heap Leach
The crushed ore is conveyed to the agglomeration plant, where it is mixed with about
5kg’s of cement for every ton of ore.
The agglomerated ore now follows a conveyed route to the leach pads where it is routed
to the top of the pads by a series of step - like conveyors.
The leach pads are equipped with an integrated irrigation system, which sprays cyanide
onto the pads.
The cyanide filters down through the porous gold bearing ore and absorbs the gold to
produce a “pregnant” solution.
The pregnant solution is contained at the base of the pads and then routed along a series
of channels and drainage pipes to the respective ADR plants.
During the final recovery process, the gold in the pregnant solution is adsorbed onto
activated carbon.
It is then stripped from the carbon with a caustic soda/cyanide solution at elevated
temperatures and then precipitated out of this solution by using zinc.
The gold is hereafter recovered on a filter press, calsined and smelted.
Tarkwa Gold Mine currently produces an average of 1.1 to 1.3 tons of gold per month,
through the Heap Leach plants.
Figure 2: Heap Leach Flow diagram
The Southern African Institute of Mining and Metallurgy Surface Mining 2008
Alexandra Amiel
Page 118
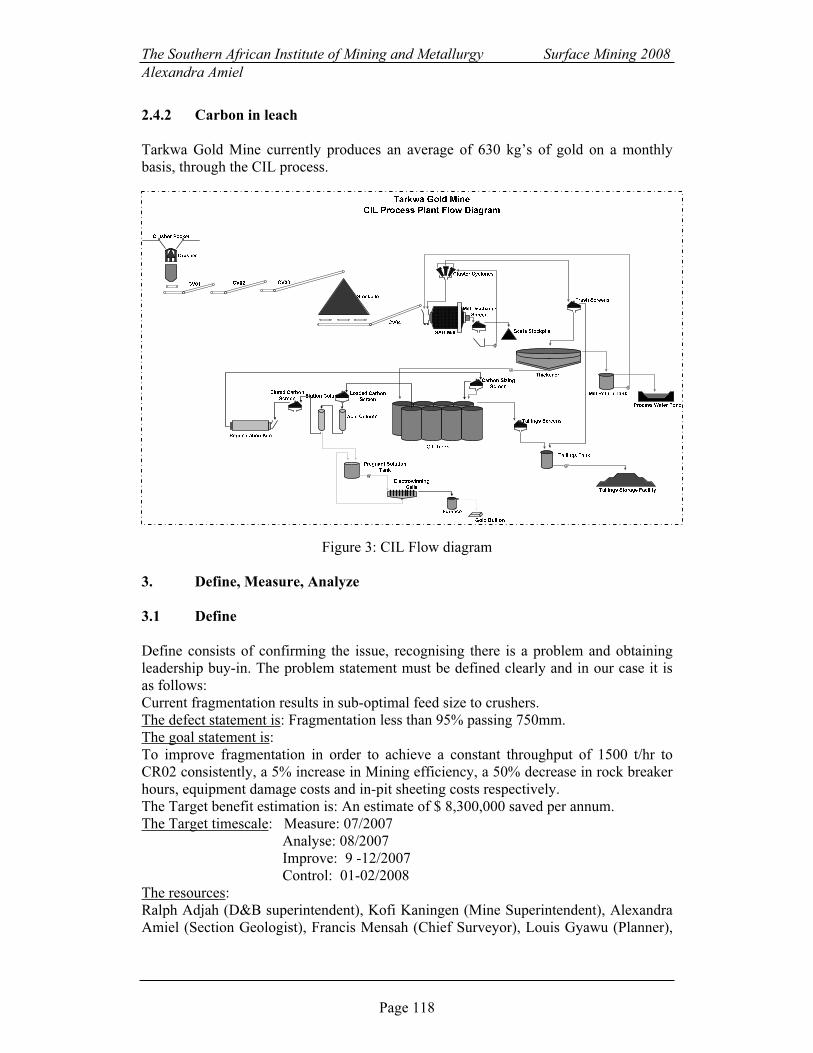
2.4.2 Carbon in leach
Tarkwa Gold Mine currently produces an average of 630 kg’s of gold on a monthly
basis, through the CIL process.
Figure 3: CIL Flow diagram
3. Define, Measure, Analyze
3.1 Define
Define consists of confirming the issue, recognising there is a problem and obtaining
leadership buy-in. The problem statement must be defined clearly and in our case it is
as follows:
Current fragmentation results in sub-optimal feed size to crushers.
The defect statement is: Fragmentation less than 95% passing 750mm.
The goal statement is:
To improve fragmentation in order to achieve a constant throughput of 1500 t/hr to
CR02 consistently, a 5% increase in Mining efficiency, a 50% decrease in rock breaker
hours, equipment damage costs and in-pit sheeting costs respectively.
The Target benefit estimation is: An estimate of $ 8,300,000 saved per annum.
The Target timescale: Measure: 07/2007
Analyse: 08/2007
Improve: 9 -12/2007
Control: 01-02/2008
The resources:
Ralph Adjah (D&B superintendent), Kofi Kaningen (Mine Superintendent), Alexandra
Amiel (Section Geologist), Francis Mensah (Chief Surveyor), Louis Gyawu (Planner),

The Southern African Institute of Mining and Metallurgy Surface Mining 2008
Alexandra Amiel
Page 119
Peter Thomson (Technical Services - Unit Manager ), Patrick Kpekpena (Mining
Manager) Sponsor.
3.2 Measure
This step characterises the opportunity, defines the process, identifies the key inputs,
determines the performance against Critical to Quality (CTQ) customer specifications,
makes lean efficiency improvements.
The SIPOC (Suppliers, Inputs, Process, Outputs, Customers) diagram supplies a high
level scoping for the process that generates the problem (process divided to sub
processes) and has been established as follow:
Figure 5: SIPOC
High crushing rate
No toes
Block design respected
Footwall design respected
Blast according to plan
No metal GET
Good blasted stocks
Good hauling rate
No equipment damage
Good loading rate
Totals 20.0 16.2 3.6 21.3 18.6 21.0 21.9 22.2
CTQ
ftra
gm
en
ta
tio
n siz
e (in
%
pa
ssin
g)
% re
-d
rille
d
Re
lativ
e im
po
rta
nce
to
cu
sto
me
r
Pro
po
rtio
n b
laste
d o
n ta
rg
et ( %
)
Nb
o
f lo
st h
ou
rs d
ue
to
d
am
ag
e
eq
uip
me
nt
Nb
o
f ro
ck b
re
ake
r h
ou
rs
Ho
le d
ep
th
ve
rsu
s p
lan
ne
d
de
pth
s in
m
ete
rs
Am
ou
nt o
f in
-p
it sh
ee
tin
g in
$
Qu
an
tity a
nd
q
ua
lity o
f
exp
losiv
es
Quality
Characteristics
(VOP)
Quality
Characteristics
(VOP)
Customer Demands
(VOC)
The voice of the customer helps
identifying the key process
characteristics:
- Which of these are critical to
delivering customer needs?
- What is the impact of the
measurable things on each of
the customer demands?
The results show that the % re-drilled
the fragmentation size and the hole
depths come first with regards to the
impact on production and crusher
throughput.
Figure 4: Voice of the customer
The Southern African Institute of Mining and Metallurgy Surface Mining 2008
Alexandra Amiel
Page 120
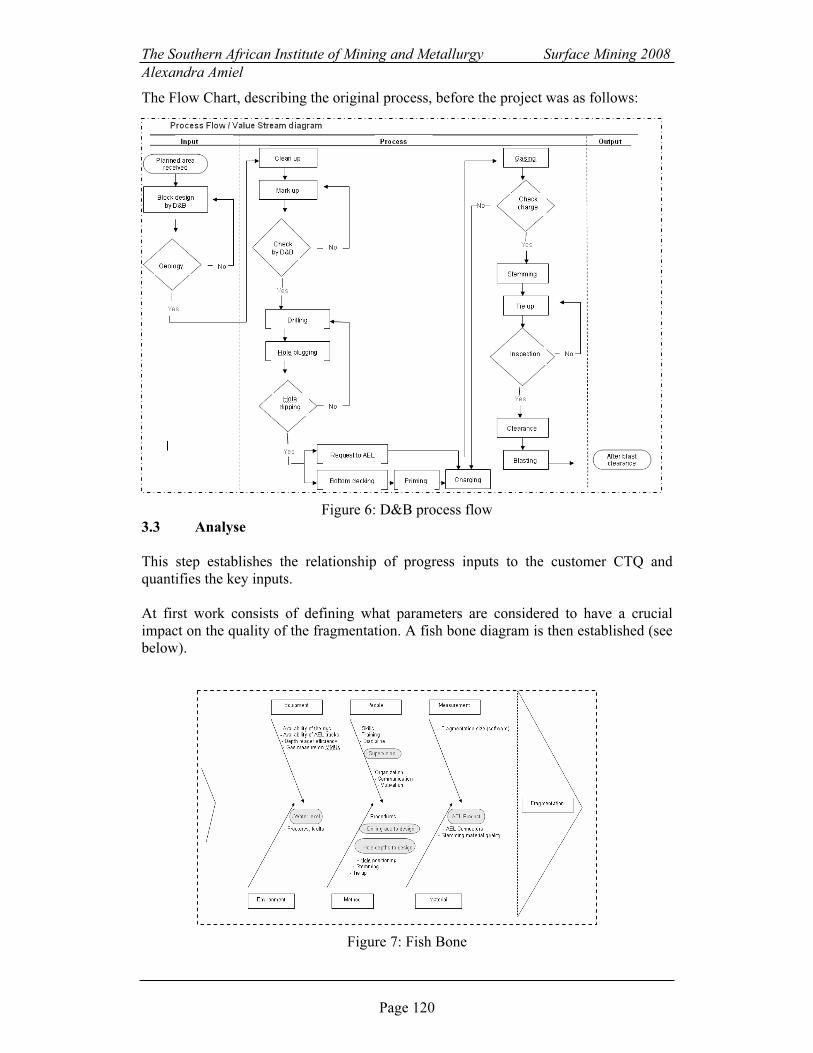
The Flow Chart, describing the original process, before the project was as follows:
Figure 6: D&B process flow
3.3 Analyse
This step establishes the relationship of progress inputs to the customer CTQ and
quantifies the key inputs.
At first work consists of defining what parameters are considered to have a crucial
impact on the quality of the fragmentation. A fish bone diagram is then established (see
below).
Figure 7: Fish Bone

The Southern African Institute of Mining and Metallurgy Surface Mining 2008
Alexandra Amiel
Page 121
At Tarkwa, the following parameters which have been highlighted have to be
quantified:
Ground water levels are linked to the fragmentation as this results in an increased
number of holes to be re-drilled which in turn have a relationship with achieved
fragmentation.
The impact of competent drilling supervision and of drilling to design boundaries on
fragmentation is difficult to estimate from data and test hypotheses. However, we
studied performances according to the different crews, drillers and machines.
Compliance of actual hole depth with design hole depth was monitored and a
relationship determined between compliance and fragmentation.
We linked the quality of the explosive to the achieved fragmentation by taking
photographs of the different blasts for which we have recorded the quality of the
product. The studies also monitored the performance of the different MMU
(Manufacturing Mobile Units) trucks delivering the explosives as well.
3.3.1 Data
The parameters identified in the preceding phase had to be checked as being the
“crucial ones”. This was done by using data and performing numerous tests.
The 6 Sigma methods used to analyse the data require knowing the kind of data we
work with, in terms of distribution, as well as a minimum number of data for it to be
accurate and representative.
If we take the case of the holes not drilled to the correct depth, we are working with a
proportion of defects. Therefore, the formula we have to use is as below:
n = (1.96 / 0.05)2
x 0.4 x (1-0.4) as we want 95% confidence, with 20 cm margin of
error and knowing that according to various studies 60% of compliance, in average, is
met.
Which gives us n = 369 holes. All our studies relative to the hole depth compliance use
much more data than this minimum number.
Moreover, the distribution of the data shows a normal distribution (see below) which
allows us to perform some parametric tests.

The Southern African Institute of Mining and Metallurgy Surface Mining 2008
Alexandra Amiel
Page 122
Figure 8: Histogram for the discrepancies between the actual / planned depths (11,365
data points from week 43 to week 45, 2007)
In general, we could collect enough data to make all the studies relevant.
3.3.2 Effects of the rainfall
The graphs below show that the proportion of re-drilled holes follows the trend of the
rain fall.
In terms of water level, the hypothesis tests show clearly that we must solve the water
management problem as the amount of re-drilling is very dependent on the amount of
water present. Re-drilling affects fragmentation (loss of power) and is costly.
Figure 9: Rainfall in Tarkwa and re-drilling
3.3.3 Supervision and drilling to depth
Drill depth data was collected by employing additional surveyors for a period of three
months. These surveyors followed behind the drill rigs, day and night, and dipped each
and every hole drilled
proportion re-drilled vs rainfall
R = 0.7163
0
0.02
0.04
0.06
0.08
0.1
0.12
0 50 100 150 200 250 300 350 400 450
Rainfall (average in mm)
pro
po
rtio
n o
f re
drille
d
Re-drilled vs rainfall
Linear (Re-drilled vs rainfall)
0
0.02
0.04
0.06
0.08
0.1
0.12
Jul-06
Aug-06
Sep-06
Oct-06
Nov-06
Dec-06
Jan-07
Feb-07
Mar-07
Apr-07
May-07
Jun-07
Jul-07
Aug-07
Sep-07
Oct-07
Nov-07
Dec-07
Jan-08
Feb-08
Mar-08
0
50
100
150
200
250
300
350
400
450
UCL
LCL
redrilled
target (max)
rain fall
proportion re-drilled and quantity of rain fall per month

The Southern African Institute of Mining and Metallurgy Surface Mining 2008
Alexandra Amiel
Page 123
The conclusion of the test hypothesis on this data shows that:
Drilling performance may depend on the areas to be drilled.
Drilling performance does not depend on the crews.
All the tests showed that, overall, the crews are performing the same way.
Drilling performance does depend strongly on the individual operators.
Therefore, even though the crews are performing in the same way overall, they all
present “good and bad” performances from individual drillers.
The % compliance is calculated with an allowed margin of error of +/- 20 cm. We can
see below, the comparison of the performance of two drillers.
Figure 10: Comparison between the efficiencies of two drillers
Process capability (Cpk) compares the actual variation within a process to its allowed
limits of variation. The allowed limits of variation are indicated as USL and LSL (upper
and lower specification limits). A process capability of 0.33 indicates a process running
at one Sigma. Typical goals for capability indices are greater than 1.33 (4 Sigma).
In our case:
• The process capability analysis for Rig 02, with USL = +30 cm
with LSL = -20 cm is as follows
and indicates a Cpk of 0.53 with only 10% of the results falling outside specification
interval.
Note that most of the holes outside specification have been drilled deeper and not
shorter.
• The process capability analysis for Rig 05, with USL = +30 cm
with LSL = -20 cm is as follows
and gives a Cpk of -0.16, which is extremely poor, with 55% of holes falling outside the
specification interval.
Note that most of the holes out of specification have been drilled shorter which means
planned floor levels may not be achieved.
ridge week 37 diff (meas - exp) Rig 02 crew C
-3
-2
-1
0
1
2
3
difference
difference
UCL
LCL
holes
drilled
too short
holes
drilled
deeper
ridge week 37 diff (meas - exp) Rig 05 crew C
-3
-2
-1
0
1
2
3
difference dif ference
UCL
LCL

The Southern African Institute of Mining and Metallurgy Surface Mining 2008
Alexandra Amiel
Page 124
Figure 11: Process capabilities for Rig 02 and Rig 05
Figure 12, to the right, shows the holes drilled by both rigs to be in the same area.
The above graphs show clearly that with the same conditions, the performances of the
rig operators are very different.
3.3.4 Toes and drilling to design
Studies indicated that the amount of “toes” is linked directly to the ability in achieving
design boundaries. Designs must be performed carefully in order to avoid irregular
shapes and must be followed strictly in the field. This will help the D&B process to
achieve the required fragmentation.
Indeed, a study made before the 6 Sigma project showed that the occurrence of the toes
was linked to the irregular shapes of the boundaries between the blasts. To avoid the
presence of “toes” and boulders, the design must be as square as possible and must be
followed in the field as per design. An example is shown below and indicates the
presence of toes where irregular boundaries meet:
Rig 02 / Rig 05 drilling locations
9900
9950
10000
10050
10100
10150
10200
10250
7150 7200 7250 7300 7350 7400 7450 7500
eastern
northern
Rig05_CrewC
Rig02_CrewC
Capability Analysis Capability Analysis
The Southern African Institute of Mining and Metallurgy Surface Mining 2008
Alexandra Amiel
Page 125
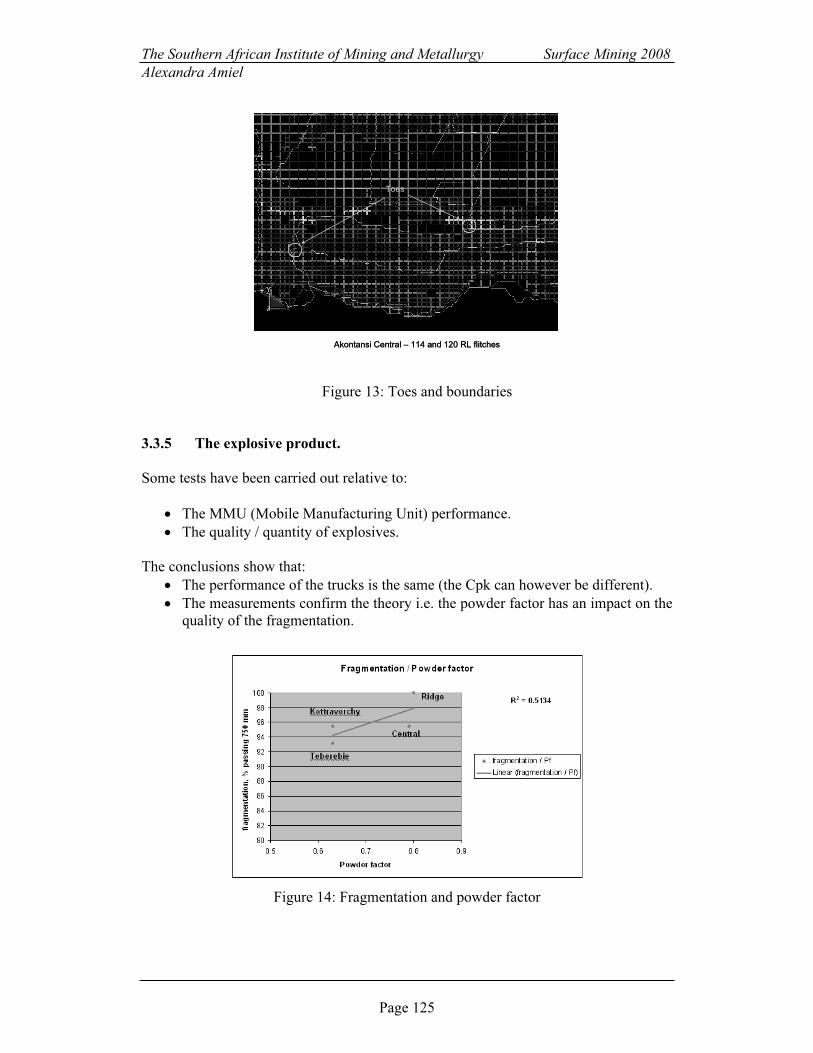
Figure 13: Toes and boundaries
3.3.5 The explosive product.
Some tests have been carried out relative to:
• The MMU (Mobile Manufacturing Unit) performance.
• The quality / quantity of explosives.
The conclusions show that:
• The performance of the trucks is the same (the Cpk can however be different).
• The measurements confirm the theory i.e. the powder factor has an impact on the
quality of the fragmentation.
Figure 14: Fragmentation and powder factor
Toes
Akontansi Central – 114 and 120 RL flitches
ToesToes
Akontansi Central – 114 and 120 RL flitches

The Southern African Institute of Mining and Metallurgy Surface Mining 2008
Alexandra Amiel
Page 126
Note that the monitoring of the fragmentation has been possible due to the acquisition
of the Split engineering software and the cameras.
According to the conclusions emanating from the tests that have been conducted,
indications were that focus must be on the parameters that were identified at the
beginning, as per the fish bone.
4. Improve, Control, Results
4.1 Improve
Determines, validates and implements solutions to achieve the goal statement.
4.1.1 Water control
A program has been established by the Six Sigma team covering all the pits. The
problems have been identified and solutions proposed to reduce them. This program has
been sent across the mine for eventual input from various departments and the final
version is with management. A trench and other construction works have been
implemented.
D&B is using small cones, placed on top of the newly drilled holes to avoid collar
collapse.
4.1.2 Drilling to design boundaries
The design is established by the D&B engineer and must take into account planning,
geology and in pit roads, etc. The design is then marked out in the field by the
surveyors upon request of the planners.
The mark up has been improved as the limits of the blasts are indicated with tapes and
not just by pegs representing the corner of the blast as was the case previously.
The position of each and every hole to be drilled is marked out by the Survey
department using GPS. Measuring ropes (a primitive way of laying out blast patterns) is
used only in exceptional cases should there be difficulty in surveying.
Where there is difficulty in achieving the required design, a form (sign off sheet) exists
and defines the compromise that could be found in the field by consulting geology and /
or planning.
Floor clean-up, prior to mark up, was a major factor in delaying blasts and/or leading to
blasts not complying with planned boundaries. This item has been improved by
involving the production crews in the clean up operations. A weekly schedule is issued
each week by the D&B engineer with deadlines. Each production crew is responsible
for cleaning allocated pits.
4.1.3 Supervision and drill depth compliance
Surveyors used to write the required depths on the pit floor during mark up. This has
been stopped as the depths could be erased by heavy rainfalls experienced in Ghana.
The required depth for each hole is indicated on plans prepared by the surveyors. The
plans are given to the drill rig operators who must align themselves in the field and
respect the required depths. The beginning of each row of holes is indicated with flags

The Southern African Institute of Mining and Metallurgy Surface Mining 2008
Alexandra Amiel
Page 127
numbered as per the drilling plans, allowing the drillers to locate individual holes. Hole
dippers check depths and short holes are re-drilled immediately.
An automated system is currently being installed in each of the mine’s 20 drill rigs.
This system has been developed by Sandvik and Modular Mining. Once up and running
hole depths will be shown on a rig operators graphics console and the depth of the hole
recorded along with the planned depths. Control charts of compliance will then be
created automatically for each operator.
The transmission of information has been improved as well. At shift change, the
supervisors are arriving earlier to pass on the necessary information and make a round
of the pits. This minimises the misunderstandings of job locations.
A notice board has been installed and shows the future blocks to be drilled and blasted.
In parallel, some files have been created on the server for a better communication
between the different players within the D&B process.
Training has been intensified. Two information sessions took place for the drilling
crews as well as a rock tools session. For the blast crews, a session with the explosive
company took place. The Geologists have been shown a presentation to improve the
communication between these two departments and to update them on the new methods
put in place.
A Surpac training session has been held concerning the D&B design function and a
multidisciplinary team (consisting of the main actors of the D&B process) attended.
An extra position has been created, a D&B junior assistant. Appointments have been re-
written and signed off. In general, responsibilities are redefined and explained clearly.
People must be accountable for their achievements and failures.
Procedures have been re-written: the improvements put in place are integrated in the
procedures and presentations of the job specific training.
4.1.4 The explosive product.
In order to improve gassing control, AEL has been asked to design an automatic alarm
system for the MMUs to indicate a fault in the gassing process.
To avoid forgetting charging of any holes, a blue flag is used to indicate if a hole has
not been charged.
4.1.5 New techniques.
Tests have been carried out to improve the efficiency of the D&B process using new
techniques.
First, burden and spacing are now dependent on rock hardnesses as indicated by the
geological model. As the pits get deeper, so the rock gets harder. Staggered patterns
have been maintained. The original stemming height was maintained as well. Blasts are
orientated to throw along strike to minimise ore dilution.
The density of 1.09 g/cc for the explosives has been tested instead of an original density
of 1.15 g/cc. This has resulted in cost savings without affecting the fragmentation
quality. All the tests so far have been successful. This allows the mine to save money,
while maintaining a high efficiency in terms of fragmentation (a saving of around
$793,000 per year).

The Southern African Institute of Mining and Metallurgy Surface Mining 2008
Alexandra Amiel
Page 128
The detonation limit is 1.08g/cc (i.e. there is no detonation below this density),
therefore the 1.09 product is not used for footwall designs where holes are shorter.
Figure 15: Calculations of the in-hole density with d = 1.09 g /cc
Two trials were undertaken using electronic detonators and no discernable difference
was observed.
Tulip plugs have been tested with very good results, in wet and dry conditions:
Figure 16: Tulips and fragmentation
• Drilling floor improvement.
• Less spent ore for in-pit roads.
• Loading times reduced.
• Powder Factor reduced.
• Lower heave.
• Sub- drill can be reduced.
• Increased uniformed fragmentation.
• Tyre life could be increased.
EMULDENS GASSED EXPLOSIVE CALCULATOR
Cup Base :Default densities
Explosive Type: P600 1.00 1.39
Lower Upper Input
Hole Diameter mm 25 450 115
Cup density g/cc 0.9 1.25 1.09 1.00
Base Density g/cc 1 1.45 1.39 1.39
Air pressure kPa 84 102 99
Cup temperature C 10 65 30
Firing temperature C 10 65 30
Gas Loss factor % 0 30 0
Stemming length m 0 10 2.2
Stemming density g/cc 1 2 1.2
Hole Depth m 2.2 42.4 7
Bottom density g/cc 1.208
Average density in hole g/cc 1.178
Total mass kg 58.7
Pressure
m ft kPa
0 0 101
200 656 99
400 1312 97
600 1968 94
800 2624 92
1000 3280 90
1200 3936 88
1400 4592 86
1600 5248 84
1800 5904 81
2000 6560 79
2200 7216 77
2400 7872 75
2600 8528 73
2800 9184 70
Instructions 3000 9840 68
1 Enter data in Blue cells including explosive type
2 Cup and Base Densities suggested in Red cells
3 Take Air pressure from yellow table above vs altitude
4 Ignore Gas Loss Factor for now
5 Bottom Density goes critical at 1.28, limiting depth of use
6 Refer Claude Cunningham
September 30, 2002
Altitude
Depth-Density
0.90
0.95
1.00
1.05
1.10
1.15
1.20
1.25
0 5 10 15 20 25 30 35 40
Depth m
g/cc
P600 Bottom Density
P600 Mean Density
Stemming

The Southern African Institute of Mining and Metallurgy Surface Mining 2008
Alexandra Amiel
Page 129
4.2 Control
The control phase ensures that improvements are sustained and creates an environment
of continuous improvement. A control pack has been given to the D&B engineer
assistant with instructions to follow.
What is monitored /tested:
• Blast boundaries
• Drilling depths
• % Re-drilling
• % Passing 750 mm at the crusher rock breaker hours
• Tests to be done (density, tulips, electronic, casings, bigger Ø)
Each day the D&B engineer assistant has to check the achieved / planned blast
boundaries and sends a report to the Chief Geologist, the Manager Mining, and the
D&B Superintendent.
The depths of the holes will be monitored by the new system which should be up and
running soon. At present 14 drill rigs out of 20 have been equipped with the system and
programmed to transmit relevant data back to the office. One report per week to the
Mining Manager should be sufficient.
Each time poor fragmentation is encountered, a full investigation is carried out. One
way of tracking the poor fragmentation areas is to look at the daily loading time control
charts established for each digger. For instance, this digger's capability analysis is -0.06
which indicates that the digger is incapable of operating as expected (see graph below).
This is due to the poor blast in the area this digger is working in.
Figure 17: Evolution of the loading time when encountering a poor blast area
The diagram below is used to describe the roles and responsibilities of people operating
a process or delivering a project. It is especially useful in clarifying roles and
responsibilities in cross-functional/departmental projects and processes. It has been
presented to the D&B personnel involved.

The Southern African Institute of Mining and Metallurgy Surface Mining 2008
Alexandra Amiel
Page 130
Figure 18: RACI diagram
A Quality Control process map has been established as well. The original flow chart has
not been modified intensively but some control points have been added to the process.
Figure 19: Quality control process map
Financial tracking is also in place to monitor the evolution and financial performance of
the project after closure.
Drill and Blast Field RACI R = Responsible
A = Accountable
C = Consulted
I = Informed
Sp
on
so
r &
P
it
Man
ag
er
Drill an
d B
last
Su
perin
ten
den
t
Drill an
d B
last
En
gin
eer
Assistan
t D
rill
an
d B
last
En
gin
eer
Sen
io
r D
rillin
g
Fo
rem
an
Sectio
n
Geo
lo
gist
Ch
ief S
urveyo
r
Plan
nin
g
En
gin
eer
MM
RS
Sen
io
r B
lastin
g
Fo
rem
an
Clean up complete and signed by Section Geologist I A R I R C
Safe distance maintained between drill rigs I A R I R
Squared up under supervision I A R I R
Rigs drilling along strike I A R I R
Drilling plans available I A R I I R
Drilling plans used by drillers I A R I R
Blast design tapes in place I A R I I R
Blast design tapes adhered to I A R I R C
Drilling flags present and used I A R I R
Hole depth measurement performed I I I I I I I I RA I
Correct pattern applied to different pits I A R I I
Use of sign off sheets for square up, berms ….. I A R I R C C R
Cones used to prevent collapse of holes I A I I R
Blue flags available and used I A C I R
Tulip plugs available and used I A R I R
Density of Product sampled I A R I R
MMU sign off sheets signed off correctly I A R I R

The Southern African Institute of Mining and Metallurgy Surface Mining 2008
Alexandra Amiel
Page 131
4.3 Results
4.3.1 Blasted stocks
Blasted stocks have been increased and allows for flexibility in terms of planning. This
is the result of improved organisation in the drilling phase.
Figure 20: Blasted stocks evolution
4.3.2 Rock breaker hours
Rock breaker hours are plotted on the graph below and show that the oversize material
arriving at the crushers has decreased dramatically.
Figure 21: Hammer hours evolution
500000
1500000
2500000
3500000
4500000
5500000
6500000
7500000
8500000
31/12/2006
18/01/2007
1/02/2007
15/02/2007
1/03/2007
15/03/2007
29/03/2007
12/04/2007
24/04/2007
9/05/2007
23/05/2007
6/06/2007
20/06/2007
4/07/2007
18/07/2007
23/08/2007
6/09/2007
20/09/2007
11/10/2007
21/10/2007
7/11/2007
21/11/2007
5/12/2007
20/12/2007
2/01/2008
16/01/2008
30/01/2008
13/02/2008
28/02/2008
0
100
200
300
400
500
600
700
800
900
1000
Blasted Tons
rain fall (mm)
start of 6 σ project
3 extra rigs
extra digger
( Exc 23)
extra digger
( Exc 41)
hammer hours
0
50
100
150
200
250
300
350
400
Jun-07
Jul-07
Aug-07
Sep-07
Oct-07
Nov-07
Dec-07
Jan-08
Feb-08
hammer hours
start of the 6 σ project
The Southern African Institute of Mining and Metallurgy Surface Mining 2008
Alexandra Amiel
Page 132
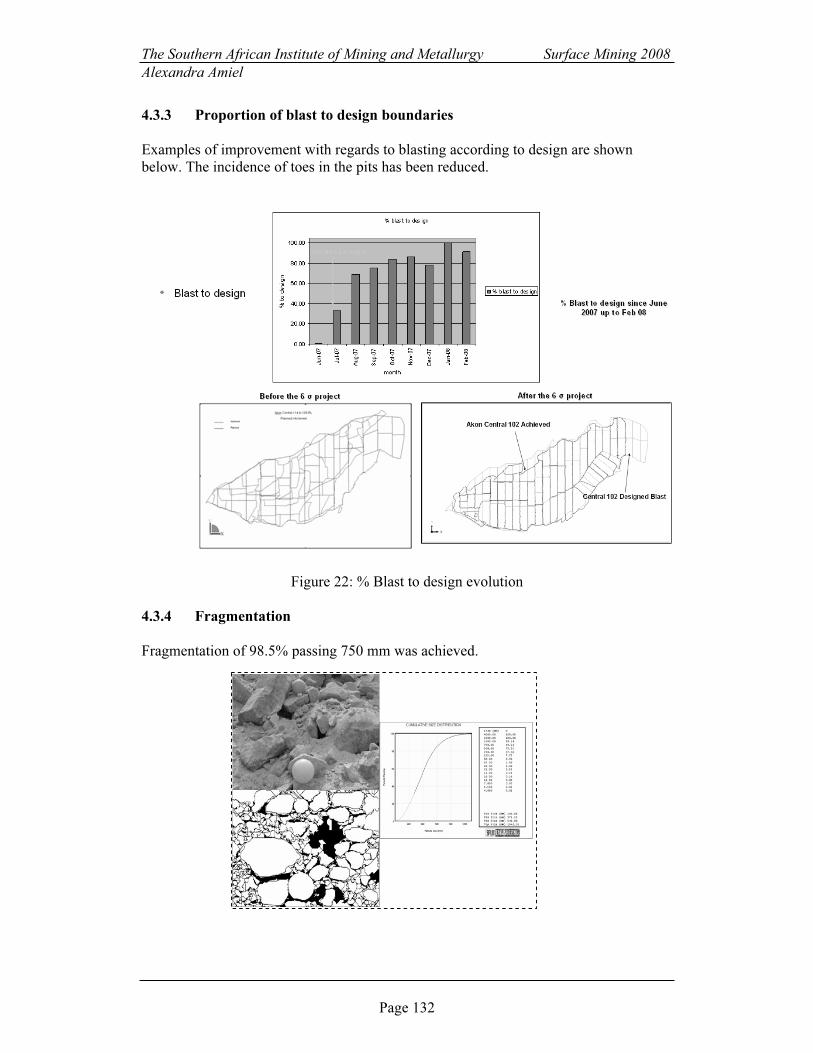
4.3.3 Proportion of blast to design boundaries
Examples of improvement with regards to blasting according to design are shown
below. The incidence of toes in the pits has been reduced.
Figure 22: % Blast to design evolution
4.3.4 Fragmentation
Fragmentation of 98.5% passing 750 mm was achieved.

The Southern African Institute of Mining and Metallurgy Surface Mining 2008
Alexandra Amiel
Page 133
4.3.5 Grade
Dilution may be subdivided into two components, the “planned” dilution and the
“extra” dilution. Planned dilution is the waste at the top or at the bottom of the reef that
is allowed to be taken during select mining. This is quantified (20 cm at the bottom 30
cm at the top of the reef) and included in the ore grade estimates.
Figure 23: Select mining
The “extra” dilution is not included in the ore grade estimates. This is tracked by
reconciling truck counts and model estimates in terms of tons. If fragmentation is poor,
conditions will not allow select mining to be optimised (the planned dilution will not be
respected) and the grade reconciliation can be poor as a result.
Grade control reports versus metallurgical plant check out for the period of the project
shows a reasonably good correlation with lower variations amplitude. This is due to
many factors (model review …) and a good fragmentation could have contributed.
Figure 24: Control chart, belt grade vs model grade reconciliation

The Southern African Institute of Mining and Metallurgy Surface Mining 2008
Alexandra Amiel
Page 134
4.3.6 Costs
In term of cost savings, the incremental increase in the drill and blast cost with the Six
Sigma project is minimal in comparison to the additional revenue as a result of decrease
in the loading times.
Figure 25: Financial tracking
Record crusher throughputs were achieved during the project.
5. Conclusions and Recommendations
Increased focus on drilling and blasting parameters has been identified as critical to the
decrease in loading time and for grade control.
The Six Sigma methodology allowed decisions to be based upon strong data collection
and analysis. The implementation of new procedures have been measured and
evaluated. Fragmentation size analysis has made it possible to link the quality of the
drilling and blasting with the parameters influencing it. The presence of a camera facing
the bowl of one of the crushers (with automatic pictures taken every 5 seconds) will
provide more than sufficient photographs for interpretation and monitoring.
Some parameters, such as drilling depth compliance will be monitored in real-time and
control charts and plots will be integrated in to the automatic system used on the mine.
This will allow immediate decisions to be made in order to continuously improve
fragmentation.
Jan-08 Feb-08 Mar-08 Apr-08
Input
number of holes @ 1.09 g/cc 2,571 0 3,797 24,334
Loading time average 3.98 4 3.9 3.75
number of tulips used 0 1,486 10,000 18,451
Benefits
Pot. Additional gold revenue $1,106,947.91 $1,012,933.72 $1,610,617.34 $2,353,474.46
Tulip Explosive savings $0.00 $4,623.09 $31,111.00 $76,898.23
Reduced equip damage $50,000.00 $50,000.00 $50,000.00 $50,000.00
Reduced expl density $4,169.65 $0.00 $6,157.97 $52,868.05
Reduced R/Brkr Hours $8,450.26 $9,756.04 -$10,194.41 $10,222.39
Costs
Tulip costs $0.00 $3,715.00 $25,000.00 $46,127.50
Drilling flags $750.00 $750.00 $750.00 $750.00
Others
Net benefit $1,164,648.18 $1,072,847.86 $1,655,783.93 $2,443,717.59

The Southern African Institute of Mining and Metallurgy Surface Mining 2008
Alexandra Amiel
Page 135
Figure 26: Story board for the Six Sigma Drill & Blast project

The Southern African Institute of Mining and Metallurgy Surface Mining 2008
Alexandra Amiel
Page 136
6. Acknowledgements
The author would like to thank Gold Fields Ghana Ltd for having given the permission
to publish this paper. The Six Sigma project is a team project and the author would like
to thanks her team and sponsor as well as the Geology, Mining, Planning and Survey
departments for their common efforts. Thanks to James Collins from AEL for his
expertise and consulting during this project. I would particularly like to thank Peter
Thomson for his support and his help as well as Rod Thorogood and Frances Eames
from Aorist Consulting for their Six Sigma training and expertise.