blanca lazaro - training, working sessions and retreat, omsar beirut 7-11 december 2015
Upload: support-for-improvement-in-governance-and-management-sigma-oecd
Post on 13-Apr-2017
200 views
TRANSCRIPT

© OECD
A j
oin
t i
nit
iati
ve o
f th
e O
EC
D a
nd
th
e E
uro
pe
an
Un
ion
,
pri
nc
ipall
y f
ina
nced
by t
he
EU
Institutional development of the Office
of the Minister of State for Administrative Reform (OMSAR)
Work sessions on corporate planning, monitoring and evaluation
Blanca Lazaro 7-8 December 2015
BEIRUT

A j
oin
t i
nit
iati
ve o
f th
e O
EC
D a
nd
th
e E
uro
pe
an
Un
ion
,
pri
nc
ipall
y f
ina
nced
by t
he
EU
Goals of the line of work
Long-term
To develop a model of work organisation that allows OMSAR:
1. To define and to implement a corporate strategy.
2. To align OMSAR teams with the corporate strategy.
3. To define, incorporate and use a PME system at corporate level.
Short-term
1. To establish a common conceptual framework on corporate strategic planning in public organisations.
2. To introduce concepts and methods of policy monitoring and evaluation that could be applied by OMSAR.
3. To implement 1 – 2 pilots to develop planning, monitoring and evaluation tools and procedures adapted to OMSAR.
4. To define responsibilities and tasks related to corporate planning and monitoring.
1
A j
oin
t i
nit
iati
ve o
f th
e O
EC
D a
nd
th
e E
uro
pe
an
Un
ion
,
pri
nc
ipall
y f
ina
nced
by t
he
EU
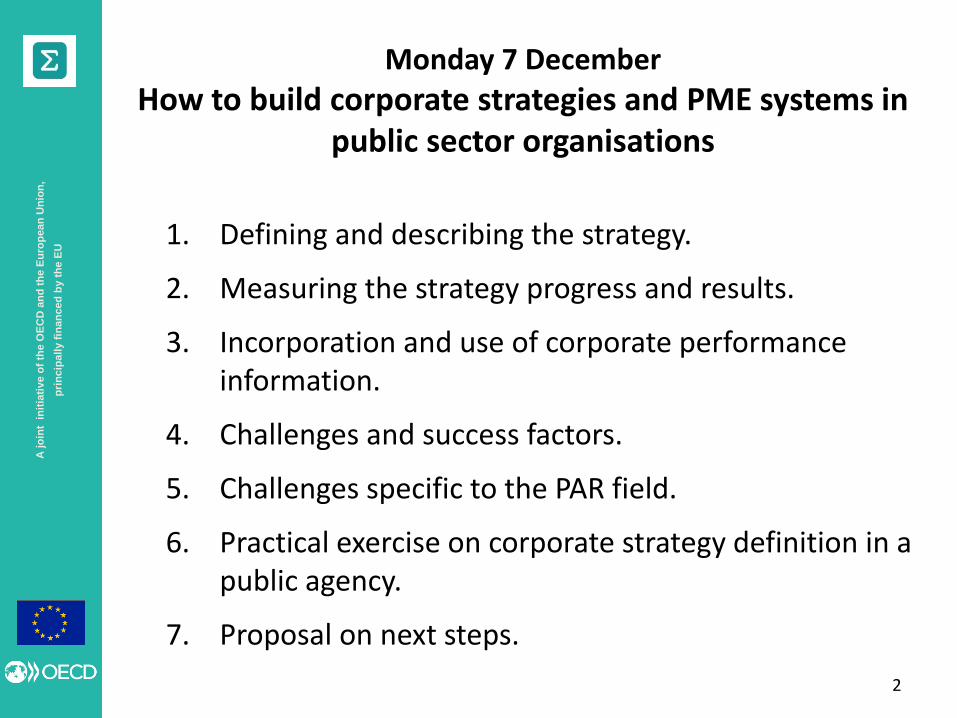
Monday 7 December
How to build corporate strategies and PME systems in public sector organisations
1. Defining and describing the strategy.
2. Measuring the strategy progress and results.
3. Incorporation and use of corporate performance information.
4. Challenges and success factors.
5. Challenges specific to the PAR field.
6. Practical exercise on corporate strategy definition in a public agency.
7. Proposal on next steps.
2

A j
oin
t i
nit
iati
ve o
f th
e O
EC
D a
nd
th
e E
uro
pe
an
Un
ion
,
pri
nc
ipall
y f
ina
nced
by t
he
EU
A corporate PME project it is not a “metrics” project; it is a change project.
• It has to do with staff attitudes and organisational culture.
• The ability to execute strategy is even more important than the quality of the strategy itself.
3
Before getting started
A j
oin
t i
nit
iati
ve o
f th
e O
EC
D a
nd
th
e E
uro
pe
an
Un
ion
,
pri
nc
ipall
y f
ina
nced
by t
he
EU
1. Defining and describing the strategy
4

A j
oin
t i
nit
iati
ve o
f th
e O
EC
D a
nd
th
e E
uro
pe
an
Un
ion
,
pri
nc
ipall
y f
ina
nced
by t
he
EU
Why is strategy so important?
Because it gives a sense of the scope, nature and final goals of the organisation, and explains how it intends to use public resources to attain such goals.
This is important to justify a priori the existence of the organisation, and as a reference point for accountability.
But also because it gives meaning to the day-to-day work and fosters staff motivation and commitment.
Without a strategy the organisational inertia may lead public bodies to exist “per se”.
5

A j
oin
t i
nit
iati
ve o
f th
e O
EC
D a
nd
th
e E
uro
pe
an
Un
ion
,
pri
nc
ipall
y f
ina
nced
by t
he
EU
Why do public organisations have difficulties in defining and implementing well-formulated strategies?
• Because most public organisations do not have a clear “production function”:
Their contribution to the “creation of public value” comes indirectly, through the several different policies, programmes, projects or other public interventions they house.
These public interventions may try to answer different social needs and follow different “theories of change” aimed at having a positive impact on them (but policy outcomes are often intangible, difficult to define, to observe and to measure).
Thus, “organisational performance” in such type of public bodies has to do mostly with the ability to generate and to manage synergies and economies of scale that foster knowledge, innovation, impact and efficiency of public interventions in related policy fields.
6

A j
oin
t i
nit
iati
ve o
f th
e O
EC
D a
nd
th
e E
uro
pe
an
Un
ion
,
pri
nc
ipall
y f
ina
nced
by t
he
EU
The “theory of change” of public policies

A j
oin
t i
nit
iati
ve o
f th
e O
EC
D a
nd
th
e E
uro
pe
an
Un
ion
,
pri
nc
ipall
y f
ina
nced
by t
he
EU
Why do public organisations have difficulties in defining and implementing well-formulated strategies?
Allocation of competences and resources to public organisations rarely follows rational criteria, but stems from political or other types of commitments.
Public entities do not manage only “own” policy areas, but usually participate in networks and other institutional arrangements in charge of inter-ministerial or multi-level policies.
They may also serve different stakeholders that require different courses of action and who may have different interpretations of success and failure.
8

A j
oin
t i
nit
iati
ve o
f th
e O
EC
D a
nd
th
e E
uro
pe
an
Un
ion
,
pri
nc
ipall
y f
ina
nced
by t
he
EU
Why do public organisations have difficulties in defining and implementing well-formulated strategies?
“Organisational cultures” in the public sector are usually little
geared (bureaucratic culture) or little receptive (business-like managerial culture) to the nuances of strategy setting in the public sector.
And there are many different types of organisations, different functions and different concepts of “performance” (actions performed, quality, achievements, sustainable results…). There is no “one size fits all” strategy model to be applied.
9
A j
oin
t i
nit
iati
ve o
f th
e O
EC
D a
nd
th
e E
uro
pe
an
Un
ion
,
pri
nc
ipall
y f
ina
nced
by t
he
EU
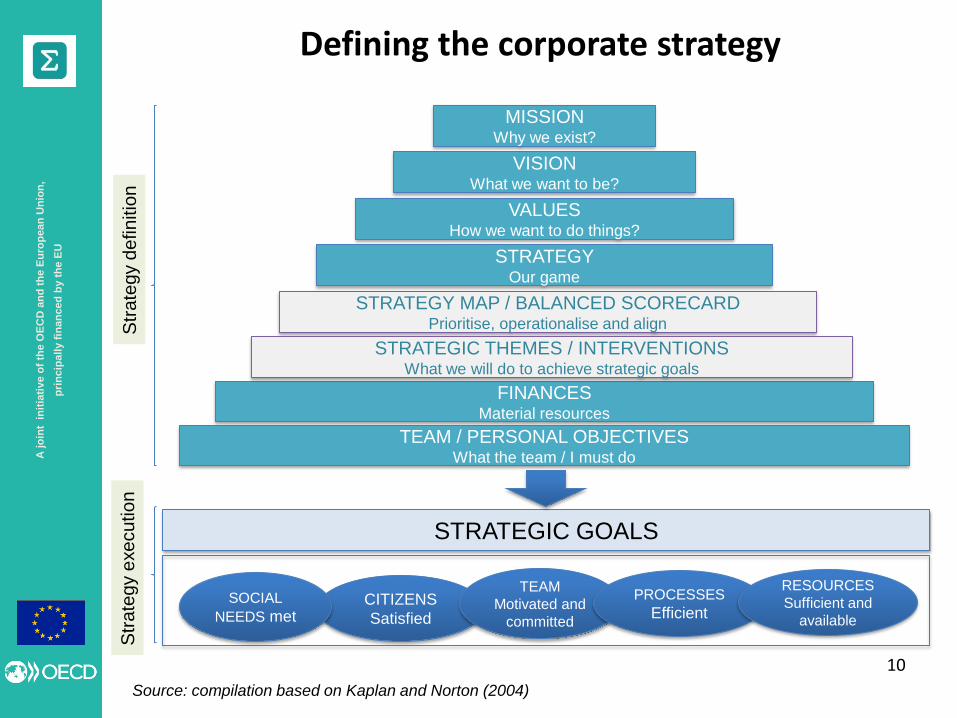
Defining the corporate strategy
10
Source: compilation based on Kaplan and Norton (2004)
MISSION Why we exist?
VISION What we want to be?
VALUES How we want to do things?
STRATEGY Our game
FINANCES Material resources
TEAM / PERSONAL OBJECTIVES What the team / I must do
CITIZENS
Satisfied
TEAM
Motivated and
committed
PROCESSES
Efficient
RESOURCES
Sufficient and
available
STRATEGIC GOALS
Str
ate
gy d
efin
itio
n
STRATEGY MAP / BALANCED SCORECARD Prioritise, operationalise and align
STRATEGIC THEMES / INTERVENTIONS What we will do to achieve strategic goals
Str
ate
gy e
xe
cu
tio
n
SOCIAL
NEEDS met

A j
oin
t i
nit
iati
ve o
f th
e O
EC
D a
nd
th
e E
uro
pe
an
Un
ion
,
pri
nc
ipall
y f
ina
nced
by t
he
EU
Mission
• It provides the starting point by defining why the organisation exists, (“what are we here for?”).
• It should be a concise, internally focused statement of the reason for the organisation’s existence, the basic purpose toward which its activities are directed, and the values that guide employees’ activities.
• The mission should also describe how the organisation expects to be responsive to citizens’ needs and to stakeholders.
• The mission and the core values that accompany it remain fairly stable over time.
11

A j
oin
t i
nit
iati
ve o
f th
e O
EC
D a
nd
th
e E
uro
pe
an
Un
ion
,
pri
nc
ipall
y f
ina
nced
by t
he
EU
Examples of corporate mission statements
SFP Mexico:
To consolidate an honest, efficient and transparent government.
MPA Croatia:
Mission of MPA is permanent enhancement of the public administration system with a view to ensuring and protecting the public interest, legality of operations and provision of services which enable citizens and business entities to exercise their rights.
City of Charlotte (North Carolina, USA):
To ensure the delivery of quality public services that promote the safety, health and quality of life of its citizens.
Barcelona Metropolitan Transports
Provide a public transport network to contribute to improving urban mobility and sustainable development in the metropolitan area; guaranteeing the best customer service; developing social responsibility policies, and within the framework of feasibility and economic efficiency. 12

A j
oin
t i
nit
iati
ve o
f th
e O
EC
D a
nd
th
e E
uro
pe
an
Un
ion
,
pri
nc
ipall
y f
ina
nced
by t
he
EU
Vision
• It paints a desired future scenario that clarifies the direction of the organisation and helps individuals to understand why and how they should support the organisation.
• The vision should be external: How the organisation wants to be perceived by the world (or what it is the future scenario it wants to create through its existence and activities).
13

A j
oin
t i
nit
iati
ve o
f th
e O
EC
D a
nd
th
e E
uro
pe
an
Un
ion
,
pri
nc
ipall
y f
ina
nced
by t
he
EU
Examples of corporate vision statements
City of Charlotte (North Carolina, USA)
“The City of Charlotte will be a model of excellence that puts its citizens first. Skilled, motivated employees will be known for productivity, quality and value in all areas of service. We will be a platform for vital economic activity… We will partner with citizens and businesses to make Charlotte a community of choice for living, working, and leisure activities.”
Barcelona Metropolitan Transports
“Being a citizen mobility and transport company that is competitive at European level: - for its contribution to improving mobility in the metropolitan area, sustainability and the urban environment; - for the technical quality offered and the quality perceived by citizens; - for the efficiency of its processes and resource optimization; - for the efficient use of technology as a lever to improve service and efficiency; - for the excellence of its employees; - for its commitment to society and citizens ; - for its international presence.”
14

A j
oin
t i
nit
iati
ve o
f th
e O
EC
D a
nd
th
e E
uro
pe
an
Un
ion
,
pri
nc
ipall
y f
ina
nced
by t
he
EU
The importance of corporate values
15
Ethics: • Equity and fairness when dealing with
colleagues, subordinated staff, head staff, beneficiaries, etc.
• Respect to the legal framework. • Assumption of responsibilities. • Respect to sustainability issues.
Quality of relations: • Share information, listen to each other,
put oneself in the place of the others (colleagues, beneficiaries…) and try to empathise with them.
• Use dialogue to solve conflicts. • Foster the professional development of
our team and facilitate their work. • Share and celebrate success with all the
team members.
Commitment: • Commitment towards organisational
and personal goals. • Active participation in decision making. • Achievement of operational objectives
timely and efficiently. • Act to favour the organisation’s mission
and to support the team. • Pursue continuous learning and
improvement at personal, team and organisation levels.
Corporate values
A j
oin
t i
nit
iati
ve o
f th
e O
EC
D a
nd
th
e E
uro
pe
an
Un
ion
,
pri
nc
ipall
y f
ina
nced
by t
he
EU
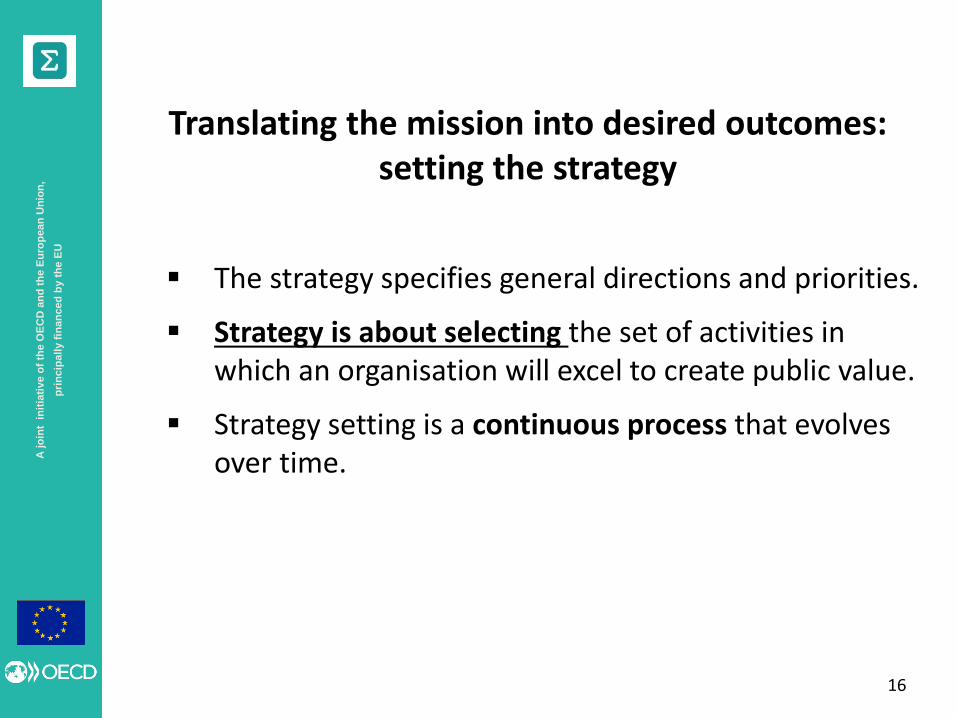
The strategy specifies general directions and priorities.
Strategy is about selecting the set of activities in which an organisation will excel to create public value.
Strategy setting is a continuous process that evolves over time.
16
Translating the mission into desired outcomes: setting the strategy

A j
oin
t i
nit
iati
ve o
f th
e O
EC
D a
nd
th
e E
uro
pe
an
Un
ion
,
pri
nc
ipall
y f
ina
nced
by t
he
EU
Many public organisations take their mission as given and thus focus “just” in doing their work more efficiently.
Or they describe their mission and vision, but then just attach to them their current list of projects and activities.
Or they define too broad strategies and visions, including all kinds of interventions… while strategy implies choosing carefully what to do and what not to do.
17
Translating the mission into desired outcomes: setting the strategy

A j
oin
t i
nit
iati
ve o
f th
e O
EC
D a
nd
th
e E
uro
pe
an
Un
ion
,
pri
nc
ipall
y f
ina
nced
by t
he
EU
Prioritization of goals and initiatives
18
1. High strategic value / Low implementation
effort
2. High strategic value / High implementation
effort
3. Low strategic value / Low implementation
effort
4. Low strategic value / High implementation
effort
Prioritisation of the portfolio of initiatives
Strategic value: • Level of impact on
strategic goals
Implementation effort: • Economic effort • Personal effort • Complexity, uncertainty…
Development of scenarios taking into account potentialities and
risks

A j
oin
t i
nit
iati
ve o
f th
e O
EC
D a
nd
th
e E
uro
pe
an
Un
ion
,
pri
nc
ipall
y f
ina
nced
by t
he
EU
What goals?
19
• Three high-level objectives a public sector organisation needs to satisfy to accomplish its mission:
contribute to create value (public outcomes or ultimate benefits of the services provided) => effectiveness.
at minimal cost => efficiency and cost-effectiveness.
develop ongoing support and commitment from its funding authorities => accountability.
Aligning all three dimensions is often a big challenge…

A j
oin
t i
nit
iati
ve o
f th
e O
EC
D a
nd
th
e E
uro
pe
an
Un
ion
,
pri
nc
ipall
y f
ina
nced
by t
he
EU
Contribution to create public value
20
It identifies the benefits to citizens that are being created through the different interventions managed by the agency. This perspective is the most important and also the most problematic:
Difficulty to establish causal links and attribution between the agency’s activities and immediate outputs and the achievement of intermediate and final outcomes.
The “managerial perspective” may lead to confusion between users’ satisfaction and truly social needs.

A j
oin
t i
nit
iati
ve o
f th
e O
EC
D a
nd
th
e E
uro
pe
an
Un
ion
,
pri
nc
ipall
y f
ina
nced
by t
he
EU
21
Socio-economic situation
Needs
Services’ demand Services’ supply
•Unnecessary supply of services without demand.
1
•Use of services by users who need them. 2
•Demand and use of services by users that need them 3
•Demand and use of services by persons who do not need them 4
•Unmet demand of services by persons who do not need them.. 5
•Unmet demand of services by persons that need them. 6
•Unattended needs, without expressed demand. 7
Source: Ivàlua, 2009.
4
7
2 6
1
5 3

A j
oin
t i
nit
iati
ve o
f th
e O
EC
D a
nd
th
e E
uro
pe
an
Un
ion
,
pri
nc
ipall
y f
ina
nced
by t
he
EU
22
• Cost incurred: this perspective emphasises operational efficiency and refers to
• Expenses of the agency
• Social costs it imposes to citizens and other agencies through its operations (administrative burdens, etc.).
• Legitimising support: the agency must strive to meet the objectives of its founding sources, and ultimately those of citizens and taxpayers.

A j
oin
t i
nit
iati
ve o
f th
e O
EC
D a
nd
th
e E
uro
pe
an
Un
ion
,
pri
nc
ipall
y f
ina
nced
by t
he
EU
Describing the strategy at corporate level: strategy
maps
23
Mission
Cost of providing
services, including
social cost
Internal processes
Learning and Growth
Value / benefit of
services, including
positive externalities
Support of legitimising
authorities (legislature /
voters / taxpayers /donors),
Source: Kaplan and Norton, 2004.

A j
oin
t i
nit
iati
ve o
f th
e O
EC
D a
nd
th
e E
uro
pe
an
Un
ion
,
pri
nc
ipall
y f
ina
nced
by t
he
EU
Some examples of strategy maps
24

A j
oin
t i
nit
iati
ve o
f th
e O
EC
D a
nd
th
e E
uro
pe
an
Un
ion
,
pri
nc
ipall
y f
ina
nced
by t
he
EU
Barcelona Metropolitan Transports (TMB)
Mission statement: “Provide a public transport network to contribute to improve urban mobility and sustainable development in the metropolitan area guaranteeing the best customer service, developing social responsibility policies, and within the framework of feasibility and economic efficiency.”
Vision: “Being a citizen mobility and transport company that is competitive at European level: - for its contribution to improving mobility in the metropolitan area, sustainability and the urban environment; - for the technical quality offered and the quality perceived by citizens; - for the efficiency of its processes and resource optimization; - for the efficient use of technology as a lever to improve service and efficiency; - for the excellence of its employees; - for its commitment to society and citizens ; - for its international presence.” Source: compilation based on TMB website and A. Fernández, IESE, 2006. 25

A j
oin
t i
nit
iati
ve o
f th
e O
EC
D a
nd
th
e E
uro
pe
an
Un
ion
,
pri
nc
ipall
y f
ina
nced
by t
he
EU
26
Re
su
lts
Ben
efi
cia
rie
s / C
itiz
en
s
Le
ve
rs
Org
an
isa
tio
n &
Wo
rk
Pro
ce
sse
s
Pe
op
le
Fin
an
ce
s
Sign Framework
Contract
Ensure sufficient
financial means Increase
efficiency
Increase ticket
revenue Fulfil FC
commitments
Be able to
analyse economic
and citizens’
needs
Align behaviours
with corporate
values
Increase
productivity
Enhance
professional &
personal
development
Labour relations
based on
dialogue
Integrate new
technologies
Improve processes
on information and
attention to citizens
Be ready to
manage new
infrastructures
Adapt the
organisation to
new needs
Enhance
quality of work
processes
Contribute to increase
the share of public
transport in the AMB
Efficient
management of
public resources
Improve
information to
citizens and users
Improve users’
satisfaction
Improve the
perception of
security
Improve relations
and co-ordination
with public
administrations

A j
oin
t i
nit
iati
ve o
f th
e O
EC
D a
nd
th
e E
uro
pe
an
Un
ion
,
pri
nc
ipall
y f
ina
nced
by t
he
EU
City of Charlotte (North Carolina, USA)
Mission statement: “To ensure the delivery of quality public services that promote the safety, health and quality of life of its citizens.”
Vision: “The City of Charlotte will be a model of excellence that puts its citizens first. Skilled, motivated employees will be known for productivity quality and value in all areas of service. We will be a platform for vital economic activity… We will partner with citizens and businesses to make Charlotte a community of choice for living, working, and leisure activities.”
Source: Kaplan and Norton, 2004.
27

A j
oin
t i
nit
iati
ve o
f th
e O
EC
D a
nd
th
e E
uro
pe
an
Un
ion
,
pri
nc
ipall
y f
ina
nced
by t
he
EU
28
Strategic
Themes
Community
safety City-within-a-
city Transportation
Restructuring
Government Economic
Development
Corporate Scorecard
Financial
perspective
Citizens’
perspective
Internal
Process
Perspective
Learning and
Growth
Perspective
Reduce
crime
Increase
perception of
safety
Strengthen
neighbourhoods
Enhance
service
delivery
Maintain
competitive
tax rate
Provide safe,
convenient
transportation
Promote
economic
opportunity
Secure Funding
Service partners
Maximize
benefits /
costs
Grow the
tax base
Maintain
AAA Rating
Streamline
Customer
Interactions
Promote
Community-based
problem-solving
Improve
productivity
Increase
Infrastructure
capacity
Close skills gap
Achieve positive
employment
climate
Enhance
information
management

A j
oin
t i
nit
iati
ve o
f th
e O
EC
D a
nd
th
e E
uro
pe
an
Un
ion
,
pri
nc
ipall
y f
ina
nced
by t
he
EU
• The overall strategy map should be defined in a participatory way, supported and conducted by the top management of the organisation.
• The process should start by the more strategic components (mission and vision, strategic goals at social / PAR / public administration bodies’ level) going afterwards to the internal factors that contribute to such goals and that are the drivers of change.
29
How to develop and operationalise strategic maps

A j
oin
t i
nit
iati
ve o
f th
e O
EC
D a
nd
th
e E
uro
pe
an
Un
ion
,
pri
nc
ipall
y f
ina
nced
by t
he
EU
30
Strategic layers Dimensions for strategic
goals’ setting Issues
Users / Citizens Social needs Problems’ dimensions / evolution, potential and
current beneficiaries’ profiles
Provision of services Coverage
Users’ satisfaction
Quality
Public resources’ management Efficiency, cost-effectiveness
Organisation and
processes
Operations’ management Simplification and automation of work
procedures, quality of organisation and work
methods, productivity
Users’ management Communication with users, management of
complaints
Innovation management Pilot activities, integration of new methods and
tools
Learning and
growth
Human capital Employees’ skills, talent and knowledge,
strategic job families
Information capital Databases, information systems, networks, and
technology infrastructure
organisation capital Culture, leadership, employee alignment,
teamwork, collaborative management,
knowledge management
Financial
sustainability
Sufficiency of financial
resources
Diversification of income sources
Sound financial management Economy and efficiency

A j
oin
t i
nit
iati
ve o
f th
e O
EC
D a
nd
th
e E
uro
pe
an
Un
ion
,
pri
nc
ipall
y f
ina
nced
by t
he
EU
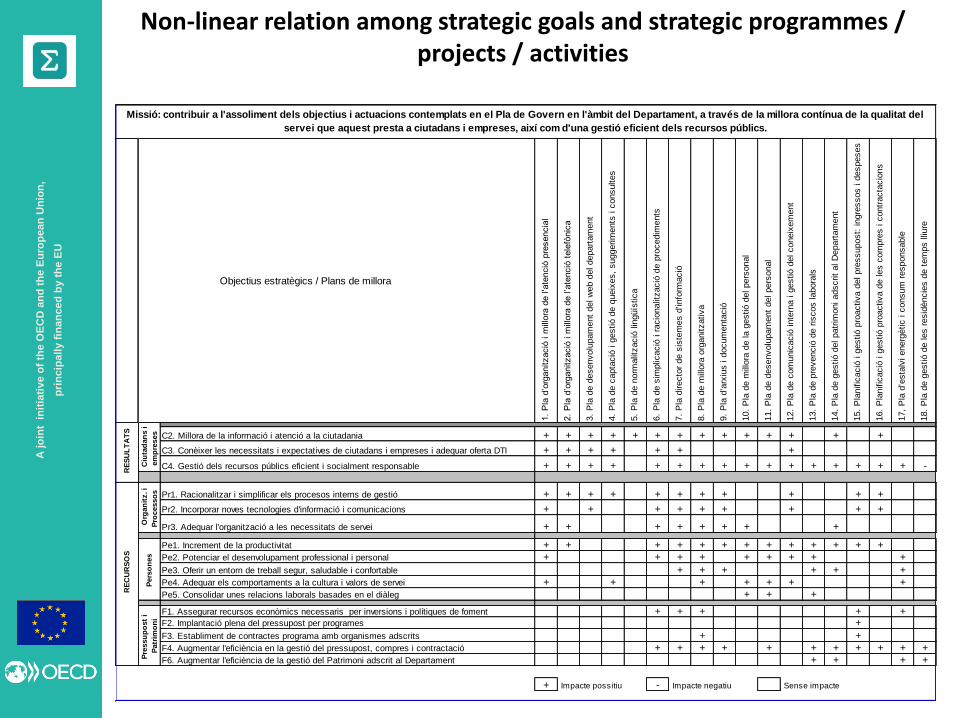
• Strategic programmes or interventions should be identified as a way to operationalise the strategy (what must be done to succeed).
• Such strategic programmes or interventions may fall into the area or competence of an existing unit / department / team in the organisation, or it may be necessary to launch of an specific work group / task force.
• There is not always a linear relation between specific programmes and strategic goals: each of the former may have impact in several strategic goals at the same time.
31
How to develop and operationalise strategic maps

A j
oin
t i
nit
iati
ve o
f th
e O
EC
D a
nd
th
e E
uro
pe
an
Un
ion
,
pri
nc
ipall
y f
ina
nced
by t
he
EU
32
Strategy map Action plan
Dimensions Map Goals Initiative Budget
Re
su
lts
Beneficia
ries / c
itiz
ens
C1 CA1.1
CA1.2
C2 CA2.1
C3 CA3.1
CA3.2
C4 CA4.1
Le
ve
rs
Org
an
isa
tio
n &
Wo
rk
Pro
ce
sse
s
O1 OA1.1
O2
OA2.1
OA2.2
OA2.3
O3 OA3.1
Pe
op
le
P1 PA1.1
P2 PA2.1
P3 PA3.1
P4 PA4.1
Fin
an
ce
s
F1 FA1.1
F2 FA2.1
FA2.2
F3
FA3.1
FA3.2
FA3.3
Linear relation between strategic goals and action plans

A j
oin
t i
nit
iati
ve o
f th
e O
EC
D a
nd
th
e E
uro
pe
an
Un
ion
,
pri
nc
ipall
y f
ina
nced
by t
he
EU
33
Strategy map
Dimensions Goals
Pla
n / in
terv
en
tio
n A
Pla
n / In
terv
en
tio
n B
Pla
n / In
terv
en
tio
n B
Pla
n / In
terv
en
tio
n B
Pla
n / In
terv
en
tio
n B
Pla
n / In
terv
en
tio
n B
Pla
n / In
terv
en
tio
n B
Pla
n / In
terv
en
tio
n B
Pla
n / In
terv
en
tio
n B
Pla
n / In
terv
en
tio
n B
Re
su
lts
Beneficia
ries /
citiz
ens
C1
C2
C3
C4
Le
ve
rs
Org
an
isa
tio
n
& W
ork
Pro
ce
sse
s O1
O2
O3
Pe
op
le
P1
P2
P3
P4
Fin
an
ce
s
F1
F2
F3
High expected impact 1 2 Low expected impact
Non-linear relation between strategic goals and action plans

A j
oin
t i
nit
iati
ve o
f th
e O
EC
D a
nd
th
e E
uro
pe
an
Un
ion
,
pri
nc
ipall
y f
ina
nced
by t
he
EU
34
Aligning the organisation to describe strategies and to create synergies
Mayor City
Council
City Manager
Horizontal
units Vertical units
Leadership
team
HRM
Finances
Procurement
Planning
Monitoring
Evaluation
Communication
Community
safety
City-within-a-
city
Transportation
Restructuring
Government
Restructuring
Government
Economic
Development
Police
Transports
Urban
Planning
Solid Waste
Management
Commerce
…
A j
oin
t i
nit
iati
ve o
f th
e O
EC
D a
nd
th
e E
uro
pe
an
Un
ion
,
pri
nc
ipall
y f
ina
nced
by t
he
EU
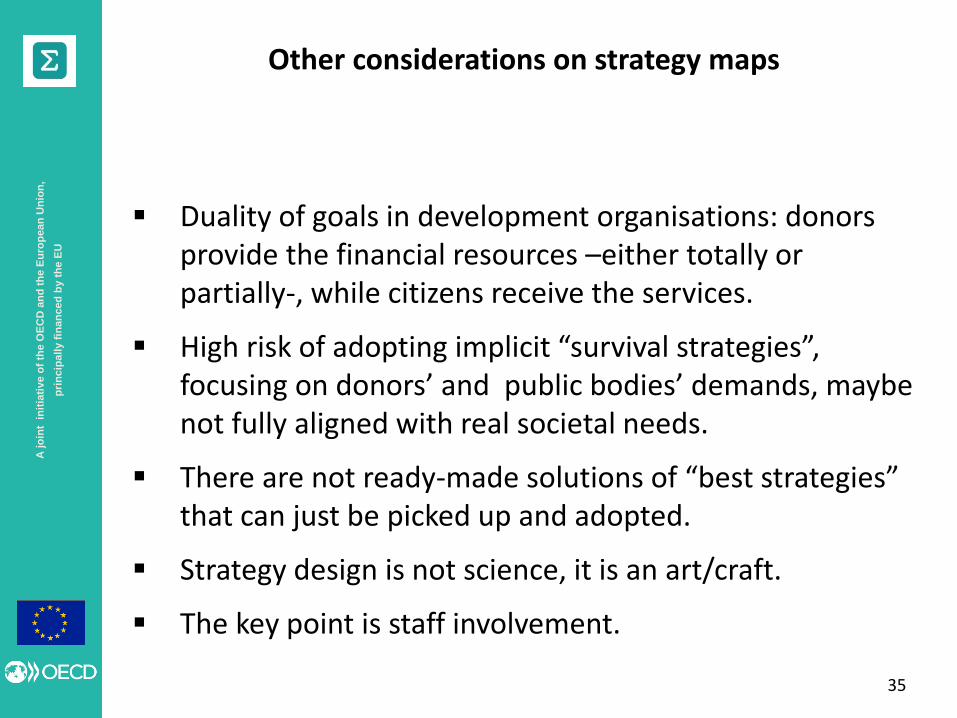
Duality of goals in development organisations: donors provide the financial resources –either totally or partially-, while citizens receive the services.
High risk of adopting implicit “survival strategies”, focusing on donors’ and public bodies’ demands, maybe not fully aligned with real societal needs.
There are not ready-made solutions of “best strategies” that can just be picked up and adopted.
Strategy design is not science, it is an art/craft.
The key point is staff involvement.
35
Other considerations on strategy maps

A j
oin
t i
nit
iati
ve o
f th
e O
EC
D a
nd
th
e E
uro
pe
an
Un
ion
,
pri
nc
ipall
y f
ina
nced
by t
he
EU
Multiple donors.
Lebanese public bodies as direct beneficiaries.
Lebanese citizens as ultimate beneficiaries (also social agents and the private sector).
Strategic layers that may be considered:
• Social needs / PAR goals.
• Public stakeholders’ capacity to deliver / satisfaction with OMSAR services.
• Effective internal organisation and work processes.
• Motivated and prepared workforce.
• Financial sustainability.
36
OMSAR’s specificities

A j
oin
t i
nit
iati
ve o
f th
e O
EC
D a
nd
th
e E
uro
pe
an
Un
ion
,
pri
nc
ipall
y f
ina
nced
by t
he
EU
Ideas for strategic themes (OMSAR’s staff retreat November 2014):
• Enhanced management / results in selected programmes / projects / activities, including communication and knowledge management.
• Better selection of programmes / projects /activities.
• Push for a better donors’ co-ordination in the PAR area.
• Enhance learning on PAR / sector reform areas processes, outcomes, and contextual factors for success.
• Improve relationships and co-ordination at operational level with beneficiary bodies / within beneficiary bodies / among beneficiary bodies.
• Build a team spirit and motivation among OMSAR’s staff, enhance internal learning through training, better co-ordination and communication.
• Reinforce internal organisation and work methods. 37
OMSAR’s specificities

A j
oin
t i
nit
iati
ve o
f th
e O
EC
D a
nd
th
e E
uro
pe
an
Un
ion
,
pri
nc
ipall
y f
ina
nced
by t
he
EU
2. Measuring the strategy progress and results.
38
A j
oin
t i
nit
iati
ve o
f th
e O
EC
D a
nd
th
e E
uro
pe
an
Un
ion
,
pri
nc
ipall
y f
ina
nced
by t
he
EU
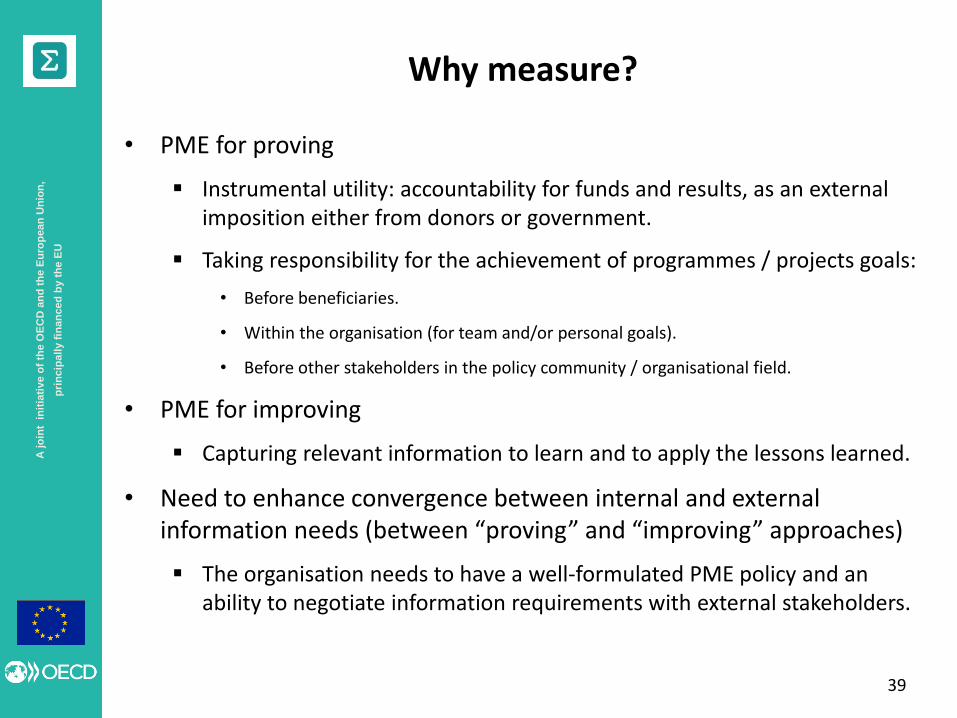
Why measure?
39
• PME for proving
Instrumental utility: accountability for funds and results, as an external imposition either from donors or government.
Taking responsibility for the achievement of programmes / projects goals:
• Before beneficiaries.
• Within the organisation (for team and/or personal goals).
• Before other stakeholders in the policy community / organisational field.
• PME for improving
Capturing relevant information to learn and to apply the lessons learned.
• Need to enhance convergence between internal and external information needs (between “proving” and “improving” approaches)
The organisation needs to have a well-formulated PME policy and an ability to negotiate information requirements with external stakeholders.
A j
oin
t i
nit
iati
ve o
f th
e O
EC
D a
nd
th
e E
uro
pe
an
Un
ion
,
pri
nc
ipall
y f
ina
nced
by t
he
EU
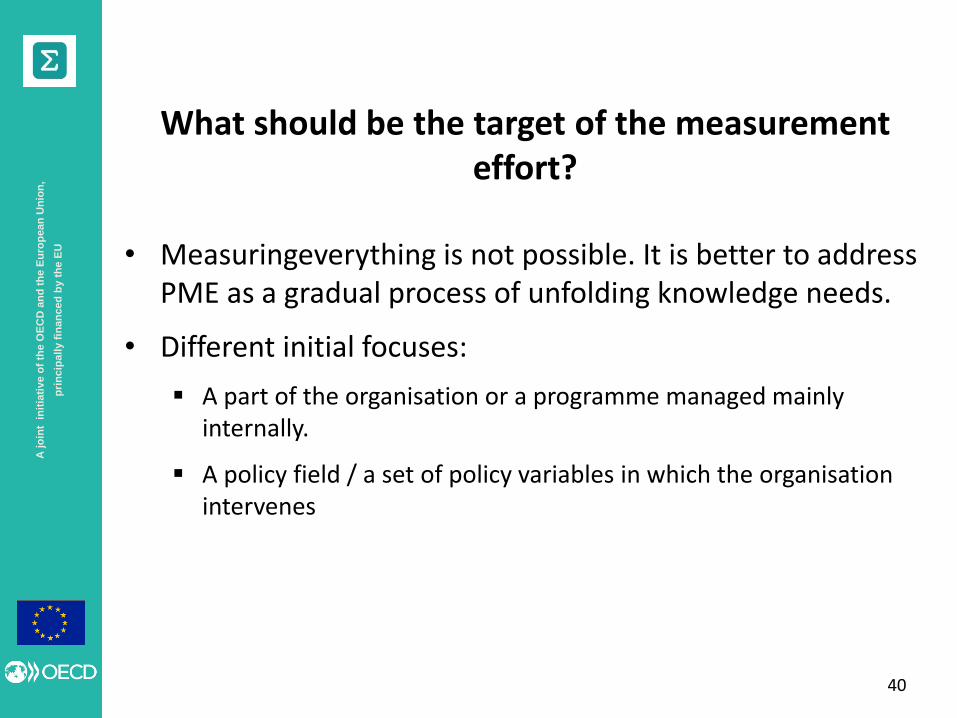
What should be the target of the measurement effort?
40
• Measuringeverything is not possible. It is better to address PME as a gradual process of unfolding knowledge needs.
• Different initial focuses:
A part of the organisation or a programme managed mainly internally.
A policy field / a set of policy variables in which the organisation intervenes

A j
oin
t i
nit
iati
ve o
f th
e O
EC
D a
nd
th
e E
uro
pe
an
Un
ion
,
pri
nc
ipall
y f
ina
nced
by t
he
EU
How to measure: a process in five steps
41
Targeting Indicator selection
Data collection
Analysis Reporting
Quality assurance

A j
oin
t i
nit
iati
ve o
f th
e O
EC
D a
nd
th
e E
uro
pe
an
Un
ion
,
pri
nc
ipall
y f
ina
nced
by t
he
EU
42
• Target setting (as goal setting) means choice.
• Need to evaluate real and minimum information needs of the organisation.
What is needed to help management learn and make efficient decisions?
• Measurement prioritization will / should depend on:
The planned use of performance information.
Technical feasibility of measurement
• What is observable and not observable in PAR policy?
• What is observable in policy sectors in which OMSAR intervenes?
• What is observable in internal organisation and functioning.
Availability of data (current sources of data and information, data and information management systems, legal barriers, etc.).
Costs involved.
Predetermination of measures (sometimes there is no choice, e.g. EU reporting obligations for member states).
Targeting Indicator selection
Data collection
Analysis Reporting

A j
oin
t i
nit
iati
ve o
f th
e O
EC
D a
nd
th
e E
uro
pe
an
Un
ion
,
pri
nc
ipall
y f
ina
nced
by t
he
EU
What to measure
43
Measurement and accountability strategies
Is outcome measurable?
Is there an attribution problem?
Account for outcomes
Account for output
Is output measurable?
Are activities measurable?
Account for activities
Account for inputs
Yes
No
Yes
No
Yes
No
Yes
No
Source: Van Dooren, Bouckaert and Hailigan (2010).

A j
oin
t i
nit
iati
ve o
f th
e O
EC
D a
nd
th
e E
uro
pe
an
Un
ion
,
pri
nc
ipall
y f
ina
nced
by t
he
EU
44
Strategic layers Measurement dimensions Measurement targets
Users / Citizens Social needs Problems dimensions / evolution, potential and
current beneficiaries’ profiles
Provision of services Coverage
Users’ satisfaction
Quality
Public resources’ management Efficiency, cost-effectiveness
organisation and
processes
Operations’ management Simplification and automation of work
procedures, quality of organisation and work
methods, productivity
Users’ management Communication with users, management of
complaints
Innovation management Pilot activities, integration of new methods and
tools
Learning and
growth
Human capital Employees’ skills, talent and knowledge,
strategic job families
Information capital Databases, information systems, networks, and
technology infrastructure
organisation capital Culture, leadership, employee alignment,
teamwork, collaborative management,
knowledge management
Financial
sustainability
Sufficiency of financial
resources
Diversification of income sources
Sound financial management Economy and efficiency
A j
oin
t i
nit
iati
ve o
f th
e O
EC
D a
nd
th
e E
uro
pe
an
Un
ion
,
pri
nc
ipall
y f
ina
nced
by t
he
EU
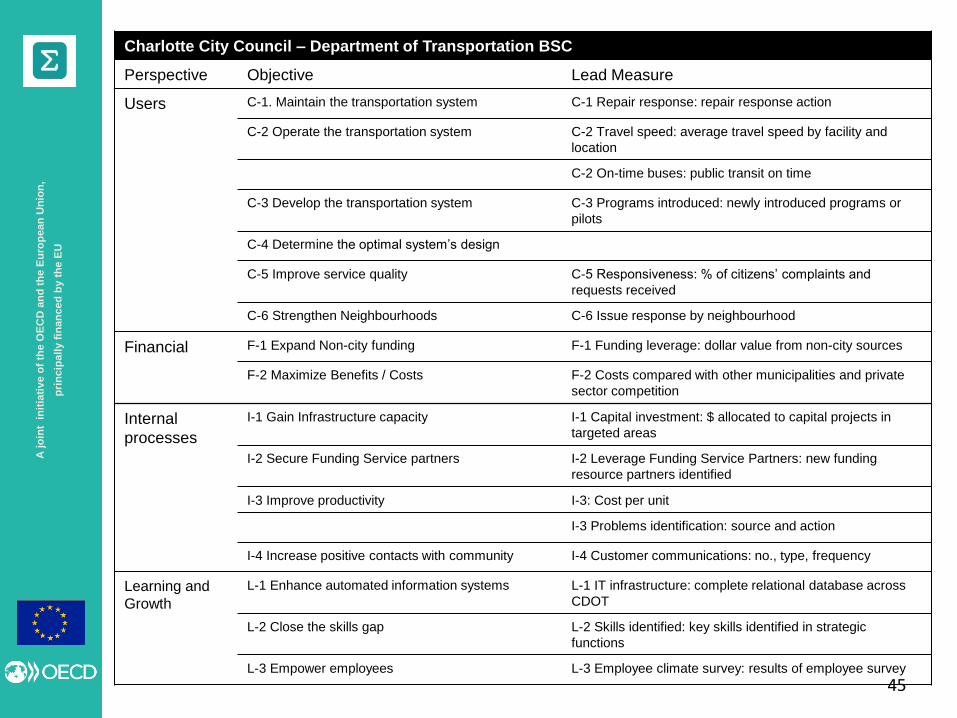
Charlotte City Council – Department of Transportation BSC
Perspective Objective Lead Measure
Users C-1. Maintain the transportation system C-1 Repair response: repair response action
C-2 Operate the transportation system C-2 Travel speed: average travel speed by facility and
location
C-2 On-time buses: public transit on time
C-3 Develop the transportation system C-3 Programs introduced: newly introduced programs or
pilots
C-4 Determine the optimal system’s design
C-5 Improve service quality C-5 Responsiveness: % of citizens’ complaints and
requests received
C-6 Strengthen Neighbourhoods C-6 Issue response by neighbourhood
Financial F-1 Expand Non-city funding F-1 Funding leverage: dollar value from non-city sources
F-2 Maximize Benefits / Costs F-2 Costs compared with other municipalities and private
sector competition
Internal
processes
I-1 Gain Infrastructure capacity I-1 Capital investment: $ allocated to capital projects in
targeted areas
I-2 Secure Funding Service partners I-2 Leverage Funding Service Partners: new funding
resource partners identified
I-3 Improve productivity I-3: Cost per unit
I-3 Problems identification: source and action
I-4 Increase positive contacts with community I-4 Customer communications: no., type, frequency
Learning and
Growth
L-1 Enhance automated information systems L-1 IT infrastructure: complete relational database across
CDOT
L-2 Close the skills gap L-2 Skills identified: key skills identified in strategic
functions
L-3 Empower employees L-3 Employee climate survey: results of employee survey
45

A j
oin
t i
nit
iati
ve o
f th
e O
EC
D a
nd
th
e E
uro
pe
an
Un
ion
,
pri
nc
ipall
y f
ina
nced
by t
he
EU
46
Strategy map Scorecard Action plan
Dimensi
ons Map
Strategic
objectives Measures Targets Initiative Budget
Re
su
lts
Be
ne
ficia
rie
s /
citiz
en
s
Le
ve
rs
org
an
isation
&
Work
Pro
ce
sse
s
Pe
op
le
Fin
an
ce
s

A j
oin
t i
nit
iati
ve o
f th
e O
EC
D a
nd
th
e E
uro
pe
an
Un
ion
,
pri
nc
ipall
y f
ina
nced
by t
he
EU
47
• Reporting formats and contents should be appropriate for the target group (general public, beneficiaries, policy stakeholders, either public or private, donors, etc.).
• Formats: annual reports and annual plans, financial documents, specific publication (e.g. in sectors of intervention), data, scorecards, news, oral witnesses, etc.
Targeting Indicator selection
Data collection
Analysis Reporting
A j
oin
t i
nit
iati
ve o
f th
e O
EC
D a
nd
th
e E
uro
pe
an
Un
ion
,
pri
nc
ipall
y f
ina
nced
by t
he
EU
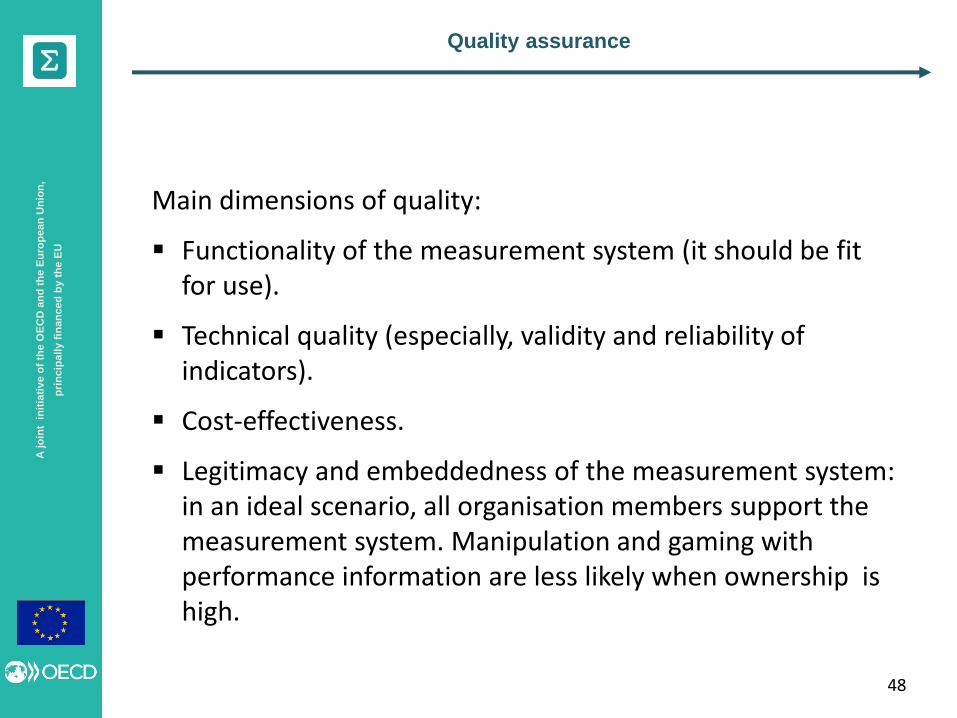
48
Main dimensions of quality:
Functionality of the measurement system (it should be fit for use).
Technical quality (especially, validity and reliability of indicators).
Cost-effectiveness.
Legitimacy and embeddedness of the measurement system: in an ideal scenario, all organisation members support the measurement system. Manipulation and gaming with performance information are less likely when ownership is high.
Quality assurance
A j
oin
t i
nit
iati
ve o
f th
e O
EC
D a
nd
th
e E
uro
pe
an
Un
ion
,
pri
nc
ipall
y f
ina
nced
by t
he
EU
Some examples of corporate strategic performance measurement tools
49

A j
oin
t i
nit
iati
ve o
f th
e O
EC
D a
nd
th
e E
uro
pe
an
Un
ion
,
pri
nc
ipall
y f
ina
nced
by t
he
EU
50
Missió: contribuir a l’assoliment dels objectius i actuacions contemplats en el Pla de Govern en l’àmbit del Departament, a través de la millora contínua de la qualitat del servei que aquest presta a ciutadans i empreses, així com d’una gestió eficient dels recursos públics.
Ciu
tad
an
s i
Em
pre
se
s
Pe
rso
ne
s
Org
an
itza
ció
i p
roce
ssos
Pre
ssu
post
i P
atr
imo
ni
C.1 Millora de la qualitat del servei a ciutadans i empreses en els àmbits
competència del DTI
C2. Millora de la informació i atenció a la
ciutadania C4. Gestionar eficientment els
recursos públics
Pr1.Racionalitzar i simplificar els processos interns de
gestió
C3.Conèixer les necessitats de ciutadans i empreses i
adequar oferta DTI
Pr2.Incorporar noves tecnologies d’informació i
comunicacions
Pr3.Adequar l’organització a les necessitats de servei
Pe1.Increment de la productivitat
Pe5.Consolidar unes relacions laborals basades
en el diàleg
Pe3.Oferir un entorn de treball segur, saludable i
confortable
Pe4.Adequar els comportaments a la cultura i
valors de servei
Pe2.Potenciar el desenvolupament
professional i personal
F1.Assegurar recursos econòmics necessaris per inversions i polítiques de
foment
F2.Implantació plena del pressupost per
programes
F3.Establiment de contractes programa amb organismes
adscrits
F4.Augmentar l’eficiència en la gestió del pressupost, compres i contractació
F5Augmentar l’eficiència de la gestió del Patrimoni adscrit al Departament
Strategy map of the Directorate of Services – Dept. of Employment and Industry of the Catalan Government
Source: Directorate of Services. Department of Employment and Industry of the Catalan Government. 2008

A j
oin
t i
nit
iati
ve o
f th
e O
EC
D a
nd
th
e E
uro
pe
an
Un
ion
,
pri
nc
ipall
y f
ina
nced
by t
he
EU
51
Enunciat Enunciat Tipus (*) Valor previst inicialValor previst
revisat
Valor realitzat
a 30.06.08Semàfor Comentaris
Oficines d'Informació i Atenció Ciutadana en funcionament al Departament Input 1
Proporció de consultes ateses i resoltes a l'OAC en relació al total oel canal presencial Output 50%
Nombre de serveis i tràmits derivats a l'OAC Input 145
Nombre de tràmits iniciats a l'OAC (alternativa: % tràmits iniciats a l'OAC en relació al total) Output 25.000
Proporció de consultes telefòniques ateses i resoltes al primer nivell (012) en relació al total Output 70%
Percentatge d'increment del nombre de visites al web de DT en relació a l'exercici anterior Resultats 20% Previsió de 150.000 visites mensuals
Mitjana del temps de resposta a les consultes rebudes per correu electrònic o ordinari Resultats 2 dies SDAC respon al moment. Mitjana unitat 2,4
Nous portals temàtics incorporats al web del Departament Output 3 Emprenedor.cat, dones en el treball i diversitat en el treball
Nos espais de cerca i explotació de dades incorporats al web del Departament Output 7 BD i cercador laudes, censos CET i ECI, Obs. RSE, Infromes web SISDEC, atur i contractació i sinistralitat
Nous butlletins electrònics editats i difosos Output 2 Butlletí electrònic sobre igualtat i Butlletí electrònic sobre creació d'empreses
Nombre de queixes presentades en relació a la informació, atenció o serveis rebuts per qualsevol canal Qualitat 0
Existència de bústies de queixes i suggeriments a tots els canals i punts d'informació i atenció Input Si (100%) SSTT i OAC (=8)
Increment de consultes, queixes i suggeriments recollits per qualsevol canal Output 30%
Nombre d'enquestes realitzades a usuaris dels serveis del DTI Output 200
Índex satisfacció dels usuaris Qualitat 70%
Variació de la despesa corrent total (capítol 2) en relació al pressupost de l'exercici anterior Resultats 0%
Volum de compra social assolida en relació a l'objectiu fixat pel Govern Resultats 100%
Edificis amb Pla d'estalvi i eficiència energètica implantat Output 1
Variació en la despesa per consum d'electricitat Resultats ?
Variació en la despesa per consum d'aigua Resultats ?
Variació en la despesa per consum de paper Resultats ?
Termini de pagament a proveïdors Resultats 30 dies
Nº de sol·licituds directes per part del DT de certificats tributaris i de seguretat social, en relació al certificats totals demanatsResultats 100% Valor 2007: 8.592 consultes a l'AEAT
Nr. de plans de seguretat no custodiats Output 75.000
Nr llibres de resgistre amb tràmit de diligència eliminat Resultats Tots
Increment de la velocitat de la xarxa local dels centres de treball del DT Input < 30"
Evolució de la despesa de comunicacions telefòniques Resultats 40% ?
Àmbits amb signatura electrònica aplicada a comunicacions internes Output HC, SG, DGs
Nombre de comunitats creades a la Intranet Output 20 Informe de resultats i recomanacions
Àmbits amb accés remot a intranet i xarxa implantat (teletreball) Output HC, SG, DGs
Nombre de processos amb tramitació telemàtica incorporats al web del Departament Resultats 6 CLIIO, REA, RSAE, Conciliacions, R. Autònoms, Sub. Autònoms,
Nombre de processos que es poden iniciar i resoldre 100% per via telemàtica al web del Departament Resultats 3 CLIO, REA, Subvencions a cooperatives
Nre. de tràmtis telemàtics efectivament realitzats Output ?
Decret 199/2007 amb estructura i dimensionament implantat Output 66%
CSSL reforçats amb 25 tècnics de prevenció Output 100%
Agència Inspecció de treball dissenyada Output 100%
Reducció del nombre d'hores/persona dedicades a tasques d'atenció i informació de primer nivell Resultat 60%
Reducció del nombre d'hores/persona dedicades a tramitació en processos amb SI renovats Resultat ?
Reducció del nombre d'hores/persona dedicades a revisió de convenis per publicació al DOGC Resultat = 6 persones temps comp. 2 a Bcn, 1STG, 1STT, 1STLL, 1STTE
Percentatge de llocs d'estructura i singulars coberts de forma provisional en relació al total Output < 3%
Proporció de la plantilla que participa en al menys 1 acció formativa al llarg de l'any Output > 60%
Valoració mitja de la qualitat dels cursos de formació rebuts (escala 1-4) Qualitat > 2
Percentatge de treballadors que valora favorablement les possibilitats de desenvolupament al DT Resultat > o = 60% Valor 2007 = 62%. Mitjana població de referència a estudi psicosocial 2007 = 55%
Resultat mig obtingut en l'avaluació de transferència efectiva de coneixements de els accions formatives (escala 1 a 4)Output > 2
Índex de sinistralitat (freqüència) Resultats 4,5
Plans d'emergència implantats i actualitzats Output 100%
Avaluacions de riscos realitzades Output 100%
Percentatge de mesures correctores executades en relació als riscos detectats Output 50%
Nombre de cursos de formació estratègica obligatòria programats i impartits Input 25
Percentatge de treballadors que es declaren satisfets amb el treball Resultats 60% Valor 2007: 56,25. Valor de referència Estat: 62,4
Valoració mitjana dels treballadors sobre el grau d'integració a l'empresa (escala 1 - 100) Resultats > 57 Valor 2007: 56,25. Valor de referència Estat: 58,9
Valoració dels treballadors sobre el sentit de la feina Resultats 75 Valor 2007: 75. Valor de referència Estat: 74,9
índex d'absentisme Resultats < o = 5,17% Valor inicial = índex desembre 2007
Nombre de queixes presentades per ciutadans en relació al tracte rebut pel personal del Departament Qualitat 0Pe5. Consolidar unes relacions laborals basades en el
diàlegNombre de grups de treball/comitès/comissions estables establerts amb els respresentants sindicals Output 4
F1. Assegurar recursos econòmics necessaris per inversions i
polítiques de foment Variació de la despesa corrent total (capítol 2) en relació al pressupost de l'exercici anterior Resultats 0%
F2. Implantació plena del pressupost per programes Nombre de subprogrames de despesa introduïts a l'avantprojecte de PPP 2009 Qualitat 3
F3. Establiment de contractes programa amb organismes adscrits Contractes-programa signats i operatius entre el DTI i els organismes i entitats adscrites Output
Executar el 100% dels recursos finalistes pressupostats dins l'exercici (Estat en fase D i FSE en fase o) Eficiència 100% (D/O)
Proporció de crèdit obligat de fons ordinaris Eficiència > 75% Valor 2007: 48%
Termini mig de tramitació d'expedients de contractació negociats Eficiència X dies
Termini mig de tramitació d'expedients de contractació oberts (concursos) Eficiència X dies
F5. Augmentar l'eficiència en la gestió del patrimoni adscrit al
departament Nombre d'edifics adscrits al DT i sense ús efectiu per part nostra que es traspassen a EiF o tercers Resultats 2 Calella, Almatret
C3. Conèixer les necessitats i expectatives de ciutadans i
empreses
Pe4. Adequar els comportaments a la cultura i valors de
servei
Pe2. Potenciar el desenvolupament professional i personal
RE
SU
LT
AT
S
Objectius estratègics
C.2 Millora de la informació i atenció a la ciutadania
C4. Gestió dels recursos públics eficient i socialment
responsable
Ciu
tad
an
s i
Em
pre
ses
Indicadors
RE
CU
RS
OS
Pr3. Adequar l'organització a les necessitats de servei
Pe3. Oferir un entorn de treball segur, saludable i confortable
Pre
ss
up
os
t i p
atr
imo
ni
F4. Augmentar l'eficiència en la gestió del pressupost, compres i
contractacions
Pr2. Incorporar noves tecnologies d'informació i
comunicacions
Pers
on
es
Pe1. Increment de la productivitat
Org
an
ització
i P
rocesso
s
Pr1. Racionalitzar i simplificar els procesos i eliminar tràmits
Scorecard of the Directorate of Services – Dept. of Employment and Industry of the Catalan Government
Source: own elaboration.
A j
oin
t i
nit
iati
ve o
f th
e O
EC
D a
nd
th
e E
uro
pe
an
Un
ion
,
pri
nc
ipall
y f
ina
nced
by t
he
EU
52
1.
Pla
d’o
rganització
i m
illora
de l'a
tenció
pre
sencia
l
2.
Pla
d’o
rganització
i m
illora
de l’a
tenció
tele
fònic
a
3.
Pla
de d
esenvolu
pam
ent
del w
eb d
el depart
am
ent
4.
Pla
de c
apta
ció
i g
estió d
e q
ueix
es,
suggerim
ents
i c
onsultes
5.
Pla
de n
orm
alit
zació
lin
güís
tica
6.
Pla
de s
implic
ació
i r
acio
nalit
zació
de p
rocedim
ents
7.
Pla
directo
r de s
iste
mes d
'info
rmació
8.
Pla
de m
illora
org
anitzativa
9.
Pla
d'a
rxiu
s i d
ocum
enta
ció
10.
Pla
de m
illora
de la g
estió d
el pers
onal
11.
Pla
de d
esenvolu
pam
ent
del pers
onal
12.
Pla
de c
om
unic
ació
inte
rna i g
estió d
el coneix
em
ent
13.
Pla
de p
revenció
de r
iscos labora
ls
14.
Pla
de g
estió d
el patr
imoni adscrit
al D
epart
am
ent
15.
Pla
nific
ació
i g
estió p
roactiva d
el pre
ssupost:
ingre
ssos i d
espeses
16.
Pla
nific
ació
i g
estió p
roactiva d
e les c
om
pre
s i c
ontr
acta
cio
ns
17,
Pla
d'e
sta
lvi energ
ètic i c
onsum
responsable
18.
Pla
de g
estió d
e les r
esid
èncie
s d
e t
em
ps lliu
re
C2. Millora de la informació i atenció a la ciutadania + + + + + + + + + + + + + +
C3. Conèixer les necessitats i expectatives de ciutadans i empreses i adequar oferta DTI + + + + + + +
C4. Gestió dels recursos públics eficient i socialment responsable + + + + + + + + + + + + + + + + -
Pr1. Racionalitzar i simplificar els procesos interns de gestió + + + + + + + + + + +
Pr2. Incorporar noves tecnologies d'informació i comunicacions + + + + + + + + +
Pr3. Adequar l'organització a les necessitats de servei + + + + + + + +
Pe1. Increment de la productivitat + + + + + + + + + + + + +
Pe2. Potenciar el desenvolupament professional i personal + + + + + + + + +
Pe3. Oferir un entorn de treball segur, saludable i confortable + + + + + +
Pe4. Adequar els comportaments a la cultura i valors de servei + + + + + + +
Pe5. Consolidar unes relacions laborals basades en el diàleg + + +
F1. Assegurar recursos econòmics necessaris per inversions i polítiques de foment + + + + +F2. Implantació plena del pressupost per programes +
F3. Establiment de contractes programa amb organismes adscrits + +
F4. Augmentar l'eficiència en la gestió del pressupost, compres i contractació + + + + + + + + + + +
F6. Augmentar l'eficiència de la gestió del Patrimoni adscrit al Departament + + + +
+ -
Org
an
itz. i
Pro
cesso
s
Impacte possitiu Impacte negatiu Sense impacte
Missió: contribuir a l'assoliment dels objectius i actuacions contemplats en el Pla de Govern en l'àmbit del Departament, a través de la millora contínua de la qualitat del
servei que aquest presta a ciutadans i empreses, així com d'una gestió eficient dels recursos públics.
Pers
on
es
Pre
ssu
po
st
i
Patr
imo
ni
RE
CU
RS
OS
RE
SU
LT
AT
S
Objectius estratègics / Plans de millora
Ciu
tad
an
s i
em
pre
ses
Non-linear relation among strategic goals and strategic programmes / projects / activities

A j
oin
t i
nit
iati
ve o
f th
e O
EC
D a
nd
th
e E
uro
pe
an
Un
ion
,
pri
nc
ipall
y f
ina
nced
by t
he
EU
53
Monitoring tools for specific areas and/or plans: ICT
Source: Directorate of Services. Department of Employment and Industry of the Catalan Government. 2008
A j
oin
t i
nit
iati
ve o
f th
e O
EC
D a
nd
th
e E
uro
pe
an
Un
ion
,
pri
nc
ipall
y f
ina
nced
by t
he
EU
54
No. Sub-Objective Deadline
Indicators
Definition Type Baseline Target
Value
on
(date)
“Traffic-
light” Remarks
Objective 1.
Source: Directorate of Services. Department of Employment and Industry of the Catalan Government. 2008

A j
oin
t i
nit
iati
ve o
f th
e O
EC
D a
nd
th
e E
uro
pe
an
Un
ion
,
pri
nc
ipall
y f
ina
nced
by t
he
EU
55
Enunciat Enunciat Tipus (*)Valor previst
inicial
Valor realitzat
a 31.12.2007Semàfor Comentaris
Oficines d'Informació i Atenció Ciutadana en funcionament al Departament Input 1 0,8 Oficina no oberta per endarreriment en obres dels SSCC.
Proporció de consultes ateses i resoltes a l'OAC en relació al total pel canal presencial Output 50%
Nombre de serveis i tràmits derivats a l'OAC Output 140
Proporció de tràmits iniciats a l'OAC en relació al total Output 60%
Proporció de consultes telefòniques ateses i resoltes al primer nivell (012) en relació al total Output 70% 70%
Percentatge d'increment del nombre de visites al web del DT en relació a l'exercici anterior Resultats 20% 10%
Nombre de queixes presentades en relació a la informació i atenció rebuda per qualsevol canal Qualitat 0 20 Totes relacionades amb l'atenció rebuda a les oficines de Treball
Existència de bústies de queixes i suggeriments a tots els canals i punts d'informació i atenció Input 25 bústies web 26 bústies web
Increment de consultes, queixes i suggeriments recollits per qualsevol canal Input 30% 175,20%
Nombre d'enquestes realitzades a usuaris dels serveis del DTI Input 200
Índex de satisfacció dels usuaris dels serveis del Departament Qualitat 70%
Variació de la despesa de capítol 2 en relació al pressupost inicial de l'exercici anterior Resultats > o = 3,7% -0,05%
Temps mig de pagament a proveïdors Resultats 60 dies 45 dies
Nombre de tràmits eliminats Resultats X
Nombre de consultes directes per via telemàtica realitzades a l'AEAT Resultats ? 8.592
Nombre de formularis revisats i simplificats Output X
Millora de la velocitat de la xarxa local dels edificis del DT Qualitat/Input < 3 segons < 3 segons
Variació en nombre d'incidències d'equipament i programari Qualitat/Input - X %
Tràmits que es poden iniciar via web del Departament Output 3 2 RTLL i subvencions a cooperatives. CLIO queda per 2008.
Reestructuració del Departament executada Resultats 100% 50% Decret 199/2007 publicat i dimensionament en tràmit.
Creació del Consell de Relacions Laborals Output 100% 50% Organisme creat, dimensionat i amb RLT en tràmit.
Reducció del nombre d'hores / persona dedicades a informació i atenció de primer nivell al DT Output ? ?
Reducció del nombre d'hores / persona dedicades a tramitació en processos amb SI renovats Output ? ?
Percentatge de llocs d'estructura i singulars coberts de forma provisional en relació al total Output < 3% 12% Els llocs pendents de convocar estan afecats pel Decret 199/2007
Proporció de treballadors que participen en al menys acció formativa al llarg de l'any Ouput > 60% 70,40%
Puntuació mitja obtinguda en l'avaluació de transferència d'accions formatives (escala 1 a 4) Resultats = o > 2 2 Només s'ha fet avaluació de transferència en 4 accions de formació.
Percentatge de treballadors que valora positivament les possibilitats de desenvolupament al DT Resultats > 55,5 62,5 Valor inicial = mediana població de referència a avaluació psicosocial 2007.
Índex de sinistralitat (freqüència) Resultats < 4,38 4,29 El valor incial és l'índex de freqüència de 2006.
Plans d'emergència implantats i actualitzats Ouput 100% 97% Només resten pendents els edificis en obres o de recent adquisició.
Avaluacions de riscos realitzades Output 100 158
Percentatge de mesures correctores executades en relació als riscos detectats Output 100% ? Falta implantar un sistema adquat de seguiment de mesures correctores.
Nombre de queixes presentades per ciutadans en relació al tracte rebut per personal del DT Resultats 0 20 Totes relacionades amb l'atenció rebuda a les oficines de Treball
Valoració dels treballadors sobre el grau d'integració a l'empresa Resultats > o = 59 56,25 Valor inicial = mediana població de referència a avaluació psicosocial 2007.
Valoració dels treballadors sobre el sentit de la feina Resultats > o = 75 75 Valor inicial = mediana població de referència a avaluació psicosocial 2007.
índex d'absentisme Resultats < o = 5,22% 5,17% Valor inicial = desembre de 2006. Valor final = setembre 2007.
Pe5. Consolidar unes relacions laborals basades en el diàlegNombre de grups de treball/comitès/comissions estables establerts amb els respresentants
sindicals Resultats 4 4
F1. Assegurar recursos econòmics necessaris per inversions i polítiques Variació de la despessa corrent de capítol 2 a pressupost incial del Departament Input > o = 3,7% -0,05% Valor final = variació entre pressupostos incials de cap. 2 de 2006 i 2007.
F2. Implantació plena del pressupost per programes Nombre de subprogrames de despesa introduïts al PPP 2008 Qualitat 3 0 Elaboració de 2 pressupostos dins d'un mateix exercici.
F3. Establiment de contractes programa amb organismes adscrits Contractes-programa signats i operatius entre el DTI i els organismes i entitats adscrites Resultats 2 0 Incidència de reestructuració del Govern i canvi equip Direcció DT.
F4. Augmentar l'eficiència en la gestió del pressupost, compres i
contractacions Proporció del crèdit oblgat en relació al pressupost definitiu Resultats < 64% 59,55% Nou equip de Direcció + gestió de pròrroga pressupostària i nou pressupost.
F5. Augmentar l'eficiència en la gestió del patrimoni adscrit al departament Subsitució d'espais de lloguer per espais de propietat rehabilitats adscrits al DT Output 1 1 Contracte del local del c/ Casp, 15
Pers
on
es
Ciu
tad
an
s i
Em
pre
ses
Indicadors
Pr2. Incorporar noves tecnologies d'informació i comunicacions
(Modernització i integració dels sistemes d'informació)
Pe1. Increment de la productivitat
Org
an
ització
i P
rocesso
s
Pr1. Racionalitzar i simplificar els procesos interns de gestió
No mesurable fins obertura efectiva de l'OAC
RE
SU
LT
AT
S
Objectius estratègics
C.1 Millora de la inf ormació i atenció a la ciutadania
C3. Gestionar eficientment els recursos públics
No mesurable fins obertura efectiva de l'OAC
C2. Conèixer les necessitats de ciutadans i empreses i adequar oferta DTI
RE
CU
RS
OS
Pr3. Adequar l'organització a les necessitats de servei
Pe2. Potenciar el desenvolupament professional i personal
Pre
ss
up
os
t i p
atr
imo
ni
Pe3. Oferir un entorn de treball segur, saludable i confortable
Pe4. Adequar el comportament del personal a la cultura i valors de servei
Strategy measurement
Source: Directorate of Services. Department of Employment and Industry of the Catalan Government. 2008

A j
oin
t i
nit
iati
ve o
f th
e O
EC
D a
nd
th
e E
uro
pe
an
Un
ion
,
pri
nc
ipall
y f
ina
nced
by t
he
EU
56
Pla d’actuació
Semàfor
Valoració progrés assolit el 2007
Prioritats 2008
Pla de desenvolupament del web del Departament
S’ha completat l’adaptació del web a la nova imatge corporativa GENCAT. S’han revisat i adaptat les aplicacions següents: 6C de la conciliació, manual de prevenció de riscos laborals al sector de la construcció i residències de temps lliure. S’ha completat l’adaptació a l’entorn corporatiu de la secció de seguretat i salut laboral. S’ha habilitat l’entrada al nou sistema de tramitació de subvencions a cooperatives i societats laborals. S’han posat en marxa les extranets del Servei de Creació d’empreses i del programa Jo, Directiva. S’ha habilitat l’entrada al nou sistema de recollida i gestió de queixes i suggeriments dels ciutadans. El nombre d’accessos mensual actual és de 151.000.
Web – nous serveis i tràmits o millora dels actuals Nous servis i tràmits: REA, registre de cooperatives i societats laborals, registre de sindicats i associacions empresarials, registre d’associacions d’autònoms, conciliacions laborals. Millora de l’aplicatiu per sol·licitud d’inscripció a les RTLL, Web – nous portals temàtics Portal Emprenedors.cat, Portal dones en el treball i Portal diversitat en el treball. Web – nous sistemes d’obtenció i/o explotació d’informació on-line Base de dades i cercador de laudes d’arbitratges laborals; cens de CETs, cens d’ECI, traspàs i adaptació de l’observatori de responsabilitat social de les empreses (RSE) del CTESC, obtenció d’informes via web del SISDEC, obtenció via web d’informació dinàmica sobre atur i contratació, consulta d’indexos de sinistralitat laboral. Web – difusió periòdica d’informació rellevant del Departament Nous butlletins electrònics en els àmbits de igualtat d’oportunitats en el treball i creació d’empreses. Nous serveis web RSS, mapes de localització geogràfica, formulari d’inscripció a jornades. Extranets (e-Catalunya) Elaboració i posada en marxa de nous espais a l’extranet corporativa en els àmbits següents: dones en el treball, diversitat en el treball, Consell de Relacions Laborals, Altres projectes Suport tècnic al SOC en la revisió i definició del seu web garantint la integració en l’entorn corporatiu. Seguiment del projecte corporatiu de nou portal de serveis i tràmits i adaptació progressiva del web del DT en allò que sigui necessari.
Pla de millora d’impresos i formularis
S’han revisat i millorat 594 formularis del Departament i del SOC, i se n’han creat 101 de nous a petició de diferents centres gestors i se n’han eliminat 139. Així mateix, en coordinació amb l’Àrea TIC s’han creat i penjat al web 3 formularis intel·ligents per tramitació electrònica.
Millorar l’accés extern i la gestió interna dels impresos mitjançant un nou sistema informàtic. Continuar les actuacions de revisió, millora i simplificació de formularis i posar a disposició de ciutadans i empreses nous formularis intel·ligents associats a la implantació progressiva dels nous sistemes de tramitació telemàtica previstos per al 2008 en el marc del Pla TIC.
Pla de normalització lingüística
165 documents revisats i 116 consultes ateses. 5 cursos de català impartits a la Inspecció de Treball.
Continuació de les actuacions de foment de la qualitat de la llengua catalana al DT i al SOC i continuació també de les activitats de formació i suport en aquest àmbit a la Inspecció de Treball.
Pla de millora organitzativa
Redacció i publicació d’un nou decret de reestructuració del Departament (199/2007), amb creació de la DGIOT i modificació de l’estructura de la SG, de la DGRL i de la DGECCE, amb incorporació de noves funcions en aquest darrer cas. Tramitació de la creació de dos programes sectorials: el PIOT, substituït en el Decret per la DGIOT i el Programa de desenvolupament i organització de la Inspecció de Treball. Dimensionament del Decret de reestructuració, del Consell de Relacions Laborals, del personal tècnic de prevenció dels CSSL, de la OAC i de l’Àrea de prevenció de riscos laborals del Departament. Elaboració de plecs per a la contractació d’assistència tècnica per dissenyar un pla director d’organització i processos i establir una oficina tècnica externa en aquest àmbit que doni suport a la SGORRHH.
Disseny del Pla director d’organització i processos i posada en marxa de l’oficina tècnica externa en aquest àmbit. Implantació del Decret 199/2007 (dimensionament previst per al 2007 i 2008). Tramitació del dimensionament del mateix Decret previst per 2009. Tramitació i execució del dimensionament dels CSSL, amb un increment previst de 25 llocs de tècnics. Suport a la tramitació del dimensionament del Decret de reestructuració del SOC i a la revisió de l’actual estructura organitzativa. Anàlisi i gestió del traspàs dels CETs al Departament. Suport tècnic al Programa de desenvolupament de la Inspecció de Treball en l’anàlisi i plantejament del traspàs de la Inspecció i en la creació d’una Agència en aquest àmbit. Suport al procés de trasllat dels SSTT de Girona a Sta. Caterina.
Overall annual assessment of progress made in strategic initiatives and identification of priorities for the next planning term
Plan Traffic
light
code Assessment of progress achieved
Recommendations and priorities for the next
planning period
Source: Directorate of Services. Department of Employment and Industry of the Catalan Government. 2008

A j
oin
t i
nit
iati
ve o
f th
e O
EC
D a
nd
th
e E
uro
pe
an
Un
ion
,
pri
nc
ipall
y f
ina
nced
by t
he
EU
3. How to incorporate and use corporate performance information
57
A j
oin
t i
nit
iati
ve o
f th
e O
EC
D a
nd
th
e E
uro
pe
an
Un
ion
,
pri
nc
ipall
y f
ina
nced
by t
he
EU
58
• It should be regarded as a process to institutionalise strategic thinking and learning.
• The sector of intervention determines the complexity of the PME system and the difficulty for its implementation (e.g. sectors as Health, with a long tradition on PME, vs. PAR).
• Step by step approach, defining desirable changes as part of a long-term change process.
Incorporation of corporate PME
A j
oin
t i
nit
iati
ve o
f th
e O
EC
D a
nd
th
e E
uro
pe
an
Un
ion
,
pri
nc
ipall
y f
ina
nced
by t
he
EU
59
Who asks and who answers the questions about performance?
Who designs and who manages the information and reporting system needed to answer such questions?
With what resources?
With what level of quality ?
With what guaranteed of normative issues ? (personal data protection, neutrality of the analysis, etc.).
Incorporation check-list
A j
oin
t i
nit
iati
ve o
f th
e O
EC
D a
nd
th
e E
uro
pe
an
Un
ion
,
pri
nc
ipall
y f
ina
nced
by t
he
EU
60
Measurement and reporting should be adjusted to different decision cycles relevant for the organisation, i.e.:
The policy cycle: policy preparation, monitoring, policy evaluation and feed-back, with time-tables established in the policy framework.
The financial cycle (associated with both policy/programmes financed by donors, and the Government budgeting cycle); it includes budgeting, accounting and auditing.
The contract cycle (with public bodies, with donors): negotiation, monitoring and evaluation.
Incorporation
A j
oin
t i
nit
iati
ve o
f th
e O
EC
D a
nd
th
e E
uro
pe
an
Un
ion
,
pri
nc
ipall
y f
ina
nced
by t
he
EU
Use
61
Management of false expectations by acknowledging the limitations of performance / monitoring / evaluation systems (they cannot measure everything; they cannot be the only source of information / criteria for decision making).
Recognising that there are circumstances where an intervention is surrounded by uncertainty in spite of very rigorous planning, or where one needs to constantly adapt to bring about the intended change, or where innovation and unplanned work is desirable.
Keeping an eye and mind open to unintended results of the strategy and action plans, as part of the process of building effective PME processes.

A j
oin
t i
nit
iati
ve o
f th
e O
EC
D a
nd
th
e E
uro
pe
an
Un
ion
,
pri
nc
ipall
y f
ina
nced
by t
he
EU
Monitoring and evaluation of the PME system
62
How much time is spent on PME and is it worth the effort?
Does the information collected generate knowledge?
Are all indicators still relevant? Are they measurable? Should we improve information / data sources, or develop new ones? Is that affordable for us?
Are roles and responsibilities still appropriate?
Are skills sufficient?
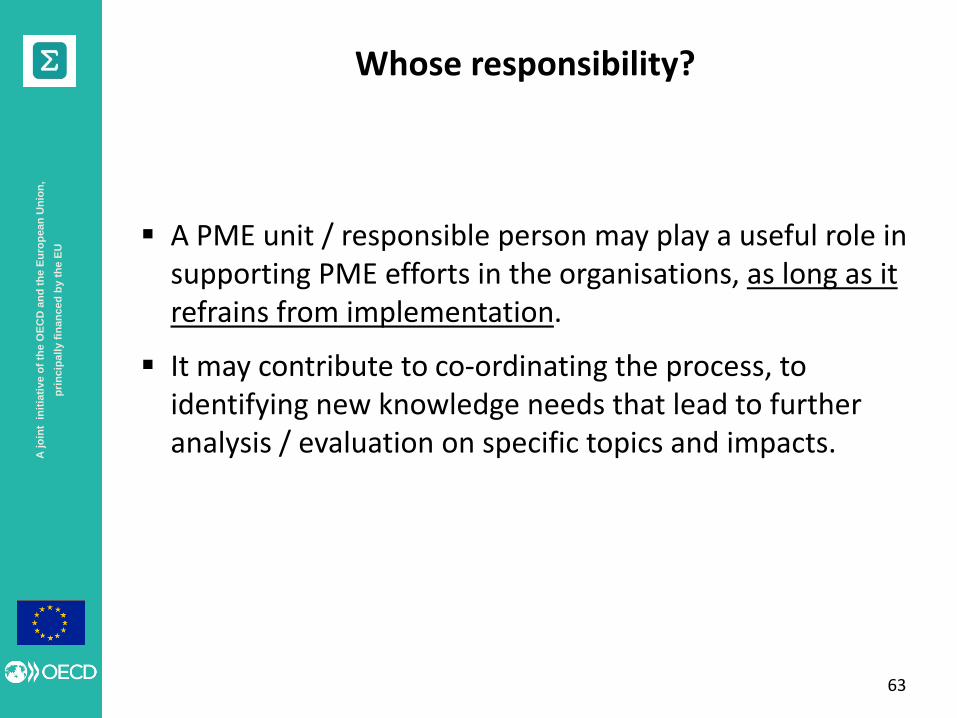
A j
oin
t i
nit
iati
ve o
f th
e O
EC
D a
nd
th
e E
uro
pe
an
Un
ion
,
pri
nc
ipall
y f
ina
nced
by t
he
EU
Whose responsibility?
63
A PME unit / responsible person may play a useful role in supporting PME efforts in the organisations, as long as it refrains from implementation.
It may contribute to co-ordinating the process, to identifying new knowledge needs that lead to further analysis / evaluation on specific topics and impacts.

A j
oin
t i
nit
iati
ve o
f th
e O
EC
D a
nd
th
e E
uro
pe
an
Un
ion
,
pri
nc
ipall
y f
ina
nced
by t
he
EU
4. Challenges and success factors.
64

A j
oin
t i
nit
iati
ve o
f th
e O
EC
D a
nd
th
e E
uro
pe
an
Un
ion
,
pri
nc
ipall
y f
ina
nced
by t
he
EU
Challenges to PME incorporation and use
65
• A perception of PME as imposed, technical and expensive (often perceived as a donor’s concern, rather than a way to strengthen learning).
• The above is reinforced when:
Project cycles are rigidly applied
Emphasis on efficiency and control (instead of effectiveness and learning)
Neglect the specificities of organisations (size, age, culture, type of interventions…)
Technocratic attitude, with an emphasis of inflexible application of instruments.

A j
oin
t i
nit
iati
ve o
f th
e O
EC
D a
nd
th
e E
uro
pe
an
Un
ion
,
pri
nc
ipall
y f
ina
nced
by t
he
EU
66
PME must become a way of doing, even a way of thinking about what an organisation wants to achieve.
Key success factors:
• PME tools must be adapted to the organisational context.
+
+
Management and PME tools
org
an
isa
tio
n’s
ma
turity
Chaos
Red tape
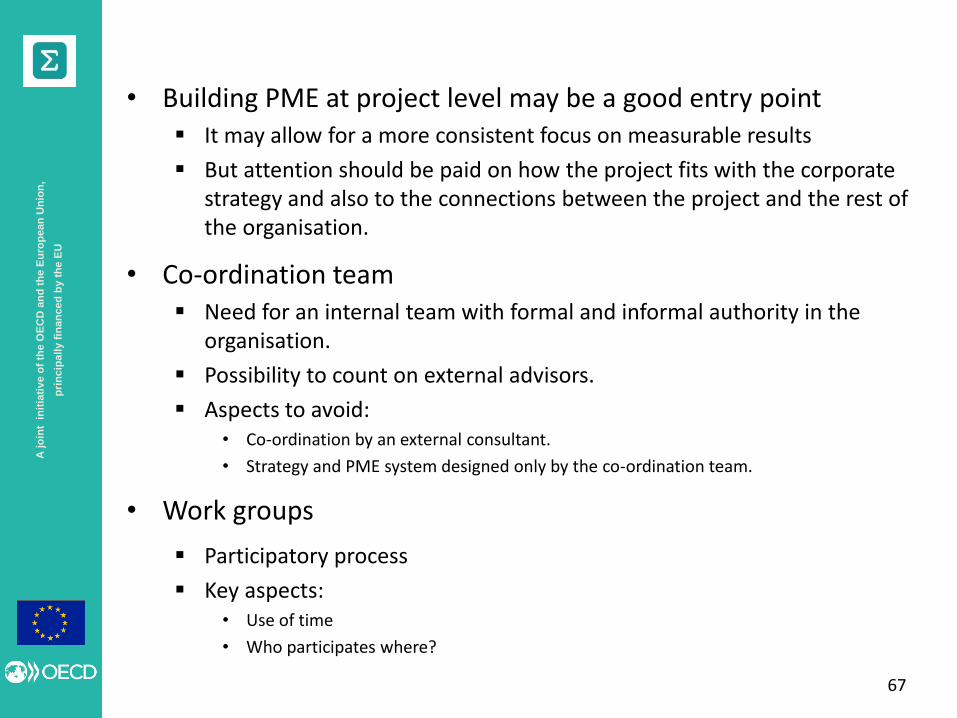
A j
oin
t i
nit
iati
ve o
f th
e O
EC
D a
nd
th
e E
uro
pe
an
Un
ion
,
pri
nc
ipall
y f
ina
nced
by t
he
EU
67
• Building PME at project level may be a good entry point It may allow for a more consistent focus on measurable results
But attention should be paid on how the project fits with the corporate strategy and also to the connections between the project and the rest of the organisation.
• Co-ordination team Need for an internal team with formal and informal authority in the
organisation.
Possibility to count on external advisors.
Aspects to avoid: • Co-ordination by an external consultant.
• Strategy and PME system designed only by the co-ordination team.
• Work groups
Participatory process
Key aspects: • Use of time
• Who participates where?

A j
oin
t i
nit
iati
ve o
f th
e O
EC
D a
nd
th
e E
uro
pe
an
Un
ion
,
pri
nc
ipall
y f
ina
nced
by t
he
EU
68
• It is important to establish different levels of involvement: communication, participation and decision making:
periodical meetings at programme / project level and at top management level (monthly and quarterly, respectively, for instance)
• First steps require more participation of the top management, while subsequent stages allow for work at different levels.
• Involvement of external stakeholders is highly desirable.
They can provide useful information
Their involvement may help to motivate internal staff.
• Strong leadership. Top management support is important in the strategy and PME system
definition, but it is even more important for a successful implementation and use.
Aspects to avoid:
• Support only at initial stages.
• “The leader’s strategy” => lack of embeddedness in the organisation
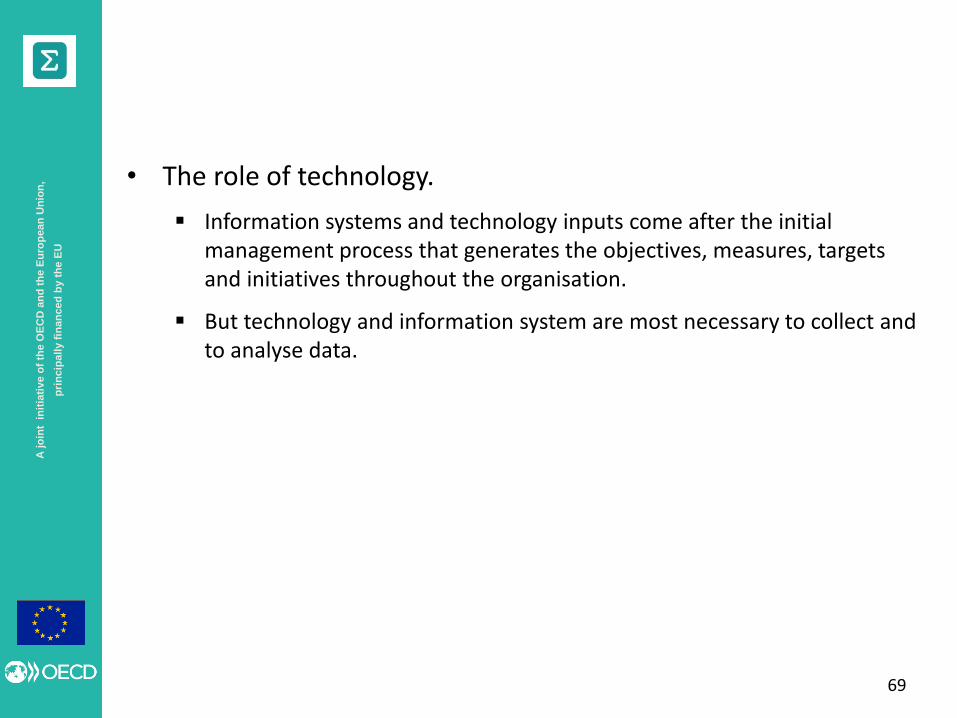
A j
oin
t i
nit
iati
ve o
f th
e O
EC
D a
nd
th
e E
uro
pe
an
Un
ion
,
pri
nc
ipall
y f
ina
nced
by t
he
EU
69
• The role of technology.
Information systems and technology inputs come after the initial management process that generates the objectives, measures, targets and initiatives throughout the organisation.
But technology and information system are most necessary to collect and to analyse data.

A j
oin
t i
nit
iati
ve o
f th
e O
EC
D a
nd
th
e E
uro
pe
an
Un
ion
,
pri
nc
ipall
y f
ina
nced
by t
he
EU
4. Challenges specific to the PAR field.
70
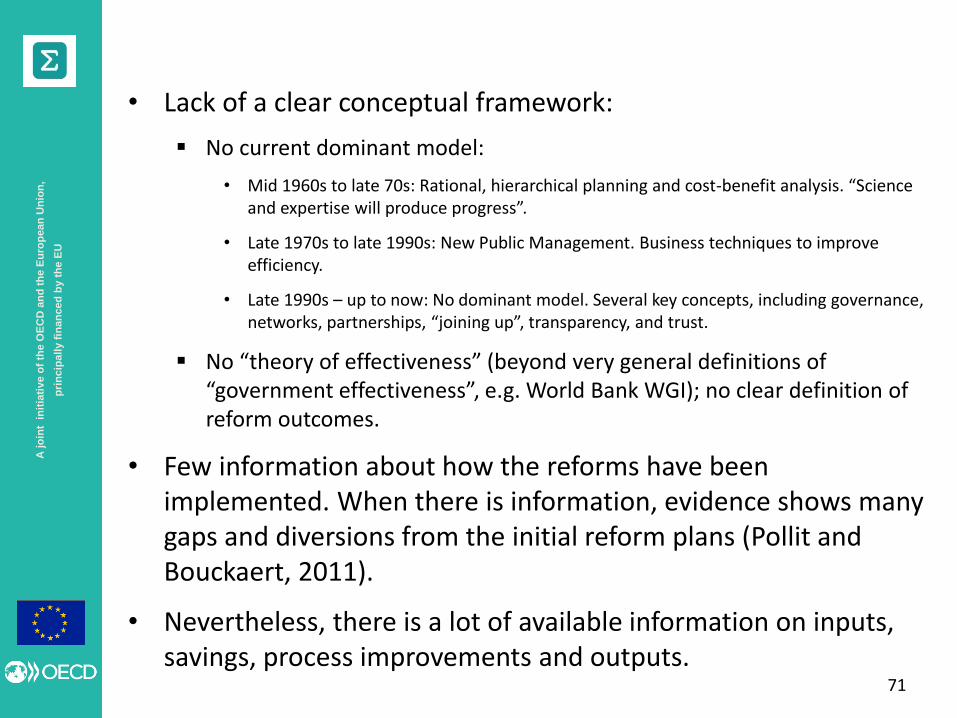
A j
oin
t i
nit
iati
ve o
f th
e O
EC
D a
nd
th
e E
uro
pe
an
Un
ion
,
pri
nc
ipall
y f
ina
nced
by t
he
EU
71
• Lack of a clear conceptual framework:
No current dominant model:
• Mid 1960s to late 70s: Rational, hierarchical planning and cost-benefit analysis. “Science and expertise will produce progress”.
• Late 1970s to late 1990s: New Public Management. Business techniques to improve efficiency.
• Late 1990s – up to now: No dominant model. Several key concepts, including governance, networks, partnerships, “joining up”, transparency, and trust.
No “theory of effectiveness” (beyond very general definitions of “government effectiveness”, e.g. World Bank WGI); no clear definition of reform outcomes.
• Few information about how the reforms have been implemented. When there is information, evidence shows many gaps and diversions from the initial reform plans (Pollit and Bouckaert, 2011).
• Nevertheless, there is a lot of available information on inputs, savings, process improvements and outputs.
A j
oin
t i
nit
iati
ve o
f th
e O
EC
D a
nd
th
e E
uro
pe
an
Un
ion
,
pri
nc
ipall
y f
ina
nced
by t
he
EU
72
• Difficulties to establish objective measures for some dimensions (e.g. responsiveness, equity, democratic quality) and debate on the validity and reliability of subjective measures.
• Great difficulties in establishing causal links between reform programmes and improvements in outputs and outcomes:
Reforms are multi-faceted, so that there is always a question of which elements are working and which are not.
Some key elements of reforms, such as changes in organisational structures, improved processes of management or, more recently, access to public information may be connected to outcomes only by long causal chains
Where some evidence exist, it often shows contradictory results, e.g. studies of NPM reforms in the UK (Boyne et al, 2006): a) efficiency raise; b) improved responsiveness to services’ users; c) reduced equity.
But, general lack of systematic research on PAR policy evaluation.

A j
oin
t i
nit
iati
ve o
f th
e O
EC
D a
nd
th
e E
uro
pe
an
Un
ion
,
pri
nc
ipall
y f
ina
nced
by t
he
EU
73
• Many PAR interventions (e.g. reorganisations) are very difficult to reverse.
• Rapid changes in policy / programme / project design.
• PAR is politically sensitive, often used to “signal” a shift in administrative cultures, seeking mainly a symbolic impact (e.g. the idea of a new, more participatory, citizen-friendly administration, or the one of “joined-up government”).
A j
oin
t i
nit
iati
ve o
f th
e O
EC
D a
nd
th
e E
uro
pe
an
Un
ion
,
pri
nc
ipall
y f
ina
nced
by t
he
EU
6. Practical exercise: corporate strategy definition of the U.S. Department of Commerce Economic Development
Administration (EDA)
74

A j
oin
t i
nit
iati
ve o
f th
e O
EC
D a
nd
th
e E
uro
pe
an
Un
ion
,
pri
nc
ipall
y f
ina
nced
by t
he
EU
• Goal: practical application of the conceptual framework about corporate strategy definition and description:
• Mission • Vision • Strategy map
• Method: Group work (45’) followed by presentations by each group (10’
each) and open discussion (10’).
Each group will deliver a short written outline of the conclusions (PPT or Word).
75

A j
oin
t i
nit
iati
ve o
f th
e O
EC
D a
nd
th
e E
uro
pe
an
Un
ion
,
pri
nc
ipall
y f
ina
nced
by t
he
EU
Proposal on next steps
1. Definition of OMSAR mission, vision and values (done already?)
• Who is in charge?
• What process of definition and decision making?
2. Definition and agreement on OMSAR strategic map (time perspective?)
3. Agreement on operationalisation of the strategy:
a) Contents:
• Is it necessary to add new plans / initiatives to tackle strategic goals?
• Is it necessary to review any of the existing initiatives?
b) Monitoring tools and templates: better to keep the existing ones? Need for review? Need to introduce monitoring tools in some areas? Room for manoeuvre with respect to donors monitoring & reporting requirements.
c) Management process (who, how, when, with what consequences)
4. Considerations about dissemination / accountability. 76

A j
oin
t i
nit
iati
ve o
f th
e O
EC
D a
nd
th
e E
uro
pe
an
Un
ion
,
pri
nc
ipall
y f
ina
nced
by t
he
EU
Main references
Boyne, G., Meier, K., O’Toole, L., Walker, R., (2006), Public Service Performance. Perspectives on Measurement and Management. Cambridge University Press.
Bouckaert, G., Halligan, J., (2008), Managing Performance. International Comparisons. Routledge.
Coninck, J., Chaturvedi, K., Haagsma, B., Grifffionen, H. Van der Glas, M. (2008), Planning, Monitoring and Evaluation in Development organisations. Sage Publications Inc.
Kaplan, R., Norton, D. (2004), Strategy Maps. Converting Intangible Assets into Outcomes. Harvard Business School Publishing Corporation.
Kaplan, R., Norton, D. (2001), The Strategy Focused organisation. Harvard Business School Publishing Corporation.
Pollit, C. Bouckaert, G. (2011), Public Management Reform. A Comparative Analysis: New Public Management and the Neo-Weberian State. Oxford Univerity Press.
Van Dooren, W., Bouckaert, G., Halligan, J., (2010), Performance Management in the Public Sector. Routledge.
77
A j
oin
t i
nit
iati
ve o
f th
e O
EC
D a
nd
th
e E
uro
pe
an
Un
ion
,
pri
nc
ipall
y f
ina
nced
by t
he
EU
Thank you for your attention !
78