blackburn with darwen borough council local plan 2/5.16a bwd retail... · cpca comparison shopping...
TRANSCRIPT
Roger Tym & Partners is now part of Peter Brett Associates LLP
Roger Tym & Partners t: 0161 245 8900 Oxford Place, 61 Oxford Street f: 0161 245 8901 Manchester e: [email protected] M1 6EQ w: www.tymconsult.com
Final Report June 2011
Blackburn with Darwen Borough Council
Retail Capacity Study Volume 1 – Main Report

RTP Job Number: M9555
Unless alternative contractual arrangements have been made, this report remains the property of Roger Tym & Partners until fees have been paid in full.
Copyright and other intellectual property laws protect this information. Reproduction or retransmission of the information, in whole or in part, in any manner, without the prior written consent of the copyright holder, is a violation of copyright law.

CONTENTS
LIST OF ABBREVIATIONS USED IN OUR REPORT
1 INSTRUCTIONS, CONTEXTUAL BACKGROUND AND OUTLINE OF REPORT STRUCTURE ......................................................................................................................... 1
Instructions ............................................................................................................................. 1
Contextual Background .......................................................................................................... 1
Outline of Report Structure ..................................................................................................... 2
2 NATIONAL AND REGIONAL POLICY REQUIREMENTS FOR TOWN CENTRES AND ECONOMIC DEVELOPMENT ............................................................................................... 3
Introduction ............................................................................................................................. 3
PPS4: Planning for Sustainable Economic Growth (December 2009) ................................... 3
PPS12: Local Spatial Planning (June 2008) .......................................................................... 5
The Requirements of the Current Regional Spatial Strategy ................................................. 5
Budget 2011: The Plan for Growth ......................................................................................... 7
Review of the Future of the High Street ................................................................................. 7
3 REVIEW OF KEY RETAIL TRENDS ...................................................................................... 9
Introduction ............................................................................................................................. 9
Retail Expenditure Growth ..................................................................................................... 9
Special Forms of Trading (SFT) ........................................................................................... 10
The Effects of the Economic Downturn on Town Centres and Retail Demand .................... 11
Vacancies Outlook ............................................................................................................... 12
The Development Pipeline ................................................................................................... 13
Polarisation Trend in the UK ................................................................................................ 14
The Role of Independent Retailers ....................................................................................... 15
The Growth of Discount Food Operators ............................................................................. 16
The Sale of Comparison Goods in Foodstores .................................................................... 16
4 CURRENT PATTERNS OF RETAIL SPENDING ................................................................ 19
Comparison Goods Household Survey Methodology and Catchment Area ........................ 19
Convenience Goods Household Survey Methodology and Catchment Area ....................... 22
Comparison Goods Spending Patterns in 2010 ................................................................... 24
Convenience Goods Spending Patterns in 2011 ................................................................. 31
Conclusions in Relation to Patterns of Retail Expenditure ................................................... 37

5 ASSESSMENT OF QUANTITATIVE RETAIL NEEDS ......................................................... 39
Introduction ........................................................................................................................... 39
Methodology for Assessing Quantitative Retail Need .......................................................... 39
Residual Expenditure Potentially Available for New Floorspace .......................................... 48
Findings in Relation to Quantitative Retail Need .................................................................. 50
Conclusions in Relation to Quantitative Retail Need ............................................................ 53
6 ASSESSMENT OF QUALITATIVE RETAIL NEEDS ........................................................... 55
Introduction ........................................................................................................................... 55
Updated Health Check of Blackburn Town Centre ............................................................... 55
Updated Health Check of Darwen Town Centre .................................................................. 59
Assessment of Qualitative Need .......................................................................................... 60
Conclusions in Relation to Qualitative Need ........................................................................ 69
7 SUMMARY AND RECOMMENDATIONS FOR MEETING IDENTIFIED QUANTITATIVE AND QUALITATIVE NEEDS ................................................................................................ 71
Introduction ........................................................................................................................... 71
Summary of Key Quantitative and Qualitative Needs .......................................................... 71
Recommendations ............................................................................................................... 74
Blackburn Town Centre ........................................................................................................ 75
Darwen Town Centre ........................................................................................................... 76
Out-of-Centre Development ................................................................................................. 77
Conclusion ............................................................................................................................ 77
ASSOCIATED VOLUME
Volume 2 – Appendices to the Main Report

LIST OF ABBREVIATIONS USED IN OUR REPORT
Abbreviation Definition
CLCR Central Lancashire City Region
CpCA Comparison Shopping Catchment Area
CvCA Convenience Shopping Catchment Area
DPD Development Plan Document
IMD Index of Multiple Deprivation
LAD Limited Assortment Discounter
LDC Local Data Company
LDF Local Development Framework
LPA Local Planning Authority
nef New Economics Foundation
OCA Overall Catchment Area
OE Oxford Economics
ONS Office for National Statistics
PBBI Pitney Bowes Business Insight
PPS Planning Policy Statement
RSS Regional Spatial Strategy
RTP Roger Tym & Partners
SFT Special Forms of Trading
SoSCLG Secretary of State for Communities and Local Government
sq.m Square Metres
SAA Steven Abbot Associates
VAT Value Added Tax

Blackburn with Darwen Retail Capacity Study
Final Report | June 2011 1
1 INSTRUCTIONS, CONTEXTUAL BACKGROUND AND OUTLINE OF REPORT STRUCTURE Instructions
1.1 In February 2011, Roger Tym & Partners (RTP) was commissioned by Blackburn with Darwen Borough Council to undertake a new Borough-wide Retail Capacity Study. The brief identified three key purposes of the study, as follows:
i The requirement for an update of the potential future retail development needs of the Borough as a whole and for the two town centres of Blackburn and Darwen.
ii The need to provide a robust evidence base to inform preparation of the Site Allocations and Development Management Development Plan Document (DPD), which will form part of the emerging Local Development Framework (LDF), taking into account the test of soundness which is set out in PPS12.
iii The need to provide an evidence base that can assist the Council in its determination of future retail planning applications and enhance the prospect of resisting such applications when they are not in accordance with the Council’s development strategy and PPS4, including the need to have regard to the qualitative benefits that such applications can bring.
1.2 Our work has been informed by the findings of the household telephone survey of comparison goods shopping patterns, which was commissioned by RTP in January and February 2010 for the purposes of the Tithebarn call-in Inquiry in Preston, and by the findings of a survey of convenience goods shopping patterns, undertaken in February and March 2011. The study has a forward time horizon to 2026, with separate outputs in relation to retail capacity for the periods to 2016, 2021 and 2026.
1.3 As well as the telephone surveys of households referred to above – which provide a detailed picture of existing shopping patterns – our research has included updated health checks of Blackburn and Darwen Town Centres in relation to key performance indicators.
Contextual Background 1.4 The study is particularly necessary given the key changes which have occurred since the
time of the last borough-wide retail capacity study, undertaken by Savills in 2005. As well as the investment which has occurred in the Borough’s town centres and in competing locations, there have of course been considerable changes in the economy generally and in the retail sector in particular, and there are various development commitments and proposals in Blackburn and competing locations that need to be considered.
1.5 Changes in circumstances since the 2005 study include the redevelopment and extension of the Blackburn Shopping Centre (The Mall) and the imminent relocation of Blackburn Markets. There are also a number of major commitments and proposals in competing locations, including Tithebarn (which is subject to a legal challenge), aspirations for relaxation of goods conditions at Whitebirk, significant new foodstores at Great Harwood

Blackburn with Darwen Retail Capacity Study
Final Report | June 2011 2
and Accrington, and emerging proposals for extensions to out-of-centre foodstores such as the Tesco at Hill Street in Blackburn.
1.6 It is therefore essential to consider the potential effects of the aforementioned commitments and proposals on Blackburn Town Centre, which is widely acknowledged as being vulnerable to decline. It is imperative that Blackburn builds on the improvements brought about by The Mall and the imminent relocation of the Markets. In turn, this will require the identification of retail need and capacity to be robust, and the identified needs must be delivered in the most sustainable locations.
1.7 In Darwen the issues are rather different. Darwen continues to lose market share in the comparison goods sector, in line with the national trend of polarisation whereby the larger centres continue to gain at the expense of smaller centres. However, Darwen remains a vital and viable market town because of its success in improving its retention of convenience goods expenditure and its role in meeting local needs.
Outline of Report Structure 1.8 The remainder of our report is structured as follows:
Section 2 provides a resumé of the requirements of current national and regional policy documents insofar as they relate to town centres and the location of town centre uses, planning for sustainable development, and the nature of site allocations DPDs.
Section 3 sets out an overview of national trends in the retail sector, and the implications these may have for Blackburn with Darwen.
Section 4 contains our analysis of current shopping patterns in the comparison and convenience retail sectors, based on the surveys of households which were undertaken by NEMS Market Research in January and February 2010 for comparison goods, and in February and March 2011 for convenience goods.
Section 5 provides our assessment of future quantitative need in the retail sector up to 2021 and, more tentatively, up to 2026.
Section 6 contains our assessment of qualitative retail needs, informed by our updated health checks of Blackburn and Darwen Town Centres.
Section 7 contains a summary of our findings and our recommendations to the Council and provides our assessment of potential opportunities for meeting identified quantitative and qualitative needs.
1.9 This main report is accompanied by a separate volume of Appendices which contains various health check tables and plans, the household survey questionnaires, and the comparison and convenience retail capacity spreadsheets.
1.10

Blackburn with Darwen Retail Capacity Study
Final Report | June 2011 3
2 NATIONAL AND REGIONAL POLICY REQUIREMENTS FOR TOWN CENTRES AND ECONOMIC DEVELOPMENT Introduction
2.1 Since the completion of the Blackburn with Darwen Shopping Study 2005-16 in 2005, the policy context within which local authorities should prepare their evidence bases has changed. Of most relevance to the preparation of the Blackburn with Darwen Core Strategy, and associated DPDs, are PPS4 (which was published in December 2009) and PPS12 (published in June 2008), the key requirements of which are outlined below.
PPS4: Planning for Sustainable Economic Growth (December 2009) Planning for Sustainable Economic Growth
2.2 PPS4 outlines the Government’s overarching objective for sustainable economic growth. In seeking to achieve this, the Government’s objectives for planning are to:
build prosperous communities by improving the economic performance of cities, towns, regions, sub-regions and local areas;
reduce the gap in economic growth rates between regions, promoting regeneration and tackling deprivation;
deliver more sustainable patterns of development; promote the vitality and viability of town and other centres; and raise the quality of life and environment in rural areas.
Plan Making Policies
2.3 In promoting positive planning, PPS4 advises that through their development plan, LPAs should prioritise areas with high levels of deprivation for regeneration, identify a range of sites to accommodate a broad range of economic development and encourage new uses for vacant or derelict buildings (Policy EC2).
2.4 In planning for their centres, PPS4 requires LPAs to set flexible policies that define a network and hierarchy of centres, make choices about which centres will accommodate any identified need – taking into account the need to avoid an over-concentration of growth – and plan proactively to promote competitive town centre environments, which provide consumer choice (Policy EC3).
2.5 Policy EC4 encourages LPAs to proactively plan to promote competitive town centres and provide consumer choice by:
supporting a diverse range of uses; planning for a strong retail mix, so that the range and quality of the comparison and
convenience retail offer meets the needs of the local catchment; supporting small scale economic uses in local centres and villages; identifying sites in the centre or, failing that, on the edge of the centre, capable of
accommodating larger format developments where a need has been identified;

Blackburn with Darwen Retail Capacity Study
Final Report | June 2011 4
retaining and enhancing existing markets; and taking measures to conserve and, where appropriate, enhance the established
character and diversity of their town centres.
2.6 When identifying sites for main town centre uses, LPAs should ensure that: there is a need for the development; the development is of an appropriate scale; the sequential approach has been applied to site selection; the impact on existing centres has been assessed; and that regeneration benefits have been considered. When selecting sites, PPS4 also gives preference to sites that best serve the needs of deprived areas (Policy EC5).
Development Management Policies
2.7 PPS4 advises that LPAs should adopt a positive and constructive approach towards planning applications for economic development1. All planning applications for economic development should be assessed against the following impact considerations:
whether the proposal will limit carbon dioxide emissions, and minimise vulnerability and provide resilience to climate change;
the accessibility of the proposal by a choice of means of transport; whether the proposal secures a high quality and inclusive design; the impact on economic and physical regeneration in the area; and the impact on local employment.
2.8 In determining planning applications for main town centre uses that are not in an existing centre, and not in accordance with an up to date development plan, LPAs should ensure that applicants have had regard to the sequential assessment as set out in Policy EC15.
2.9 Policy EC16.1 of PPS4 requires that planning applications for main town centre uses that are not in a centre and not in accordance with an up to date development plan be assessed against the following impacts:
impact on investment in centres located within the catchment of the proposal; impact on town centre vitality and viability; impact on allocated sites outside town centres; impact on in centre trade / turnover and on trade in the wider area; whether the proposal is of an appropriate scale; and any locally important impacts on centres under Policy EC3.1.e.
2.10 Policy EC17.1 requires LPAs to refuse planning permission where an applicant fails to demonstrate compliance with the sequential approach under Policy EC15, or where there is clear evidence that the proposal is likely to lead to significant adverse impacts in terms of
1 For the purposes of PPS4, economic development includes development within the B Use Classes, public and community uses and main town centre uses. Main town centre uses include retail development, leisure, offices and arts, culture and tourism development.

Blackburn with Darwen Retail Capacity Study
Final Report | June 2011 5
any one of the impacts set out under Policies EC10.2 and EC16.1. However, where no significant adverse impact has been identified, Policy EC17.2 requires LPAs to exercise a balancing approach, taking account of the positive and negative impacts of the proposal in terms of Policies EC10.2 and EC16.1, and any other material considerations.
PPS4 Practice Guidance – Need, Impact and the Sequential Approach
2.11 The PPS4 Practice Guidance on Need, Impact and the Sequential Approach (hereafter referred to simply as the PPS4 Practice Guidance) was published alongside PPS4 in December 2009. The Guidance does not constitute a statement of Government policy, but forms guidance to support and inform the policy contained within PPS4. Wherever appropriate, we cross-refer to the PPS4 Guidance in subsequent sections of our report.
PPS12: Local Spatial Planning (June 2008) 2.12 Paragraph 5.2 of PPS12 sets out a test of soundness for DPDs. To be considered ‘sound’,
a DPD should be justified, effective and consistent with national policy. ‘Justified’ means that the document must be founded on a robust and credible evidence base, and that the document contains the most appropriate strategy when considered against the reasonable alternatives. ‘Effective’ means that the document must be deliverable, flexible and able to be monitored.
2.13 The guidance contained within PPS12, places emphasis on the need for Core Strategies and DPDs to:
‘...demonstrate that the plan is the most appropriate, when considered against reasonable alternatives.’ (Paragraph 4.38 of PPS12, our emphasis); and
‘...show how the vision, objectives and strategy for the area will be delivered and by whom, and when.’ (Paragraph 4.45 of PPS12, our emphasis).
The Requirements of the Current Regional Spatial Strategy 2.14 Following the General Election, the Coalition Government signalled its intention in a letter of
27 May 2010 to ‘rapidly abolish’ Regional Strategies. On 6 July 2010, the Secretary of State for Communities and Local Government (SoSCLG) revoked all Regional Strategies, but Cala Homes challenged this revocation. It is not necessary to go into detail here about the legal basis for the challenge, which is complex, but the key point is that, on 10 November 2010, the High Court quashed the decision of the SoSCLG, purportedly made on 6 July 2010, to revoke Regional Strategies.
2.15 In the Localism Bill, which was published on 13 December 2010, the Government stated its intention to abolish Regional Strategies by removing the primary legislation which sets the basis for them. However, for the time being at least, the Regional Spatial Strategy (RSS) for the North West – which was published in September 2008 – remains a component of the adopted development plan.
2.16 Policy RDF1 sets out the Regional Spatial Framework, and is the cornerstone of the RSS. Policy RDF1 identifies Blackburn as a third priority for growth, behind the regional centres of Manchester and Liverpool, and the inner areas surrounding these centres. In turn, policies DP1 through to DP9 set out the spatial principles that underpin the RSS, which

Blackburn with Darwen Retail Capacity Study
Final Report | June 2011 6
include the policies for promoting sustainable communities and economic development, and the priorities for marrying opportunity with need.
2.17 The sustainable economy policy of most relevance to this study is Policy W5. Policy W5 proceeds on the basis of an opening paragraph which seeks to promote retail investment that assists in the regeneration and economic growth of the region’s town and city centres, subject to three key tests to the effect that such development should:
be consistent with the scale and function of the centre; not undermine the vitality and viability of any other centre; and not create unsustainable shopping patterns.
2.18 Policy W5 goes on to state that:
i Manchester/Salford and Liverpool City Centres will continue to function as the North West’s primary retail centres;
ii comparison retail facilities should be enhanced and encouraged in the 26 centres that it lists (which substantially overlap with the third tier locations identified in Policy RDF1, and include Blackburn);
iii investment, of an appropriate scale, in centres not identified in ii) above will be encouraged in order to maintain and enhance their vitality and viability, including investment to underpin wider regeneration initiatives, to ensure that centres meet the needs of the local community, as identified by local authorities; and that
iv there will be a presumption against new out-of-centre regional or sub-regional comparison retail facilities, requiring local authorities to be proactive in identifying and creating opportunities for development within town centres.
2.19 Whilst Darwen and the district centres within the Borough of Blackburn with Darwen are not specifically recognised in Policy W5, the policy states that investment of an appropriate scale in those centres not identified will be encouraged in order to maintain and enhance their vitality and viability.
2.20 Finally, Policies CLCR1 and CLCR2 aim to support the vision to develop the Central Lancashire City Region (CLCR) as an area where investment is focused in the City of Preston – and the three towns of Blackburn, Blackpool and Burnley (Policy CLCR1) – and where development is pursued in a manner that addresses worklessness, enhances urban quality and contributes to the enhancement of the natural setting of the city/towns (Policy CLCR2).
2.21 The RSS identifies one of the strengths of the CLCR as being its polycentric nature. Thus, in keeping with Policy W5, growth in the CLCR should be sustainably distributed across the centres, so as to prevent any one centre within the polycentric region becoming unduly dominant.

Blackburn with Darwen Retail Capacity Study
Final Report | June 2011 7
Budget 2011: The Plan for Growth 2.22 This year’s budget – which was published on 23 March 2011 - saw the launch of the
Government’s ‘Plan for Growth’, which set out reforms in areas identified as acting as barriers to enterprise. This included a review of the retail sector.
2.23 A package of measures was announced to support thriving town centres and build on the ‘town centres first’ policy which is enshrined in PPS4. This included the simplification and scaling back of various regulations affecting retailers, and a further review of the skills system in order to ensure that it is delivering what the sector needs. Additionally, the Budget stated that best practice guidance will be published detailing the potential benefits of Business Improvement Districts and on ways in which local authorities can use Compulsory Purchase Orders to help re-invigorate their town centres.
Review of the Future of the High Street 2.24 In May 2011, it was announced that Mary Portas, the leading retail market consultant, will
lead an independent review into the future of the high street on behalf of the Department for Business, Innovation and Skills. The review will examine the case for developing town centres so that economic growth is promoted, jobs are created and quality of life for town centre users is enhanced. New business models for high streets will be explored, and the report will recommend ways in which diverse, sustainable high streets can be created where businesses of all sizes can thrive.


Blackburn with Darwen Retail Capacity Study
Final Report | June 2011 9
3 REVIEW OF KEY RETAIL TRENDS Introduction
3.1 This section of our report provides an overview of current national trends in the retail sector, highlighting, wherever appropriate, those that we consider could have – or are already having – an impact in Blackburn with Darwen. The review is drawn from a range of published data sources, including research carried out by Verdict, PBBI/OE, the New Economics Foundation, CB Richard Ellis and Colliers International.
Retail Expenditure Growth 3.2 Graph 3.1 illustrates the growth in comparison goods retail expenditure per capita and in
convenience goods retail expenditure per capita in the UK since 1983, in constant year 2006 prices. The growth in the comparison goods sector has far surpassed that in the convenience goods sector, and has averaged 5.6 per cent, per capita, per annum since 1983, compared to a growth rate for convenience goods expenditure since 1983 of just 0.9 per cent, per capita, per annum.
Graph 3.1 UK Annual Average Expenditure Per Capita
Source: Oxford Economics/PBBI Information Brief 2010/2011, Table 3.2 (2006 prices).
3.3 Graph 3.1 also illustrates the beginning of the recession in late 2008 and in 2009 (the latest year for which data are available). Indeed, there was a fall in per capita expenditure on comparison goods in 2009 of -0.3 per cent, which is the first fall since 1991. Moreover, in the convenience sector, there has been negative growth in both 2008 of -1.5 per cent, and in 2009 of -2.7 per cent. Experian and PBBI/OE anticipate a return to growth in per capita spending on comparison goods in the range 2.4 per cent, per annum to 3.8 per cent per annum as early as 2012, but both forecasters do not envisage a return to levels of previous
250500750
1,0001,2501,5001,7502,0002,2502,5002,7503,0003,250
Expe
nditure Pe
r Ca
pita (£
)
UK Annual Average Expenditure Per Capita
Convenience Comparison

Blackburn with Darwen Retail Capacity Study
Final Report | June 2011 10
growth in the period up to 2020, with growth between 2015 and 2020 anticipated to be just over 3 per cent, per capita, per annum.
3.4 In the past, the consistent growth in expenditure has supported growth in new retail floorspace and, particularly in the 1980s and 1990s, the growth in large out-of-centre development. However, these levels of growth in floorspace are unsustainable in the context of the current economic climate. Indeed, not only has the economic downturn resulted in lower forecast levels of spending, but it has also had an effect on investor and developer confidence, meaning that in many town centres across the country, retail schemes have either been put on hold, or are now only viable with huge amounts of public sector pump priming.
Special Forms of Trading (SFT) 3.5 New forms of retailing have emerged in recent years as popular alternatives to traditional
high street shopping, with the expansion of the sale of retail goods over the internet (e-tailing) increasingly becoming an issue when planning for retail development.
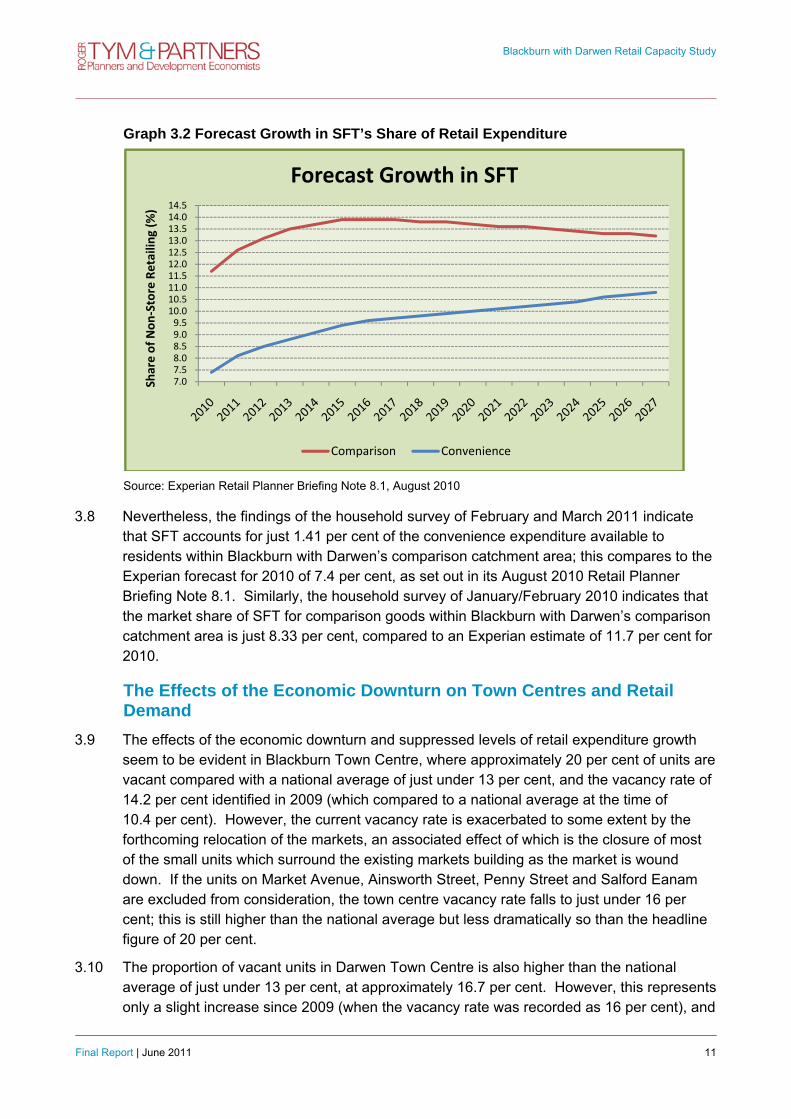
3.6 The value of non-store retail trade (known as Special Forms of Trading) in 2009 was approximately £26.1bn; this represented 8.8 per cent of all retailing2. Experian projects that non-store retailing will grow to reach a peak of 13.9 per cent of comparison goods expenditure in the year 2017, followed, thereafter, by gentle decline (as shown in Graph 3.2). In the convenience goods sector, Experian projects that this will continue to grow up to 2027, to reach 10.8 per cent of convenience sales at that date, but with a significant proportion of these sales representing goods taken off supermarket shelves, and with little impact on demand for floorspace.
3.7 It is important to bear in mind when considering these forecasts, that there is a high degree of uncertainty about future trends in internet usage. A recent move was Asda’s announcement in August 2010 that it is to open a warehouse dedicated to internet orders in Enfield, following the Ocado approach of distributing goods form warehouses rather than stores. If this trend continues, demand for convenience goods retail floorspace as a result of internet shopping may reduce as supermarkets move to a centralised system to ease pressure on stores.
2 Experian, Retail Planner Briefing Note 8.1, August 2010
Blackburn with Darwen Retail Capacity Study
Final Report | June 2011 11
Graph 3.2 Forecast Growth in SFT’s Share of Retail Expenditure
Source: Experian Retail Planner Briefing Note 8.1, August 2010
3.8 Nevertheless, the findings of the household survey of February and March 2011 indicate that SFT accounts for just 1.41 per cent of the convenience expenditure available to residents within Blackburn with Darwen’s comparison catchment area; this compares to the Experian forecast for 2010 of 7.4 per cent, as set out in its August 2010 Retail Planner Briefing Note 8.1. Similarly, the household survey of January/February 2010 indicates that the market share of SFT for comparison goods within Blackburn with Darwen’s comparison catchment area is just 8.33 per cent, compared to an Experian estimate of 11.7 per cent for 2010.
The Effects of the Economic Downturn on Town Centres and Retail Demand
3.9 The effects of the economic downturn and suppressed levels of retail expenditure growth seem to be evident in Blackburn Town Centre, where approximately 20 per cent of units are vacant compared with a national average of just under 13 per cent, and the vacancy rate of 14.2 per cent identified in 2009 (which compared to a national average at the time of 10.4 per cent). However, the current vacancy rate is exacerbated to some extent by the forthcoming relocation of the markets, an associated effect of which is the closure of most of the small units which surround the existing markets building as the market is wound down. If the units on Market Avenue, Ainsworth Street, Penny Street and Salford Eanam are excluded from consideration, the town centre vacancy rate falls to just under 16 per cent; this is still higher than the national average but less dramatically so than the headline figure of 20 per cent.
3.10 The proportion of vacant units in Darwen Town Centre is also higher than the national average of just under 13 per cent, at approximately 16.7 per cent. However, this represents only a slight increase since 2009 (when the vacancy rate was recorded as 16 per cent), and
7.07.58.08.59.09.510.010.511.011.512.012.513.013.514.014.5
Share of Non
‐Store Retailin
g (%
)
Forecast Growth in SFT
Comparison Convenience

Blackburn with Darwen Retail Capacity Study
Final Report | June 2011 12
the rise has been by less than the change in the national average, which has risen by around 2.5 percentage points since 2009. Furthermore, the proportion of vacant floorspace in Darwen Town Centre (11.2 per cent) is almost identical to the national average (11.3 per cent).
3.11 We provide further commentary on the vacancy rate indicator in Section 6 of our report, but the figures referred to above indicate that whilst the vacancy rate has increased in Blackburn and Darwen Town Centres since 2009, the change has been no worse than the general trend at the national level.
Vacancies Outlook 3.12 The Local Data Company (LDC) published its End of Year Vacancy Report 2010 in January
20113. The LDC report shows that vacancy levels in the North and Midlands are significantly higher than in the south of England. According to the LDC report, 90 per cent of the top 25 highest vacancy rates in the ‘largest centres’ are found in the Midlands and the North. The corresponding figure for the ‘medium centres’ is lower – but still significant – at 68 per cent4.
3.13 As of June 2010, Blackburn had the seventh-highest vacancy rate of the country’s ‘medium centres’ according to the LDC report. Darwen is not mentioned in the report, and of the 25 ‘medium centres’, only four – Morecambe, Newport, Paisley and Gloucester – are said to have experienced greater year-on-year increases in vacancy rates than Blackburn. However, as we explained above, the current vacancy rate figures for Blackburn are artificially high due to small units which surround the existing market building becoming vacant in advance of the forthcoming relocation of the markets.
3.14 The VAT increase to 20 per cent in January 2011 will inevitably reduce consumer demand – particularly for ‘big ticket’ items – although the full effects of this will not become known for a while yet, and it is widely reported in the press that some retailers are absorbing the tax increase rather than passing it onto consumers.
3.15 As well as the impact of tax rises, retailing will also be vulnerable to the effects of public sector pay freezes and job cuts. This squeeze on growth in consumer expenditure will create a tougher trading environment for retailers, with knock-on effects likely to include the scaling back of store expansion plans for some retailers, rationalisation to concentrate on only the most profitable stores, and an emphasis on cost containment across the board.
3.16 Numerous high-profile retailers have already gone out of business in the last couple of years including Adams, Woolworths, MFI, Zavvi, Borders, Ilva and The Pier, and other retailers such as HMV, Waterstones, JJB and O2 are looking to offload or close stores in response to declining sales. The LDC report refers to the latest ‘Red Flag Alert’ from
3 ‘Terminal Illness or Gradual Decline? A review of GB shop vacancy in 2010’ (referred to in the same report as ‘End of Year Vacancy Report 2010’, Local Data Company, January 2011. 4 For the purposes of its report, the LDC defines ‘largest centres’ as those that contain 400+ ‘shops’ within the ‘CLG retail core’. ‘Medium centres’ are defined as those that have 200-399 shops within the CLG retail area.

Blackburn with Darwen Retail Capacity Study
Final Report | June 2011 13
business recovery firm Begbies Traynor which indicates that some 10,250 companies in the retail sector are facing financial distress and, according to the LDC, The Centre for Retail Research expects around 10,000 shops to close in 2011.
3.17 In summary, the negative impact of the recession and ongoing economic conditions is two-fold; visitors are spending less, and investors are taking longer to commit to schemes. These effects are compounded by the collapse of numerous national retailers. It seems likely that the various pressures will curb rental growth, restrain demand for new retail floorspace and, therefore, exacerbate town centre vacancy rates.
The Development Pipeline 3.18 In terms of future supply, there is concern that the longer developments remain in the
pipeline, the more difficult it will be for retailers to expand. Much of the existing secondary and tertiary stock in town centres is unfit for the purposes of mass-market retailing. This is evident in Blackburn Town Centre; away from The Mall, much of the retail stock is small, poor quality and too dated to successfully attract better quality high street multiples.
3.19 Therefore, as the economy recovers, and retailer requirements return to pre-recession levels, the development pipeline is going to find it difficult to keep pace. It is therefore important that, where possible, public sector partners remain committed to supporting schemes which will help support the future recovery of their town centres.
3.20 The economic shift that has occurred as a result of the economic recession may, in the longer term, bring some positive benefits to town centres such as Blackburn and Darwen. The unprecedented growth in consumer expenditure, which fuelled the large scale developments seen in many of the larger town and city centres throughout the country over the last decade, are now unsupportable. As such, it is likely that in the future we will see a shift from large scale town centre developments such as Liverpool One and Highcross Leicester, with large department store anchors, to smaller and simpler schemes which are anchored by a range of retailers and which are more deliverable in what is likely to be a much more restrained market sector in the future. In Blackburn, this shift reinforces the need to support appropriately sized, deliverable schemes which will help to consolidate and enhance the town centre’s retail offer.
3.21 This shift to smaller schemes could also be encouraged by greater certainty in the planning environment, as DPDs are adopted throughout the country, and LPAs accept that town centre schemes cannot fund all planning obligations if they are to be viable and deliverable. Thus, whilst the recession may have made retailers and developers more cautious, there is still interest in town centres, albeit now on a smaller and more modest scale.
3.22 There are also early signs that stalled schemes are being re-evaluated; whilst developers and investors remain cautious, many schemes which had previously been victims of the downturn are now being re-worked and re-negotiated to achieve viability again. There is also growing support, within both the public and private sectors, for new finance initiatives such as Tax Increment Financing and Accelerated Development Zones, which unlock revenue streams to support development in areas where it would otherwise not have been viable.

Blackburn with Darwen Retail Capacity Study
Final Report | June 2011 14
3.23 Nevertheless, it remains to be seen whether or not retailers and developers will be willing to buck the polarisation trend, whereby they are increasingly attracted to larger stores in the larger centres, offering a full range, rather than supporting a wider network of smaller stores. Developers are opportunists and commercial viability remains their overriding concern. It is therefore crucial that the Council remains proactive in attracting investment to its centres, particularly in the face of increasing competition from out-of-centre locations and higher-order centres.
Polarisation Trend in the UK 3.24 A significant and long term trend is the continuing polarisation by retailers towards larger
stores in larger centres. Retailers recognise that greater efficiency can be achieved by having a strategic network of large stores offering a full range, rather than having a large network of smaller stores, and are therefore increasingly seeking to serve larger population catchments from larger stores. This trend is also driven by consumers who are becoming more discerning and are increasingly prepared to travel further.
3.25 We are therefore witnessing a growing concentration of comparison goods expenditure in a smaller number of larger centres. Indeed, CB Richard Ellis estimates that half the population currently shops in just 70 or so major locations, down from 200 locations 30 years ago5.
3.26 This concentration of retailing in larger centres is a potential threat to Blackburn and Darwen Town Centres. In a climate whereby retailers are looking to cut costs and increase efficiency, they are unlikely to be willing to accept constrained or deficient units for the sake of gaining representation, and some retailers might therefore choose competing centres such as Preston, where they can serve a similar catchment while operating from larger and more efficient units.
3.27 However, it is also worth bearing in mind that the economic downturn might, in the longer term, result in a departure from this trend. As previously discussed, it is likely that developers will no longer be willing to take the risks associated with large scale, complicated town centre schemes. The result of this is that we might begin to see smaller, simpler schemes which are much more viable in town centres such as Blackburn, than the more ambitious projects of the last decade.
3.28 The growth in market share of the large foodstore operators, and the decline in the number of independent convenience traders, poses similar challenges for small town centres and district/local centres which rely on their convenience/service base. A clear picture is emerging of a network of large dominant superstores, and corresponding decline/diversification in the traditional smaller centre. CB Richard Ellis suggest that half the population now shops for main groceries in less than 1,000 of the country’s 10,000 plus main grocery stores, the majority of which are located out-of-centre6. This trend is more
5 Source: CB Richard Ellis, UK Retail Briefing, September 2008 6 Source: CB Richard Ellis, UK Retail Briefing, Issue 2, 2007
Blackburn with Darwen Retail Capacity Study
Final Report | June 2011 15
likely to threaten district and local centres – in particular the ones which rely on a strong a convenience and service base to underpin and support their vitality and viability – although larger centres such as Blackburn and Darwen are not immune from the competitive threat posed by large out-of-centre foodstores.
The Role of Independent Retailers 3.29 The decline of the independent/specialist convenience retail sector in the UK is well-
documented. Between 1998 and 2008, the market share of independent convenience outlets reduced from 7.6 per cent to 5.2 per cent, whereas the corresponding market share of food superstores increased from 46.9 per cent to 54.1 per cent7. The New Economics Foundation (nef) in its work on Clone Town Britain8 asserts that the loss of traditional stores, caused by the rise of the large superstore operators and national multiples, is resulting in the ‘homogenisation of our high streets’. The nef explains that during the period 2007 to 2009, larger grocers and their ‘local’ styled outlets expanded across high streets at the expense of 914 branches of smaller shop multiples in the sectors of confectionary/tobacco/newsagents, off-licences, tea/coffee and bakers.
3.30 However, independent retailers continue to play an important role. A thriving independent sector can be a significant factor in attracting visitors to a town, providing a unique and distinct offer. A healthy independent sector can also contribute significantly to a town’s overall well-being. The nef notes that:
‘…locally rooted, independent retailers relate differently to the communities they serve. In economic terms, more of the money spent in them is likely to re-circulate in the local area. They are more likely to support other local businesses too, rather than procuring the goods and services they need from other remote national and international suppliers. In difficult times, locally rooted stores are also more likely to … remain open, doing whatever they can to keep trading’.9
3.31 Successful street markets can play an important role in the success of in a town’s independent retail sector. The nef notes that ‘street markets keep more money circulating in the local economy, … provide twice as many jobs as supermarkets, support retail diversity by providing space for a range of independent local traders, and provide a low risk environment in which new enterprises can flourish.’10
7 Source: Table 3 of UK Grocery Food and Retailers 2009, Verdict (April 2009) 8 Re-imagining the High Street: Escape from Clone Town Britain (New Economics Foundation, 2010). 9 Ibid 10 Ibid

Blackburn with Darwen Retail Capacity Study
Final Report | June 2011 16
The Growth of Discount Food Operators 3.32 The limited assortment discount (LAD) supermarket chain Netto was acquired by Asda in
May 2010, and most of the 193 Netto stores will be converted into branches of Asda by the middle of 2011 (with the remainder being sold off to other retailers). Accordingly, there will soon be two national LAD operators in the UK – Aldi and Lidl – rather than three.
3.33 The LADs performed well at the height of the recession, in 2008 and 2009, as consumers searched for a bargain. However, Verdict reports11 that the pace of growth in the LAD sub-sector is now showing signs of slowing, primarily as a result of strong competition from the ‘big four’ foodstore operators, all of which have their own ‘discount’ brands. The ‘big four’ (with the possible exception of Morrisons) are also increasingly looking to strengthen their portfolio of smaller stores and this represents a further threat to the LAD operators.
3.34 In response to consumer attitudes, Aldi has been working hard to improve perceptions of the quality of its product range. For instance, Aldi now has a ‘Specially Selected’ range which, according to its website, offers ‘premium quality’ and ‘exceptional taste’. The Specially Selected range includes coffee, wine, chutney, brioche, sausages and parma ham. Furthermore, Aldi employs the celebrity chef, Phil Vickery, who regularly provides recipes using products available in Aldi stores, and Aldi’s website provides details of numerous recent awards that the company has won for the quality of its products.
3.35 Lidl similarly employs a celebrity chef to develop recipe ideas (Nick Nairn), and Lidl’s website confirms that, in common with Aldi, its products have either been nominated for or have received numerous awards for their quality in recent years. Accordingly, in our assessment, the distinction between Aldi/Lidl and the other mainstream foodstore operators has blurred in recent years.
3.36 Aldi and Lidl both prefer prominent sites with main road frontages, which, by definition, are often located away from defined centres. Such a strategy puts pressure on LPAs when they are determining applications, given the need to protect the vitality and viability of existing town and district centres
The Sale of Comparison Goods in Foodstores 3.37 In recent years, the main foodstore operators have sought to increase the proportion of
floorspace dedicated to the sale of comparison goods in their stores. Verdict12 anticipates that non-food will continue to be a key driver for Asda, Sainsbury's and Tesco as they invest in their non-food propositions to boost growth and drive footfall, mitigating against more subdued growth in convenience expenditure.
3.38 The increased competition from foodstores as they continue to expand their comparison goods offer is a growing threat to town centres. Accordingly, it is imperative that the Borough Council continues to ensure that any new foodstore permissions are adequately
11 Verdict, Food and Grocery Retailers 2010 (revised edition), November 2010 12 ibid.

Blackburn with Darwen Retail Capacity Study
Final Report | June 2011 17
conditioned to limit the amount of floorspace which can be used for the sale of comparison goods. This applies equally to extensions and redevelopments of existing foodstores, because the foodstore operators often seek to use the additional floorspace for the sale of comparison goods.


Blackburn with Darwen Retail Capacity Study
Final Report | June 2011 19
4 CURRENT PATTERNS OF RETAIL SPENDING Comparison Goods Household Survey Methodology and Catchment Area
4.1 A telephone survey of 6,003 households was undertaken by NEMS Market Research in January and February 2010 to inform the evidence presented to the Tithebarn Public Inquiry by Blackburn with Darwen Borough Council and the Fylde Coast Authorities. The Tithebarn survey sought to establish patterns of comparison goods spending across the whole of the Central Lancashire sub-region, which was sub-divided into 48 zones as shown in Figure 4.1.
Figure 4.1 Catchment Area and Study Zones for the Tithebarn Survey
4.2 For the purposes of the current Blackburn with Darwen study, we focus on Zones 23 to 29 and Zones 37 to 40 from the Tithebarn survey area, which represents the comparison shopping catchment of Blackburn and Darwen Town Centres
4.3 For nine of these 11 zones, 10 per cent or more of the comparison goods expenditure from the zone’s residents flows to Blackburn Town Centre. The two exceptions are Zone 29, for which there is no dominant comparison goods destination, and Zone 39, which is included because it falls partly within the administrative area of Blackburn with Darwen. Based on the wider Tithebarn survey, we estimate that approximately 90 per cent of the comparison goods turnover of Blackburn Town Centre is derived from residents of these 11 zones.

Blackburn with Darwen Retail Capacity Study
Final Report | June 2011 20
4.4 The comparison shopping catchment area (CpCA) for this study – as shown in Figure 4.2 below – therefore comprises 11 of the 48 zones defined for the sub-regional survey (Zones 23 to 29 and Zones 37 to 40), which cover the administrative area of Blackburn with Darwen, but also extend into the administrative areas of Ribble Valley, Chorley, South Ribble, Hyndburn, Burnley and Bolton. However, we have renamed the CpCA zones as Zones 1 to 11 for the purposes of this study. The CpCA zones are based on postcode sector boundaries as listed in Spreadsheet 1a in Volume 213.
Figure 4.2 Comparison Shopping Catchment Area and Study Zones for the Current Study
13 All subsequent references to spreadsheets in the remainder of our report relate to the spreadsheets presented in Volume 2

Blackburn with Darwen Retail Capacity Study
Final Report | June 2011 21
4.5 Our assessment of current patterns of comparison retail spending is therefore based on a survey of 1,171 households undertaken in January and February 2010 as part of the wider survey of the central Lancashire sub-region. A minimum of 100 interviews were completed in each zone and the results of the survey were weighted according to the actual population in each zone.
4.6 The survey questionnaire (reproduced in Volume 2), seeks to establish patterns of comparison goods shopping based on the locations of the last two purchases of:
clothes and shoes; furniture, carpets and soft household furnishings; DIY, decorating or gardening items; electrical items; health beauty or chemist items; recreational goods; and other non-food items such as books or CDs.
4.7 The survey questionnaire (questions 2 to 4) was designed to reduce the risk inherent in households surveys of the over recording of comparison goods expenditure at the higher order centres, and under recording of non-bulky comparison expenditure at retail parks and large food superstores. Thus, respondents were asked whether, in undertaking their last main food and grocery shop, they also made purchases of clothes or shoes, or electrical items, or health and beauty products, or non-food items such as books, CDs, jewellery and so on. They were then asked a similar question in respect of their last visit to a retail park.
4.8 The household survey questionnaire of January and February 2010 also sought to identify patterns of spending on leisure services and cultural activities (question 21), based on the locations where households spend the most money on:
restaurants / cafés; pubs / bars / nightclubs; cinema; museums / art galleries; family entertainment centres, such as ten pin bowling / skating; health and fitness; bingo / casino / bookmaker; and theatre / concerts.
4.9 The composite patterns of spending for comparison goods was calculated on the basis of PBBI expenditure data in relation to the seven aforementioned categories of spend, as shown in Table 4.1.

Blackburn with Darwen Retail Capacity Study
Final Report | June 2011 22
Table 4.1 Composite Patterns of Comparison Goods Spend Percentage Weighting
Clothing and footwear 25.61%
Furniture, carpets and soft furnishings 14.07%
DIY and decorating goods 8.23%
Electrical Goods 15.64%
Health beauty and chemist items 12.51%
Recreational goods 14.37%
Other non-food items 9.57%
All Comparison Goods 100%
Convenience Goods Household Survey Methodology and Catchment Area
4.10 Whilst the Tithebarn survey also asked respondents a limited number of questions on their main food shopping habits, the survey did not seek to comprehensively establish patterns of convenience goods spending across the central Lancashire sub-region. Blackburn with Darwen Borough Council therefore decided to commission a new household survey to provide comprehensive and up-to-date evidence of local convenience shopping patterns to inform the present study.
4.11 Accordingly, our assessment of local patterns of convenience retail spending, as set out in this section of our report, is based on a new telephone survey of 1,201 households undertaken by NEMS Market Research in February and March 2011. As a consequence of the household survey for comparison goods being undertaken in 2010, and the household survey for convenience goods being commissioned in 2011, we necessarily have different base dates for our assessment of quantitative need. Thus, we have a base date of 2010 for our assessment of capacity in the comparison sector and we have a 2011 base date for our assessment of capacity in the convenience sector.
4.12 The convenience shopping catchment area (CvCA) for the new survey in shown in Figure 4.3. Data from the Tithebarn survey indicated that convenience retail spending is more geographically focused than comparison spending and the CvCA is therefore smaller than the CpCa – the catchment area defined for comparison retail spending. The CvCA is disaggregated into ten zones, based on postcode sector boundaries, as listed in Spreadsheet 10a in Volume 2.

Blackburn with Darwen Retail Capacity Study
Final Report | June 2011 23
Figure 4.3 Convenience Shopping Catchment Area and Study Zones for the Current Study
4.13 We ensured that there was a minimum of 100 completed interviews in each zone and the results of the survey were weighted according to the actual population in each zone.
4.14 The questionnaire (reproduced in Appendix 4) was designed to seek to reduce the problem inherent in household surveys of over-recording of the turnover of the largest foodstores, and under-recording of the turnover of the smaller foodstores and local shops within

Blackburn with Darwen Retail Capacity Study
Final Report | June 2011 24
centres. Thus, the survey asks questions about the frequency of visit and amount of spend on three categories of spending - ‘main food’, ‘top-up’ food and small shops - and the results are weighted accordingly. The benefit of this approach is that some residents will make several visits per week to a small convenience store, perhaps spending little on each occasion, so that if the results are weighted according to frequency of visit and amount spent, the importance of small shops to these residents is better reflected.
4.15 Thus, the weighting for ‘main food’, ‘top-up’ food and small convenience shopping, based on amount spent and frequency of visit, is as follows:
Table 4.2 Composite Patterns of Convenience Goods Spend Mean Weekly
Household Spend Percentage Weighting
Main Food £68.50 73.6%
Top-up Food £21.08 22.7%
Small Shops Food/Groceries £3.43 3.7%
All Convenience Goods £93.01 100.0%
Comparison Goods Spending Patterns in 2010 4.16 The population of the CpCA in 2010, disaggregated by zone, is shown in the second row of
figures in Spreadsheet 2a in Volume 2. The overall population in the 2010 base year amounts to approximately 308,600 persons, which is derived by applying the ONS’s 2008-based Local Authority Population Projections to the mid-year 2008 zonal estimates provided by MapInfo/Oxford Economics.
4.17 Spreadsheet 3a shows that the highest levels of per capita expenditure in the CpCA are those areas in the Boroughs of Ribble Valley and Chorley and in the Egerton area of Blackburn with Darwen (Zones 1, 2 7 and 10), all of which are close to or exceed the UK average. Per capita expenditure in all other zones falls some way short of the UK average, with the lowest levels in central Blackburn and in Accrington (Zones 3, 5 and 11).
4.18 The total amount of comparison goods spending for residents of the whole of the CpCA in 2010 is £861.4m (Spreadsheet 4a), of which £73.1m, or 8.5 per cent, is spent on SFT (catalogue, TV and internet shopping), according to the household survey.
4.19 Spreadsheet 5a shows the market shares each zone of the CpCA achieves of the total spend on comparison goods by residents of each zone within the CpCA. Blackburn Town Centre’s comparison goods market share is highest in Zone 3 (42.0 per cent), Zone 5 (36.2 per cent) and Zone 4 (28.7 per cent), while Darwen Town Centre’s market share is highest in Zone 6 (15.0 per cent) and it has negligible market share in all other zones. These figures are discussed in further detail below.
4.20 Table 4.3, which is derived from the final column of Spreadsheet 6a, summarises the main broad destinations for comparison goods expenditure within and outside the CpCA. Blackburn Town Centre and the four retail parks immediately to the south of the town (Nova Scotia, Grimshaw Park, Townsmoor and Lower Audley Street) collectively account for 32.1

Blackburn with Darwen Retail Capacity Study
Final Report | June 2011 25
per cent of the available spend on comparison goods from residents of the CpCA, or £276.8m. Other town centres, retail parks (including the Peel Centre in Hyndburn) and freestanding stores located within the CpCA account for a further £222.0m of comparison goods expenditure (25.7 per cent). Thus, overall, some 57.9 per cent of expenditure on comparison goods available to the CpCA’s residents is spent at existing retail facilities within the CpCA. This is known as the aggregate retention rate.
4.21 We consider that 57.9 per cent is a reasonably good level of retention for the Blackburn with Darwen CpCA, given the number of competing centres that are outside of, but close to the CpCA. Nevertheless, survey was carried out prior to the expansion of The Mall in Blackburn Town Centre, and the retention level may have increased as a result of this. We cover this issue in more detail in Section 5.
4.22 Table 4.3 shows that just over 42 per cent of the comparison goods expenditure available to CpCA residents is lost as ‘leakage’. In addition to the 8.5 per cent that is spent on SFT, some 33.6 per cent of comparison goods expenditure flows to destinations outside the CpCA. The main destination for this expenditure are Preston City Centre and Deepdale Retail Park, which collectively account for just over 10 per cent of the comparison goods expenditure available to residents of the CpCA.
Table 4.3 Broad Destinations for Comparison Goods Expenditure
Broad Destinations for Comparison Goods Expenditure £m %
Blackburn Town Centre and Inner Blackburn Retail Parks 276.8 32.1
Other destinations within the CpCA 222.0 25.7
Total Retained Expenditure 498.8 57.9
Preston City Centre and Deepdale Retail Park 89.4 10.4
Other locations outwith the CpCA 200.2 23.3
SFT 73.1 8.5
Total Leakage 362.6 42.1
TOTAL 861.4 100.0
4.23 The market shares and estimated comparison goods turnovers of the main centres and retail parks/freestanding stores within the CpCA, prior to making any allowance for any expenditure inflow from those who are resident beyond the CpCA, are set out in the last two columns of Spreadsheet 6 and are summarised in Table 4.4 and illustrated in Figure 4.4.

Blackburn with Darwen Retail Capacity Study
Final Report | June 2011 26
Table 4.4 Comparison Goods Expenditure Retained Within the CpCA
Town Centres Within the CpCA £m %
Blackburn Town Centre 177.0 20.5
Accrington Town Centre 78.3 9.1
Clitheroe Town Centre 45.8 5.3
Darwen Town Centre 15.7 1.8
Retail Parks and Freestanding Stores Within the CpCA £m %
Inner Blackburn Retail Parks (Nova Scotia, Grimshaw Park, Townsmoor, Lower Audley Street) 99.9 11.6
Peel Centre, Hyndburn 40.4 4.7
Asda, Hyndburn Road, Accrington 18.0 2.1
Figure 4.4 Location of Leading Comparison Goods Destinations Within the CpCA
4.24

Blackburn with Darwen Retail Capacity Study
Final Report | June 2011 27
4.25 Table 4.4 confirms that Blackburn Town Centre is the main comparison shopping destination in the CpCA, with a comparison goods turnover – derived from catchment area residents – of £177.0m, and a market share of 20.5 per cent. Taken collectively, the four retail parks to the south of Blackburn Town Centre achieve the second-highest market share for comparison shopping, with a combined turnover of approximately £99.9m (11.6 per cent of expenditure from the CpCA). Accrington Town Centre is also a significant destination, attracting £78.3m of comparison expenditure from residents of the CpCA. This destination is on the edge of the CpCA, and it is likely that Accrington Town Centre also attracts a significant amount of expenditure from residents outwith the CpCA.
4.26 The only other destinations in the CpCA which achieve comparison retail turnovers in excess of £15m from residents of the CpCA are Clitheroe Town Centre (£45.8m), the Peel Centre (£40.4m), Asda on Hyndburn Road in Accrington (£18.0m) and Darwen Town Centre (£15.7m). The latter figure confirms that Darwen Town Centre is much less significant than Blackburn Town Centre in comparison retail terms.
4.27 The main destinations for expenditure leakage, again as shown in the last two columns of Spreadsheet 6a, are summarised in Table 4.5. There are four principal destinations for comparison goods expenditure leakage which, in order of importance, are Preston City Centre, Bolton Town Centre, Deepdale Retail Park and Manchester City Centre. Each of these centres attracts more comparison retail expenditure from residents of the CpCA than Darwen Town Centre does.
Table 4.5 Main Destinations for Comparison Goods Expenditure Leakage
Town/City Centres Outside the CpCA £m %
Preston City Centre 59.7 6.9
Bolton Town Centre 33.6 3.9
Manchester City Centre 26.3 3.1
Burnley Town Centre 13.5 1.6
Chorley Town Centre 10.4 1.2
Blackpool Town Centre 6.1 0.7
Retail Parks and Freestanding Stores Outside the CpCA £m %
Deepdale Retail Park 29.7 3.5
Trafford Centre, Manchester 18.4 2.1
Middlebrook Retail Park, Horwich 11.3 1.3
Capitol Centre, Walton‐le‐Dale 6.3 0.7
4.28 The localised retention rate – which is the proportion of expenditure on comparison goods available to residents in a specific zone that is spent in town centres and stores located within that zone – is highest for Zone 3, which contains Blackburn Town Centre (see Spreadsheet 5a, ‘Zone 3’ column and ‘Total Zone 3’ row) and Zone 11, which includes Accrington Town Centre, at 52.5 per cent and 46.8 per cent, respectively. The next highest localised retention rates for comparison goods are for Zone 1 (37.1 per cent), and Zone 5

Blackburn with Darwen Retail Capacity Study
Final Report | June 2011 28
(23.6 per cent). All of the remaining localised retention rates are below 15 per cent, indicating that there is a relatively broad dispersal of comparison shopping patterns around the CpCA.
Comparison Goods Market Shares
4.29 Below, we provide an analysis of the comparison goods market shares achieved by the two defined Town Centres in the Borough of Blackburn with Darwen. We also briefly examine a number of other significant centres both within and outwith the CpCA.
Blackburn Town Centre
4.30 Blackburn Town Centre achieves a comparison goods market share of 42.0 per cent in its own zone (Zone 3), and also achieves comparatively high market shares in four other zones close to the Town Centre: 19.9 per cent in Zone 2; 28.7 per cent in Zone 4; 36.2 per cent in Zone 5; and 22.4 per cent in Zone 6. Conversely, market share is particularly low in Zones 7 (3.1 per cent) and Zone 10 (2.0 per cent). The centres of population in Zone 10 are significantly closer to Bolton than Blackburn, so it is unsurprising that Bolton proves a much greater draw. However, Zone 7 is roughly equidistant between Preston, Blackburn and Chorley, and it is notable that these other two centres clearly constitute a much greater draw than Blackburn, attracting 19.5 per cent and 19.0 per cent respectively of the comparison expenditure for the population of that zone. However, the household survey was undertaken prior to the expansion of The Mall in Blackburn Town Centre which will inevitably go some way to addressing this imbalance.
4.31 An important point to note is that the zones from which Blackburn Town Centre achieves its highest market share tend to be those with the lowest levels of per capita expenditure. This suggests that higher spending consumers may be being drawn to other centres, in particular Preston.
Darwen Town Centre
4.32 Darwen Town Centre achieves its highest comparison goods market share of 15.0 per cent in its own zone (Zone 6). In no other zone does the proportion of expenditure spent in Darwen Town Centre exceed 1 per cent. Furthermore, even in Zone 6, expenditure in Darwen Town Centre on comparison goods is lower than the amount that is attracted to Blackburn Town Centre. This evidence confirms that Darwen is not a particularly significant centre of comparison goods retailing.
Accrington Town Centre
4.33 Accrington Town Centre achieves a comparison goods market share of 34.4 per cent in its own zone (Zone 11), and it also attracts significant proportions of the expenditure from Zone 8 (28.5 per cent) and Zone 9 (10.6 per cent), but much lower expenditure from elsewhere in the CpCA.
Clitheroe Town Centre
4.34 Clitheroe Town Centre achieves a comparison goods market share of 37.0 per cent in its own zone (Zone 1), and also attracts a significant proportion of the spend from Zone 9 (13.0 per cent).

Blackburn with Darwen Retail Capacity Study
Final Report | June 2011 29
Preston City Centre and Deepdale Retail Park
4.35 Preston City Centre and Deepdale Retail Park (also in Preston) attract an appreciable share of the expenditure on comparison goods from most zones of the CpCA, with the two destinations together accounting for more than 4 per cent of the expenditure from all zones except Zone 10. The market shares are highest from Zone 2, where 14.9 per cent of expenditure flows to Preston City Centre and a further 11.1 per cent flows to Deepdale Retail Park. It is also notable that almost 15 per cent of the expenditure of Zone 4 flows to either Preston City Centre or Deepdale Retail Park despite this zone lying almost entirely within the Borough of Blackburn with Darwen.
Bolton Town Centre
4.36 Bolton Town Centre achieves a market share of 47.3 per cent for expenditure on comparison goods in Zone 10, where a significant proportion of the population falls within the Borough of Bolton. Some 7.5 per cent of the expenditure from residents of Zone 6 also flows to Bolton Town Centre, but elsewhere within the CpCA, Bolton Town Centre does not achieve a market share above 2 per cent.
Overlapping Comparison Goods Catchments
4.37 Table 4.6 presents an analysis of ‘dominant’ centres/out-of-centre retail parks – defined for this exercise as instances where the comparison goods market share exceeds 20 per cent – and centres of ‘subsidiary’ influence, which are defined on the basis of having comparison goods market shares of between 10 per cent and 20 per cent. Table 4.6 reveals that:
i Blackburn Town Centre is the dominant comparison shopping destination in five zones, and has a subsidiary influence in a further four zones.
ii Clitheroe Town Centre is the dominant centre in its own zone, and has a subsidiary influence in one other zone.
iii Accrington Town Centre is the dominant centre in two zones and has a subsidiary influence in one other zone.
iv Darwen Town Centre is not the dominant centre in any zones, but has a subsidiary influence in its own zone.
v Bolton Town Centre is the dominant centre in one zone. vi Preston City Centre is not the dominant centre in any zone, but exerts a significant
influence in Zones 2 and 7. Deepdale Retail Park also has a significant influence in Zone 2.
vii In six of the 11 zones, there is one dominant centre and at least one other significant centre. In a further two zones, there is no dominant centre and a number of significant centres compete for the available expenditure. There are only three zones in which there is one dominant centre and no other significant centre. Competition for market share across the CpCA is therefore intense, with Blackburn and Darwen Town Centres having to vie with a number of competing centres including Preston, Accrington, Clitheroe, Chorley and Bolton.

Blackburn with Darwen Retail Capacity Study
Final Report | June 2011 30
Table 4.6 Dominant Comparison Goods Centres/Retail Parks and Centres/Retail Parks of Subsidiary Influence
Zone Dominant Centres/Retail Parks
(Market Share 20%+)
Other Centres/Retail Parks of Significant Influence
(Market Share 10% to 20%)
1 Clitheroe Town Centre Blackburn Town Centre
2 Blackburn Town Centre Preston City Centre, Deepdale Retail Park
3 Blackburn Town Centre
4 Blackburn Town Centre Preston City Centre
5 Blackburn Town Centre
6 Blackburn Town Centre Darwen Town Centre
7 Preston City Centre, Chorley Town Centre
8 Accrington Town Centre Blackburn Town Centre
9 Blackburn Town Centre, Clitheroe Town Centre, Accrington Town Centre
10 Bolton Town Centre
11 Accrington Town Centre Blackburn Town Centre
Comparison Goods Sub-Sectors
4.38 The patterns of spend across the various sub-sectors of comparison goods in the CpCA are set out in Spreadsheet 7a. Briefly, these are as follows:
clothes and shoes, which account for £225m of the comparison goods spending of the CpCA’s residents;
furniture, carpets, and soft household furnishings, which account for £95m; DIY and decorating goods, which account for £91m; electrical items and domestic appliances, which account for £135m; health, beauty and chemist items, which account for £106m; recreational goods (for example, sports equipment and musical instruments), which
account for £132m; and specialist/other comparison items (for example, books, CDs, jewellery, glass and china
items), which account for £78m of the comparison goods expenditure available to residents of the catchment area. The main findings are set out below.
4.39 In Spreadsheets 8a(i) and 8a(ii), we further analyse the patterns of spend in the clothes and shoes sub-sector, as the health of this sub-sector is the most significant element in the overall offer of a town centre.
Clothes and shoes
4.40 Overall, 48.6 per cent of the expenditure on clothes and shoes available to the CpCA’s residents is spent in town centres, retail parks and in freestanding stores which are located within the catchment area (see final column of Spreadsheet 8a(ii)); this is a relatively low retention level for basic comparison needs.

Blackburn with Darwen Retail Capacity Study
Final Report | June 2011 31
4.41 By far the most significant element of the expenditure retained by the CpCA is that spent in Blackburn Town Centre and adjacent retail parks, which account for £69.7m of the £109.2m of clothes and shoes expenditure that is retained in the CpCA (equating to a market share of 31.0 per cent). Accrington and Clitheroe Town Centres are also significant destinations, as shown in Table 4.7 below. Darwen Town Centre, however, has a very low level of spending on clothes and shoes, attracting only £2.5m (1.1 per cent) of expenditure from the residents of the CpCA.
4.42 Nevertheless, although Blackburn Town Centre achieves the highest market share for clothes and shoes, we consider that its market share is still notably low for a centre of Blackburn’s size and status. Indeed, a strong clothes and shoes offer serves as the foundation for an attractive comparison retail offer, and is vital in attracting the expenditure of residents. We expect, however, that the expansion of The Mall in Blackburn Town Centre and the associated enhancement of the clothes and shoes offer in the town will have gone some way to improving the town centre’s market share.
Table 4.7 Main Destinations for Clothes and Shoes within the CpCA
Destination Clothes & Shoes Expenditure (£m)
Market Share (%)
Blackburn Town Centre and Inner Blackburn Retail Parks 69.7 31.0
Accrington Town Centre 19.2 8.6
Clitheroe Town Centre 7.0 3.1
4.43 The main leakage destinations for clothes and shoes expenditure are Preston City Centre and Manchester City Centre, as shown in Table 4.8.
Table 4.8 Leakage Destinations for Clothes and Shoes
Destination Clothes & Shoes Expenditure (£m)
Market Share (%)
Preston City Centre 22.0 9.8
Manchester City Centre 14.7 6.5
Trafford Centre, Manchester 11.7 5.2
Bolton Town Centre 9.7 4.3
Deepdale Retail park 8.9 4.0
Convenience Goods Spending Patterns in 2011 4.44 The population of Blackburn with Darwen’s convenience catchment area (CvCA) in 2011,
disaggregated by zone, is shown in the second row of figures in Spreadsheet 11a in Volume 2. The overall population in the 2011 base year amounts to approximately 217,000 persons, which is derived by applying the ONS 2008-based Sub-National Population Projections for Local Authorities to the mid-year 2008 zonal estimates provided by MapInfo/Oxford Economics.

Blackburn with Darwen Retail Capacity Study
Final Report | June 2011 32
4.45 Spreadsheet 12a shows that all of the ten convenience survey zones in the CvCA have convenience goods spending levels below the UK average, of £1,579 per capita in 2011, with the exception of Zone 1 (£1,607 per capita). The total amount of convenience goods spending for residents of the CvCA in 2011 is £307.7m (Spreadsheet 13a). The pattern of expenditure flows for the convenience goods sector as a whole, as revealed by the new survey of households, is set out in Spreadsheets 14a and 15a.
4.46 Table 4.9 – which is derived from the final column of Spreadsheet 15a – reveals that, overall, some £278.4m, or 90.5 per cent, of the expenditure on convenience goods available to residents of the CvCA is spent at locations within the convenience catchment area. A further 8.1 per cent of convenience expenditure (equating to £25.0m) flows to convenience retail facilities located outside of the CvCA, with the remaining 1.4 per cent (£4.3m) accounted for by SFT14
Table 4.9 Broad Destinations for Convenience Goods Expenditure
Broad Destination for Convenience Goods Expenditure £m %
Destinations within the CvCA 278.4 90.5%
Total Retained Expenditure 278.4 90.5%
Destinations outside the CvCA 25.0 8.1%
SFT 4.3 1.4%
Total Leakage 29.3 9.5%
OVERALL TOTAL 307.7 100.0%
Main Destinations for Food and Grocery Shopping
4.47 The estimated convenience goods turnovers of the main foodstores located within the study area, prior to making any allowance for any expenditure inflow from those who are resident beyond the CvCA, are set out in the penultimate column of Spreadsheet 15a, and are summarised in Table 4.10 and illustrated in Figure 4.5.
14 In Section 5 of this report we set out in more detail the allowances we have made to account for SFT in 2011 and in each of the forecast years.

Blackburn with Darwen Retail Capacity Study
Final Report | June 2011 33
Table 4.10 Main Destinations for Convenience Goods Expenditure Retained within the CvCA
Foodstores/Centres within the CvCA
Convenience Goods
Expenditure Retained within the CvCA (£m)
Market Share
(%)
Asda, Grimshaw Park Retail Park, Blackburn 50.1 16.3%
Morrisons, Railway Road, Blackburn Town Centre 40.6 13.2%
Asda, Hyndburn Road, Accrington 33.3 10.8%
Tesco, Hill Street, Blackburn 30.4 9.9%
Sainsbury's, Hardman Way, Darwen Town Centre 17.4 5.6%
Morrisons, Queen Street, Great Harwood Town Centre 13.5 4.4%
Tesco Extra, Eagle Street, Accrington Town Centre 9.9 3.2%
Aldi, Bolton Road, Blackburn 6.0 1.9%
Tesco Metro, The Mall, Blackburn Town Centre 5.4 1.7%
Figure 4.5 Location of Leading Convenience Goods Destinations within the CvCA
4.48
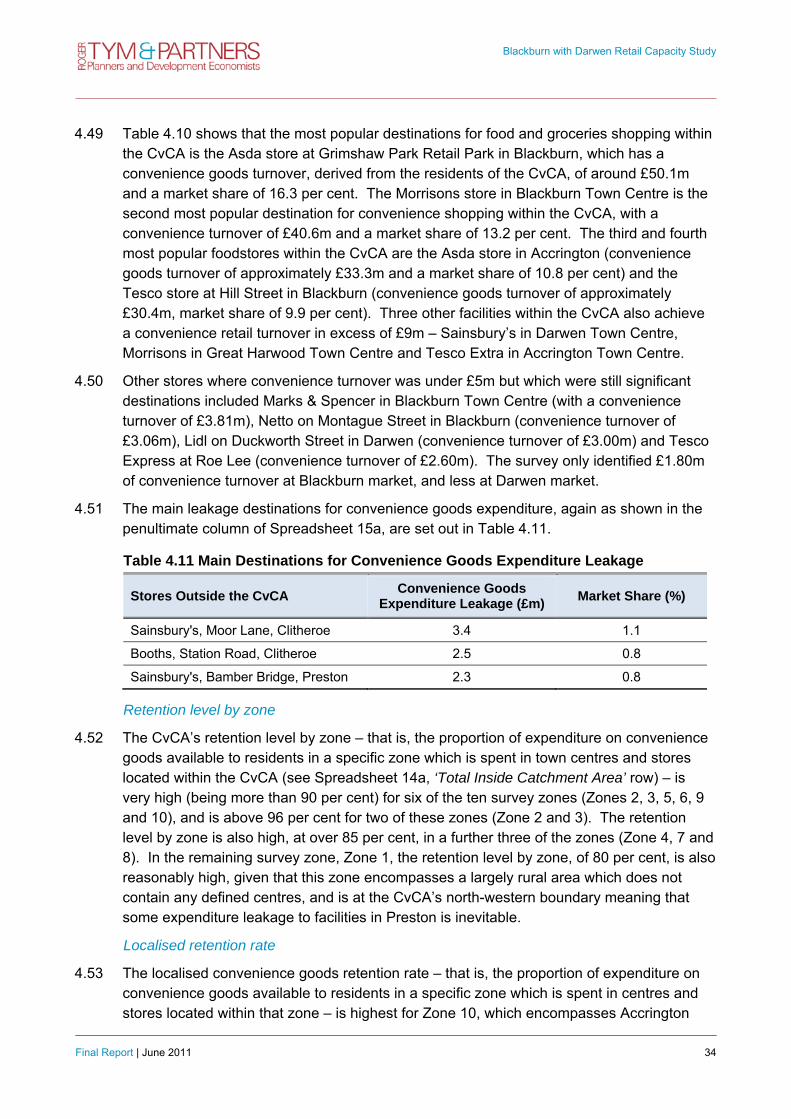
Blackburn with Darwen Retail Capacity Study
Final Report | June 2011 34
4.49 Table 4.10 shows that the most popular destinations for food and groceries shopping within the CvCA is the Asda store at Grimshaw Park Retail Park in Blackburn, which has a convenience goods turnover, derived from the residents of the CvCA, of around £50.1m and a market share of 16.3 per cent. The Morrisons store in Blackburn Town Centre is the second most popular destination for convenience shopping within the CvCA, with a convenience turnover of £40.6m and a market share of 13.2 per cent. The third and fourth most popular foodstores within the CvCA are the Asda store in Accrington (convenience goods turnover of approximately £33.3m and a market share of 10.8 per cent) and the Tesco store at Hill Street in Blackburn (convenience goods turnover of approximately £30.4m, market share of 9.9 per cent). Three other facilities within the CvCA also achieve a convenience retail turnover in excess of £9m – Sainsbury’s in Darwen Town Centre, Morrisons in Great Harwood Town Centre and Tesco Extra in Accrington Town Centre.
4.50 Other stores where convenience turnover was under £5m but which were still significant destinations included Marks & Spencer in Blackburn Town Centre (with a convenience turnover of £3.81m), Netto on Montague Street in Blackburn (convenience turnover of £3.06m), Lidl on Duckworth Street in Darwen (convenience turnover of £3.00m) and Tesco Express at Roe Lee (convenience turnover of £2.60m). The survey only identified £1.80m of convenience turnover at Blackburn market, and less at Darwen market.
4.51 The main leakage destinations for convenience goods expenditure, again as shown in the penultimate column of Spreadsheet 15a, are set out in Table 4.11.
Table 4.11 Main Destinations for Convenience Goods Expenditure Leakage
Stores Outside the CvCA Convenience Goods Expenditure Leakage (£m) Market Share (%)
Sainsbury's, Moor Lane, Clitheroe 3.4 1.1
Booths, Station Road, Clitheroe 2.5 0.8
Sainsbury's, Bamber Bridge, Preston 2.3 0.8
Retention level by zone
4.52 The CvCA’s retention level by zone – that is, the proportion of expenditure on convenience goods available to residents in a specific zone which is spent in town centres and stores located within the CvCA (see Spreadsheet 14a, ‘Total Inside Catchment Area’ row) – is very high (being more than 90 per cent) for six of the ten survey zones (Zones 2, 3, 5, 6, 9 and 10), and is above 96 per cent for two of these zones (Zone 2 and 3). The retention level by zone is also high, at over 85 per cent, in a further three of the zones (Zone 4, 7 and 8). In the remaining survey zone, Zone 1, the retention level by zone, of 80 per cent, is also reasonably high, given that this zone encompasses a largely rural area which does not contain any defined centres, and is at the CvCA’s north-western boundary meaning that some expenditure leakage to facilities in Preston is inevitable.
Localised retention rate
4.53 The localised convenience goods retention rate – that is, the proportion of expenditure on convenience goods available to residents in a specific zone which is spent in centres and stores located within that zone – is highest for Zone 10, which encompasses Accrington

Blackburn with Darwen Retail Capacity Study
Final Report | June 2011 35
and Oswaldwistle Town Centres, and has a localised retention rate of 81.7 per cent (see Spreadsheet 14a, ‘Zone 10’ column and ‘Total Zone 10’ row, and Table 4.12). The next highest localised retention rate for convenience goods is achieved by Zone 3, which encompasses Blackburn Town Centre and has a localised retention rate of 73.3 per cent.
4.54 The localised retention rates in Zones 5, 7 and 9 are more modest at 42.8 per cent, 42.1 per cent and 37.3 per cent, respectively. Many of the residents of Zone 5 undertake their food and grocery shopping at the Morrisons store in Blackburn Town Centre in neighbouring Zone 3, and at other stores in Blackburn Town Centre, whilst many residents of Zone 7, which encompasses Darwen Town Centre, choose to travel to the larger Asda store in Blackburn (Zone 5) to meet their convenience shopping needs. Similarly, many of the residents of Zone 9 travel to the Asda and Tesco Extra stores in neighbouring Zone 10.
4.55 The localised retention rate in Zone 6 is relatively low at 20.1 per cent. Zone 6 encompasses part of Blackburn’s urban area to the south-west of the town centre, which contains two defined major neighbourhood centres (Ewood and Mill Hill). Whilst Ewood contains an Aldi supermarket and an Iceland store, the survey findings indicate that residents of Zone 6 primarily travel to larger foodstores in nearby zones – the Asda store at Grimshaw Park Retail Park in Blackburn and the Morrisons store in Blackburn Town Centre – to meet their convenience shopping needs.
4.56 There are four zones where the localised retention rate is particularly low. These are Zones 1, 2, 4 and 8, where the localised retention rates are 10.8 per cent, 5.0 per cent, 8.7 per cent and 0.8 per cent, respectively. However, all four of these zones encompass largely rural areas and contain no town centres, although Zone 4 contains a neighbourhood centre at New Bank Road.
4.57 The survey findings reveal that residents of Zone 1 primarily shop at Asda at Grimshaw Park Retail Park in Blackburn, as well as Morrisons in Blackburn Town Centre and the Tesco store at Hill Street, also in Blackburn. Residents of Zones 2 and 4, which similarly encompass parts of Blackburn’s urban area and outlying rural areas, also primarily travel to stores in and near to Blackburn Town Centre for their food and grocery shopping. The majority of residents of Zone 8 travel to Darwen Town Centre just north of Zone 8 to undertake their food and grocery shopping, as well as to the Asda and other stores in Blackburn, which are located within easy travelling distance of Zone 8.
4.58 Overall, it is evident from the survey findings that there are no zones with an acute deficiency in convenience retail provision. Whilst the convenience provision in Zones 1, 2, 4 and 8 is limited, there are no defined centres located within any of these zones and residents are served by existing stores in Blackburn and Darwen Town Centres and other locations nearby.
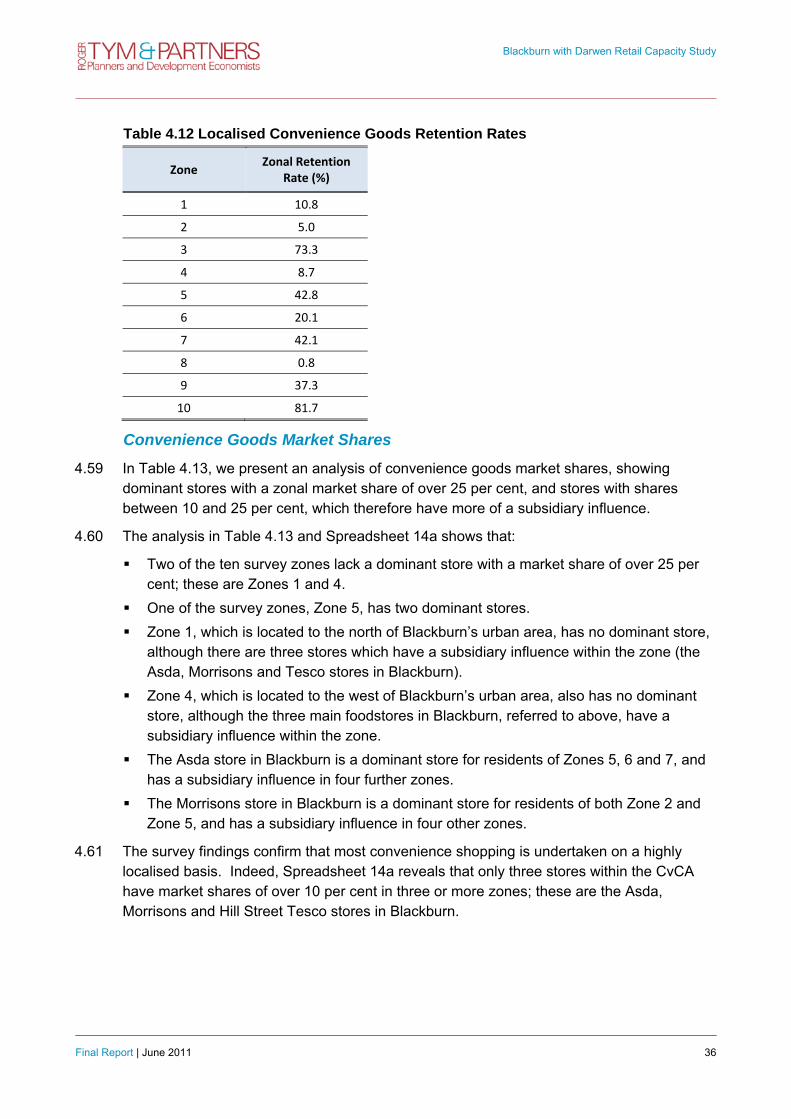
Blackburn with Darwen Retail Capacity Study
Final Report | June 2011 36
Table 4.12 Localised Convenience Goods Retention Rates
Zone Zonal Retention
Rate (%)
1 10.8
2 5.0
3 73.3
4 8.7
5 42.8
6 20.1
7 42.1
8 0.8
9 37.3
10 81.7
Convenience Goods Market Shares
4.59 In Table 4.13, we present an analysis of convenience goods market shares, showing dominant stores with a zonal market share of over 25 per cent, and stores with shares between 10 and 25 per cent, which therefore have more of a subsidiary influence.
4.60 The analysis in Table 4.13 and Spreadsheet 14a shows that:
Two of the ten survey zones lack a dominant store with a market share of over 25 per cent; these are Zones 1 and 4.
One of the survey zones, Zone 5, has two dominant stores. Zone 1, which is located to the north of Blackburn’s urban area, has no dominant store,
although there are three stores which have a subsidiary influence within the zone (the Asda, Morrisons and Tesco stores in Blackburn).
Zone 4, which is located to the west of Blackburn’s urban area, also has no dominant store, although the three main foodstores in Blackburn, referred to above, have a subsidiary influence within the zone.
The Asda store in Blackburn is a dominant store for residents of Zones 5, 6 and 7, and has a subsidiary influence in four further zones.
The Morrisons store in Blackburn is a dominant store for residents of both Zone 2 and Zone 5, and has a subsidiary influence in four other zones.
4.61 The survey findings confirm that most convenience shopping is undertaken on a highly localised basis. Indeed, Spreadsheet 14a reveals that only three stores within the CvCA have market shares of over 10 per cent in three or more zones; these are the Asda, Morrisons and Hill Street Tesco stores in Blackburn.
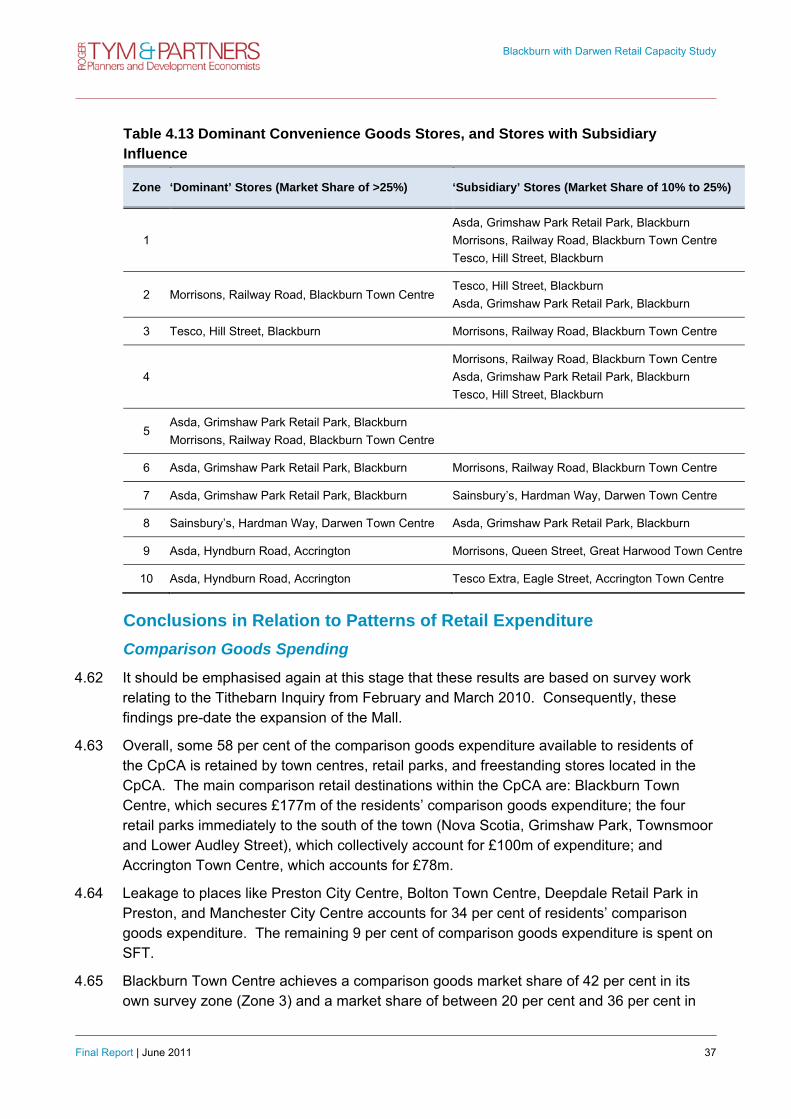
Blackburn with Darwen Retail Capacity Study
Final Report | June 2011 37
Table 4.13 Dominant Convenience Goods Stores, and Stores with Subsidiary Influence
Zone ‘Dominant’ Stores (Market Share of >25%) ‘Subsidiary’ Stores (Market Share of 10% to 25%)
1 Asda, Grimshaw Park Retail Park, Blackburn Morrisons, Railway Road, Blackburn Town Centre Tesco, Hill Street, Blackburn
2 Morrisons, Railway Road, Blackburn Town Centre Tesco, Hill Street, Blackburn Asda, Grimshaw Park Retail Park, Blackburn
3 Tesco, Hill Street, Blackburn Morrisons, Railway Road, Blackburn Town Centre
4 Morrisons, Railway Road, Blackburn Town Centre Asda, Grimshaw Park Retail Park, Blackburn Tesco, Hill Street, Blackburn
5 Asda, Grimshaw Park Retail Park, Blackburn Morrisons, Railway Road, Blackburn Town Centre
6 Asda, Grimshaw Park Retail Park, Blackburn Morrisons, Railway Road, Blackburn Town Centre
7 Asda, Grimshaw Park Retail Park, Blackburn Sainsbury’s, Hardman Way, Darwen Town Centre
8 Sainsbury’s, Hardman Way, Darwen Town Centre Asda, Grimshaw Park Retail Park, Blackburn
9 Asda, Hyndburn Road, Accrington Morrisons, Queen Street, Great Harwood Town Centre
10 Asda, Hyndburn Road, Accrington Tesco Extra, Eagle Street, Accrington Town Centre
Conclusions in Relation to Patterns of Retail Expenditure Comparison Goods Spending
4.62 It should be emphasised again at this stage that these results are based on survey work relating to the Tithebarn Inquiry from February and March 2010. Consequently, these findings pre-date the expansion of the Mall.
4.63 Overall, some 58 per cent of the comparison goods expenditure available to residents of the CpCA is retained by town centres, retail parks, and freestanding stores located in the CpCA. The main comparison retail destinations within the CpCA are: Blackburn Town Centre, which secures £177m of the residents’ comparison goods expenditure; the four retail parks immediately to the south of the town (Nova Scotia, Grimshaw Park, Townsmoor and Lower Audley Street), which collectively account for £100m of expenditure; and Accrington Town Centre, which accounts for £78m.
4.64 Leakage to places like Preston City Centre, Bolton Town Centre, Deepdale Retail Park in Preston, and Manchester City Centre accounts for 34 per cent of residents’ comparison goods expenditure. The remaining 9 per cent of comparison goods expenditure is spent on SFT.
4.65 Blackburn Town Centre achieves a comparison goods market share of 42 per cent in its own survey zone (Zone 3) and a market share of between 20 per cent and 36 per cent in
Blackburn with Darwen Retail Capacity Study
Final Report | June 2011 38
Zones 2, 4, 5 and 6 (see Table 4.12). In a further four zones (Zones 1, 8, 9 and 11), Blackburn Town Centre achieves a market share of between 10 and 17 per cent, although the market share for the town centre is 3 per cent or less in the remaining two survey zones.
4.66 Darwen Town Centre’s comparison goods market share reaches a maximum of 15 per cent in own zone (Zone 6), but does not exceed 1 per cent in any of the other survey zones.
4.67 The overall retention rate for spending on clothes and shoes within the CpCA is relatively low, at 49 per cent. This suggests the need to promote quality developments in town centre locations, targeted at higher value comparison retailers. The expansion of The Mall in Blackburn Town Centre is likely to have gone some way towards addressing this.
Convenience Goods Spending
4.68 The retention of convenience goods expenditure by centres and freestanding stores located within the CvCA is 90.5 per cent, which is high as expected, given the more localised nature of convenience goods spending. The most popular destinations are the food superstores. Indeed, Asda at Grimshaw Park Retail Park in Blackburn, Morrisons in Blackburn Town Centre, Asda in Accrington and Tesco at Hill Street in Blackburn have a collective convenience goods market share of just over 50 per cent.
4.69 There are no parts of the catchment area where there is an acute localised deficiency in convenience goods provision. Residents located in more rural areas to the north, south and west of the Borough of Blackburn and Darwen are served by a more limited local food and grocery offer and are required to travel for their food and grocery shopping. Nevertheless, there are no centres located within these areas, and the residents of these zones are already well served by the existing convenience provision in the immediate surrounding areas.
Blackburn with Darwen Retail Capacity Study
Final Report | June 2011 39
5 ASSESSMENT OF QUANTITATIVE RETAIL NEEDS Introduction
5.1 We turn now to our assessment of the quantitative needs likely to arise in the retail sector in the period up to 2021 and, more indicatively15, for the longer-term period from 2021 to 2026. In undertaking our assessment of retail need, we have followed the guidance set out in Policy EC1 of PPS4 and in the accompanying Practice Guidance on need, impact and the sequential approach16.
Methodology for Assessing Quantitative Retail Need 5.2 Section 3 and Appendix B of the Practice Guidance, which accompanies PPS4, provides
advice on the assessment of quantitative and qualitative need. We note, however, that the Practice Guidance states that it does not ‘…seek to prescribe a single methodology…’ and that ‘…alternative approaches may be equally acceptable, provided they are compliant with national policy objectives and clearly justified, transparently presented and robustly evidenced’ (paragraph 1.22). We accept, also, the advice given in paragraph B3 to the effect that ‘…forecasts of ‘retail need’ should not be regarded as prescriptive…’ and that they ‘…inevitably involve judgments and ultimately policy choices…’
5.3 Thus, we have refined the five step approach set out in Appendix B of the Practice Guidance into 8 steps, as follows17:
i Establish the appropriate catchment area for the highest order centre within the area being considered, in this case Blackburn.
ii Assess the existing level of population and existing volume of retail expenditure for those resident within the defined catchment area.
iii Establish where the expenditure of the catchment area’s residents is currently spent, through the use of an empirical survey of households in the catchment area, and thereby establish the proportion of expenditure which is currently retained by town centres and freestanding stores located within the catchment – that is, the current retention rate.
iv Apply forecasts of population change and per capita expenditure growth, so as to establish the overall level of projected growth in expenditure for residents of the catchment area and an assessment of growth in retained expenditure, using, initially, a constant retention assumption.
v Allow for ‘claims’ on the growth in retained expenditure as a result of:
15 Longer term projections are indicative because of the exponential shape of expenditure growth, and because PPS4 requires that LPAs should use their annual monitoring reports to keep under review the need for further development 16 ‘Planning for Town Centres: Practice guidance on need, impact and the sequential approach’, CLG, December 2009. Hereafter referred to as ‘the PPS4 Practice Guidance.’ 17 Steps i. to iii. have been undertaken in Section 5 of our report.
Blackburn with Darwen Retail Capacity Study
Final Report | June 2011 40
▫ floorspace efficiency change (that is, the growth in turnover for existing retailers within existing floorspace);
▫ growth over time in special forms of trading (SFT), mainly e-tail growth, but taking account, also, of the projected decline in catalogue sales; and
▫ planning commitments. vi Calculate the initial residual expenditure pot which is potentially available for new retail
floorspace, based on steps iv) and v) above. vii Make an allowance for under-trading or over-trading in the base year, if this is justified. viii Develop alternative scenarios for calculating growth in residual expenditure, based on: ▫ increases or decreases in the projected retention level; and ▫ sensitivity testing of key assumptions.
Definition of the Comparison and Convenience Catchment Area
5.4 The comparison shopping catchment area (CpCA) is split into 11 zones based on postcode boundaries, as shown in Figure 4.2 of this report and Spreadsheet 1a in Volume 2, whereas the convenience shopping catchment area (CpCA) is disaggregated into 10 zones as shown in Figure 4.3 of this report and Spreadsheet 10a in Volume 2.
Existing Level of Population and Expenditure
5.5 The population by zone in the 2010 base year for comparison goods, and the 2011 base year for convenience goods, is set out in the second row of Spreadsheet 2a and Spreadsheet 11a, respectively. Those data are based on year 2008 zonal population figures supplied by Pitney Bowes Business Insight18 (PBBI) and Oxford Economics (OE), and are rolled forward to the respective base years, using the ONS 2008 based Sub-National Population Projections for Local Authorities.
5.6 The zonal per capita expenditure data were also supplied by PBBI for the year 2008, as set out in the top row of Spreadsheet 3a for comparison goods and the top row of Spreadsheet 12a for convenience goods. These data were then rolled forward to 2010 for comparison goods and 2011 for convenience goods using the mid-point of the estimates and forecasts as provided by PBBI19 in September 2010 and by Experian20 in August 2010 (as set out in Tables 5.1 and 5.2, and summarised in and Table 5.3 and Table 5.4 below), of 0.2 per cent per capita per annum between 2008 and 2010 for comparison goods, and -1.0 per cent per capita per annum between 2008 and 2011 for convenience goods.
5.7 The total pot of comparison goods expenditure in 2010 is derived from the product of Spreadsheets 2a and 3a for comparison goods and from the product of Spreadsheets 11a and 12a for convenience goods as set out in the top row of Spreadsheet 4a for comparison
18 Formerly known as Pitney Bowes MapInfo. 19 Table 3.5, Retail Expenditure Guide 2010/2011, PBBI, September 2010. 20 Figure 1, Retail Planner Briefing Note 8.1, Experian, August 2010.

Blackburn with Darwen Retail Capacity Study
Final Report | June 2011 41
goods, and Spreadsheet 13a for convenience goods. From this we have made an allowance for SFT (i.e. mail order, TV and internet shopping) and have therefore made a deduction from the total expenditure in each zone, of an average of 8.5 per cent at 2010 for comparison goods and 1.4 per cent at 2011 for convenience goods. These rates are based on the findings from the respective household surveys. Thus, the total available comparison goods expenditure for 2010 is set out in the final column of Spreadsheet 4a, and the total available convenience goods expenditure for 2011 is set out in the final column of Spreadsheet 13a for convenience goods.
Existing Retention Rate
5.8 Next we use the household survey findings to establish current patterns of expenditure and the current retention rate, as described in Section 4 of our report. The current pattern of expenditure and the current retention rate for comparison goods is as set out in Spreadsheet 6a, with the overall retention rate for comparison goods being 57.9 per cent. For convenience goods, the pattern of expenditure and the current retention rate is as set out in Spreadsheet 15a, which reveals an overall convenience goods retention rate of 90.5 per cent.
Growth in Expenditure and Growth in Retained Expenditure
5.9 The next steps are to apply forecasts of population change and per capita expenditure growth, so as to establish the overall level of projected growth in expenditure for all residents of the catchment area, and then an assessment of growth in retained expenditure, using, initially, a constant retention assumption.
5.10 Population change is based on the mid-2008 sub-national projections from the ONS, as set out in Spreadsheets 2a and 11a. Using this method, the resident population across the CpCA is forecast to increase from around 308,600 persons in the 2010 base year to 320,350 persons in 2026. This equates to a total population increase of 3.8 per cent over the entire study period. Within the CvCA, the resident population is forecast to increase from around 216,950 persons in the 2011 base year to approximately 223,500 persons in 2026, giving a total population increase of 3.0 per cent over the entire study period.
5.11 The data on forecast growth in per capita expenditure are as set out below in Spreadsheets 3a and 12a, which utilise the growth rates as shown in Table 5.3 for comparison goods and Table 5.4 for convenience goods.
5.12 The expenditure growth rates estimated by Experian in August 2010 and PBBI/OE in September 2010 are relatively low between 2008 and 2011 due to the current economic slowdown, as shown in Tables 5.1 and 5.2 below. However, PBBI/OE anticipate a much faster recovery than Experian in the comparison sector, and significant differences arise between the comparison expenditure growth forecast by Experian and PBBI/OE over the medium and longer term periods.
5.13 Accordingly, the per capita comparison and convenience goods expenditure growth rates that we have adopted for the 12 year period from 2008 to 2020 are the mid-points of the estimates and forecasts provided by Experian and PBBI/OE, and are set out for each forecast year in Tables 5.1 and 5.2, below. PBBI/OE do not provide any forecasts for
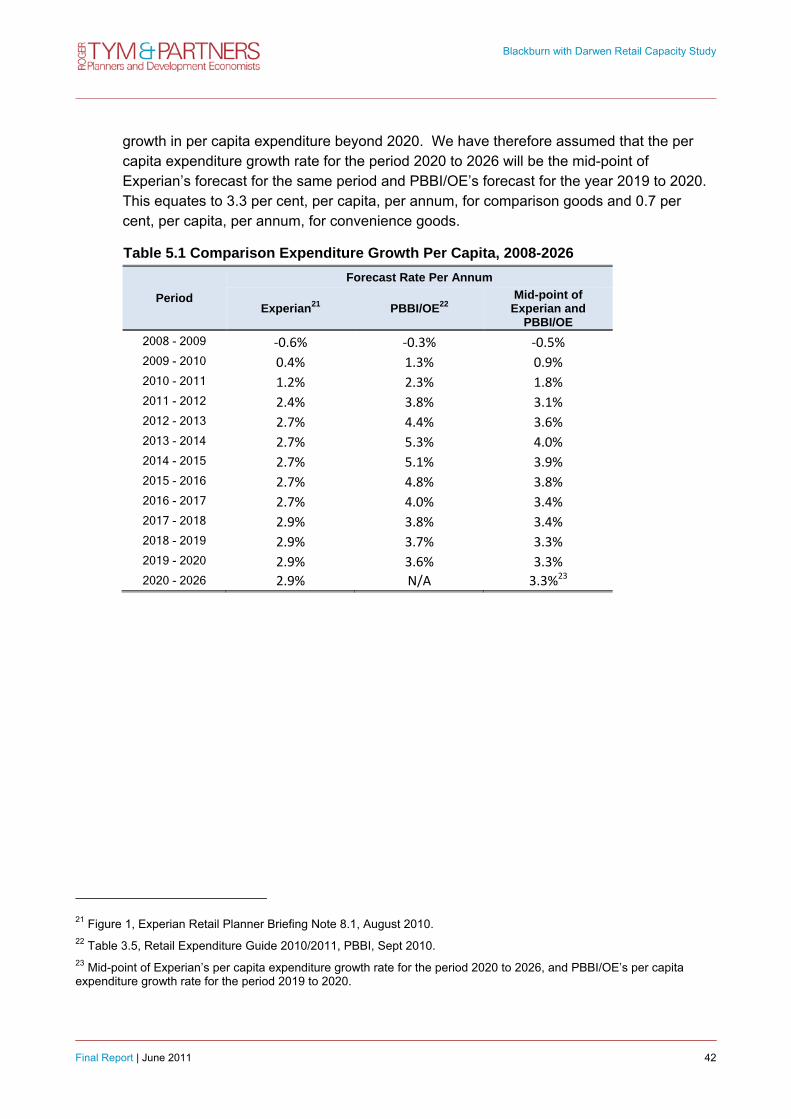
Blackburn with Darwen Retail Capacity Study
Final Report | June 2011 42
growth in per capita expenditure beyond 2020. We have therefore assumed that the per capita expenditure growth rate for the period 2020 to 2026 will be the mid-point of Experian’s forecast for the same period and PBBI/OE’s forecast for the year 2019 to 2020. This equates to 3.3 per cent, per capita, per annum, for comparison goods and 0.7 per cent, per capita, per annum, for convenience goods.
Table 5.1 Comparison Expenditure Growth Per Capita, 2008-2026
Period Forecast Rate Per Annum
Experian21 PBBI/OE22 Mid-point of
Experian and PBBI/OE
2008 - 2009 ‐0.6% ‐0.3% ‐0.5%
2009 - 2010 0.4% 1.3% 0.9%
2010 - 2011 1.2% 2.3% 1.8%
2011 - 2012 2.4% 3.8% 3.1%
2012 - 2013 2.7% 4.4% 3.6%
2013 - 2014 2.7% 5.3% 4.0%
2014 - 2015 2.7% 5.1% 3.9%
2015 - 2016 2.7% 4.8% 3.8%
2016 - 2017 2.7% 4.0% 3.4%
2017 - 2018 2.9% 3.8% 3.4%
2018 - 2019 2.9% 3.7% 3.3%
2019 - 2020 2.9% 3.6% 3.3%
2020 - 2026 2.9% N/A 3.3%23
21 Figure 1, Experian Retail Planner Briefing Note 8.1, August 2010. 22 Table 3.5, Retail Expenditure Guide 2010/2011, PBBI, Sept 2010. 23 Mid-point of Experian’s per capita expenditure growth rate for the period 2020 to 2026, and PBBI/OE’s per capita expenditure growth rate for the period 2019 to 2020.

Blackburn with Darwen Retail Capacity Study
Final Report | June 2011 43
Table 5.2 Convenience Expenditure Growth Per Capita, 2008-2026
Period Forecast Rate Per Annum
Experian24 PBBI/OE25 Mid-point of
Experian and PBBI/OE
2008 - 2009 ‐2.9% ‐2.7% ‐2.8%
2009 - 2010 0.3% 0.1% 0.2%
2010 - 2011 0.0% ‐0.5% ‐0.3%
2011 - 2012 0.4% 0.1% 0.3%
2012 - 2013 0.8% 0.5% 0.7%
2013 - 2014 0.8% 1.1% 1.0%
2014 - 2015 0.8% 1.0% 0.9%
2015 - 2016 0.8% 0.9% 0.9%
2016 - 2017 0.8% 0.5% 0.7%
2017 - 2018 0.9% 0.4% 0.7%
2018 - 2019 0.9% 0.4% 0.7%
2019 - 2020 0.9% 0.4% 0.7%
2020 - 2026 0.9% N/A 0.7%26
5.14 The per capita expenditure growth rates for comparison and convenience goods that we have adopted are summarised for each of the respective forecast periods in Tables 5.3 and 5.4, respectively.
Table 5.3 Comparison Expenditure Growth Per Capita for each Forecast Period, 2008-2026
Period Rate Per Annum
2008 - 2010 0.2% 2010 - 2016 3.3% 2016 - 2021 3.3% 2021 - 2026 3.3%
24 Figure 1, Experian Retail Planner Briefing Note 8.1, August 2010. 25 Table 3.5, Retail Expenditure Guide 2010/2011, PBBI, Sept 2010. 26 Mid-point of Experian’s per capita expenditure growth rate for the period 2020 to 2026, and PBBI/OE’s per capita expenditure growth rate for the period 2019 to 2020.

Blackburn with Darwen Retail Capacity Study
Final Report | June 2011 44
Table 5.4 Convenience Expenditure Growth Per Capita for each Forecast Period, 2008-2026
Period Rate Per Annum
2008 - 2011 ‐1.0% 2011 - 2016 0.7% 2016 - 2021 0.7% 2021 - 2026 0.7%
5.15 Spreadsheet 4a is the product of Spreadsheets 2a and 3a and it sets out the total growth in comparison goods expenditure for all residents in the CpCA. Spreadsheet 13a sets out the corresponding data for growth in convenience goods expenditure for all residents in the CvCA.
5.16 To allow for the growth in SFT over time, we have made a deduction from the total expenditure pot in each zone at the rates set out in Table 5.5 below. As we explained in Section 4, the allowances for SFT in the 2010 base year in the comparison sector and the 2011 base year in the convenience sector are derived from the respective household survey findings. In each of the forecast years, the rates of SFT reflect the advice provided by Experian in August 201027, with certain adjustments to reflect local circumstances.
5.17 In the comparison sector, in order to reflect the Borough’s relatively low level of SFT expenditure, we have allowed a five-year ‘lag’ in the rate of SFT growth to allow for a longer period of convergence with the rates forecast by Experian. Consequently, our forecast allowance for expenditure via SFT by residents of the CpCA for 2021 reflects the Experian forecast for the UK for 2016; and our forecast our forecast allowance for expenditure via SFT by residents of the CpCA for 2026 reflect the Experian forecast for 2021. For the intervening years of 2011 and 2016, we have allocated one-eleventh and six-elevenths respectively of the expected growth in SFT expenditure between 2010 and 2021.
5.18 In the convenience sector, in order to reflect the fact that many of the convenience goods bought over the internet are supplied from shelves in local supermarkets (rather than from remote distribution warehouses), and consequently should not count as ‘leakage’, we have allocated one quarter of the Experian forecasts for expenditure on SFT in each of the forecast years.
27 Appendix 3: non store retail sales, Retail Planner Briefing Note 8.1, Experian , August 2010.

Blackburn with Darwen Retail Capacity Study
Final Report | June 2011 45
Table 5.5 Projected Rates of Special Forms of Trading (SFT) Comparison Goods Convenience Goods
Year Rate per Annum Year Rate per Annum
2010 Average of 8.5% 2011 Average of 1.4% 2016 11.0% 2016 2.4% 2021 13.6% 2021 2.5% 2026 13.3% 2026 2.7%
5.19 The total available expenditure (including expenditure on SFT) for the forecast years is set out in the final column of Spreadsheet 4a for comparison goods, and reproduced as Row A of Spreadsheet 9a(i). Similarly, Spreadsheet 13a presents the total growth in convenience goods expenditure up to 2026, which is also set out in the Row A of Spreadsheet 16a(i).
5.20 Having calculated the growth in total comparison and convenience goods expenditure for all residents of the CpCA and the CvCA, respectively, the next step is to assess the growth in retained expenditure (Row E of Spreadsheets 9a(i) and 16a(i)), initially on the basis of a constant aggregate retention level (Row C of Spreadsheets 9a(i) and 16a(i)).
Further ‘Claims’ on Growth in Retained Expenditure
5.21 The next stage is to make an allowance for further ‘claims’ on the growth in retained expenditure, namely:
growth in floorspace efficiency, which is growth in the turnover of existing retailers within their existing floorspace (retail sales per unit sales area); and
an allowance for the predicted turnover of planning commitments.
5.22 Below, we describe the allowances that we have made for growth in floorspace efficiency and commitments.
Growth in floorspace efficiency
5.23 In making an allowance for growth in floorspace efficiency (Rows F and G of Spreadsheets 9a(i) and 16a(i)), we adopted the rate of floorspace efficiency change set out in Table 5.6 below. We have tied the rate of comparison and convenience goods floorspace efficiency change to the expenditure forecasts for the assessment period in question, using a ratio of 37.9 per cent for comparison goods and 46.2 per cent for convenience goods. These ratios represent the ‘underlying trend’ of floorspace efficiency improvements between 1987 and 1999 (as recommended by Experian in its Retail Planner Briefing Note 6.1 of January 2009), of 2.2 per cent for comparison goods and 0.6 per cent for convenience goods, as a proportion of the expenditure growth over the same period of 5.8 per cent and 1.3 per cent respectively.

Blackburn with Darwen Retail Capacity Study
Final Report | June 2011 46
Table 5.6 Improvements in Floorspace Efficiency Comparison Goods Convenience Goods
Period Rate per Annum Period Rate per Annum
2008 - 2010 0.1% 2008 - 2011 ‐0.4% 2010 - 2016 1.3% 2011 - 2016 0.3% 2016 - 2021 1.3% 2016 - 2021 0.3% 2021 - 2026 1.2% 2021 - 2026 0.3%
Allowance for planning commitments
5.24 The next step is to allow for the future turnover requirements of commitments for new comparison and convenience goods floorspace, having made an assessment of how much of the commitments’ turnovers will be derived from residents of the CpCA and the CvCA.
5.25 The comparison goods commitments are scheduled in Table 5.7 and the convenience goods commitments are scheduled in Table 5.828. The total comparison turnover of the commitments derived from residents of the CpCA also appears in Row J of Spreadsheet 9a(i). Similarly, the total convenience turnover of the commitments derived from residents of the CvCA also appears in Row J of Spreadsheet 16a(i).
5.26 For the purposes of this analysis, we have not counted the Markets site as a commitment as it is currently at too early a stage in the planning process for us to make any assumptions about what might come forward on the site.
5.27 For the analysis of comparison expenditure, the household survey was carried out in early 2010. Comparison retail floorspace which has started trading since then is therefore counted as a commitment. This is the case for the extension of The Mall in Blackburn Town Centre, which has provided an additional 9,717 sq m of comparison retail sales area floorspace since the household survey was carried out. The Tesco store on Eagle Street in Accrington has also started trading since the household survey, and is therefore also included as a commitment. The two other commitments identified are both expected to start trading within the next two years.
5.28 The convenience goods household survey of 2011 post-dates the opening of the extension to The Mall and the opening of Tesco at Accrington, so these have not been treated as commitments. As with the comparison commitments, all of the identified convenience retail commitments are expected to be fully trading by 2016.
28 Please note the distinction in Tables 5.7 and 5.8 between gross floorspace and net sales area; it is the latter that is used in calculating the turnover requirements of the commitments.

Blackburn with Darwen Retail Capacity Study
Final Report | June 2011 47
Table 5.7 Comparison Retail Commitments in the Blackburn with Darwen CpCA (as at 31 March 2010)
Application Ref. Details of Proposal Address
Gross Floorspace
(sq.m)
Comparison Sales Area Floorspace
(sq.m)
Comparison Turnover from CpCA at 2016
(£m)
10/10/0314 Extension to Tesco Hill Street, Blackburn 2,412 564 4.18
11/09/0145 Tesco store Queen Street, Great Harwood 4,900 1,495 7.81
Extension to The Mall The Mall, Blackburn 18,580 9,717 60.07
11/08/0044 Tesco store29 Eagle Street 8,599 1,765 6.88
TOTAL 13,541 78.93
Table 5.8 Convenience Retail Commitments in the Blackburn with Darwen CvCA (as at 31 March 2011)
Application Ref. Details of Proposal Address
Gross Floorspace
(sq.m)
Convenience Sales Area Floorspace
(sq.m)
Convenience Turnover from CvCA at 2016
(£m)
10/10/0314 Extension to Tesco Hill Street, Blackburn 2,412 38 0.4
11/09/0145 Tesco store Queen Street, Great Harwood 4,900 1,625 11.4
10/10/0128 New retail unit Apex Mill, Randal Street, Blackburn 1,200 780 6.9
TOTAL 2,443 18.6
29 Note that as the comparison goods survey was undertaken in February and March 2010, The Mall and the Tesco store at Eagle Street, Accrington have been included as commitments for the purposes of the assessment of comparison goods spending patterns, as they had not been developed at that time.

Blackburn with Darwen Retail Capacity Study
Final Report | June 2011 48
Residual Expenditure Potentially Available for New Floorspace 5.29 Row N of Spreadsheets 9a (i) and 16a(i) converts the residual expenditure to a floorspace
requirement expressed as a net sales area. This is calculated by applying a sales density for comparison goods of £6,002 per sq.m sales area in 2010 (the average comparison goods sales density in Blackburn Town Centre derived from the results of the household survey), and an average sales density for convenience goods of £9,135 per sq.m sales area in 2011 (the average convenience goods sales density of the top ten convenience retailers in the UK30) to the residual expenditure pot. Finally, we convert the sales area requirement into a gross floorspace requirement, as set out in Row O of Spreadsheets 9a(i) and 16a(i), using a gross to net ratio of 70 per cent for comparison goods and 65 per cent for convenience goods.
5.30 Row N of Spreadsheets 9a(i) and 16a(i) converts the residual expenditure to a floorspace requirement expressed as a net sales area. This is calculated by applying an average sales density for comparison goods of £6,159 per sq.m sales area in 2010 and an average sales density for convenience goods of £9,135 per sq.m sales area in 201131, to the residual expenditure pot. Finally, we convert the sales area requirement into a gross floorspace requirement, as set out in Row O of Spreadsheets 9a(i) and 16a(i), using a gross to net ratio of 70 per cent for comparison goods and 65 per cent for convenience goods.
Adjustments for Under-trading/Over-trading in the Base Year
5.31 Next, we consider the current trading position of existing stores relative to their so-called benchmark level.
Comparison goods sector
5.32 Spreadsheet 6a reveals an estimated comparison goods turnover for Blackburn Town Centre of approximately £177m, excluding any expenditure inflow from residents beyond the CpCA. This turnover estimate implies a comparison goods sales density for Blackburn of approximately £6,000 per sq.m sales area, which is around what we would expect for a centre at Blackburn’s position in the retail hierarchy. Consequently it is not necessary to make any adjustment for over-trading in the comparison goods sector.
Convenience goods sector
5.33 We consider the performance of the main convenience retail stores within the CvCA along with overtrading in the convenience goods sector in Section 6.
30 We have made an allowance for the growth of the sales density so that for comparison goods, it rises to £7,323 per sq.m sales area by 2026 and for convenience goods, to £9,570 per sq.m sales area by 2026. 31 We have made an allowance for the growth of the sales density so that for comparison goods, it rises to £7,515 per sq.m sales area by 2026 and for convenience goods, to £9,570 per sq.m sales area by 2026.

Blackburn with Darwen Retail Capacity Study
Final Report | June 2011 49
Increase or Decrease in the Geographical Size of the Catchment Area
Comparison goods sector
5.34 Alternative scenarios for calculating growth in residual expenditure can be based on an increase or decrease in the geographical size of the catchment area, where this is justified as part of a strategy to raise the role and function of the centre(s) as part of the development plan process. However, given that there is no proposed change to the role of function of Blackburn or Darwen Town Centres, we have not made any alterations to the CpCA as shown in Figure 4.2.
Convenience goods sector
5.35 The CvCA was defined in order to focus only on those areas where over 5 per cent of convenience spending was accounted for by stores within the Borough of Blackburn with Darwen, using evidence from the Tithebarn survey in February and March 2010. The appropriateness of the catchment area is confirmed by the findings of the household survey of February and March 2011, which shows a convenience expenditure retention rate in the CvCA of over 90 per cent. Consequently, there is no need to increase or decrease the geographical size of Blackburn with Darwen’s convenience retail catchment area.
Changes to the Retention Level
Comparison goods sector
5.36 We have undertaken three sensitivity tests of changes to the overall level of comparison goods expenditure retention across the CpCA, as follows:
‘Static Retention’ – under this scenario, the overall retention level is kept constant at 57.9 per cent throughout the entire study period, 2010 to 2026.
‘Increased Retention’ – in this sensitivity test, the overall retention level increases from 57.9 per cent in the year 2010, to 62.5 per cent by 2016, and then to 63.0 per cent by 2021, remaining at this level thereafter.
‘Rising, then Falling’ Retention – in this scenario, the overall retention rate again increases from 57.9 per cent in 2010 to 62.5 per cent by 2016 but then declines to 60.0 per cent to 2021 and then to 57.9 per cent by 2026.
5.37 The increased retention scenario reflects the improved town centre offer presented by the expansion of The Mall, with the figure of 62.5 per cent based on the assumption that the new stores in the development trade at around the town centre average and that around two thirds of this increased expenditure comes from clawback of leakage. This scenario then assumes that Blackburn continues to enhance its offer and remain competitive vis-á-vis other centres. Even in this most optimistic scenario, however, it is difficult to envisage retention rising much above 63 per cent given Blackburn’s geographical position between competing centres.
5.38 The ‘Rising then Falling’ retention scenario assumes an initial increase in retention due to the expansion of The Mall, but then sees retention tail off. This scenario seeks to model the effects of new comparison retail developments outside of the CpCA (notably the Tithebarn development in Preston) coming on stream, without further new schemes in Blackburn with

Blackburn with Darwen Retail Capacity Study
Final Report | June 2011 50
Darwen of a size and scale that are capable of offsetting this strengthening competition. The result of this would therefore be a gradual increase in expenditure leakage.
Convenience goods sector
5.39 In the convenience sector we similarly test a ‘static retention’ scenario, with the overall retention level remaining at 90.5 per cent. The current level of retention is high and we consider that there is little scope for further improvement. Nevertheless, as a sensitivity test, we also consider an ‘increased retention’ level scenario, whereby the overall retention level increases by approximately 2.5 percentage points from 90.5 per cent in the year 2011 to 93.0 per cent by 2016, remaining at that level in the period up to 2026.
Findings in Relation to Quantitative Retail Need Comparison Goods Sector
5.40 Spreadsheets 9a(i), 9a(ii) and 9a(iii) set out the quantitative comparison goods retail need for the static retention, increased retention and rising then falling retention scenarios, respectively. These quantitative needs, as set out in Row N of the spreadsheets in terms of net sales area, are summarised in Table 5.9 below.
5.41 Table 5.9 shows that there is a negative residual floorspace requirement in the comparison sector in the period up to 2016 under the static retention rate scenario. This means that the growth in retained expenditure up to 2016 is not sufficient to support prior ‘claims’ on that growth, namely an improvement in sales densities of existing centres and stores, growth in the market share of SFT, and the turnover requirements of extant permissions, in particular the extension to The Mall. Under the other two scenarios, there is a negligible residual floorspace requirement, showing that the growth in retained expenditure can support the various claims on that growth but that there is little extra capacity beyond that.
5.42 Over the longer term, however, there is a significant positive residual for additional comparison retail floorspace under the increased retention rate scenario in the period up to 2021, and under all three scenarios in the period up to 2026.
Table 5.9 Quantitative Need in the Comparison Goods Sector (over and above commitments)
Period
Floorspace Requirements
Static Retention Scenario (sq.m net)
Increased Retention Scenario (sq.m net)
Rising then Falling Retention Scenario
(sq.m net)
2010 - 2016 -7,392 152 152
2016 - 2021 4,281 6,112 588
2010 - 2021 -3,111 6,264 740
2021 - 2026 9,485 10,576 5,634
2010 - 2026 6,374 16,841 6,374
5.43 Thus, in the period 2021, the only scenario which generates a significant need for further retail floorspace is the increased retention scenario, where the expansion to The Mall leads to an initial increase in retention, and further improvements in the town centre offer allow

Blackburn with Darwen Retail Capacity Study
Final Report | June 2011 51
the town to resist competition from other centres. The other two scenarios show either a negligible increase or an appreciable fall in the requirements for comparison floorspace in the CpCA.
5.44 In the longer term, however, all three scenarios present a need for additional comparison floorspace in the Borough in the period to 2026; in the increased retention scenario there is a need for over 16,000 sq.m of additional sales area floorspace, and in the other two scenarios there is a need for over 6,000 sq.m of additional sales area floorspace.
5.45 It can be expected that the expansion of The Mall will result in an increased retention rate over the period to 2016. Beyond 2016, the capacity for additional floorspace within the CpCA will depend on the ability of the Borough’s centres to continue to improve their offer and remain competitive vis-à-vis neighbouring centres, and new developments elsewhere. However, we do not consider it sensible to plan for a scenario of ‘falling’ or even ‘static’ expenditure retention, given the need to further enhance Blackburn Town Centre’s comparison retail offer. We therefore, advocate the floorspace requirements identified under the ‘increased retention’ scenario.
5.46 For illustrative purposes, we have also made forecasts of the comparison retail floorspace requirements that would arise if population in Blackburn with Darwen grows slightly quicker than the level of growth implied by the ONS sub-national projections, with the population of the Borough reaching 152,800 by 2026, reflecting the aspirations of the Council. The results are illustrated in Table 5.10 below.
Table 5.10 Quantitative Need in the Comparison Goods Sector – Higher Population Scenario
Period
Floorspace Requirements
Static Retention Scenario (sq.m net)
Increased Retention Scenario (sq.m net)
Rising then Falling Retention Scenario
(sq.m net)
2010 - 2016 -6,756 803 803
2016 - 2021 4,827 6,724 1,137
2010 - 2021 -1,929 7,527 1,940
2021 - 2026 10,813 11,350 6,314
2010 - 2026 8,254 18,877 8,254
5.47 It can be seen that varying the population projections in this way has a relatively modest effect. Thus, the floorspace requirement arising by 2021, under our recommended ‘increased retention’ scenario, is around 7,500 sq.m sales area, using the higher population figures, compared to a requirement for 6,300 sq.m using the lower population figures. The difference is slightly greater in the longer-term period 2010-26, ranging from 16,800 sq.m to18,900 sq.m under the two population bases.
5.48 The floorspace requirements arising in the 2010-26 period are significantly greater than the figures arising in the 2010-21 period, reflecting the power of exponential growth. Thus, we consider that the 2026 figures should be treated with caution, and monitored according to the corresponding qualitative needs of the centres, and their physical capacity.

Blackburn with Darwen Retail Capacity Study
Final Report | June 2011 52
Convenience Goods Sector
5.49 The quantitative needs, as set out in Row I of Spreadsheets 16a and 16b, in terms of sales area floorspace, are summarised in Table 5.11.
Table 5.11 Quantitative Need in the Convenience Goods Sector
Period32 Floorspace Requirements
Static Retention Scenario (sq.m net)
Increased Retention Scenario (sq.m net)
2011 - 2016 -1,489 -618
2016 - 2021 851 876
2011 - 2021 -638 259
2021 - 2026 761 785
2011 - 2026 123 1,044
5.50 Table 5.11 shows that the residual convenience goods need is negative in the period up to 2016 under both expenditure growth scenarios, and in the period up to 2021 under the static retention scenario. As in the comparison sector, this means that the growth in retained expenditure is not sufficient to support prior ‘claims’ on that growth, namely an improvement in sales densities of existing centres and stores, growth in SFT, and the turnover requirements of existing commitments.
5.51 In the later time intervals there is a small positive residual need for convenience floorspace under both expenditure retention scenarios. However, even in the longer term period to 2026 and assuming that the overall retention rate can be improved to 93 per cent, there is still only a requirement for up to 1,044 sq.m of additional convenience sales area floorspace across the CvCA.
5.52 The low convenience floorspace requirements reflect the low forecast level in expenditure growth and the combined effects of the claims on that growth. Furthermore, the current level of convenience expenditure retention achieved by the catchment area (90.5 per cent) is high, which means that there is little scope for further improvement.
5.53 As with the comparison sector, we have also identified convenience floorspace requirements using slightly higher population growth figures which reflect the Borough Council’s aspiration to reach a population of 152,800 by 2026.
5.54 Table 5.12 reveals that the higher population figures generate a need for around 2,000 sq.m of convenience sales area in the period to 2026 across the whole of the CvCA.
32 As with comparison floorspace, note that cumulative floorspace figures do not necessarily equal the sum of the incremental floorspace figures. This is due to rising sales density figures over the period of the study.

Blackburn with Darwen Retail Capacity Study
Final Report | June 2011 53
Table 5.12 Quantitative Need in the Convenience Goods Sector – Higher Population Growth Scenario
Period33 Floorspace Requirements
Static Retention Scenario (sq.m net)
Increased Retention Scenario (sq.m net)
2011 - 2016 -1,815 -299
2016 - 2021 1,173 1,208
2011 - 2021 -12 909
2021 - 2026 1,098 1,132
2011 - 2026 1,086 2,041
Conclusions in Relation to Quantitative Retail Need Comparison Retail Goods
5.55 We have considered three different expenditure retention scenarios in assessing the quantitative need for additional comparison floorspace: a static retention scenario, a rising retention scenario, and a ‘rising then falling’ retention scenario. In the period to 2016 the comparison floorspace requirements are negative under the static retention scenario, and the floorspace requirements are negligible in the other two scenarios (Table 5.9).
5.56 The comparison floorspace requirements (sales area) arising in the 2010-2021 period under our recommended ‘rising retention’ scenario range from 6,300 sq.m to 7,500 sq.m depending on which population growth scenario is used. In the longer term 2010-2026 period, the range is from approximately 16,800 sq.m to 18,900 sq.m sales area.
Convenience Retail Goods
5.57 In the convenience sector, we considered two scenarios: a static retention rate scenario and a rising retention rate scenario.
5.58 The overall retention rate within the CvCA is already high, at over 90 per cent, and we consider that there is limited scope to further improve the retention rate. On the basis that the level of aggregate expenditure retention could be improved to 93 per cent, there is a modest requirement for up to 900 sq.m of additional convenience sales area floorspace by 2021 and up to 2,000 sq.m in the 2011-26 period. Both of these figures are relatively modest and are based on the Council’s aspirational level of population growth being achieved. If population only grows in line with the ONS predictions then there would effectively be no generic capacity for additional convenience floorspace arising across the CvCA by 2021, and a need for only 1,000 sq.m sales area in the longer term 2021-26 period.
33 Again, note that cumulative floorspace figures do not necessarily equal the sum of the incremental floorspace figures. This is due to rising sales density figures over the period of the study.


Blackburn with Darwen Retail Capacity Study
Final Report | June 2011 55
6 ASSESSMENT OF QUALITATIVE RETAIL NEEDS Introduction
6.1 Paragraph EC1.4 of PPS4 makes clear that, when assessing the need for retail development, LPAs should ‘…take account of both the quantitative and qualitative need for additional floorspace’. In this section, we consider the qualitative need for additional convenience and comparison retail floorspace in the Borough.
6.2 Our assessment is informed by an update of the health checks of Blackburn and Darwen Town Centres that were completed by Steven Abbot Associates (SAA) in November 2009. It is not part of our remit to re-do the SAA health checks, which are comprehensive (the report for each centre runs to well in excess of 100 pages) and only just over a year old. The main purpose of our update is to assess some of the early effects of the opening of The Mall in Blackburn Town Centre, and provide our independent assessment of the current health of each centre.
6.3 In the convenience retail sector, we further analyse the spatial distribution of existing convenience retail facilities to indentify any ‘gap’ areas in the current provision, and assess levels of ‘over-trading’ at existing convenience stores.
6.4 We conclude this section of our report by reflecting on issues of qualitative need, taking into account the findings of the healthchecks, gap analysis and assessment of ‘overtrading’, as well as the existing shopping patterns as revealed by the household survey.
6.5 The various health check data (tables and figures), referred to below, are presented in Volume 234.
Updated Health Check of Blackburn Town Centre 6.6 The 2009 Health Check of Blackburn Town Centre by SAA, and evidence submitted to the
Tithebarn inquiry, highlighted the following:
the persistently high and increasing level of vacancy in the town centre; the declining proportion of comparison retail units in the town and decline in the number
of comparison goods retailers; a high proportion of charity shops; the failure to develop a number of sites allocated for town centre uses in the adopted
Local Plan; the low conversion rate of planning permissions (with only 35 per cent of permitted
floorspace having been developed); the mismatch between retailer requirements and availability in terms of size of unit; the fact that zone A retail rents in Blackburn have been outstripped by growth in Preston
and Bolton;
34 All subsequent references to ‘Appendices’ relate to the Appendices that are contained in Volume 3.

Blackburn with Darwen Retail Capacity Study
Final Report | June 2011 56
the fact that Blackburn has a higher retail yield than the comparator centres of Preston, Blackpool, Bury and Bolton (demonstrating lower investor confidence in the town);
the significant reduction in footfall between 2000 and 2007, as revealed by manual counts;
the propensity for Blackburn Town Centre to attract proportionately more shoppers from the C1 and C2 socio-economic groups;
the low customer satisfaction rate in terms of choice and quality of shops; and the deterioration in business perceptions of the choice and quality of the town’s retail
offer.
6.7 Below, we provide a summary of our findings in respect of the current vitality and viability of the town centre, which are based on our recent visits to the centre.
Diversity of Uses
6.8 The most recent Experian GOAD survey of Blackburn Town Centre was undertaken in October 2009. There have been some significant changes since then and so we visited the town centre on 30 and 31 March 2011 to update the GOAD survey. The GOAD boundary for Blackburn Town Centre is presented in Appendix 2.
6.9 Blackburn Town Centre contained 27 convenience retail outlets in March 2011 (Appendix 1a). This represents a slight decline since the 2009 healthcheck, when there were 31 convenience retail outlets in the town centre, although the number of convenience outlets in the town centre as a proportion of total units at March 2011 (6.9 per cent) is virtually the same as in 2009 (7.0 per cent). This is because the overall number of town centre units recorded in March 2011 (391) is lower than the figure recorded by SAA in 2009 (445).
6.10 Appendix 1c also shows that the 27 convenience retail outlets together provide a total of 18,650 sq.m of gross floorspace, which equates to 21.5 per cent of all retail/service floorspace in the town centre. This is higher than the UK average of 17.4 per cent, due in large part to the presence of the markets which for GOAD purposes are treated as convenience retail35.
6.11 The three largest convenience facilities by floorspace are the market (9,710 sq.m gross), Morrisons (5,550 sq.m gross) and Tesco Metro (1,070 sq.m gross) which collectively account for 88 per cent of the convenience floorspace in the town centre. Additionally, Marks and Spencer has a food hall which has recently been refurbished and provides a good quality offer36. Beyond this, however, the town centre’s convenience retail offer is somewhat limited; the only other convenience retailer larger than 200 sq m gross
35 Experian classifies all markets as convenience floorspace within GOAD sub-category G1C (‘greengrocers & fishmongers’). 36 Note however that Marks and Spencer does not appear on the GOAD plan or in the diversity of uses table as convenience retail since this is not its primary function.

Blackburn with Darwen Retail Capacity Study
Final Report | June 2011 57
floorspace is Farmfoods, on the western periphery of the town, and, outside of the markets, the town has no independent butcher, greengrocer or fishmonger.
6.12 Blackburn Town Centre contains 156 comparison goods outlets (see Appendix 1a). This represents a slight increase on the 151 comparison outlets that were recorded in 2009 and equates to 39.9 per cent of total units, which is just below the current UK average of 41.9 per cent. Comparison retail outlets account for 41,650 sq.m, which equates to 48.1 per cent of the town centre's total gross floorspace, slightly above the UK average of 47.3 per cent. In numeric terms, therefore, Blackburn Town Centre’s comparison retail provision is close to the national average.
6.13 The extension of The Mall, which opened in July 2010, has attracted a range of new high-profile fashion retailers to Blackburn including a large new Primark store as well as H&M, USC, Bank, Infinities, Deichmann and Peacocks outlets. The development has also enabled other fashion retailers that were already in the town centre – including Next, New Look, Topshop/Topman and River Island – to increase their respective unit sizes.
6.14 Away from The Mall, much of the town centre’s comparison retail offer remains skewed towards the lower spending end of the market. However, The Mall scheme has substantially strengthened the town centre’s fashion retail offer. This is very welcome as the performance of the clothing and footwear sub-categories is critical in determining a town centre’s attractiveness to shoppers, and Blackburn had been losing ground to competing centres.
6.15 Those household survey respondents who shopped in Blackburn Town Centre at least four times a year prior to the opening of the redeveloped Mall Shopping Centre in July 2010 were asked to describe the resultant change in the town centre’s shopping offer. Almost three-quarters of the 718 respondents to this question thought The Mall had ‘improved’ or ‘much improved’ Blackburn Town Centre’s shopping offer.
6.16 The enhanced fashion retail offer described above offer will inevitably help to claw back some expenditure that previously leaked out of the Borough to competing centres elsewhere, and this is reflected in our ‘rising retention rate’ scenario discussed in Section 5 of our report. This does not mean that the Council and its partners should rest on their laurels, however, as there is potential to further improve the town centre’s comparison retail offer and retain more expenditure within the Borough. We discuss the main opportunities in Section 7 of our report.
Proportion of Vacant Street Level Property
6.17 There were 79 vacant units in Blackburn Town Centre in March 2011, which equates to a vacancy rate of 20.2 per cent, compared to the current UK average of 12.9 per cent. However, whilst this initially appears to represent a substantial worsening since 2009 – when there were 63 vacant units in the town centre, or 14.2 per cent of total units – the current vacancy rate has been exaggerated by the closure of most of the small units which surround the existing markets building as the market is wound down prior to its relocation to The Mall.
6.18 The rise in vacancies can also be explained in part by the period of recession and continuing economic uncertainty which has affected the whole country since 2008, and

Blackburn with Darwen Retail Capacity Study
Final Report | June 2011 58
which has resulted in the closure of many chain stores and independent shops nationwide. Indeed, this is reflected by the fact that the UK average vacancy rate rose from 10.6 per cent in January 2007, to 11.1 per cent by January 2008, and to 12.5 per cent by March 2011.
6.19 As we explained in Section 3, if the vacant units which surround the existing markets building are excluded from consideration, the town centre vacancy rate is 15.9 per cent. This is still higher than the national average but less dramatically so than the headline figure of 20 per cent. Ignoring the vacant units which flank the markets building, the main concentrations of vacancy are in secondary locations towards the north and south of the town centre. This is illustrated in Appendix 2, which shows that most of the vacant units in these locations are small. As noted above, there is also a cluster of vacant units in The Mall, but we expect these to be filled given their prime location.
Pedestrian Flows
6.20 We visited the town centre on a Wednesday and Thursday. Footfall was moderate in the pedestrianised areas of the town (The Mall, King William Street, Lord Street, Northgate, New Market Street and Church Street) and light elsewhere.
State of Town Centre Environmental Quality
6.21 Blackburn Town Centre generally presents an attractive physical environment. Most streets and open spaces are well landscaped, especially around the pedestrianised areas of the centre and around the cathedral. The recently expanded Mall Shopping Centre is clean and well-presented inside, although its external appearance is more mixed. On Church Street and Ainsworth Street, The Mall is still under the process of redevelopment, which will present an updated and more attractive frontage to the street, whereas the King William Street frontage has a less attractive appearance, and would benefit from some updating.
6.22 Pedestrian accessibility through the centre of the town is largely good, with the streets surrounding The Mall providing an easy environment for pedestrians to use. However, The Mall itself presents something of a barrier between the heart of the town centre in the King William Street area and the cathedral and markets areas, and it necessitates awkward detours through the fringes of the town centre to reach these areas. There is pedestrian access through The Mall between these separate areas but this is not clearly signed and is not possible when The Mall is closed.
6.23 The existing markets building and the surrounding streets are run-down; however, this is not unexpected as the market winds down before being relocated to its new home in the lower ground floor of The Mall.
Summary
6.24 In our assessment, the overall health of Blackburn Town Centre has improved since the previous healthcheck was carried out in 2009. Although levels of vacancy in the town centre are high (even away from the markets area), the redevelopment of The Mall has brought about a significant increase in comparison floorspace and has attracted a number of new high-profile retailers to the town centre. As well as the new entrants, other existing retailers have taken advantage of the opportunity to move to larger premises (such as Next), or carry out internal improvements to existing premises (such as Marks & Spencer).

Blackburn with Darwen Retail Capacity Study
Final Report | June 2011 59
The Mall’s redevelopment is an ongoing project, and when completed it will also provide an improved location for the market and will present a more attractive frontage to the south and west.
6.25 Operations at the existing market building are currently being wound down, and vacancy levels in and around the building are high. The completion of this process later this year will result in a large vacant site in a key town centre location, which will represent an important redevelopment opportunity that could help to further strengthen the town centre’s retail offer.
Updated Health Check of Darwen Town Centre Diversity of Uses
6.26 There were 17 convenience retail outlets in Darwen Town Centre as of March 2011, which represents a very slight reduction from the 18 units recorded in 2009, and the number of convenience outlets as a proportion of total town centre units remains approximately 2 percentage points above the UK average, as shown by Appendix 1c. The same table shows that the proportion of town centre floorspace used for convenience retail is twice the UK average. As in Blackburn, a significant proportion of Darwen Town Centre’s convenience floorspace is accounted for by the markets, which are included in Experian’s ‘greengrocers and fishmongers’ GOAD category.
6.27 Qualitatively, the town centre’s convenience offer seems in good health, with representation from Sainsbury’s, Lidl, Netto (which will be converted to an Asda fascia in due course) and Iceland, all of which operate modern, well-kept stores. Additionally, Darwen market operates three days a week and represents an important part of to the town’s convenience retail offer.
6.28 The comparison retail offer in Darwen Town Centre, conversely, is more limited. In numeric terms, the town centre is under-represented relative to the UK average both in terms of the proportion of town centre units and the proportion of total town centre floorspace. Clothes stores in particular are poorly represented, with only two outlets in each of the ‘women’s, girls and children’s clothing’ and ‘mixed and general clothing’ sub-sectors, and no outlets in the ‘men’s and boys’ wear’ sub-category (although there is a menswear shop which falls just outside the area of the Town Centre that is covered by the GOAD plan).
6.29 However, the numeric under-representation in the comparison sector is not unexpected for a town of Darwen’s size with a larger neighbour (according to Experian, Blackburn Town Centre contains around 151,000 sq.m of gross floorspace compared to approximately 41,700 sq.m of gross floorspace in Darwen Town Centre). Apart from the limited fashion retail offer, the comparison retail offer in Darwen Town Centre generally appears to be in reasonably good health, with most of the other GOAD sub-sectors represented. DIY, hardware/household goods stores and chemists are particularly well-represented numerically in the town centre while jewellers and sports/hobby shops are under-represented.
Blackburn with Darwen Retail Capacity Study
Final Report | June 2011 60
Proportion of Vacant Street Level Property
6.30 The proportion of vacant units in Darwen Town Centre is 16.7 per cent, higher than the national average of 12.9 per cent, although the proportion of vacant floorspace (11.2 per cent) is almost identical to the national average (11.3 per cent). Whilst the proportion of vacant town centre units has risen slightly since 2009, when SAA recorded the vacancy rate (in terms of units) at 16.0 per cent, the rise has been by less pronounced than the increase in the national average, which has risen by approximately 2.5 percentage points over the same period.
6.31 Furthermore, the absolute number of vacant units in Darwen Town Centre has actually declined slightly since 2009, from 28 to 25, and although Appendix 2 shows clusters of vacant units in the northern and southern parts of the town centre – at Duckworth Street and at Bridge Street/Bolton Road – there are no particularly acute concentrations of vacant units in the centre.
Pedestrian Flows
6.32 We last visited Darwen Town Centre on a Wednesday afternoon in March 2011. Footfall throughout the centre was light, and Bridge Street was particularly quiet, which probably explains the cluster of vacant units in this part of the town centre.
State of Town Centre Environmental Quality
6.33 Buildings adjacent to School Street have recently been upgraded, and Market Street/The Circus are pleasant and well-landscaped, which means that the environmental quality in the heart of the town centre is reasonably good. Further out, the quality of the physical environment is a little lower; the town centre peters out to the north along Duckworth Street and to the north east along Railway Road, with the units in these areas generally being less well-kept. In the southern part of the town centre, Bridge Street has been pedestrianised but the street still seems quite run-down.
Summary
6.34 In our assessment, the health of Darwen Town Centre has not changed significantly since 2009. The levels of vacancy and low footfall in the Bridge Street area give some cause for concern although the centre's overall level of vitality and viability remains good.
Assessment of Qualitative Need Comparison Goods Sector
6.35 The household survey of January and February 2010 found that Blackburn Town Centre accounted for 28 per cent of the comparison goods expenditure available to residents in the catchment area for this current study (the CpCA). Whilst this makes Blackburn the dominant centre within the CpCA by some considerable margin, we nevertheless consider that it is a relatively modest level of retention for a centre such as Blackburn, which is accessible and is the principal centre within the Borough. In our assessment there is also scope to improve the overall level of comparison expenditure that is retained by the CpCA as a whole, which was just under 58 per cent in February 2010.

Blackburn with Darwen Retail Capacity Study
Final Report | June 2011 61
6.36 We acknowledge that residents will inevitably continue to be attracted to the shopping facilities in other competing centres such as Bolton and Preston, but Blackburn should be able to better meet localised comparison goods shopping needs, so that residents do not need to travel beyond the Borough for basic comparison goods items. We therefore suggest that the main priority in the comparison sector is to support the provision of additional ‘high street’ stores in Blackburn.
6.37 The process of improving the breadth and depth of Blackburn Town Centre’s fashion retail offer has already taken a significant step forward through the recent extension of The Mall. As discussed above, this development has attracted a range of well-known high street fashion retailers to the town and enabled other existing retailers to trade from larger units. The Mall scheme will therefore go some way towards improving Blackburn Town Centre’s comparison retail market share, and the imminent relocation of Blackburn Markets to the lower ground floor of The Mall will further boost the attractiveness of Blackburn as a retail destination.
6.38 Nevertheless, even accounting for the positive changes described above, we consider that Blackburn Town Centre is still not performing to its full potential. Away from The Mall, much of the property offer in Blackburn Town Centre consists of small-scale, out-dated units that are not suited to retailers’ operational requirements. There is therefore a need to provide additional large, modern retail units in the town centre to attract more ‘high street’ multiples that could further enhance the town centre’s retail offer. The relocation of the Markets will free up a substantial development opportunity which could potentially accommodate some additional comparison retail floorspace. We cover this and other opportunities in greater detail in Section 7.
6.39 We noted in our health checks that Darwen Town Centre does not have a strong comparison retail offer. However, whilst it is desirable to stem the loss of market share in Darwen’s non-food sector, it is important that there is a realistic prospect of delivering any of the needs identified by the study. We do not consider that the market will have any appetite for significant comparison retail development in Darwen and so we consider that the majority of the identified capacity for additional comparison retail floorspace should be directed to Blackburn as the Borough's highest-order centre.
Convenience Goods Sector
‘Gap’ Analysis of Existing Provision
6.40 Our gap area analysis identifies the existing pattern of retail provision, taking account of retail catchments and levels of accessibility to such facilities. Convenience goods shopping should be done on as localised basis as possible, therefore an assessment which identifies any ‘gap areas’ is crucial to ensure that all catchment area residents have adequate access to a choice of facilities. Indeed, this is even more relevant in areas characterised by high levels of deprivation; in such areas, car ownership is likely to be lower, and it therefore becomes even more important to ensure ease of accessibility to a range of convenience goods shopping facilities.

Blackburn with Darwen Retail Capacity Study
Final Report | June 2011 62
6.41 Our analysis of gap areas is based on the following considerations:
proximity to existing foodstores and proximity to a foodstore commitment; levels of deprivation, using the Index of Multiple Deprivation (IMD); qualitative factors based on the findings of the health check audits; and localised convenience goods retention rates, as informed by the findings of the
household survey.
6.42 Figure 6.1 below highlights several broad locations for gap areas. These areas are defined as those which are not within:
five minutes drivetime of a foodstore or foodstore commitment with a floorspace of up to 2,500 sq.m sales area; or
ten minutes drivetime of a foodstore or foodstore commitment with floorspace of 2,500 sq.m sales area or more.
6.43 Within the CvCA, it can be seen that the drivetimes correspond almost exactly with the main concentrations of population, so that the only areas which are beyond 10 minutes drivetime from a food superstore37 are the thinly populated rural areas in the north, south-east and south-west of the CvCA – the most significant being that around the village of Edgworth.
6.44 Our drivetime analysis therefore throws up few obvious gaps where populous areas are poorly served by convenience retail facilities. Consequently, it is worth looking at the location of foodstores in relation to the IMD rankings, since in more deprived areas car ownership is likely to be low and drivetime is likely to be a less useful measure. Figure 6.2 illustrates these data. Multiple deprivation is highest in Central, South and East Blackburn and in North Darwen; however, it can be seen that most of these areas are comparatively well served by foodstores. The major exception is the area of Zone 2 close to the M65 motorway.
6.45 Analysis of Figures 6.1 and 6.2, therefore, reveals a very localised gap of convenience retail provision within Zone 2 on the eastern edge of Blackburn in the Shadsworth area. This message is reinforced by the existing convenience goods spending patterns, which show that the localised convenience goods retention rate in Zone 2 is less than 5 per cent (see Spreadsheet 14a, ‘Zone 2’ column and ‘Total Zone 2’ row); the second lowest level across the CvCA. However, there are no defined centres located within this area. Moreover, whilst the nearest major foodstores are located beyond a reasonable walking distance from Shadworth, frequent bus services to Blackburn town centre provide easy access to the convenience shopping facilities available in Blackburn Town Centre, as well as the Asda store at Grimshaw Park Retail Park.
37 For the purposes of this analysis we have treated the foodstore commitments identified in Table 5.8 in the same way as existing foodstores.

Blackburn with Darwen Retail Capacity Study
Final Report | June 2011 63
Figure 6.1 Proximity of the Study Area’s Residents to Existing Foodstore Provision

Blackburn with Darwen Retail Capacity Study
Final Report | June 2011 64
Figure 6.2 Index of Multiple Deprivation Rankings
Blackburn with Darwen Retail Capacity Study
Final Report | June 2011 65
Analysis of ‘Over-trading’ of Existing Stores
6.46 The PPS4 Practice Guidance explains that the extent to which the turnover of existing stores significantly exceeds benchmark turnovers may be a qualitative indicator of need, and can also inform quantitative need considerations.
6.47 In assessing levels of ‘over-trading’ in the convenience sector, we consider the current trading position of existing stores relative to their so-called benchmark level.
6.48 The convenience goods expenditure retained by centres and foodstores within the CvCA is set out in Spreadsheet 15a. For the nine largest foodstores within the CvCA, which collectively account for 67 per cent of the aggregate convenience goods expenditure of the CvCA’s residents, the convenience expenditure drawn from the CvCA is summarised in Table 4.10 in Section 4 of this report.
6.49 For seven of the nine main foodstores within the CvCA, which derive most of their convenience goods turnover from residents of the CvCA38, we have made a comparison of survey-based turnover estimates with so-called benchmark turnovers which assume that the stores are trading at company average levels. The analysis, which is set out in Table 6.1, reveals that five foodstores are trading significantly above their company average (Asda at Grimshaw Park Retail Park in Blackburn, Morrisons at Railway Road in Blackburn, Tesco at Hill Street in Blackburn, Sainsbury’s at Hardman Way in Darwen and Aldi at Bolton Road in Blackburn), with the remaining two stores trading slightly below their benchmark level (Morrisons at Queen Street in Great Harwood and Tesco Metro in The Mall in Blackburn). The most significant deviation from benchmark performance is that at Asda at Grimshaw Park Retail Park, Blackburn, which according to our analysis is overtrading by £25.6m, or around 83 per cent above company average.
6.50 These seven stores produce an aggregate figure for overtrading of £50.4m. However, two of the five stores which are over-trading (Sainsbury’s in Darwen and Morrisons in Blackburn) are located within the Borough’s town centres, where strong trading performance is, in principle, to be welcomed unless it causes customer discomfort. If these two stores are excluded, the overall figure for overtrading is £36.1m.
6.51 Page 18 of the PPS4 Practice Guidance, states ‘where existing services are claimed to be overtrading this should be backed up by corroborating evidence such as overcrowding and congestion rather than simply by comparison with a retailer’s company average turnover’. Such analysis is beyond the remit of this study, which would require several visits to each of the main foodstores within the CvCA, on different days of the week.
6.52 If further analysis of trading conditions was to show that there was a particular problem in relation to over-crowding and congestion at the main foodstores, then it might be acceptable to count a proportion of this ‘over-trading’ towards the turnover requirements of new floorspace. However, based on our existing knowledge of these stores, we are not
38 The Tesco and Asda stores in Accrington are located at the edge of the CvCA and are likely to derive a substantial proportion of their trade from beyond the catchment area. We have therefore excluded these stores from our analysis.

Blackburn with Darwen Retail Capacity Study
Final Report | June 2011 66
convinced that there are any particularly acute over-crowding and congestion issues. Whilst we observed the main foodstores in Blackburn and Darwen to be very busy during our recent visits, there were no significant queues at the check-outs and the many spaces remained available within the car parks. Moreover, we have reservations regarding the level of over-trading identified at the Asda store in Blackburn. Our analysis assumes that 56.2 per cent of the total sales area floorspace is used for the sale of convenience goods – the company average floorspace split between comparison and convenience retail. However, the total floorspace of the Asda store in Blackburn of some 5,770 sq.m gross is relatively modest in comparison to the Asda average across the UK, of around 7,780 sq.m gross39. Smaller stores typically accommodate a lower proportion of comparison goods. Indeed, the average proportion of convenience floorspace in Tesco, Morrisons and Sainsbury’s stores is 62.8 per cent, 75.6 per cent and 70.5 per cent, respectively, reflecting their smaller company average store sizes. We therefore consider that the proportion of convenience retail floorspace within the Blackburn store, and therefore the benchmark convenience turnover, is likely to be higher than suggested by our assessment.
6.53 Nevertheless, as an illustration for the Council, if half of the national ‘over-trading’ at existing foodstores (i.e. £18m) was treated as expenditure capacity, then this could support 500 sq.m of additional convenience sales area floorspace in the period up to 2016, rising to 1,300 sq.m net by 2021 and 2,100 sq.m net by 2026. Our estimate assumes that retention rate remains constant at 90 per cent in each of the forecast years and is shown in Spreadsheet 16(a)iii.
6.54 As a guide, the levels of convenience floorspace identified would be sufficient to support the development of a small supermarket of the sort operated by Aldi, Lidl or Waitrose by 2016, or a large supermarket by 2021, such as a small Tesco or a Sainsbury’s Central store. By 2026, this could support the development of a new food superstore, around the size of a typical Tesco or Sainsbury’s.
6.55 We have also analysed the capacity for convenience retail floorspace under a higher population growth scenario, taking into account an allowance for ‘over-trading’ of £18m as shown in Spreadsheet 16(b)iii. If a higher level of population growth across Blackburn with Darwen is assumed, the capacity for convenience retail would rise to 800 sq.m sales area floorspace by 2016, 2,000 sq.m by 2021 and 3,100 sq.m in the period up to 2026.
6.56 The redevelopment or extension of existing 'out-of-centre' foodstores can deliver substantial benefits to their local areas, such as physical regeneration, unlocking key sites, new jobs and an improved retail offer for the locality. However, these benefits would have to be weighed against any negative impacts on existing centres and on emerging proposals in more favoured town centre locations. Such factors would need to be considered as and when planning applications are submitted to the Council. However, given that our gap analysis has not identified any areas of the CvCA that are particularly under-served in terms of convenience retail, our advice is that the Council should seek to direct new convenience
39 IGD Stores Database 2009

Blackburn with Darwen Retail Capacity Study
Final Report | June 2011 67
retail floorspace into its defined centres in the first instance, in line with the strong ‘town centres first’ thrust of PPS4.

Blackburn with Darwen Retail Capacity Study
Final Report | June 2011 68
Table 6.1 Convenience Survey-based Turnover Estimates and Benchmark Turnover Estimates for the Main Foodstores in the Blackburn with Darwen CvCA at 2011 (2006 Price Base)
Main Foodstores within Blackburn with Darwen CvCA
Location of Store
(in, edge or out-of-
centre)
Convenience Sales Area
Floorspace40 (sq.m)
Benchmark Convenience
Sales Density
(£ /sq.m)41
Benchmark Convenience
Turnover (£m)
Survey-Based
Convenience Goods
Turnover (£m)42
Level of Under/ Over
Trading (£m)
Level of Under/Over
Trading (%)
Asda, Grimshaw Park Retail Park, Blackburn Out 2,076 13,279 30.7 56.2 25.6 83.4
Morrisons, Railway Road, Blackburn In 2,293 11,536 37.5 45.1 7.6 20.3
Tesco, Hill Street, Blackburn Out 1,935 11,874 25.5 33.8 8.2 32.2
Sainsbury’s, Hardman Way, Darwen In 992 11,506 12.7 19.3 6.6 52.1
Morrison’s, Queen Street, Great Harwood Edge 1,194 11,536 15.3 15.0 -0.3 -2.0
Aldi, Bolton Road, Blackburn Out 499 6,813 3.8 6.6 2.9 75.6
Tesco Metro, The Mall, Blackburn In 467 11,874 6.2 5.9 -0.2 -3.6
TOTAL 10,086 131.7 182.0 50.4 38.2
TOTAL (Excluding over-trading in town centre stores) 6,170 81.5 117.6 36.1 44.3
40 Our analysis of under-trading/over-trading in the base year assumes a company average floorspace split between convenience and comparison floorspace (derived from Verdict’s UK Grocery Food and Retailers 2010 report, November 2010). 41 The benchmark sales densities are derived from Verdict’s UK Grocery Food and Retailers 2010 report. 42 This is based on the assumption that the survey-based figure represents 90% of the overall spend at the store, and that the remaining 10% comes from outside the CvCA.
Blackburn with Darwen Retail Capacity Study
Final Report | June 2011 69
Convenience Goods Sector
6.57 The household survey of February and March 2011 found that 90.5 per cent of the convenience goods expenditure available to residents of the catchment area (the CvCA) is retained by centres and freestanding stores located within CvCA. Whilst convenience shopping is usually undertaken on a localised basis, this level of retention is still relatively high, and we consider that there is little scope for further improvement. Our analysis of the existing shopping patterns also revealed no parts of the catchment area where there is an acute localised deficiency in convenience goods provision.
6.58 Furthermore, our analysis of the spatial distribution of existing convenience retail provision also found that there are no significant gaps across the Borough. Whilst outlying areas in the south-east and south-west of the Borough are located some distance away from existing convenience retail facilities, these are rural areas containing no defined town or major neighbourhood centres. We also identified a lack of foodstore provision in the Shadsworth area of Blackburn. However, access to convenience retail facilities within and to the east of Blackburn town centre is good and we do not consider that the localised deficiency in this area represents a qualitative need.
6.59 Our analysis of the trading performance of the convenience provision within the CvCA indicated that the Asda store at Grimshaw Park Retail Park is trading at substantially above company average levels, and the other two main out-of-centre foodstores within the CvCA are all also trading at significantly above company average levels. However, we are not aware of any issues relating to over-crowding and congestion in any of the main foodstores, and are not convinced that this represents a qualitative need for additional convenience floorspace.
6.60 If further analysis of trading conditions was to show that there was a particular problem in relation to over-crowding and congestion at the main foodstores, then it might be acceptable to count a proportion of this ‘over-trading’ towards the turnover requirements of new floorspace. However, based on our existing knowledge of these stores, we are not convinced that there are any particularly acute over-crowding and congestion issues.
6.61 Nevertheless, the levels of ‘over-trading’ identified could represent a qualitative need in the convenience retail sector for up to 2,100 sq.m sales area floorspace over the longer-term period to 2026, rising to 3,100 sq.m under a higher population scenario.
6.62 Since we have not identified any areas of the CvCA that are particularly under-served in terms of convenience retail, our advice is that the Council should seek to direct new convenience floorspace into its defined centres in the first instance, in line with the strong ‘town centres first’ thrust of PPS4.
Conclusions in Relation to Qualitative Need 6.63 Taking into account the findings of our updated healthchecks of Blackburn and Darwen
Town Centres, along with other indicators of qualitative need, we have identified a particular qualitative need for the provision of additional large, modern retail units in Blackburn Town Centre to accommodate the requirements of ‘high street’ comparison operators. The lack of ‘high street’ stores in Blackburn is a major deficiency in the centre’s retail offer, which is

Blackburn with Darwen Retail Capacity Study
Final Report | June 2011 70
resulting in the leakage of expenditure beyond the catchment area, and unsustainable patterns of shopping.

Blackburn with Darwen Retail Capacity Study
Final Report | June 2011 71
7 SUMMARY AND RECOMMENDATIONS FOR MEETING IDENTIFIED QUANTITATIVE AND QUALITATIVE NEEDS Introduction
7.1 The purpose of this Retail Study is to provide a robust evidence base on the capacity for additional retail development in forthcoming years. Blackburn with Darwen Borough Council can then use the findings to inform the preparation of its Site Allocations DPD, and as evidence for determining planning applications. In order to assist the Council with this, we pull together, below, the principal findings from the various lines of research and analysis that informed our study, in order to identify key quantitative and qualitative needs. We also discuss potential locations that the Council may wish to consider for accommodating the identified retail needs.
7.2 Firstly, we summarise the findings from our retail capacity analysis, and then we consider specific locations for new retail development against suitability, availability and viability criteria as per PPS4.
Summary of Key Quantitative and Qualitative Needs Comparison Retail Sector
7.3 In Section 5, we presented three scenarios for establishing comparison retail need in the Borough up to 2026. One scenario is based on a static level of expenditure retention (at 57.9 per cent), the second is based on a scenario of rising expenditure retention (in which expenditure retention rises to 63.0 per cent by 2021 and remains at that level thereafter) and the third is based on a scenario of ‘rising, then falling’ retention (in which expenditure retention reaches 62.5 per cent by 2016 but then declines gradually back to 57.9 per cent by 2026). Additionally, for illustrative purposes, we have presented three further scenarios, based on the retention levels set out as above but with a slightly higher level of population growth than that predicted by ONS projections, based on the Council’s aspirations to reach a population of 152,800 by 2026. We recommend that the scenario that the Council should be working towards is the rising retention scenario for the ‘standard’ population growth scenario (that is, the levels of population growth predicted by ONS projections).
7.4 In four of the six scenarios (including the ‘rising retention, standard population growth’ scenario that we are recommending the Council should work towards), comparison floorspace requirements in the period 2010 to 2016 are minimal (less than 1,000 sq.m net in all cases), and in the two remaining scenarios there is a large negative residual requirement for comparison floorspace. This negative figure is primarily due to existing commitments (in particular The Mall, Blackburn, which for the purposes of the comparison goods study has been treated as a commitment), and also to some extent the forecast growth in SFT.
7.5 In the period to 2021, two of the scenarios show a significant requirement for additional comparison retail floorspace – including the ‘rising retention, standard population growth’ scenario, which shows a net requirement for 6,264 sq.m of additional comparison retail sales area floorspace. However, it should be noted that one scenario (‘static retention,

Blackburn with Darwen Retail Capacity Study
Final Report | June 2011 72
standard population growth’) still shows a negative requirement for additional comparison floorspace over this period. The difference between the requirements under these two scenarios emphasises that the Council cannot take growth for granted and should continue to work towards maximising the retention of expenditure.
7.6 In the 2010-26 period, the overall comparison retail floorspace requirement rises to around 16,800 sq.m (sales area) under the ‘rising retention, standard population growth’ scenario. Thus, of the comparison retail floorspace requirements identified for the long-term period 2010-26, around two-thirds arise in the post-2021 period, because of the substantial compounding effects of expenditure growth coupled with population growth over longer time periods. This also corresponds with the period of higher expenditure growth that is anticipated to follow the current downturn in the economy. It should be emphasised that the longer-term forecasts to 2026 should be used with caution and that they should be kept under regular review.
Table 7.1 Quantitative Need in the Comparison Goods Sector (in sq.m, Sales Area)
2010-16 2010-21 2010-26
Standard Population Growth, Static Retention
-7,392 -3,111 6,374
Higher Population Growth, Static Retention
-6,756 -1,929 8,254
Standard Population Growth, Rising Retention
152 6,264 16,841
Higher Population Growth, Rising Retention
803 7,527 18,877
Standard Population Growth, ‘Rising then Falling’ Retention
152 740 6,374
Higher Population Growth, ‘Rising then Falling’ Retention
803 1,940 8,254
7.7 It is important to note that the scale of the requirement set out at the higher end of the forecast range arises as a result of an improvement in the aggregate retention rate over the study period. We consider that the current rate of expenditure retention is relatively low and is capable of improvement. Committed floorspace already planned within the CpCA will result in an uplift in the overall comparison retention rate, and this uplift could be extended further through the delivery of additional high quality comparison retail development. Indeed, it is likely that with the expansion of The Mall in Blackburn Town Centre, some improvement in expenditure retention has already taken place. We suggest that the comparison retail capacity identified in Table 6.1 should be directed towards Blackburn

Blackburn with Darwen Retail Capacity Study
Final Report | June 2011 73
Town Centre itself, which will need to respond to retail developments in other competing centres across Central Lancashire and elsewhere.
7.8 In terms of qualitative need, we explained in Section 6 that although Blackburn Town Centre has improved in the two years since the last health check, in particular with the expansion and redevelopment of The Mall, there is still significant room for further improvement. Vacancy levels in the town continue to be high, particularly around the old markets building where operations are being wound down in preparation for a move to a new site in The Mall. There is a need for further large, modern retail units in the town centre to accommodate the requirements of ‘high street’ comparison operators. The relative lack of such stores is a major deficiency in the town centre’s retail offer, which is resulting in the leakage of expenditure beyond the catchment area, and unsustainable patterns of shopping.
7.9 In Darwen Town Centre, the comparison retail offer is not extensive but is close to what would be expected for a town of Darwen’s size. There are some vacancies, and the town would benefit from a slightly broader comparison offer, but overall the town centre appears to be in reasonably good health.
Convenience Retail Sector
7.10 In the convenience sector, we have provided two scenarios for establishing convenience retail need in the Borough up to 2026. One scenario is based on the maintenance of a static convenience rate of retention (at 90.5 per cent), and the second scenario considers the effect of improving the retention rate to 93.0 per cent. Additionally, we have considered retail need based on these retention rates and assuming a higher level of population growth. These scenarios are summarised in Table 6.2 below.
7.11 In all four scenarios, there is a negative residual requirement for convenience floorspace in the period up to 2016. Under the two ‘static retention’ scenarios, there is also a negative residual requirement for convenience floorspace in the period until 2021, and even under the two ‘rising retention’ scenarios the residual requirement in the period to 2021 is small (under 1,000 sq.m in both cases). Over the longer-term period to 2026, the quantitative need for convenience retail development is positive in all four scenarios, although still relatively modest in all cases, ranging from 123 sq.m to 2,041 sq.m.
7.12 The convenience retail capacity arising under the rising retention, higher population growth scenario would be sufficient to support a couple of small-sized supermarkets. The additional floorspace could alternatively be provided in the form of a single, larger store or through the extension of an existing store.
Table 6.2 Quantitative Need in the Convenience Goods Sector (in sq.m, Sales Area)
2011-16 2011-21 2011-26
Standard Population Growth, Static Retention
-1,489 -638 123

Blackburn with Darwen Retail Capacity Study
Final Report | June 2011 74
Higher Population Growth, Static Retention
-1,815 -12 1,086
Standard Population Growth, Rising Retention
-618 259 1,044
Higher Population Growth, Rising Retention
-299 909 2,041
7.13 Qualitatively, the provision of convenience retail in Blackburn Town Centre is broadly adequate, with representation from Morrisons, Marks & Spencer and Tesco Metro, in addition to the convenience retail offered by Blackburn Market. Beyond these outlets, however, convenience retail in the town centre is limited and there may be scope for increasing the breadth of the convenience offer. Darwen Town Centre, meanwhile, has a strong and healthy convenience sector, with representation from several supermarkets, including Sainsbury’s, and a successful market. Outside of the two town centres, our gap analysis revealed few major gaps in provision, although there is arguably a minor localised gap in convenience goods provision in the Shadsworth area of Blackburn.
Summary
7.14 We consider that the indicative floorspace requirements that we have identified in this study provide a very useful starting point for the assessment of individual planning applications. However, the floorspace requirements that we have identified should be treated as indicative guidelines only. It will be necessary to carefully consider the merits of individual proposals as and when they arise, taking account of factors including the specific operator, likely sales densities, local ‘need’ factors, the scale of the proposal (in accordance with the requirements of PPS4), and so on.
Recommendations 7.15 In Section 2 of our report, we set out the requirements that PPS4 imposes on LPAs in
preparing the evidence base for development plans; thus, at the local level, the evidence base should:
i assess the detailed need for land or floorspace for economic development, including for all main town centre uses over the plan period;
ii identify any deficiencies in the provision of local convenience shopping and other facilities which serve people’s day-to-day needs;
iii assess the existing and future supply of land available for economic development; and iv assess the capacity of existing centres to accommodate new town centre
development.
7.16 We also refer, in Section 2, to the test of soundness set out in PPS12. This test requires each LPA to demonstrate that its chosen strategy is the most appropriate, when considered against reasonable alternatives, and secondly, that the chosen strategy is effective and deliverable.
Blackburn with Darwen Retail Capacity Study
Final Report | June 2011 75
7.17 Below we assess three potential approaches to meeting identified retail needs in the Borough: focus on Blackburn Town Centre, focus on Darwen Town Centre, and focus on out-of-centre locations. These three approaches are not necessarily mutually exclusive, but it is clear that retail capacity in the Borough is finite and therefore focusing development in any one of these locations will affect deliverability elsewhere.
Blackburn Town Centre 7.18 National, regional and local policy emphasises the need to focus new retail development in
town centres. Blackburn Town Centre is by some way the most significant centre in the Borough, and is the only one specified in the RSS as part of the third tier of priority locations for growth.
7.19 Blackburn Town Centre is the most accessible location in the Borough (and in the wider catchment areas as defined in Section 4), and is therefore the most effective location for locating new retail development in order to maximise retention. Moreover, due to the catchment area of the town, new retail development is more likely to be viable in Blackburn Town Centre than in any of the Borough’s other centres.
7.20 There is one significant site within Blackburn Town Centre which could accommodate a material amount of new retail floorspace, namely, the markets site. We provide our assessment of this key opportunity site below.
Our Assessment of the Markets Site
7.21 The markets site extends to around 2 ha and lies immediately to the east of the newly expanded Mall Shopping Centre. The site is owned by the Council, and contains a dilapidated two-storey 1960s building which is home to Blackburn Market and a number of other small permanent units. The market is currently being wound down prior to its imminent relocation to the lower ground floor of the expanded Mall, and most of the operators of the units surrounding the market have also relocated elsewhere in the town. The site is therefore expected to be fully vacant later in Summer 2011, and there might be a possibility of a larger site being assembled by taking in other adjacent buildings.
7.22 When fully vacated, the markets site will present a prime opportunity for a retail-led redevelopment scheme. The site is in a central location, immediately adjacent to the newly expanded Mall Shopping Centre, and is accessible from car parks and public transport. It will be necessary for any development at the site to be of high quality, but this should not prove a major obstacle to any scheme’s deliverability.
7.23 The Council would like to see a new bus station facility incorporated into any development scheme at the site. This will have a small impact on the overall area that is available for other uses but there is still likely to be around 1.8 ha available.
7.24 The major physical constraint facing the site is the small river which is culverted beneath it. This is likely to present some engineering difficulties for development at the site and will also require Environment Agency access. Again, however, these problems are not expected to be insurmountable.

Blackburn with Darwen Retail Capacity Study
Final Report | June 2011 76
7.25 A development brief has been prepared for the site, which sets out in more detail such details as design, number of storeys, convenience/comparison split, non-retail uses, car parking and so forth. Nevertheless, as a broad indication, we consider that the site may be able to accommodate upwards of 12,000 sq.m of retail floorspace.
Convenience Retail
7.26 The markets site could comfortably accommodate a convenience retail superstore along with car parking and other ancillary uses. Convenience retailers are therefore likely to be interested in the site. The Council has prepared a development brief for the site, which will provide detailed guidance on the type of scheme and the quanta of floorspace that could be achieved at the site.
Comparison Retail
7.27 The markets site could accommodate a substantial amount of comparison retail floorspace. Specific market testing would be required to establish the level of interest in the site for a comparison retail scheme, especially as The Mall has only recently been expanded. However, as our work has shown, there is sufficient expenditure capacity for up to around 18,900 sq.m of new comparison sales area floorspace over the lifetime of the Core Strategy and this is more than sufficient to support a major comparison retail scheme.
Mix of comparison and convenience
7.28 The site is sufficiently large to accommodate a mix of convenience and comparison retail. This would be likely to take the form of one large convenience retail unit (a superstore or large foodstore) together with a significant proportion of comparison retail, in all likelihood anchored by one or two large floorplate units to generate footfall.
Other uses
7.29 In addition to retail, other options may be considered for the site, such as an hotel, commercial leisure or office uses, or a combination thereof.
Darwen Town Centre 7.30 As discussed above, Darwen is a relatively healthy and well-balanced centre. Overall, the
town centre appears to be functioning successfully, although it would benefit from a broader retail offer, in particular in the comparison sector. While Darwen does not offer any opportunity sites on the scale of the markets site in Blackburn Town Centre, it is conceivable that sites with potential for retail development might come forward in and around the town centre within the period of the study.
7.31 However, retail development in Darwen is always likely to be of a smaller scale to that in Blackburn. The town is further down the retail hierarchy, has a smaller catchment area, and is less accessible than Blackburn. Consequently, it is likely that only relatively small scale retail schemes in the town are likely to be viable.
7.32 Our recommendation therefore is that the emphasis in Darwen should continue to be on smaller scale development and on improvement of the town centre offer, as set out in the Core Strategy. This approach will enable the town to grow flexibly without jeopardising investment in Blackburn Town Centre.

Blackburn with Darwen Retail Capacity Study
Final Report | June 2011 77
Out-of-Centre Development 7.33 A third option for retail development in the Borough is to allow retail development in out-of-
centre locations. There is likely to be considerable interest from retailers for development of this sort, particularly in the convenience sector.
7.34 There are potential benefits associated with allowing retail development outside town centres. Such schemes can bring about regeneration benefits, reclaiming derelict sites and potentially unlocking further sites for development. There is also the potential of wider social and economic benefits, bringing jobs and investment to deprived areas, and providing communities with an improved retail offer. Moreover, where expenditure retention levels are low, out-of-centre developments can be a valuable tool in clawing back expenditure which leaks to other destinations outside the Borough.
7.35 However, as we explained in Section 2, national, regional and local policy all emphasise the need to concentrate retail development on town centres, which are the most sustainable and accessible locations. There is a danger that allowing out-of-centre retail development will undermine the health of existing town centres and will jeopardise future investment in the Council’s preferred locations by reducing the overall capacity from available retail expenditure.
7.36 Consequently, we recommend that the Council should generally resist pressure for further out-of-centre retail development, and ensure that any such development that does take place is of a scale which will not jeopardise further development within the Borough’s town centres or result in unacceptable impacts.
Conclusion 7.37 We recommend that the most appropriate way of meeting the Borough’s identified needs
for comparison and convenience retail floorspace will be to exploit the redevelopment opportunity presented by the markets site in Blackburn Town Centre, which will soon provide a prime development site and an opportunity to bolster the improvements to the town centre’s retail offer brought about by the recent expansion of The Mall. A mix of convenience and comparison retail uses at the site would be the most appropriate approach to meeting the retail floorspace needs of the Borough and ensuring that any proposals that emerge for the site are deliverable.


Blackburn with Darwen Retail Capacity Study
Final Report | Date A2