bivariate analysis module 2
TRANSCRIPT
Quantitative Methods in Quantitative Methods in ManagementManagement
Module 2: Bivariate Analysis
N J Jaissy
ObjectiveObjective
Learn of:
� Correlation
� Regression and the assumptions in the regression model
� Coefficient of determination
� Tests of significance for the correlation & regression coefficients
Reference Text booksReference Text books
Reference Text books:
� Levin & Rubin: Statistics for Management
� Srivastava, Shenoy & Sharma: Quantitative Techniques for Management decisions
� Anderson & Sweeney: Business Statistics
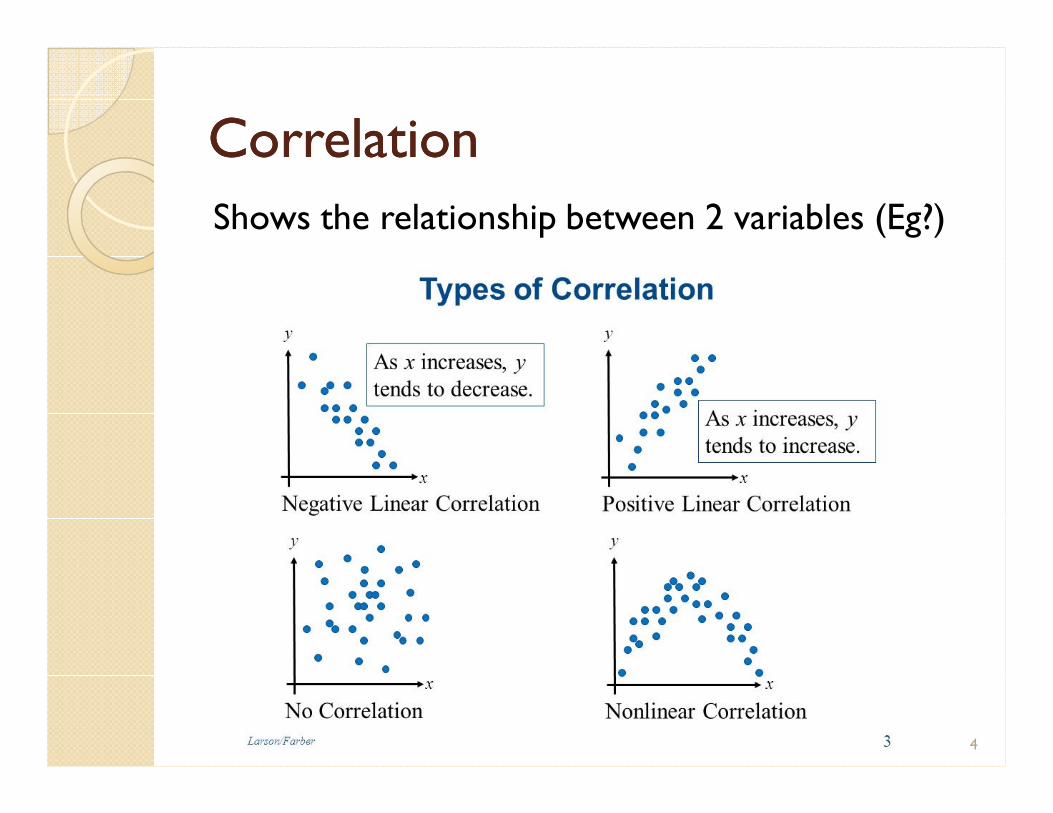
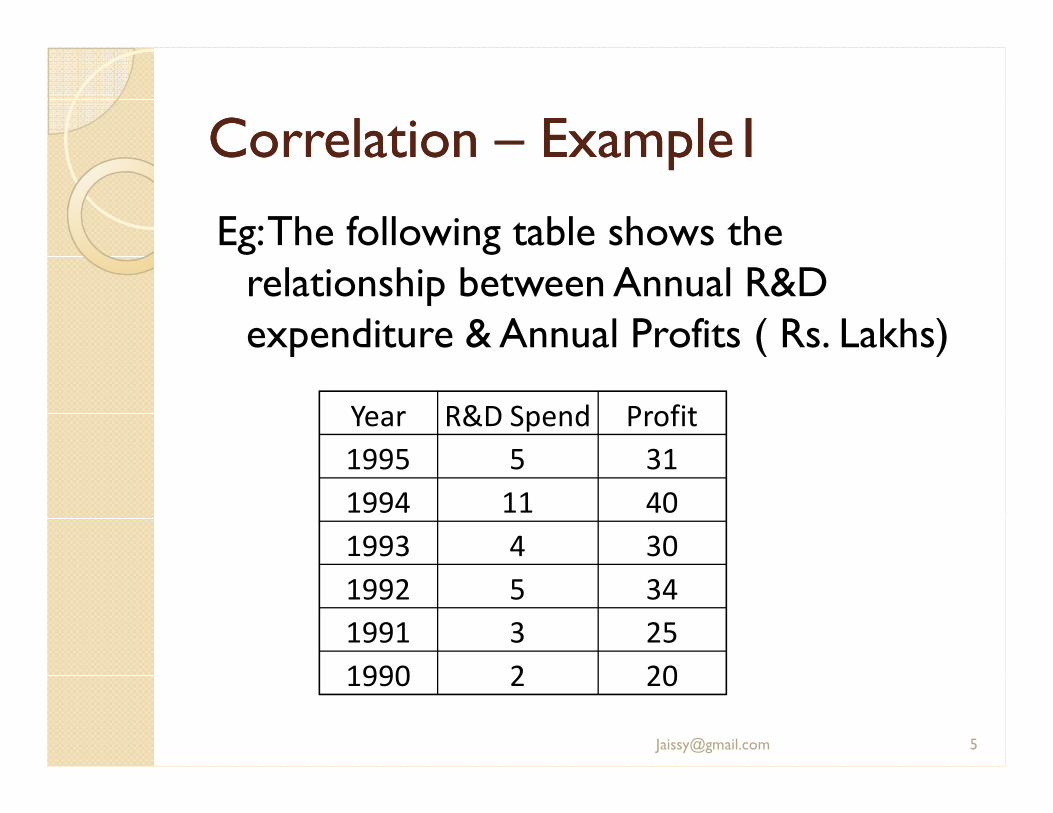
Correlation Correlation –– Example1Example1
Eg: The following table shows the relationship between Annual R&D expenditure & Annual Profits ( Rs. Lakhs)
Year R&D Spend Profit
1995 5 31
1994 11 40
1993 4 30
1992 5 34
1991 3 25
1990 2 20
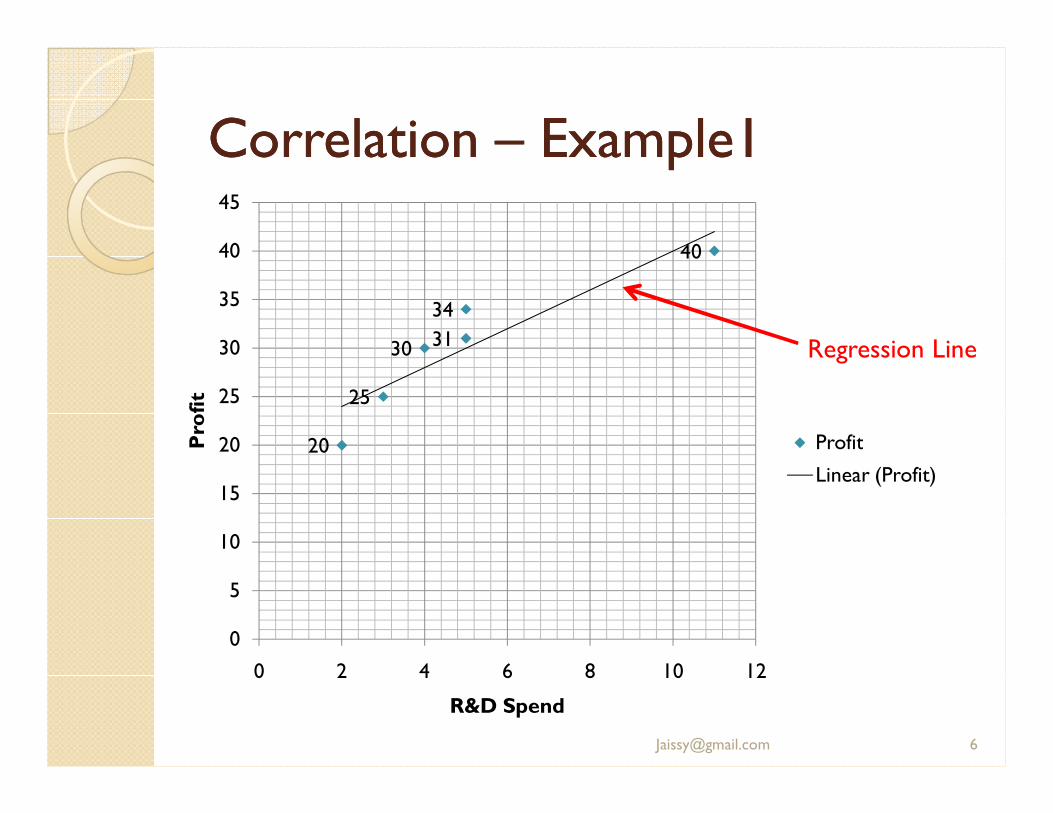
Correlation Correlation –– Example1Example1
31
40
30
34
25
20
0
5
10
15
20
25
30
35
40
45
0 2 4 6 8 10 12
Profit
R&D Spend
Profit
Linear (Profit)
Regression Line

Correlation coefficientCorrelation coefficient
Karl Pearson’s correlation coefficient is an indication of how ‘strong’ the association or correlation is between 2 variables.
It does NOT matter which variable is termed X or Y when computing the correlation coefficient
Cov(X,Y): Covariance between X & Y= avg. product of the delta of X,Y from their meanSx, Sy = Standard Deviation of X, Y
Simplified formula
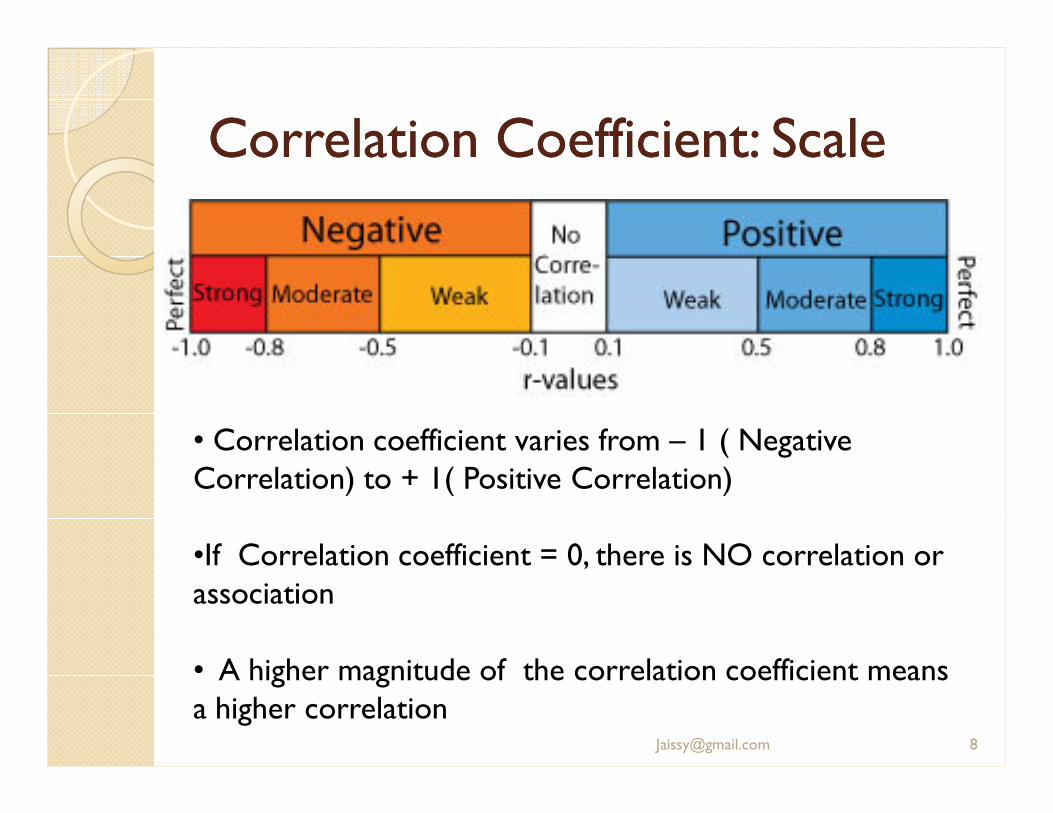
Correlation Coefficient: ScaleCorrelation Coefficient: Scale
• Correlation coefficient varies from – 1 ( Negative Correlation) to + 1( Positive Correlation)
•If Correlation coefficient = 0, there is NO correlation or association
• A higher magnitude of the correlation coefficient means a higher correlation

Correlation CoefficientCorrelation Coefficient
Keep in mind, correlation does NOT imply causality!

Question Set 1Question Set 1
1. The following table shows the relationship between Annual R&D expenditure & Annual Profits. How strong is the correlation. Determine using the correlation coefficient.
Year R&D Spend Profit
1995 5 31
1994 11 40
1993 4 30
1992 5 34
1991 3 25
1990 2 20
Correlation coefficient = 0.9; Very strong correlation
Question Set 1Question Set 1
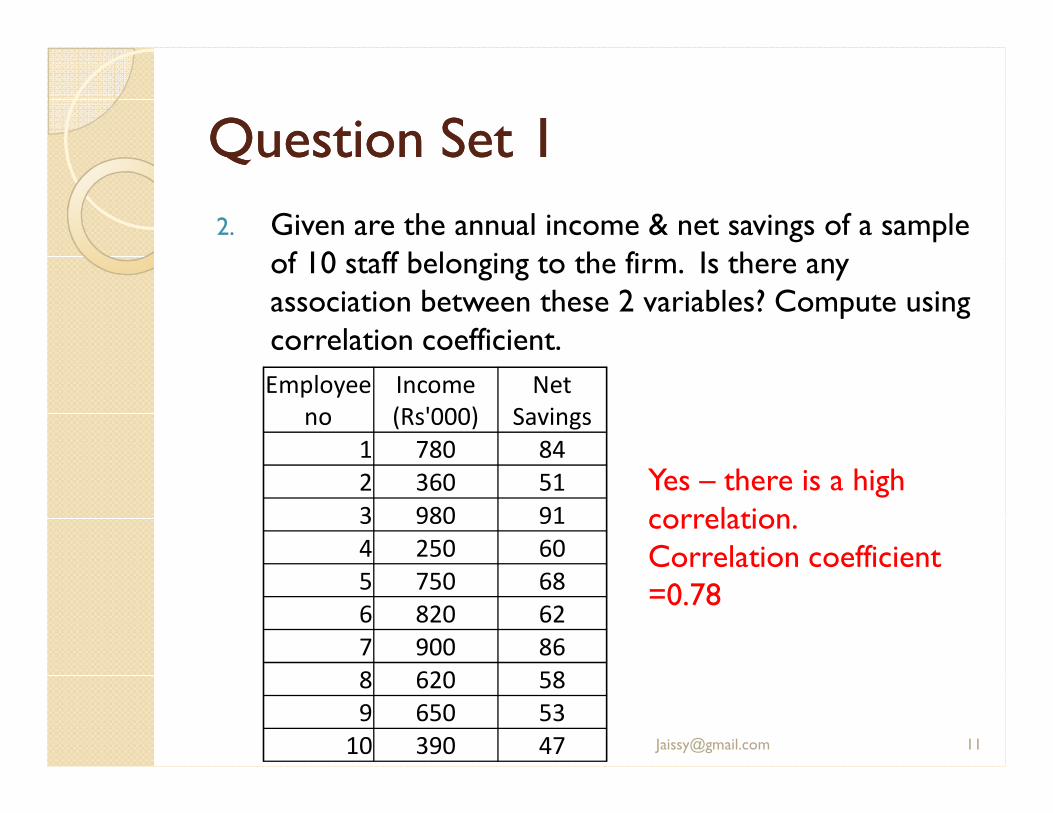
2. Given are the annual income & net savings of a sample of 10 staff belonging to the firm. Is there any association between these 2 variables? Compute using correlation coefficient.
Employee
no
Income
(Rs'000)
Net
Savings
1 780 84
2 360 51
3 980 91
4 250 60
5 750 68
6 820 62
7 900 86
8 620 58
9 650 53
10 390 47
Yes – there is a high correlation. Correlation coefficient =0.78

RegressionRegression
� A correlation shows there is a relationship between 2 variables ( X & Y)
�With regression – we try to ‘fit’ a line to the data points.
� This line can be written as an equation which can then be used for prediction (iefor future values of X, what is Y?)
� Our objective is to find the ‘best fitting’ regression line (i.e. –the line that is closest to all the data points)

Regression Equation ( 2 variables)Regression Equation ( 2 variables)
X = Independent VariableY = Dependent Variable
It DOES matter which variable is termed X or Y
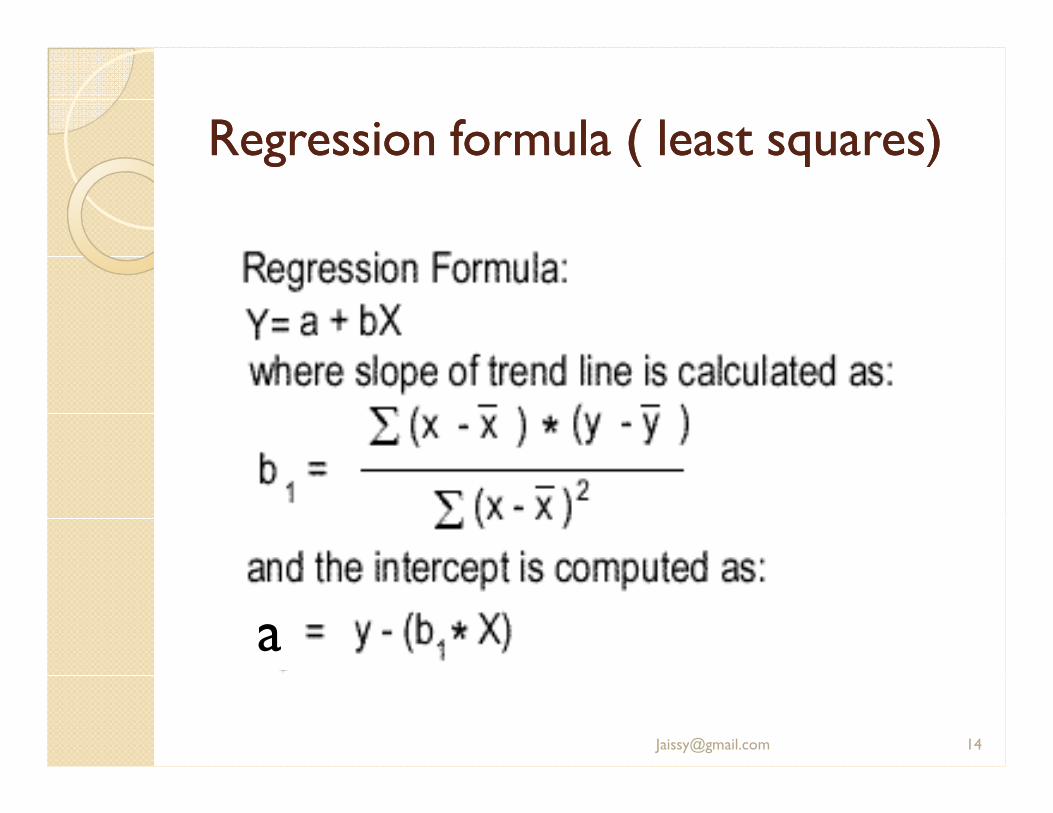
Regression formula(least squares) Regression formula(least squares) ––Short cut method (OPTIONAL!)Short cut method (OPTIONAL!)
This is a short cut formula that can be used instead of the earlier formula – both yield the same answer!

Question Set 2Question Set 2
1. The following table shows the relationship between Annual R&D expenditure & Annual Profits. Given there is a correlation, what would be the profit if R&D spend is 20 L
Year R&D Spend Profit
1995 5 31
1994 11 40
1993 4 30
1992 5 34
1991 3 25
1990 2 20 Figures in Rs L
Profits = 60L
Question Set 2Question Set 2
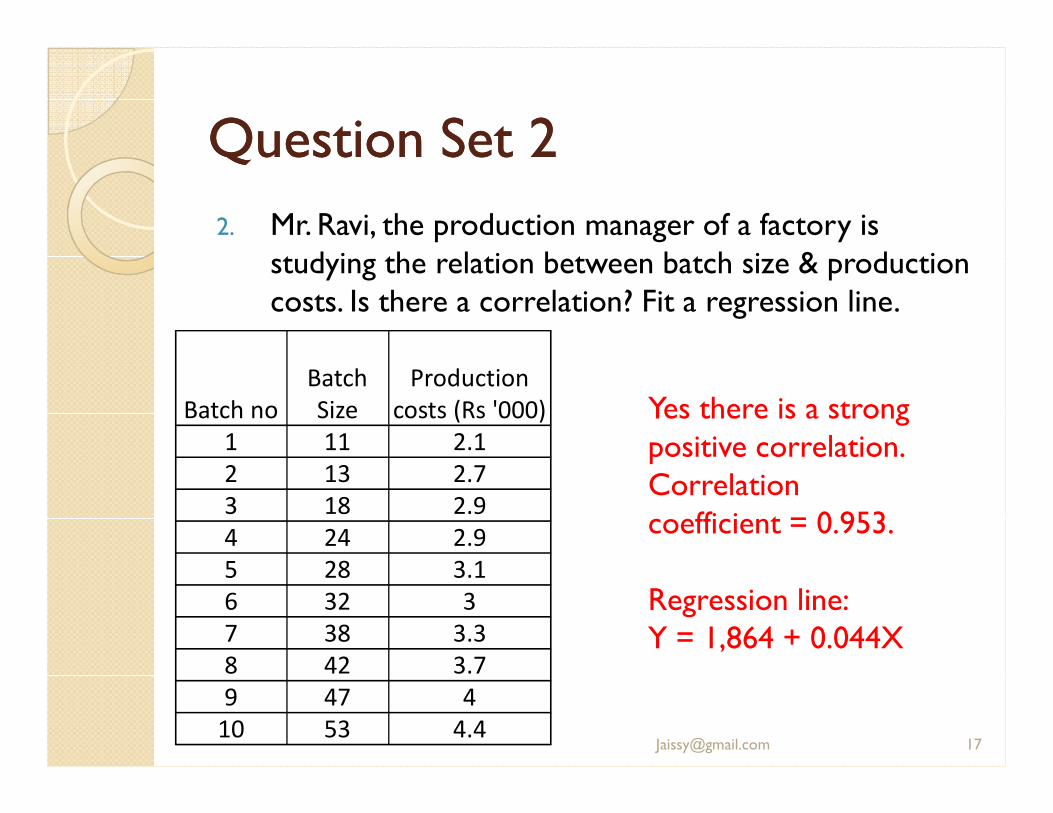
2. Mr. Ravi, the production manager of a factory is studying the relation between batch size & production costs. Is there a correlation? Fit a regression line.
Yes there is a strong positive correlation. Correlation coefficient = 0.953.
Regression line: Y = 1,864 + 0.044X
Batch no
Batch
Size
Production
costs (Rs '000)
1 11 2.1
2 13 2.7
3 18 2.9
4 24 2.9
5 28 3.1
6 32 3
7 38 3.3
8 42 3.7
9 47 4
10 53 4.4

Residual & Standard ErrorResidual & Standard Error
� This gives us the ‘error’ or delta between “actual value of Y” and the projected value of Y given by the regression line
� Ideally, the sum of all the residuals = 0 ( or close to 0). Square of the residuals = sum of the squares of error (SSE)
� Standard error = Standard Deviation of the error of the regression model
Se = standard error of estimateY’ = predicted value of Y using regression formulaYi = actual value of Y n = no of observations

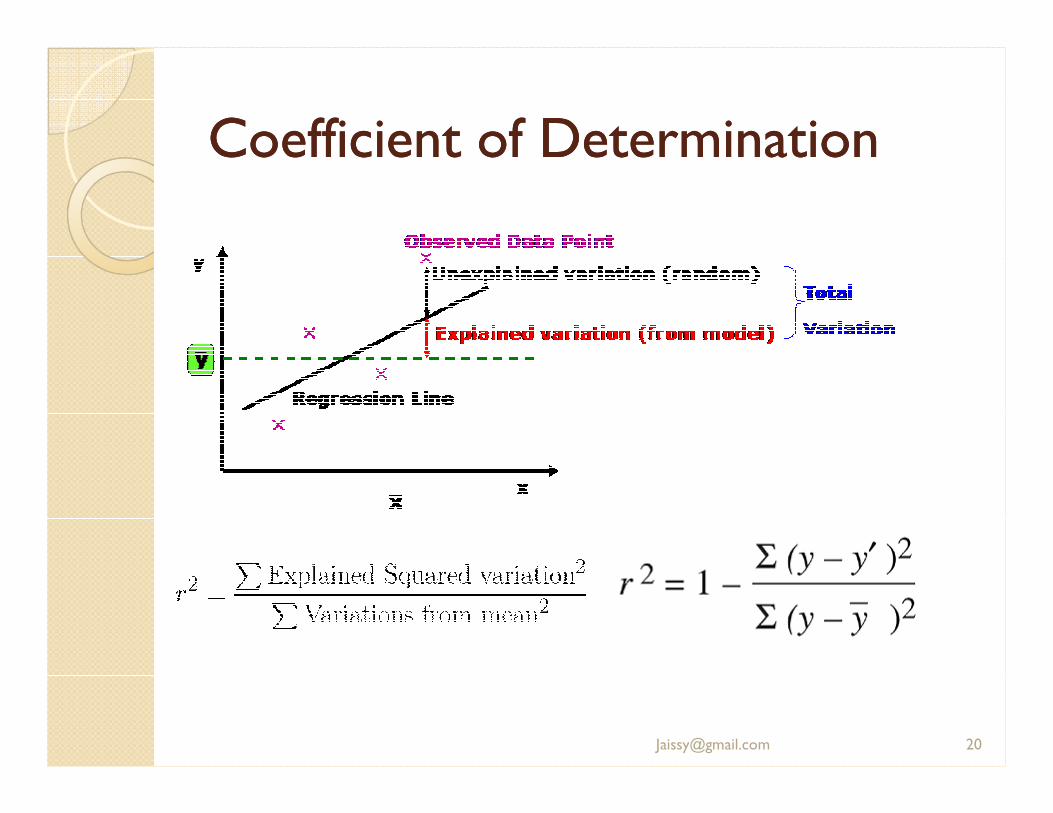
Coefficient of DeterminationCoefficient of Determination
� This gives an indication of how ‘good’ a fit the ‘regression line’ is to the data points
� I.e. How much of the total variation in Y is described or ‘determined’ by the variation in X
Coefficient of determination = (Correlation coefficient)
2
Question Set 2Question Set 2
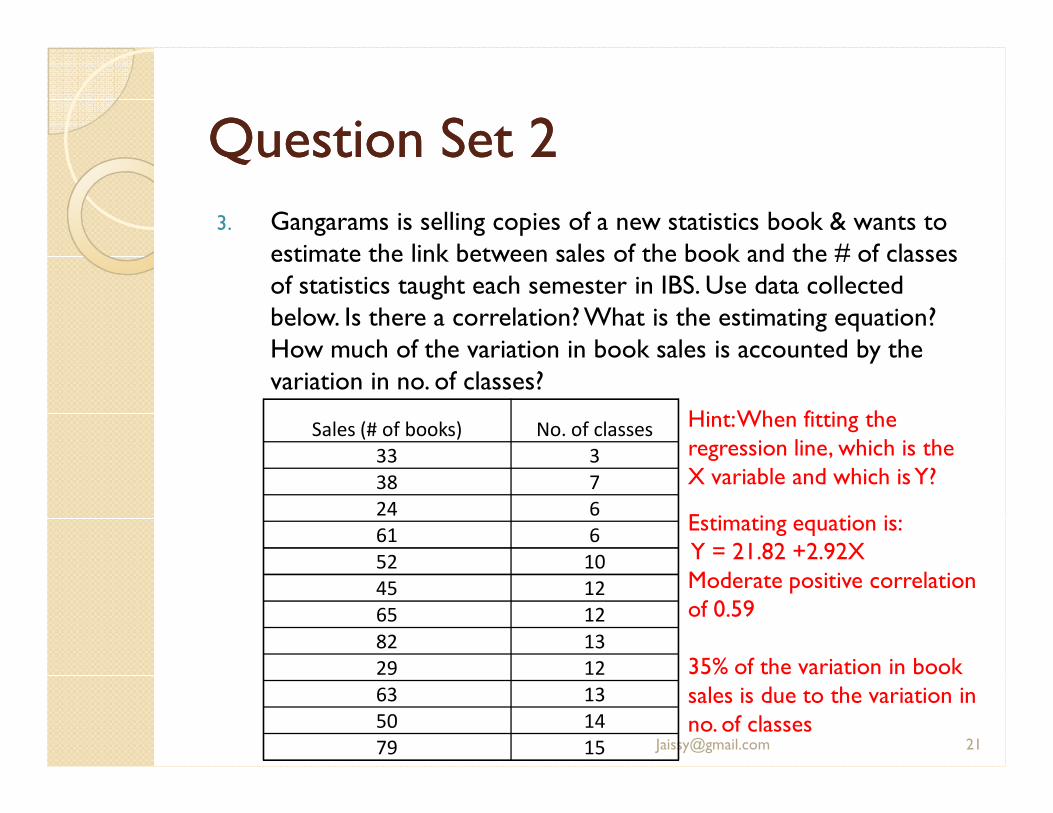
3. Gangarams is selling copies of a new statistics book & wants to estimate the link between sales of the book and the # of classes of statistics taught each semester in IBS. Use data collected below. Is there a correlation? What is the estimating equation? How much of the variation in book sales is accounted by the variation in no. of classes?
Sales (# of books) No. of classes
33 3
38 7
24 6
61 6
52 10
45 12
65 12
82 13
29 12
63 13
50 14
79 15
Hint: When fitting the regression line, which is the X variable and which is Y?
Estimating equation is: Y = 21.82 +2.92XModerate positive correlation of 0.59
35% of the variation in book sales is due to the variation in no. of classes

Spearman’s Rank CoefficientSpearman’s Rank Coefficient
� Used when we want to find the correlation between 2 sets of data that is ordinal (i.e has order).
Where; n = no. of paired data entriesd = delta between the Ranks of a paired data entry
Question Set 3Question Set 3
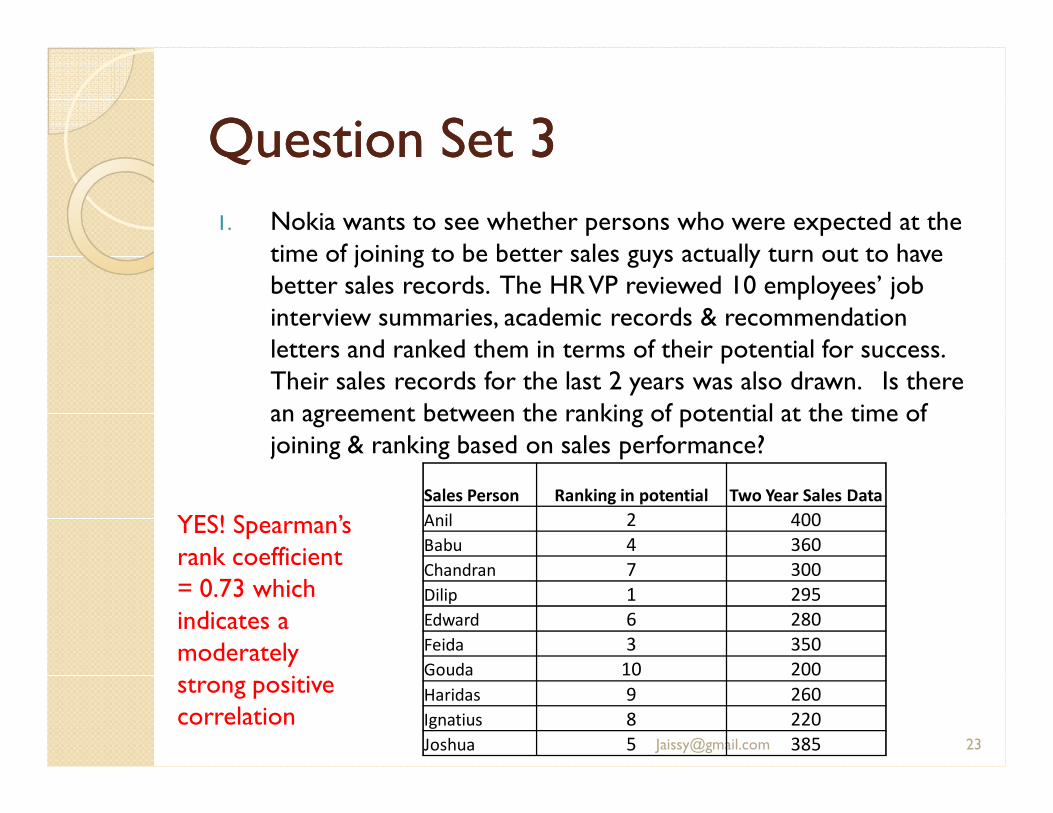
1. Nokia wants to see whether persons who were expected at the time of joining to be better sales guys actually turn out to have better sales records. The HR VP reviewed 10 employees’ job interview summaries, academic records & recommendation letters and ranked them in terms of their potential for success. Their sales records for the last 2 years was also drawn. Is there an agreement between the ranking of potential at the time of joining & ranking based on sales performance?
Sales Person Ranking in potential Two Year Sales Data
Anil 2 400
Babu 4 360
Chandran 7 300
Dilip 1 295
Edward 6 280
Feida 3 350
Gouda 10 200
Haridas 9 260
Ignatius 8 220
Joshua 5 385
YES! Spearman’s rank coefficient = 0.73 which indicates a moderately strong positive correlation
Question Set 3Question Set 3
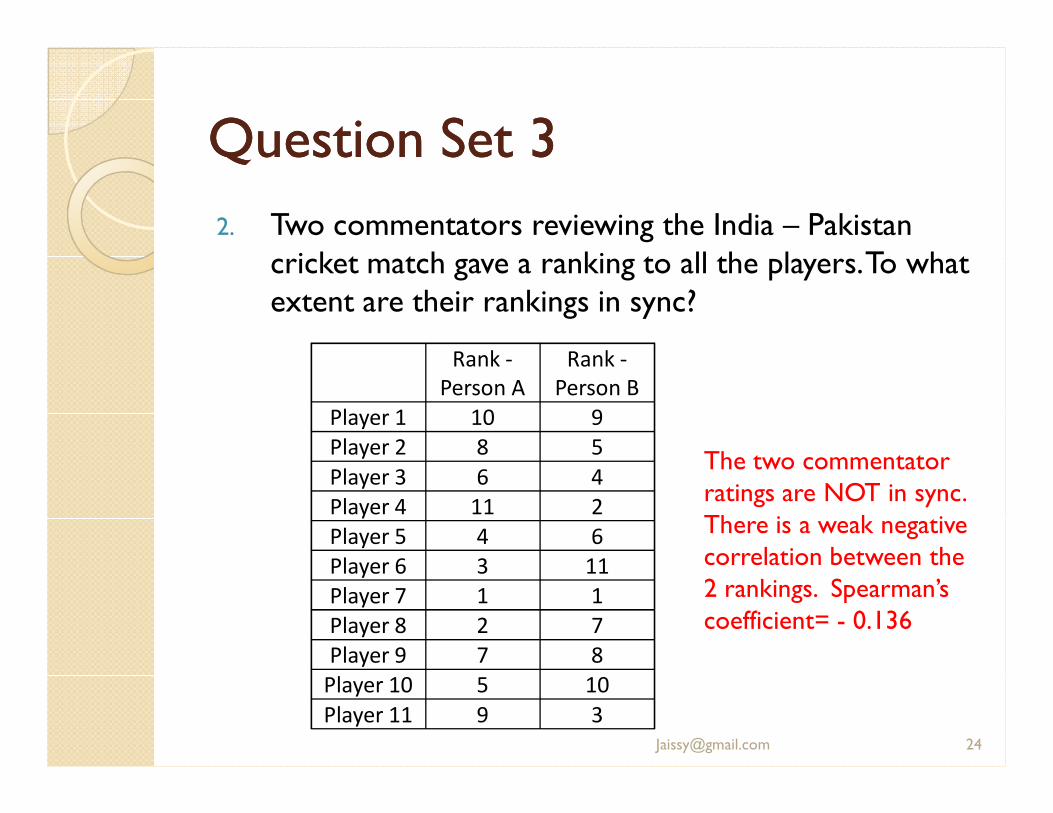
2. Two commentators reviewing the India – Pakistan cricket match gave a ranking to all the players. To what extent are their rankings in sync?
Rank -
Person A
Rank -
Person B
Player 1 10 9
Player 2 8 5
Player 3 6 4
Player 4 11 2
Player 5 4 6
Player 6 3 11
Player 7 1 1
Player 8 2 7
Player 9 7 8
Player 10 5 10
Player 11 9 3
The two commentator ratings are NOT in sync. There is a weak negative correlation between the 2 rankings. Spearman’s coefficient= - 0.136