bistatic radar passive hitchhiker · background (1) advantages of passive radar using broadcast...
TRANSCRIPT

Passive Hitchhiker Bistatic Radar
Boston University EC707 Project, Fall 2013
Michael Hirsch, Matthew Kidd
Motivation● Need for automatic blind classification of targets of
interest● Also a need to better quantify when a signal of
opportunity is useful based on instantaneous self-ambiguity
Background (1)Advantages of Passive radar using broadcast FM/TV transmitters● Environmentally Friendly● Low probability of intercept ● (1,000) $1,000 RX vs. (1) $1,000,000 monostatic radar● Persistent “staring” over wide regions of interest● Ability to simultaneously examine features over a range
of k

Background (2)● Receivers of late 1990s only capable of recording 5 sec.
per minute due to HDD space limitations● PCs jumped orders of magnitude in capability● Late 1996 Manastash Ridge made initial E-region
ionosphere observations● Technology marched on vis-a-vis multi-mode
software-defined cell phone base stations...

Passive FM Radar (1)
● Many commercial FM transmitters in US and worldwide
● Antenna pattern is directional, with power concentrated along the ground
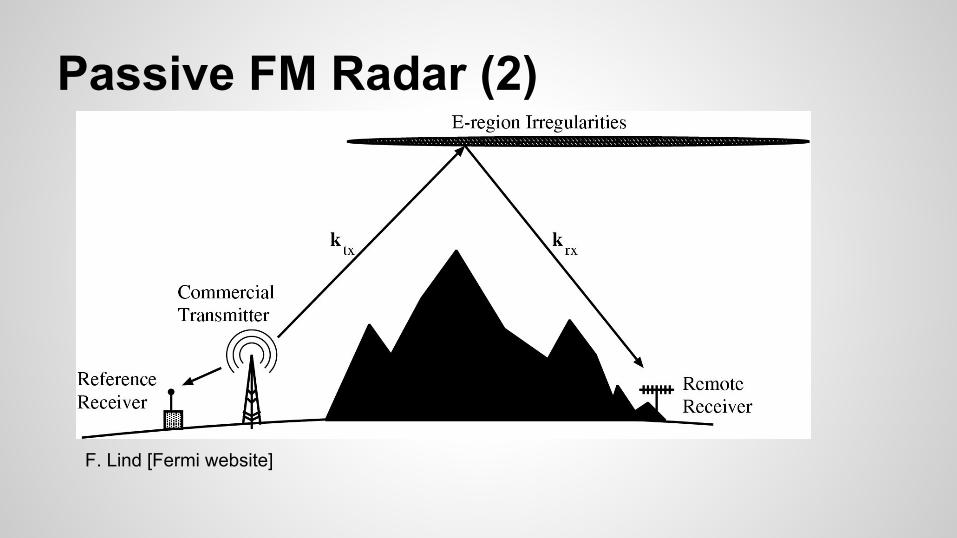
Passive FM Radar (2)
F. Lind [Fermi website]
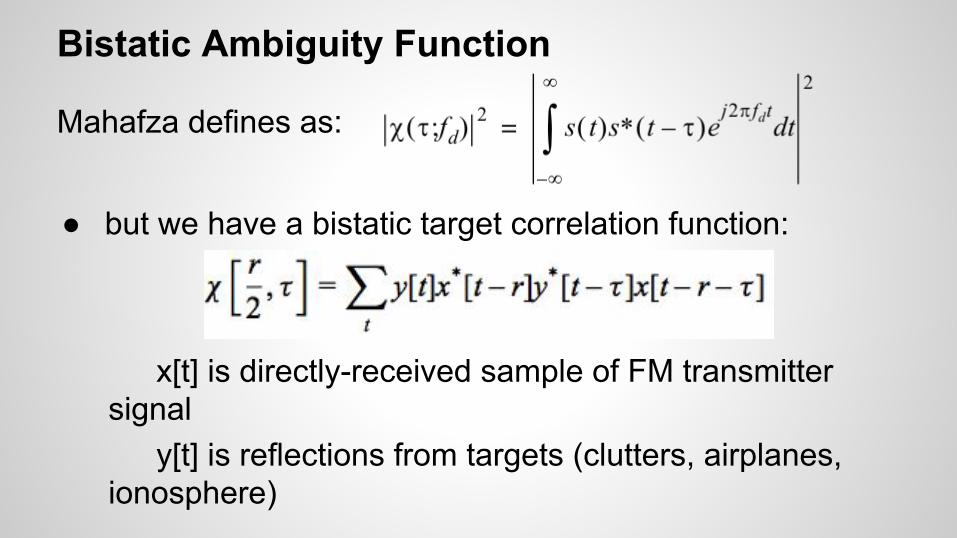
Bistatic Ambiguity Function
Mahafza defines as:
● but we have a bistatic target correlation function:
x[t] is directly-received sample of FM transmitter signal
y[t] is reflections from targets (clutters, airplanes, ionosphere)
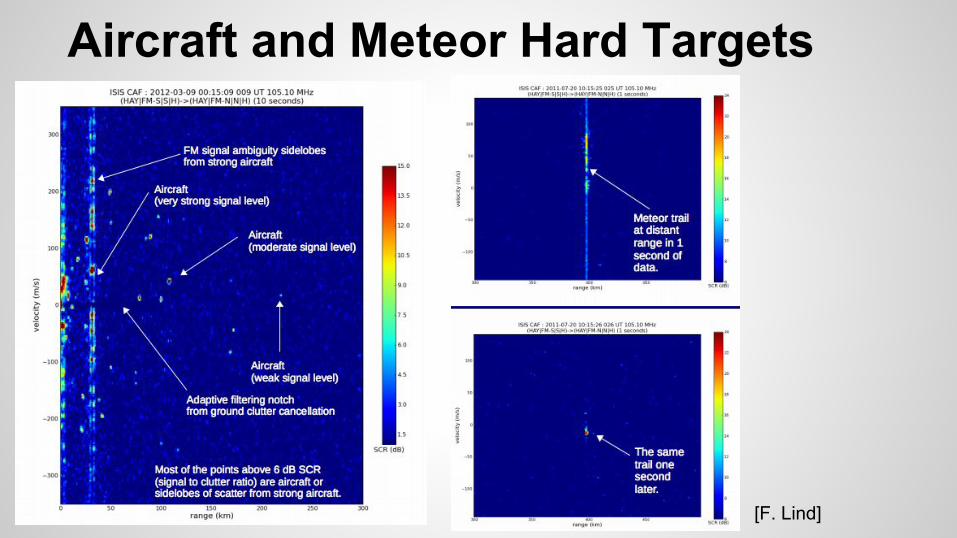
Aircraft and Meteor Hard Targets
[F. Lind]
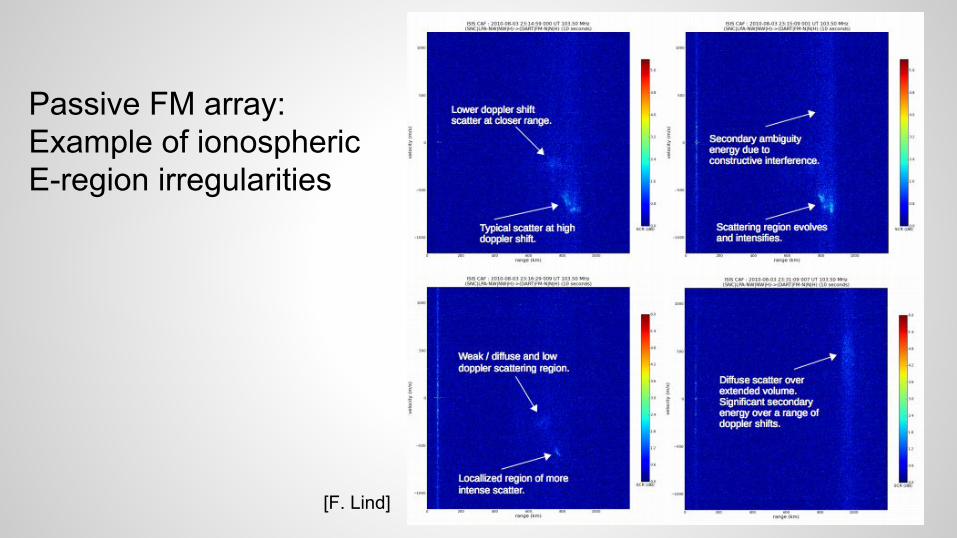
Passive FM array: Example of ionospheric E-region irregularities
[F. Lind]
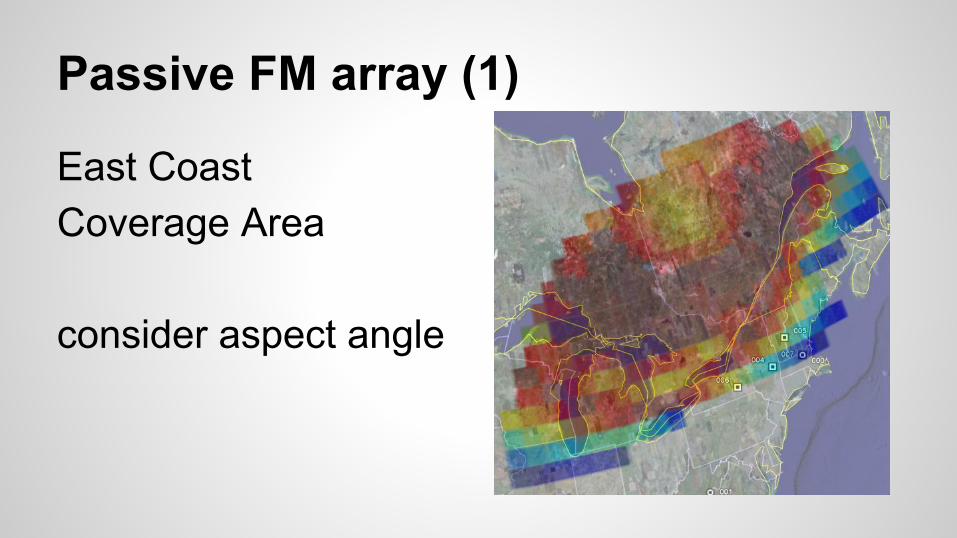
Passive FM array (1)
East Coast Coverage Area
consider aspect angle

Passive FM array (2)Substantial interference in FM band --> a variety of bistatic and multistatic observation geometries
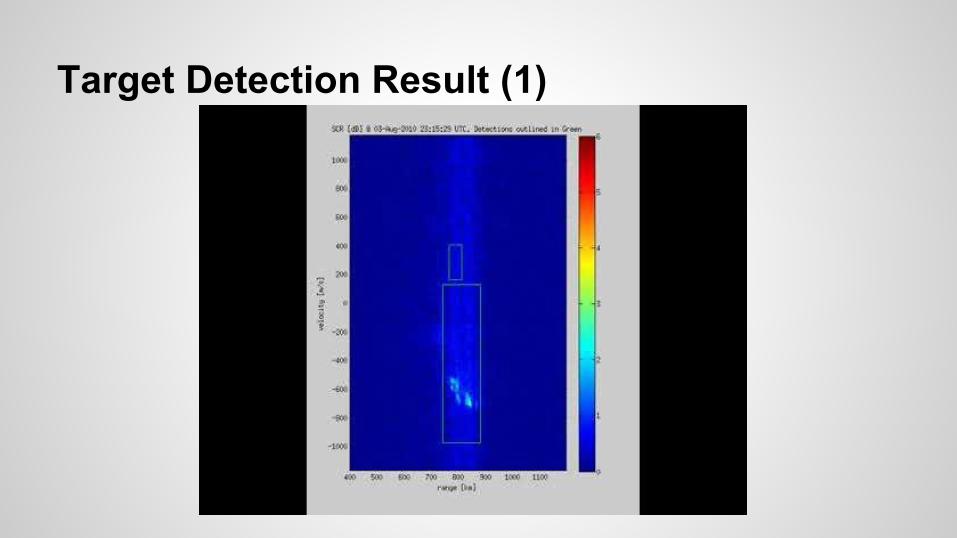
(Example from 2010 Aug 03 E-region scatter event)
[SRTM elevation data]
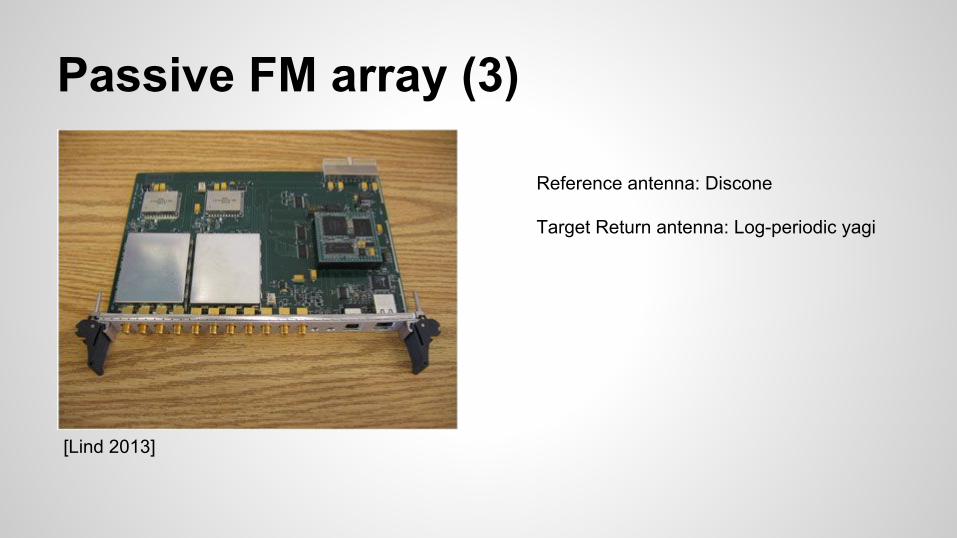
Passive FM array (3)
●
[Lind 2013]
Reference antenna: Discone
Target Return antenna: Log-periodic yagi
Project Results
We split the project work into two categories● Blind target detection● Understanding how the content of the FM
broadcast affects the quality of the ambiguity function
Automatic Target Detection Requirements (1)
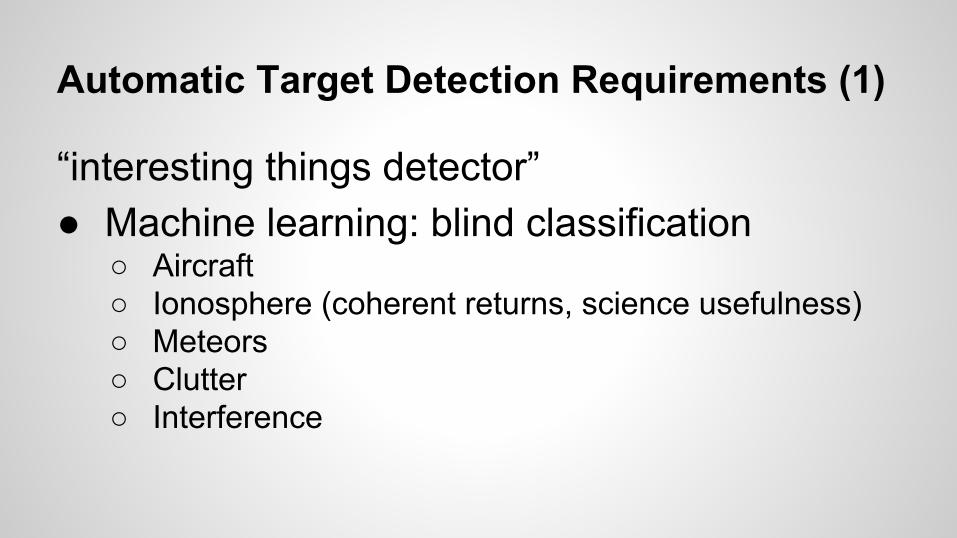
“interesting things detector”● Machine learning: blind classification
○ Aircraft○ Ionosphere (coherent returns, science usefulness)○ Meteors○ Clutter○ Interference
Automatic Target Detection Requirements (2)
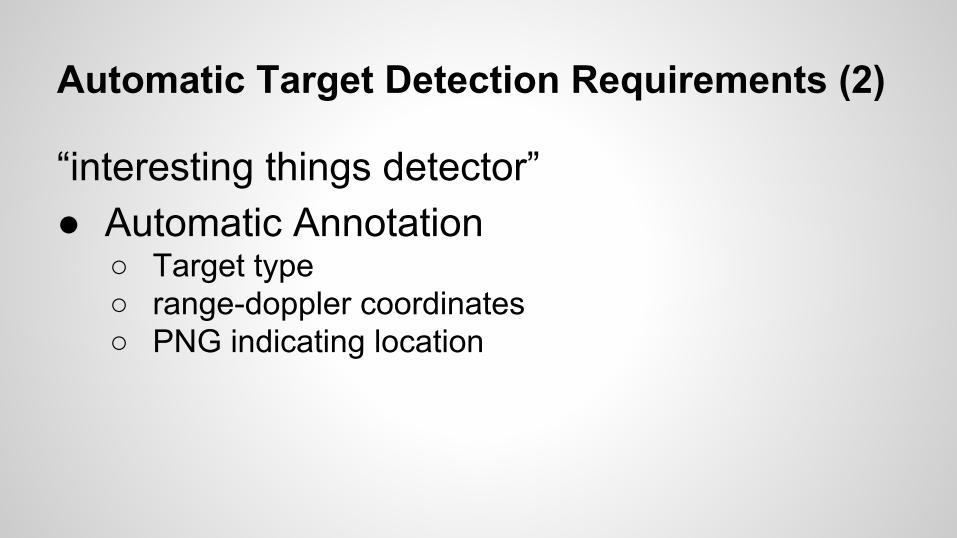
“interesting things detector”● Automatic Annotation
○ Target type○ range-doppler coordinates○ PNG indicating location
Automatic Target Detection Requirements (3)
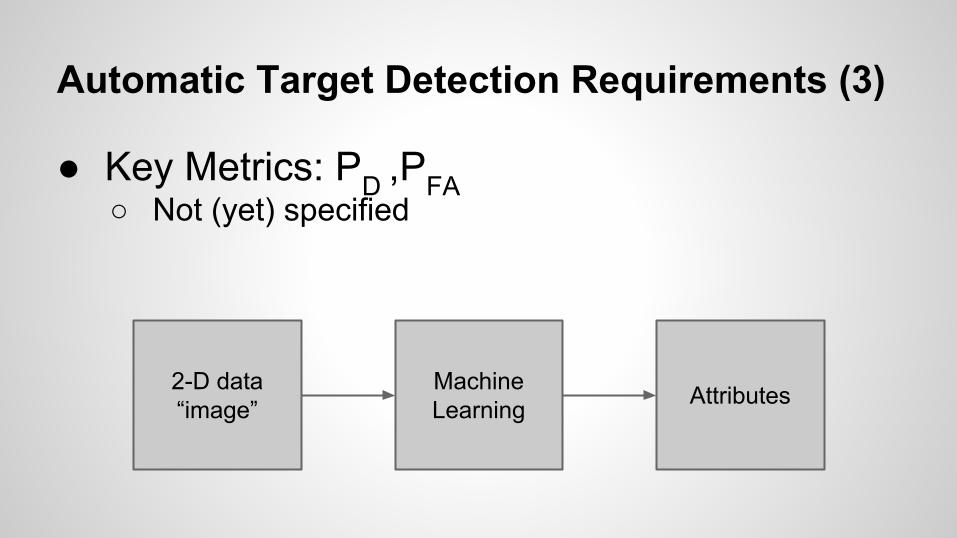
● Key Metrics: PD ,PFA○ Not (yet) specified
2-D data “image”
Machine Learning Attributes
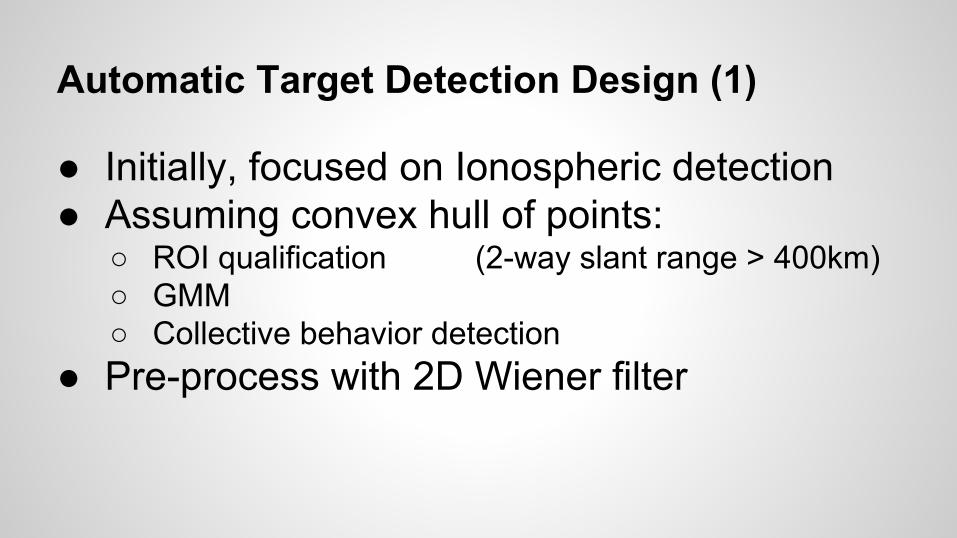
Automatic Target Detection Design (1)
● Initially, focused on Ionospheric detection● Assuming convex hull of points:
○ ROI qualification (2-way slant range > 400km)○ GMM ○ Collective behavior detection
● Pre-process with 2D Wiener filter
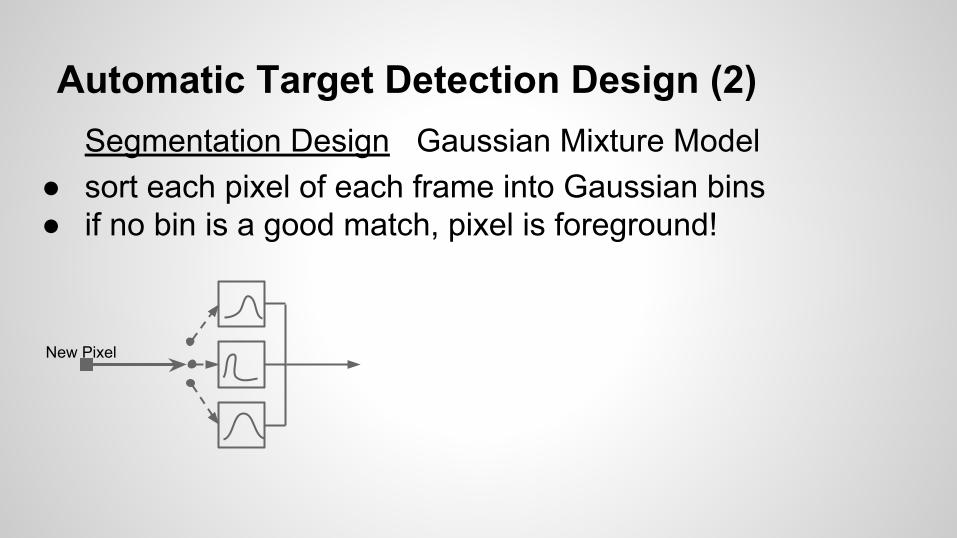
Automatic Target Detection Design (2)Segmentation Design Gaussian Mixture Model
● sort each pixel of each frame into Gaussian bins ● if no bin is a good match, pixel is foreground!
New Pixel

Automatic Target Detection Design (3)Segmentation Design Morphological Erosion/Dilation
● Erosion A B Eliminate isolated pixels● Dilation A B Connect nearby pixel “islands”
New Pixel Erosion
Dilation
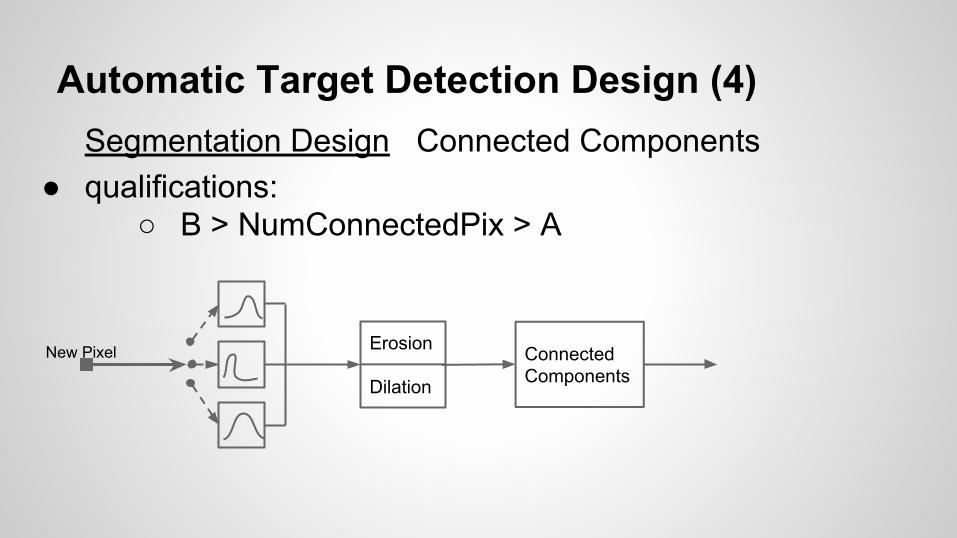
Automatic Target Detection Design (4)Segmentation Design Connected Components
● qualifications:○ B > NumConnectedPix > A
New Pixel Erosion
Dilation
Connected Components

Automatic Target Detection Design (5)Classification / Annotation
● Annotate HDF5 files with detections and measured characteristics
New Pixel Erosion
Dilation
Connected Components
2 Kalman Tracking
Annotate
Display
Alert
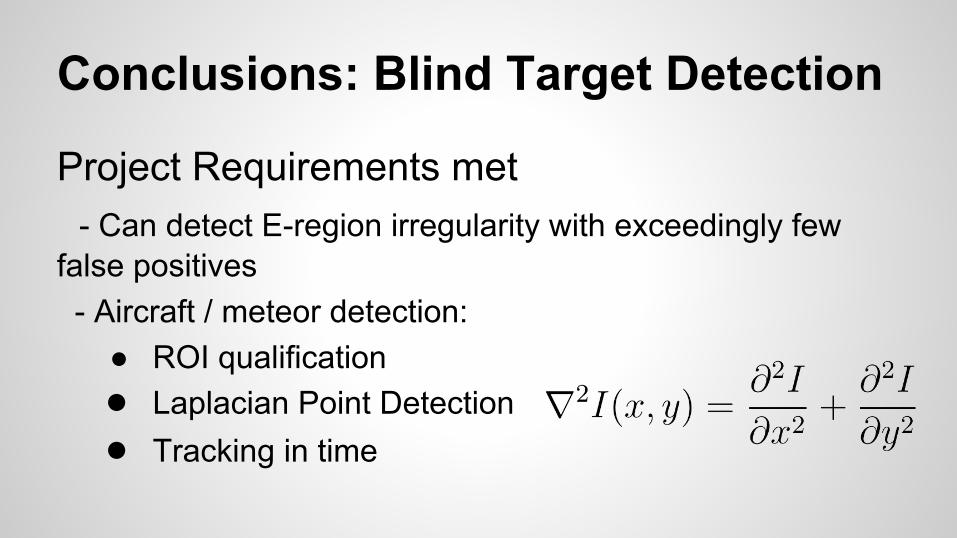
Conclusions: Blind Target Detection
Project Requirements met - Can detect E-region irregularity with exceedingly few false positives - Aircraft / meteor detection:
● ROI qualification● Laplacian Point Detection● Tracking in time
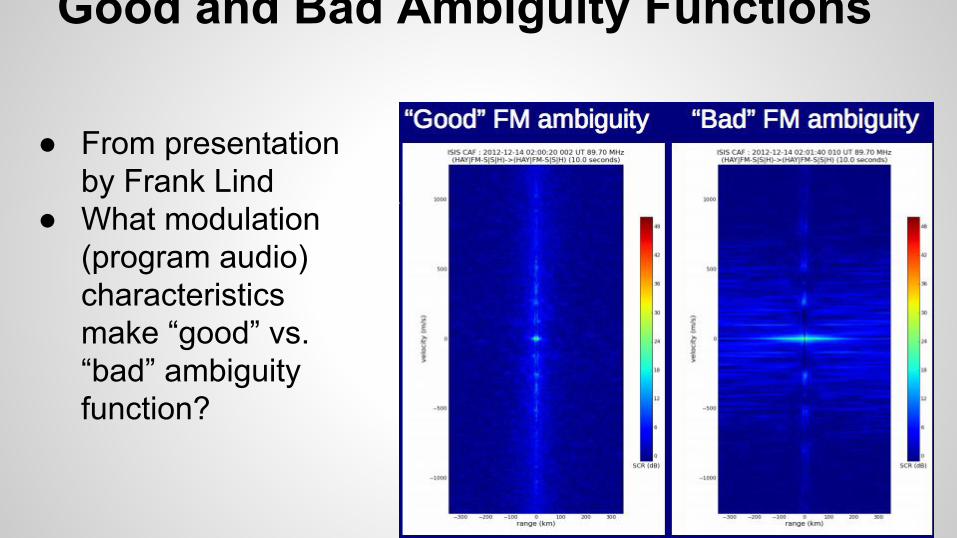
Good and Bad Ambiguity Functions
● From presentation by Frank Lind
● What modulation (program audio) characteristics make “good” vs. “bad” ambiguity function?

Measures of AF and and FM signal “goodness”
● Where a and b are the I and Q data
● Estimate of bandwidth at each sample
Instantaneous Bandwidth: Peak to Side Lobe Ratio
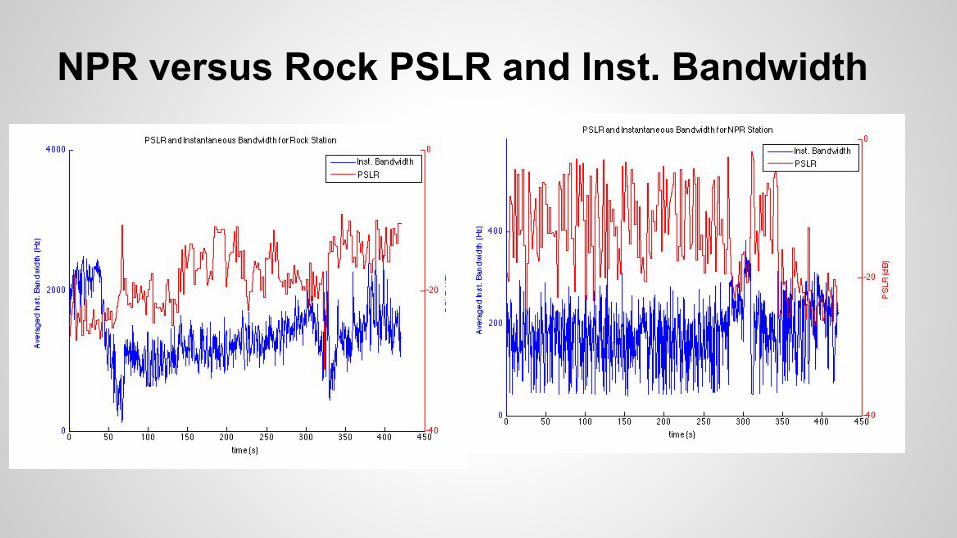
NPR versus Rock PSLR and Inst. Bandwidth

Rock Station
NPR Station
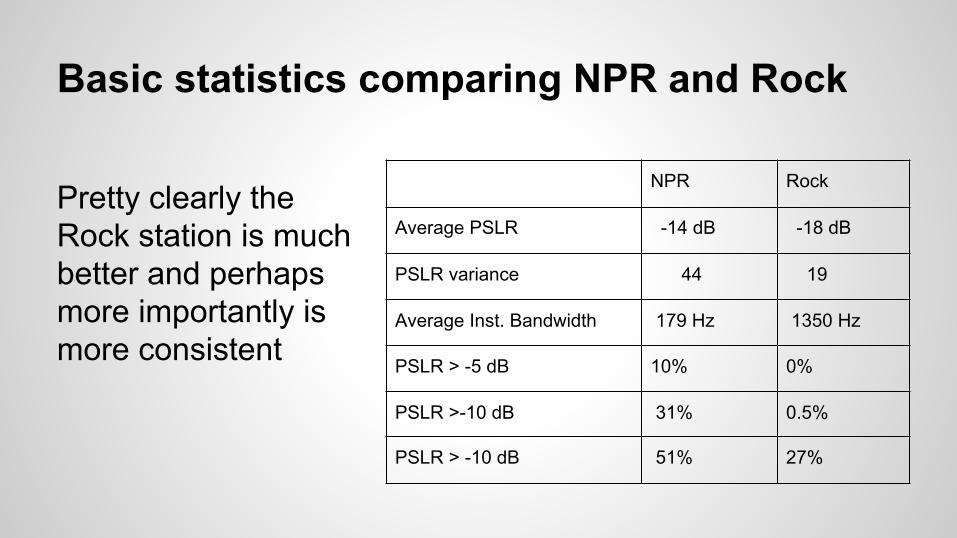
Basic statistics comparing NPR and Rock
Pretty clearly the Rock station is much better and perhaps more importantly is more consistent
NPR Rock
Average PSLR -14 dB -18 dB
PSLR variance 44 19
Average Inst. Bandwidth 179 Hz 1350 Hz
PSLR > -5 dB 10% 0%
PSLR >-10 dB 31% 0.5%
PSLR > -10 dB 51% 27%

Movies of ambiguity functions synced with audio
● Developed a tool in MATLAB to help gain intuition as to how the ambiguity changes with the audio○ demodulated I and Q data to mono audio○ Extracted the half second average PSD and
instantaneous bandwidth from the I and Q○ plot and synchronize all these data in MATLAB○ write an .avi file of the changing figure interleaved
with the audio
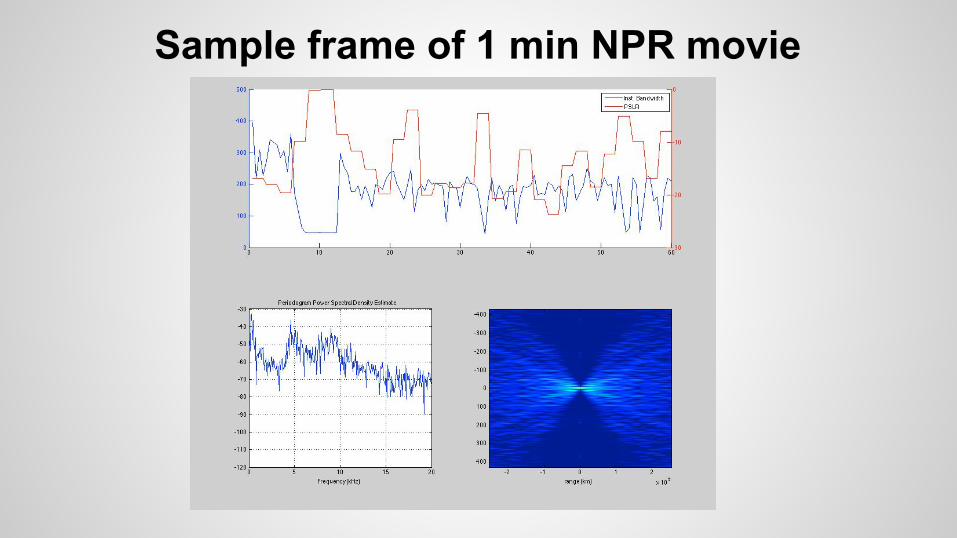
Sample frame of 1 min NPR movie
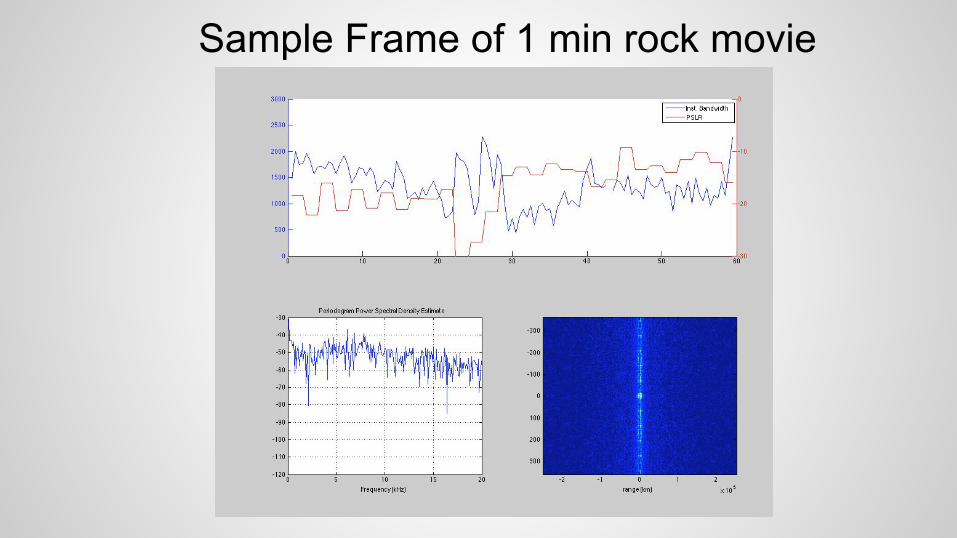
Sample Frame of 1 min rock movie

ReferencesF. Lind, “ISIS Annotated Data Examples”, http://atlas.haystack.mit.edu/isis/fermi/events/annotated_data/isis_annotated_data_examples.pdf Aug. 2010, Retreived Nov. 7, 2013.F. Lind et al, “Intercepted Signals for Ionospheric Science”, Radio Science, vol. 48, pp. 248-264, June 2013.J. Sahr and F. Lind, “The Manastash Ridge Radar: A passive bistatic radar for upper atmospheric radio science”, Radio Science, vol. 32, no. 6, pp. 2345-2358, Nov. 1997.B. Mahafza, Radar Systems Analysis and Design using MATLAB, CRC Press, 2000.N. Willis and H. Griffiths (eds.), Advances in Bistatic Radar, SciTech Pub., 2007.M. Cherniakov (ed.), Bistatic Radar: Emerging Technology, Wiley & Sons, 2008.M. Richards, Fundamentals of Radar Signal Processing, McGraw-Hill, 2005.R. Gonzalez, R. Woods, Digital Image Processing, 3rd Ed., Pearson Prentice Hall, 2008.R. Gonzalez et al, Digital Image Processing Using MATLAB, 2nd Ed., Gatesmark Pub., 2009.M. Meyer, “Passive VHF Radar Interferometer Implementation, Observations, and Analysis”, M.S. thesis, Elect. Eng. Dept., Univ. of Washington, Seattle, WA, 2003.