biostatistics in practice
DESCRIPTION
Biostatistics in Practice. Session 1: Quantitative and Inferential Issues. Peter D. Christenson Biostatistician http://gcrc.LABioMed.org/Biostat. Session 1 Objectives. General quantitative needs in biological research Statistical software Protocol examples, with statistical sections - PowerPoint PPT PresentationTRANSCRIPT
Biostatistics in Practice
Peter D. ChristensonBiostatistician
http://gcrc.LABioMed.org/Biostat
Session 1: Quantitative and Inferential Issues
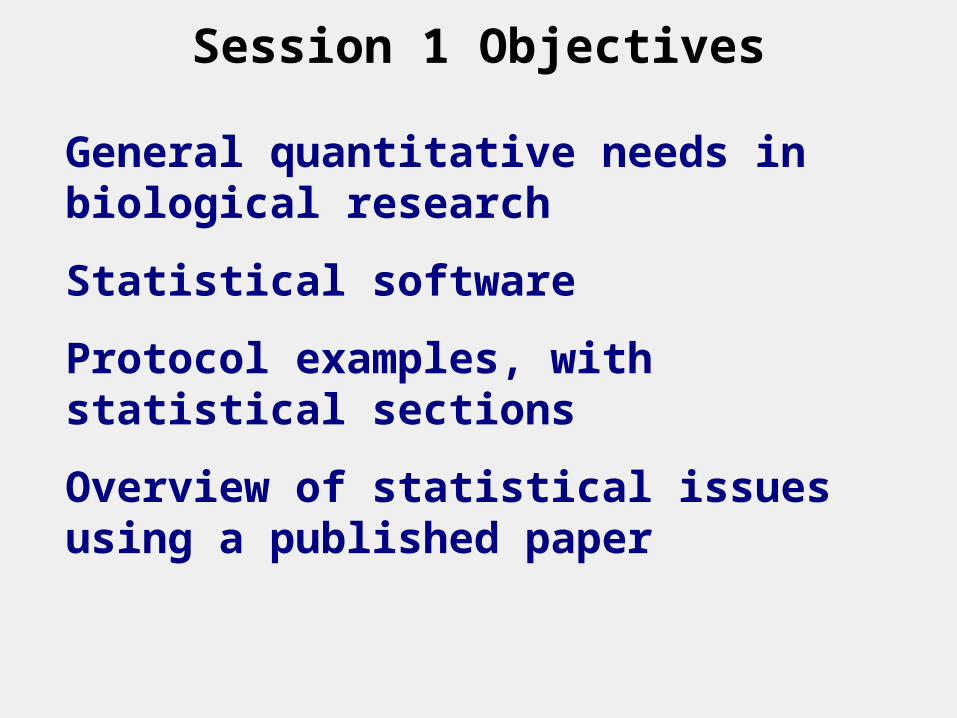
Session 1 Objectives
General quantitative needs in biological research
Statistical software
Protocol examples, with statistical sections
Overview of statistical issues using a published paper
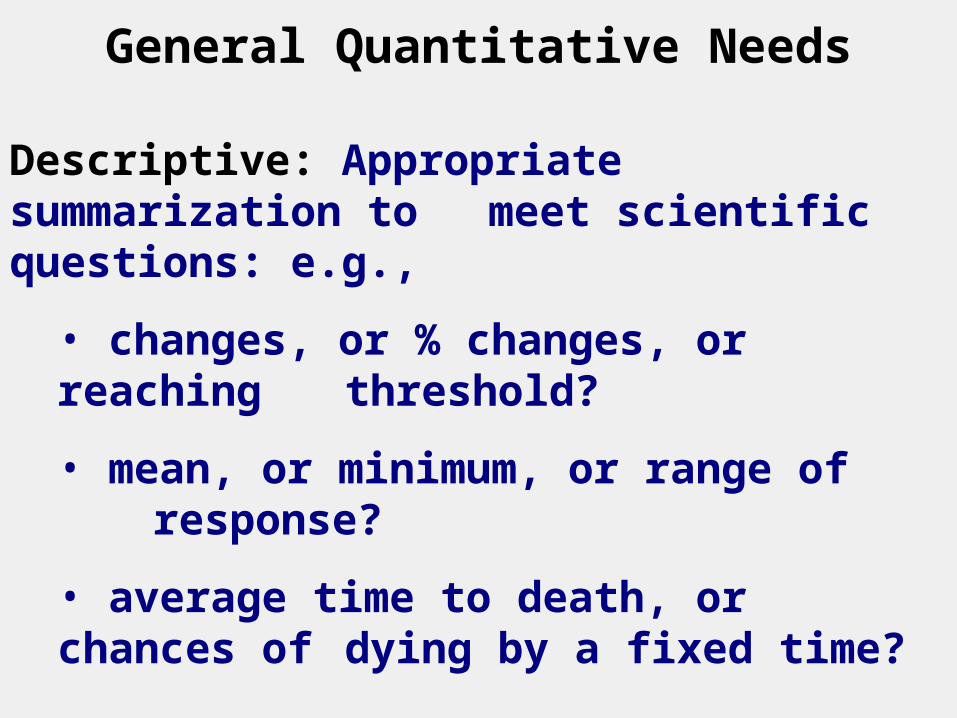
General Quantitative Needs
Descriptive: Appropriate summarization to meet scientific questions: e.g.,
• changes, or % changes, or reaching threshold?
• mean, or minimum, or range of response?
• average time to death, or chances of dying by a fixed time?
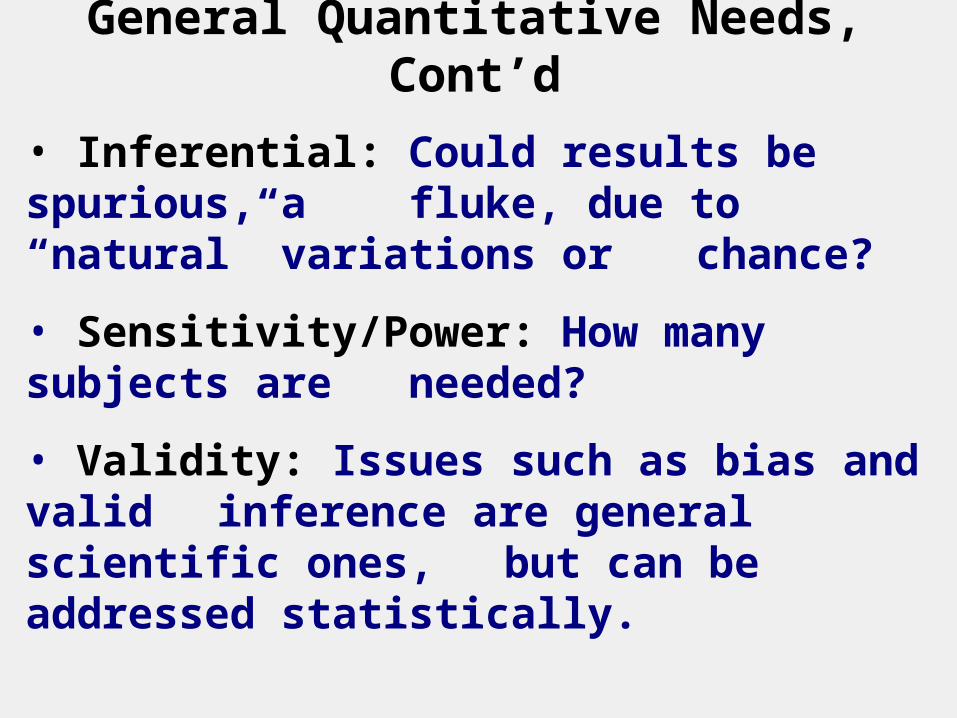
General Quantitative Needs, Cont’d
• Inferential: Could results be spurious, a fluke, due to “natural” variations or chance?
• Sensitivity/Power: How many subjects are needed?
• Validity: Issues such as bias and valid inference are general scientific ones, but can be addressed statistically.
Statistical Software
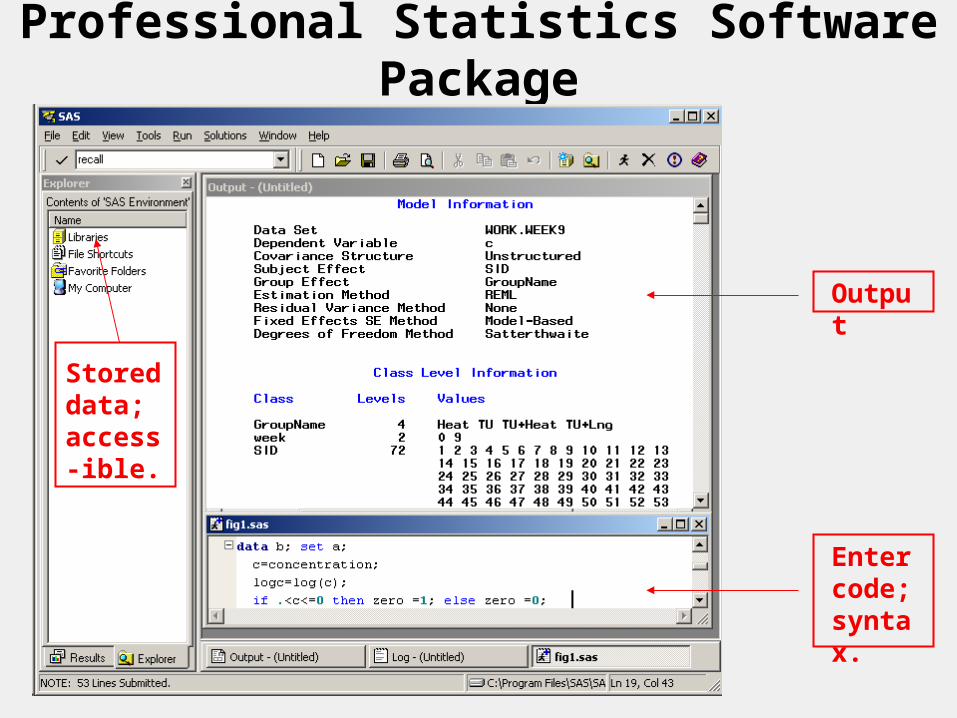
Professional Statistics Software Package
Output
Enter code; syntax.
Stored data; access-ible.
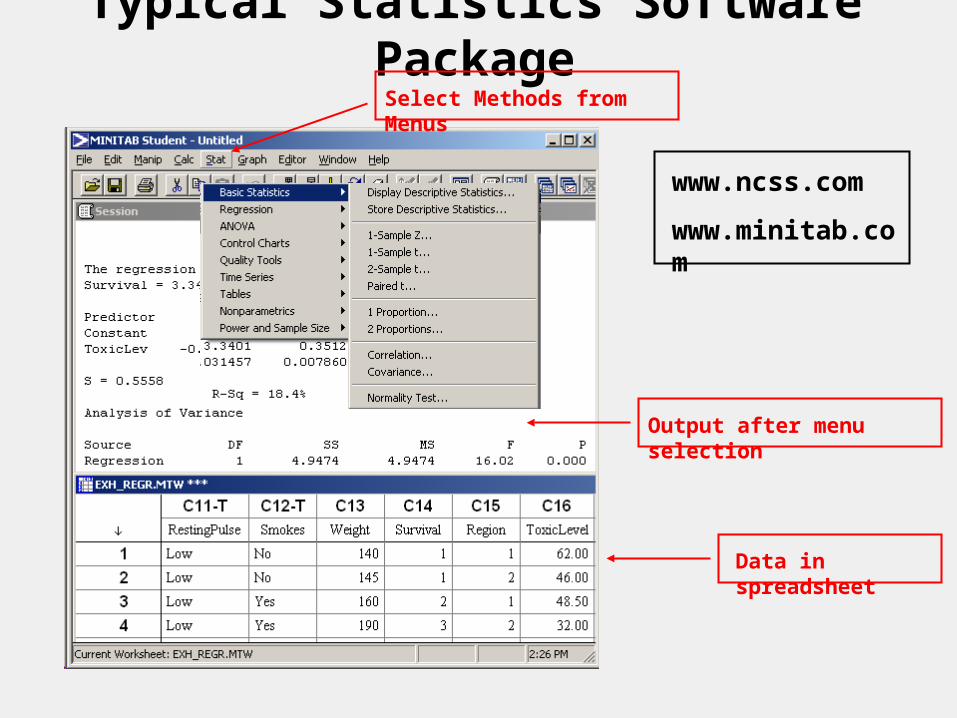
Typical Statistics Software PackageSelect Methods from Menus
Output after menu selection
Data in spreadsheet
www.ncss.com
www.minitab.com
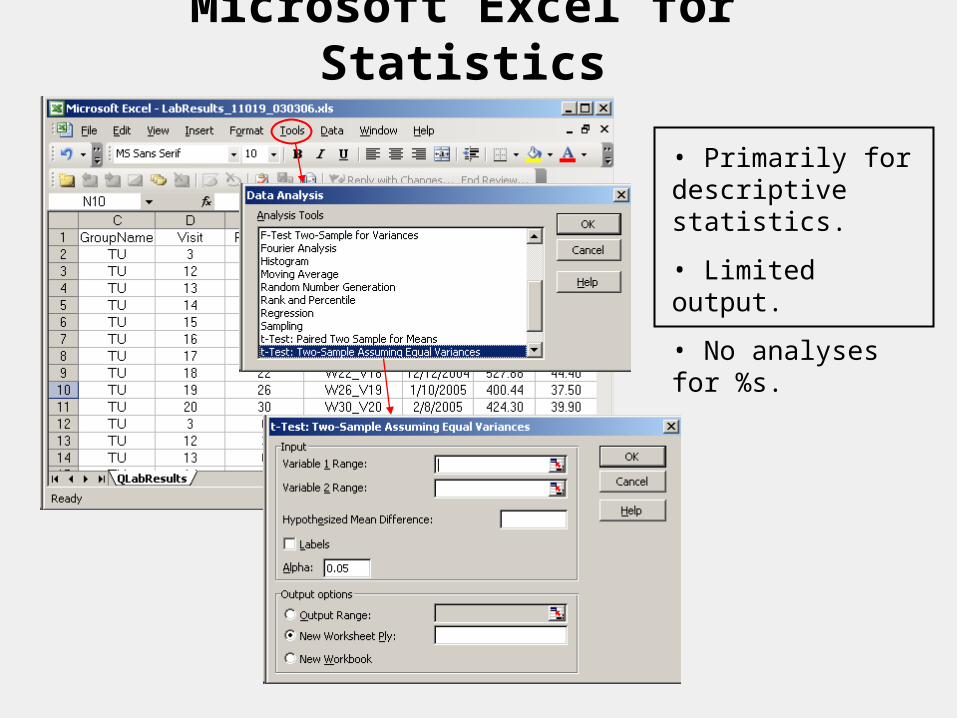
Microsoft Excel for Statistics
• Primarily for descriptive statistics.
• Limited output.
• No analyses for %s.
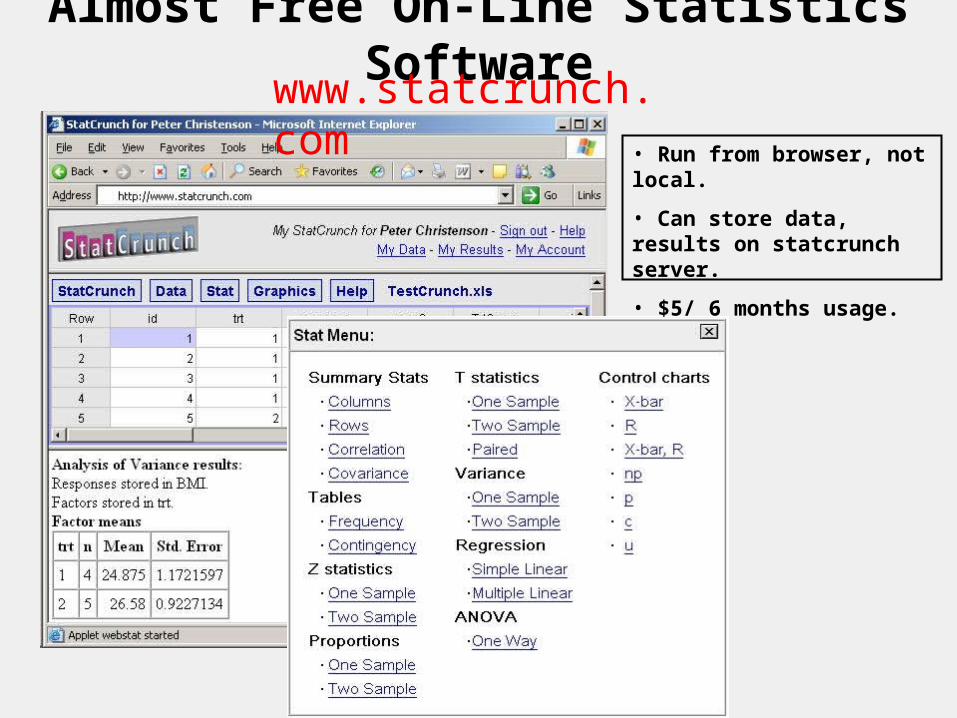
Almost Free On-Line Statistics Software
• Run from browser, not local.
• Can store data, results on statcrunch server.
• $5/ 6 months usage.
www.statcrunch.com
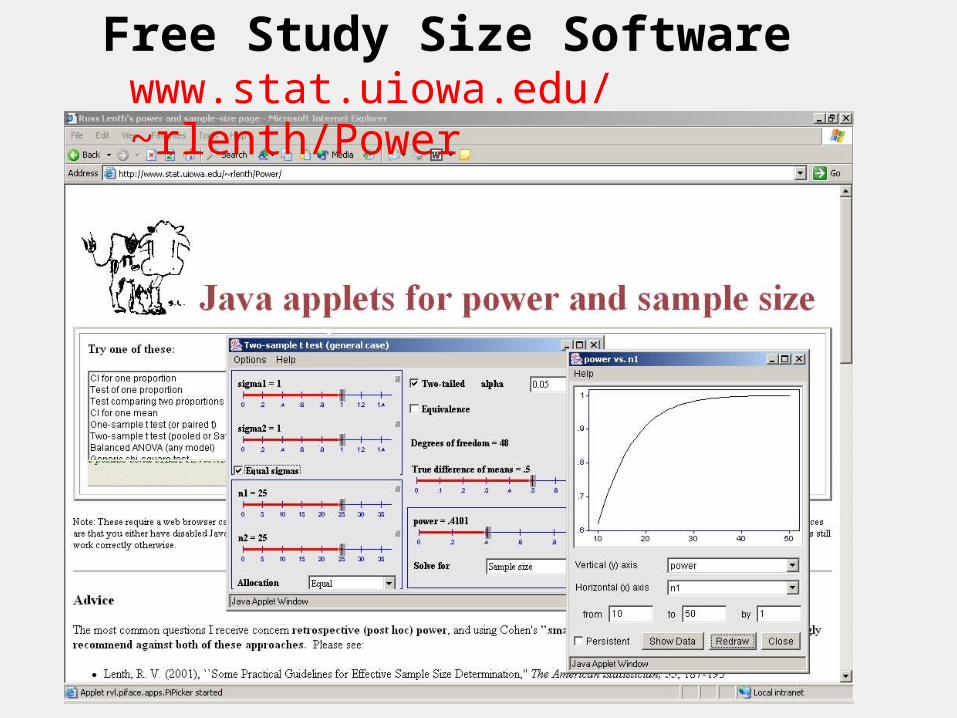
Free Study Size Softwarewww.stat.uiowa.edu/~rlenth/Power

Protocols
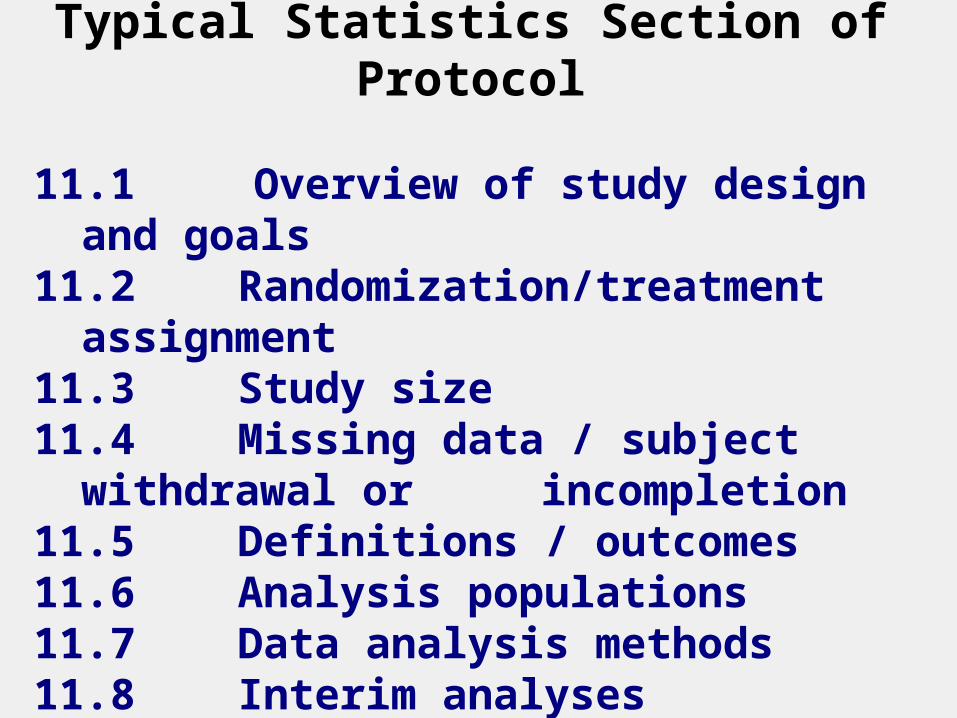
Typical Statistics Section of Protocol
11.1 Overview of study design and goals
11.2 Randomization/treatment assignment11.3 Study size11.4 Missing data / subject withdrawal or
incompletion11.5 Definitions / outcomes11.6 Analysis populations11.7 Data analysis methods11.8 Interim analyses
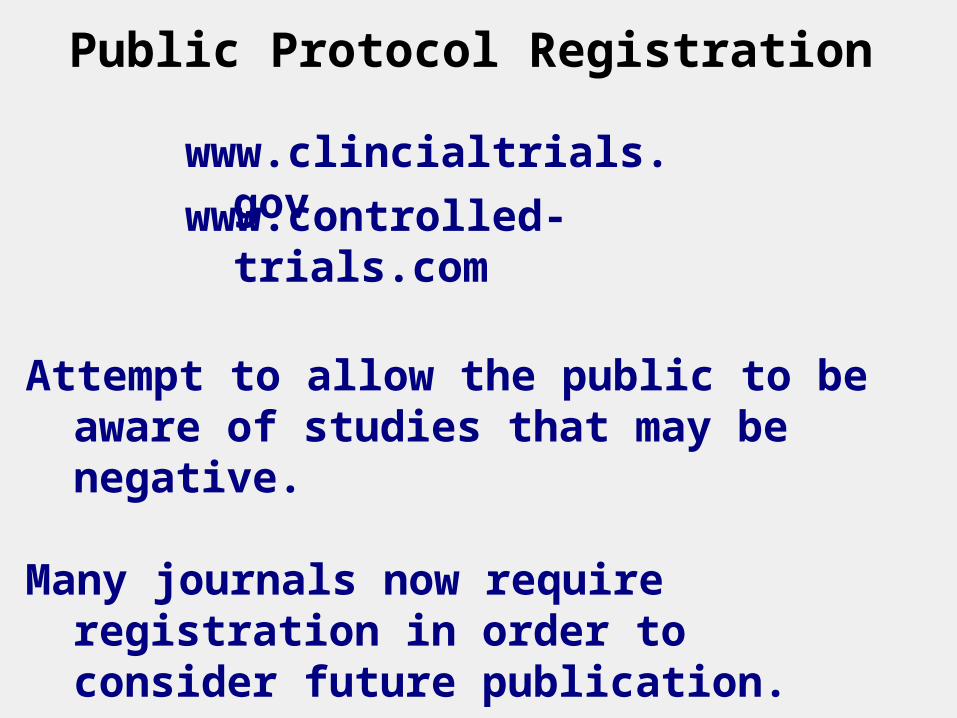
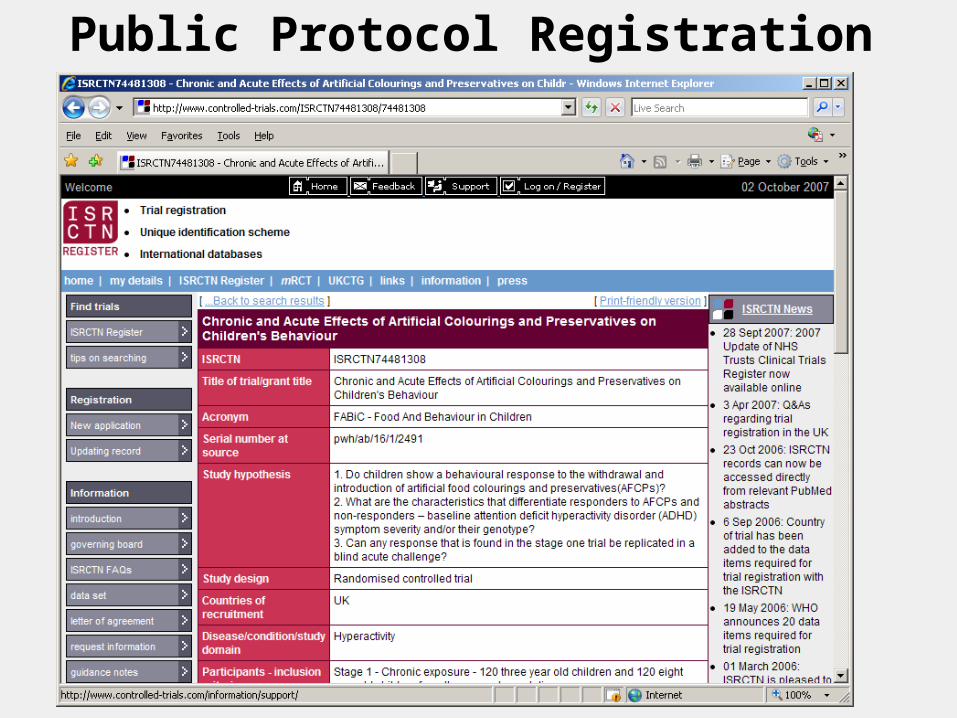
Public Protocol Registration
www.clincialtrials.gov
www.controlled-trials.com
Attempt to allow the public to be aware of studies that may be negative.
Many journals now require registration in order to consider future publication.
Public Protocol Registration
Example of Protocol
--- Displayed in Class ---
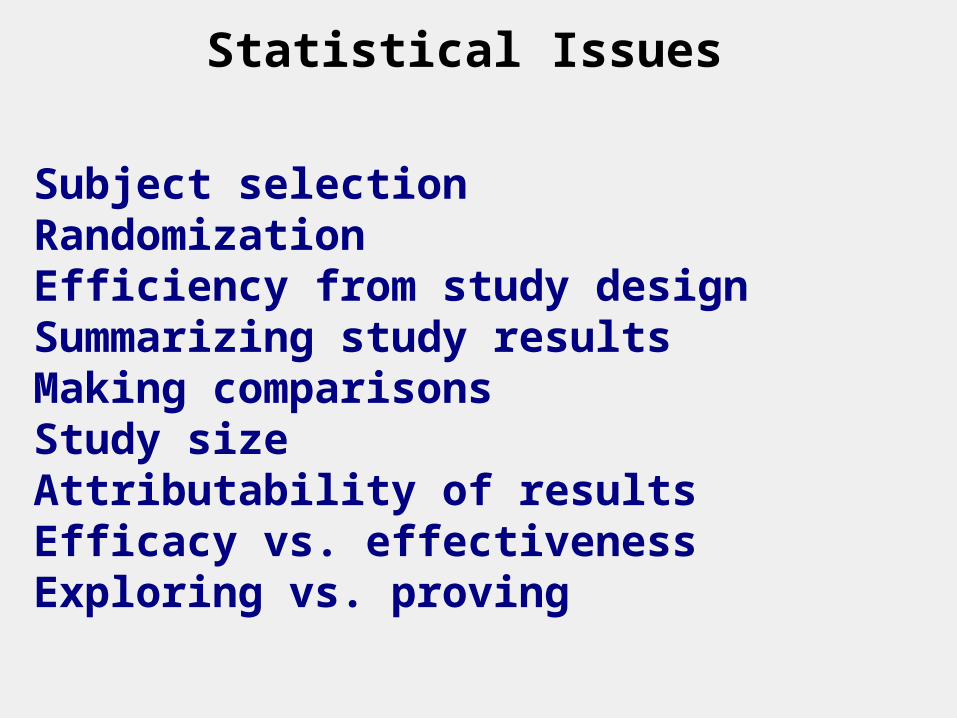
Statistical Issues
Subject selectionRandomization Efficiency from study design Summarizing study resultsMaking comparisonsStudy sizeAttributability of resultsEfficacy vs. effectiveness
Exploring vs. proving
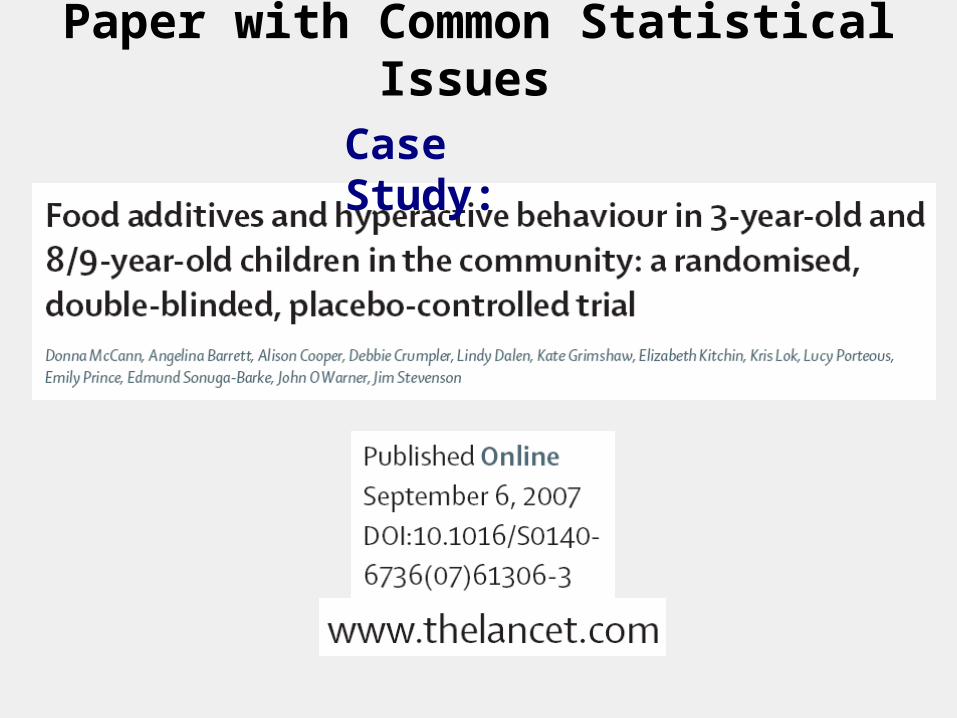
Paper with Common Statistical Issues
Case Study:
Selecting Study Subjects
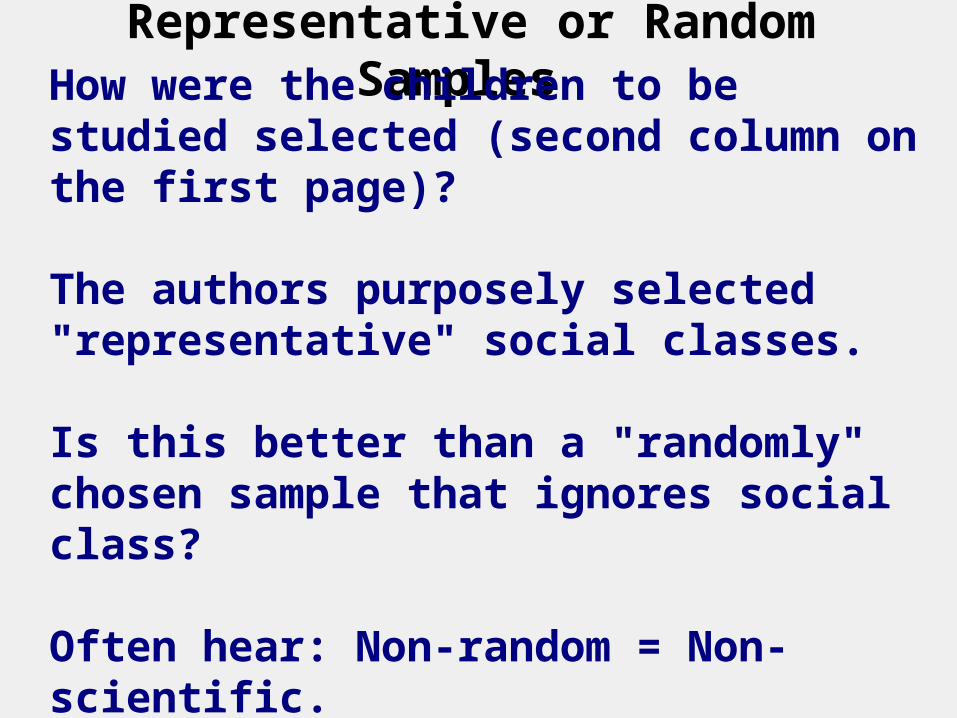
Representative or Random Samples
How were the children to be studied selected (second column on the first page)? The authors purposely selected "representative" social classes.
Is this better than a "randomly" chosen sample that ignores social class?
Often hear: Non-random = Non-scientific.
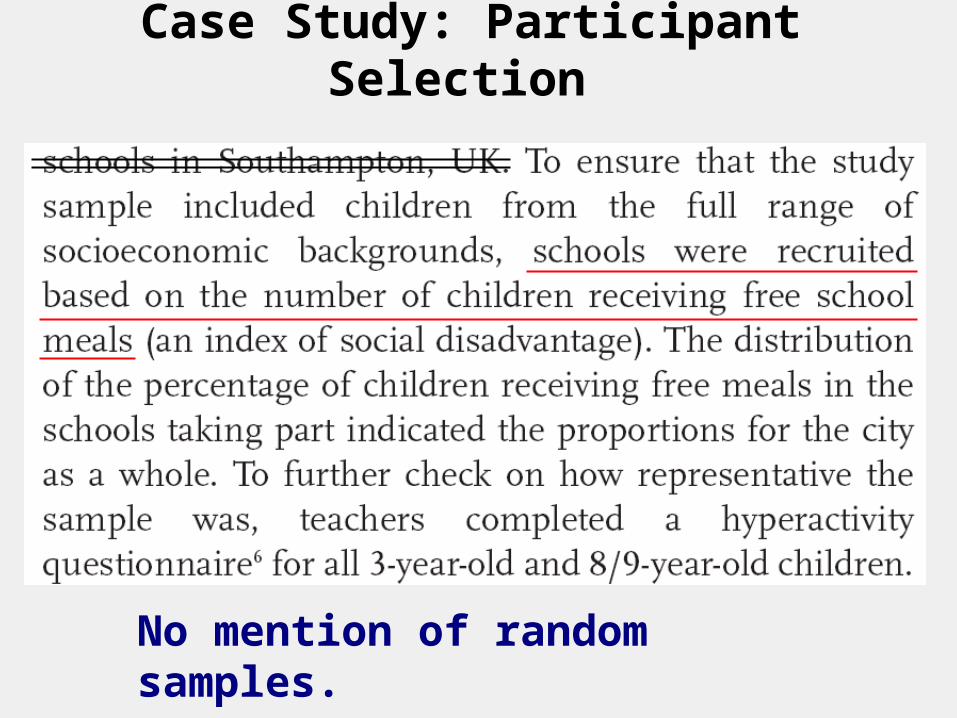
Case Study: Participant Selection
No mention of random samples.
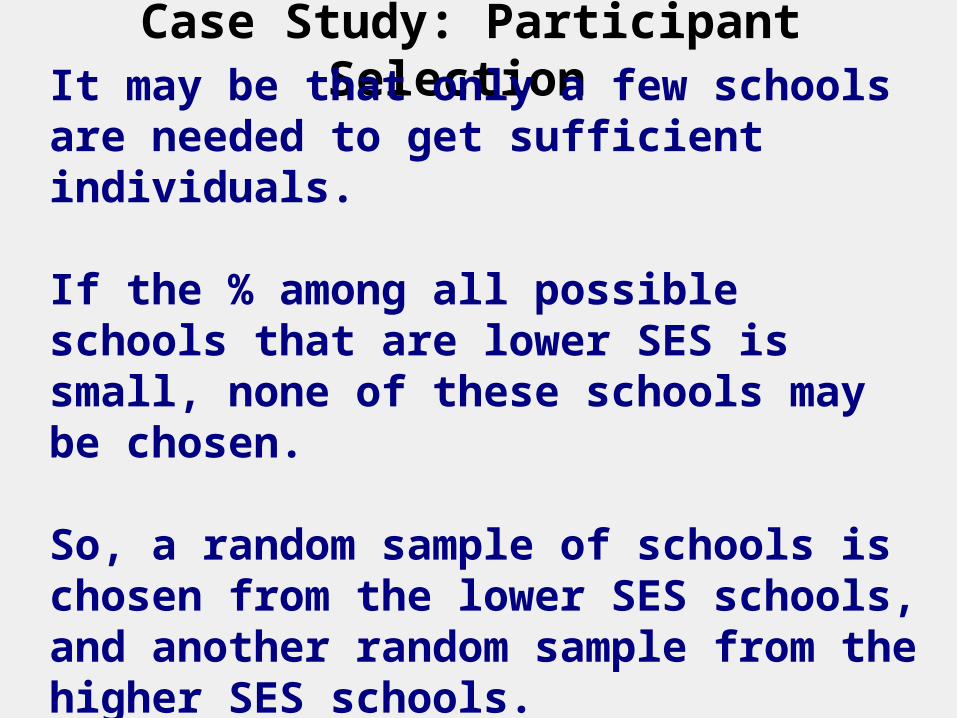
Case Study: Participant Selection
It may be that only a few schools are needed to get sufficient individuals. If the % among all possible schools that are lower SES is small, none of these schools may be chosen.
So, a random sample of schools is chosen from the lower SES schools, and another random sample from the higher SES schools.
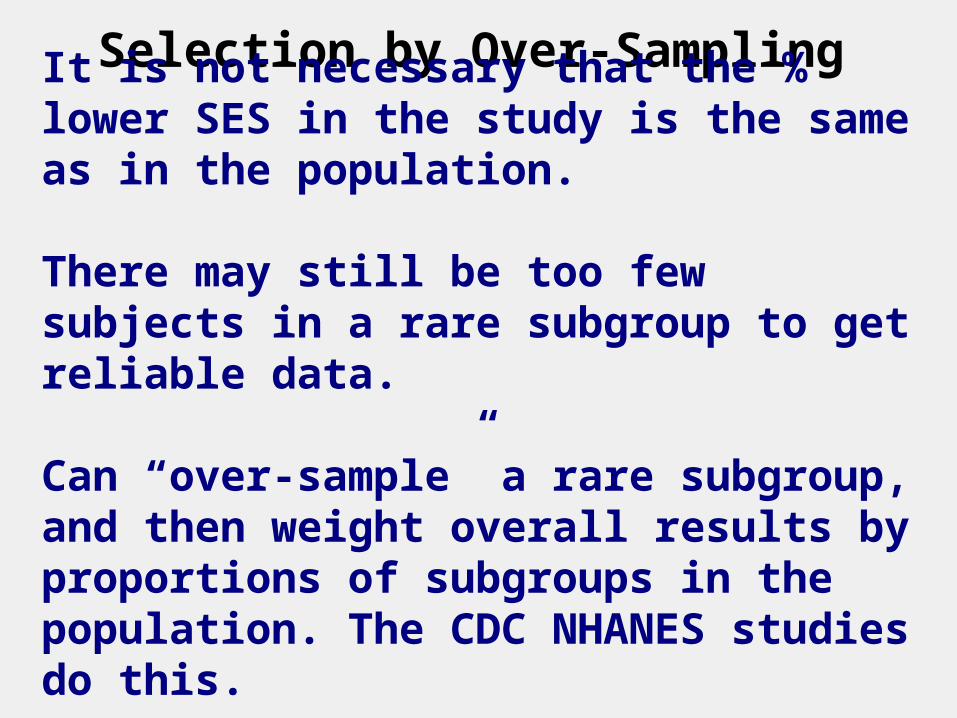
Selection by Over-Sampling
It is not necessary that the % lower SES in the study is the same as in the population. There may still be too few subjects in a rare subgroup to get reliable data.
Can “over-sample” a rare subgroup, and then weight overall results by proportions of subgroups in the population. The CDC NHANES studies do this.

Randomization
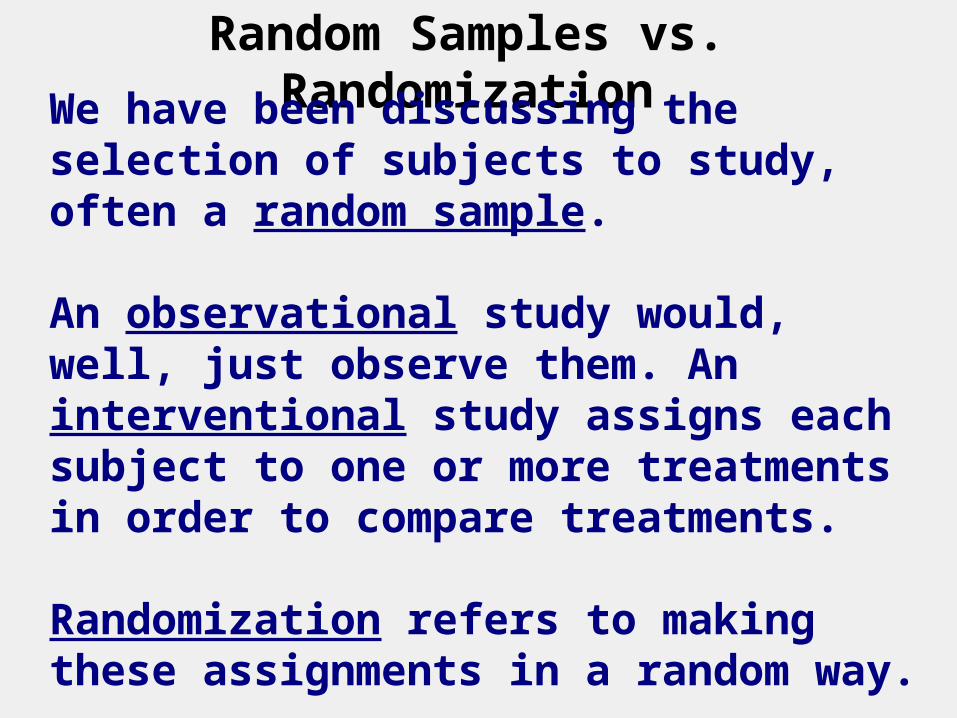
Random Samples vs. Randomization
We have been discussing the selection of subjects to study, often a random sample.
An observational study would, well, just observe them. An interventional study assigns each subject to one or more treatments in order to compare treatments. Randomization refers to making these assignments in a random way.
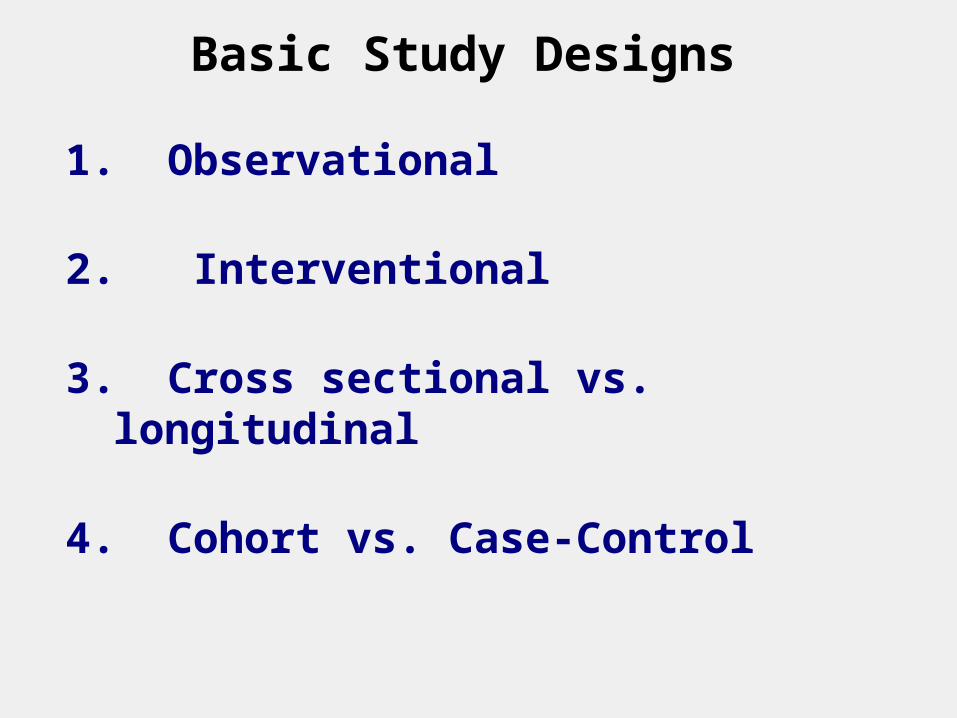
Basic Study Designs
1. Observational
2. Interventional
3. Cross sectional vs. longitudinal
4. Cohort vs. Case-Control
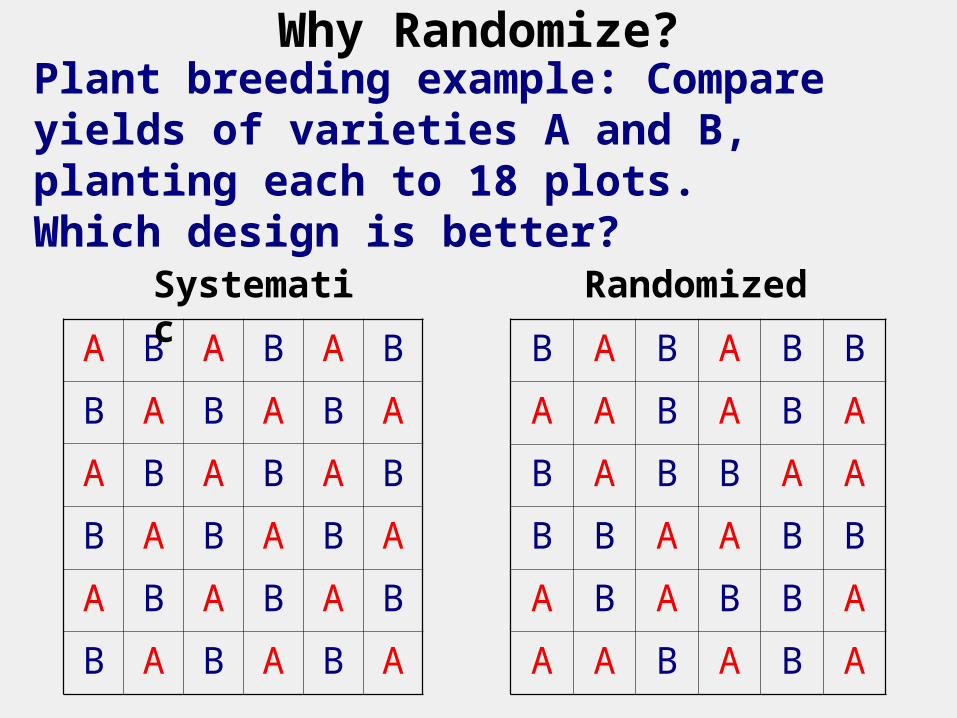
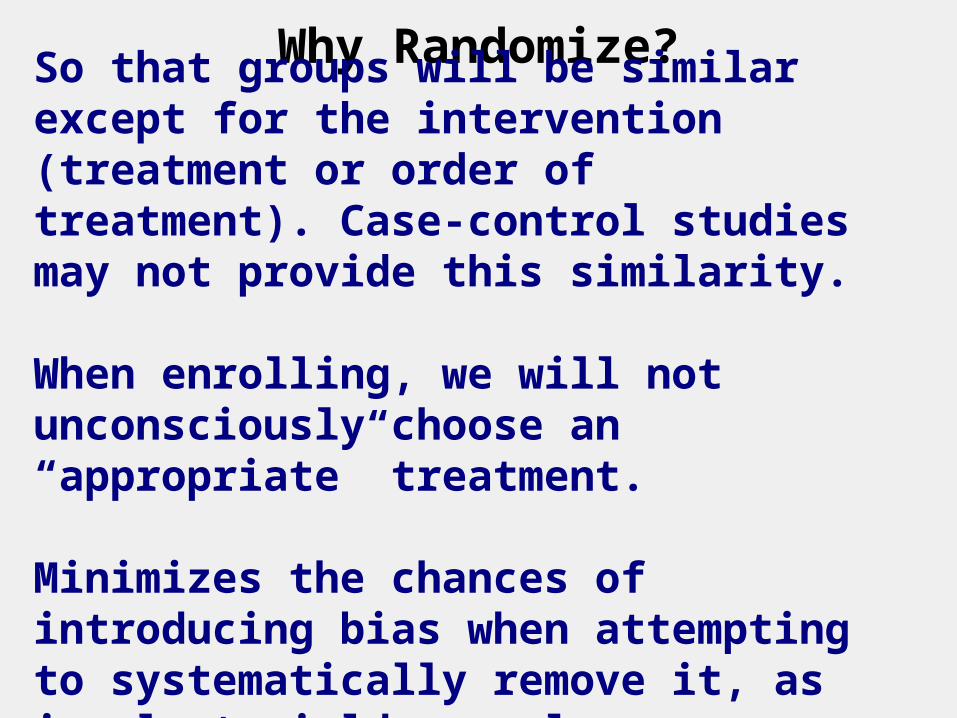
Why Randomize?
A B A B A B
B A B A B A
A B A B A B
B A B A B A
A B A B A B
B A B A B A
Plant breeding example: Compare yields of varieties A and B, planting each to 18 plots.Which design is better?
B A B A B B
A A B A B A
B A B B A A
B B A A B B
A B A B B A
A A B A B A
Systematic Randomized
Why Randomize?
So that groups will be similar except for the intervention (treatment or order of treatment). Case-control studies may not provide this similarity.
When enrolling, we will not unconsciously choose an “appropriate” treatment.
Minimizes the chances of introducing bias when attempting to systematically remove it, as in plant yield example.

Efficiency from Study Design
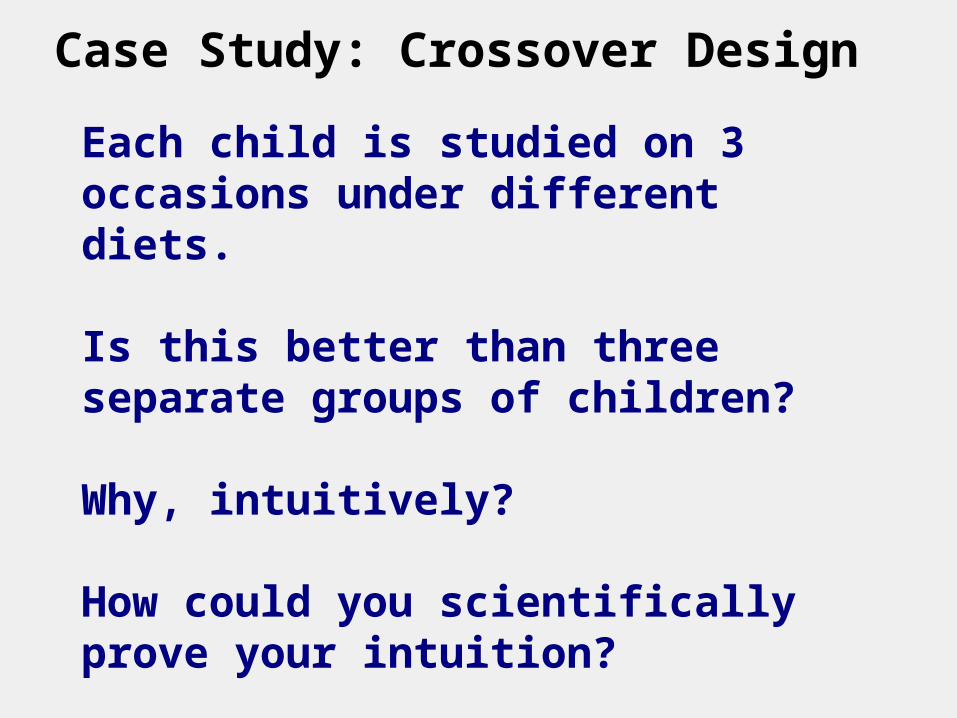
Case Study: Crossover Design
Each child is studied on 3 occasions under different diets.
Is this better than three separate groups of children?
Why, intuitively?
How could you scientifically prove your intuition?
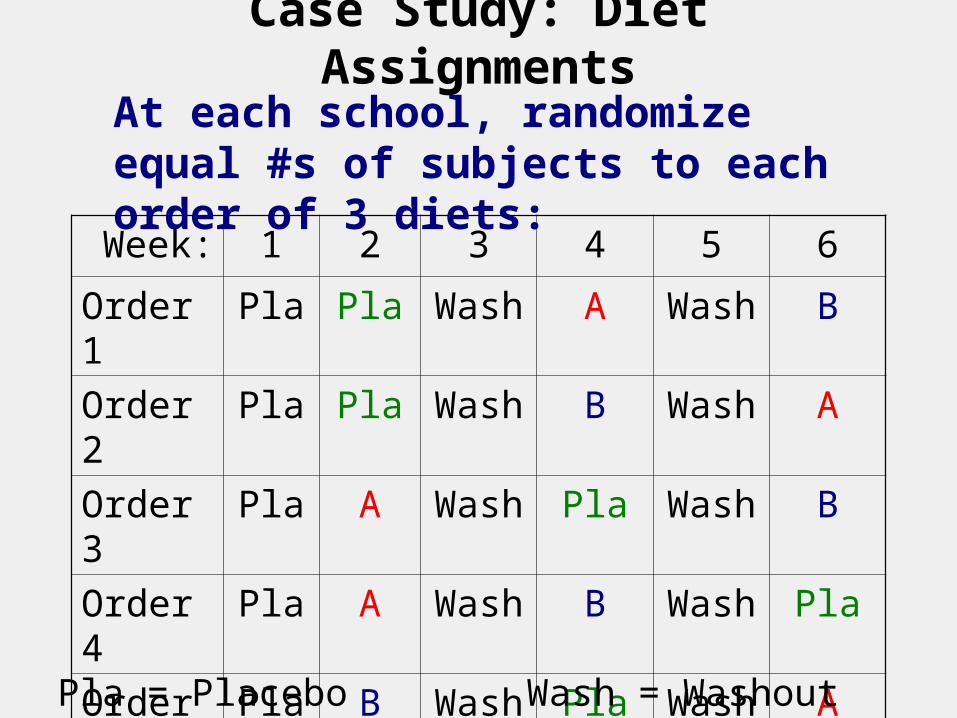
Case Study: Diet Assignments
Week: 1 2 3 4 5 6
Order 1
Pla Pla Wash
A Wash
B
Order 2
Pla Pla Wash
B Wash
A
Order 3
Pla A Wash
Pla Wash
B
Order 4
Pla A Wash
B Wash
Pla
Order 5
Pla B Wash
Pla Wash
A
Order 6
Pla B Wash
A Wash
Pla
At each school, randomize equal #s of subjects to each order of 3 diets:
Pla = Placebo Wash = Washout (placebo here)
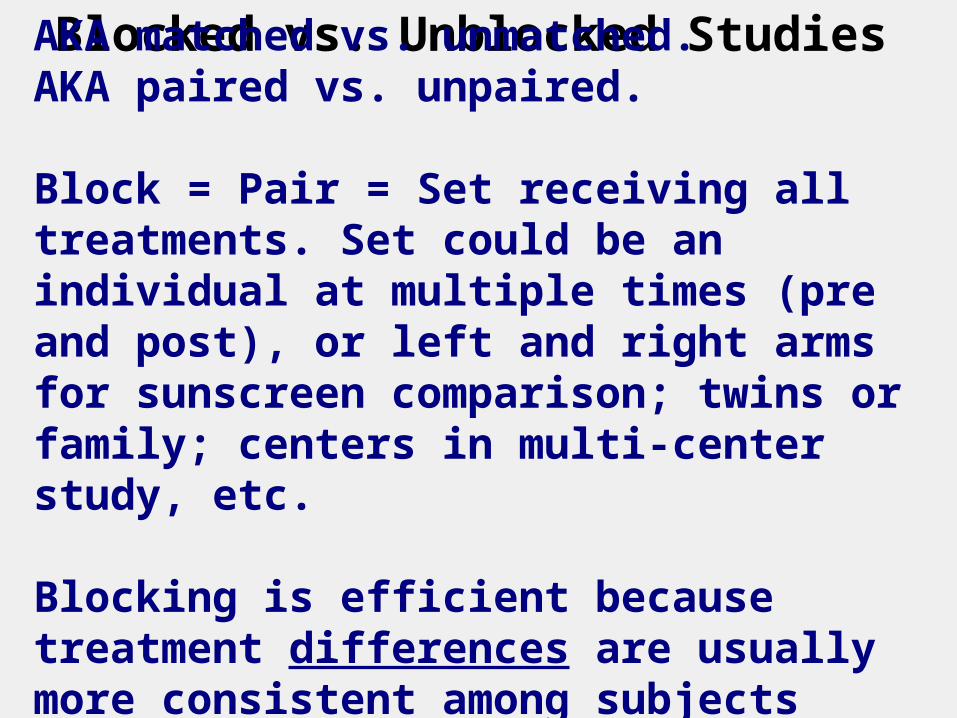
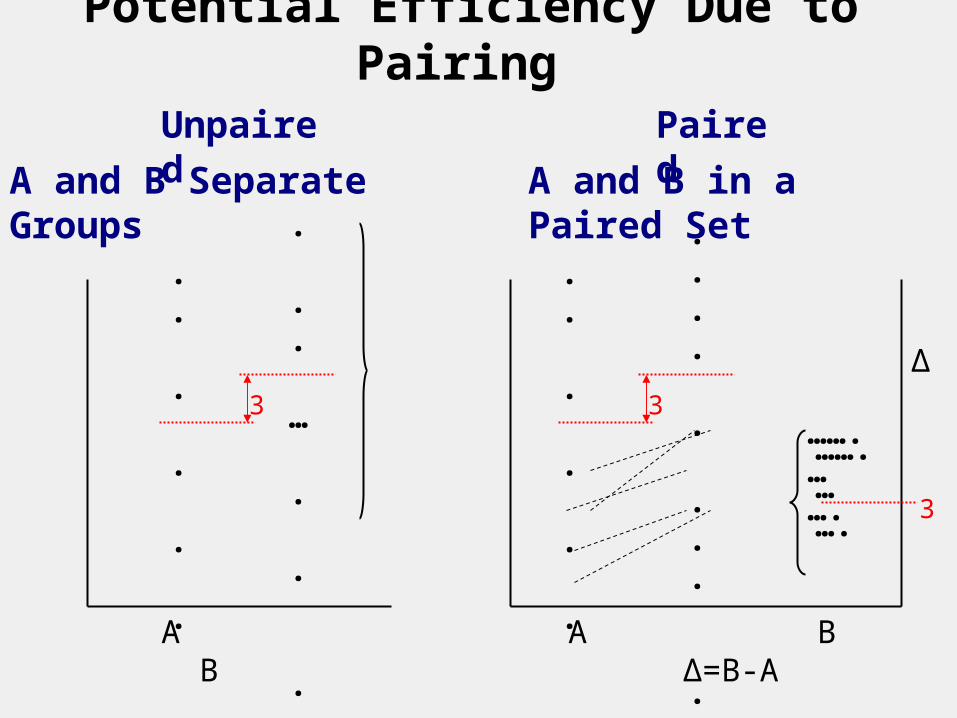
Blocked vs. Unblocked Studies
AKA matched vs. unmatched.AKA paired vs. unpaired.
Block = Pair = Set receiving all treatments. Set could be an individual at multiple times (pre and post), or left and right arms for sunscreen comparison; twins or family; centers in multi-center study, etc.
Blocking is efficient because treatment differences are usually more consistent among subjects than each treatment is.
Potential Efficiency Due to Pairing
. .
.
.
. . . . … . .. .. ..
. .
.
.
. . . . … . .. .. ..
.
. . … . . . . . .. . . . .
. .
..
.
. .
. . . . . . ..
A B A B Δ=B-A
…….… ….
…….… ….
Δ3 3
3
Unpaired
A and B Separate Groups
Paired
A and B in a Paired Set
Summarizing Study Results and
Making Comparisons
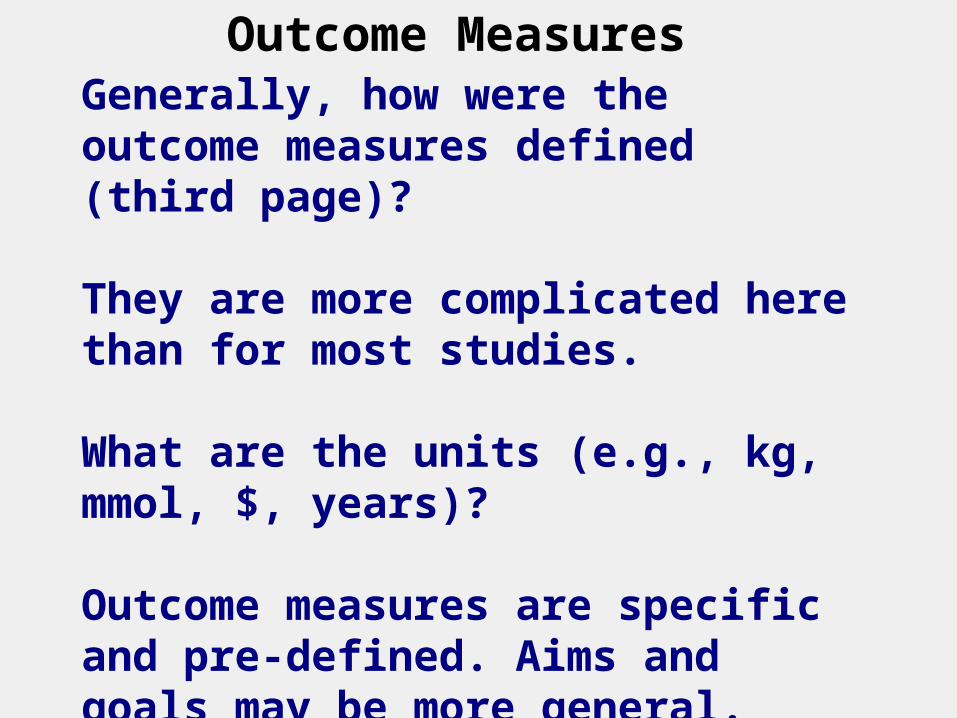
Outcome Measures
Generally, how were the outcome measures defined (third page)?
They are more complicated here than for most studies.
What are the units (e.g., kg, mmol, $, years)?
Outcome measures are specific and pre-defined. Aims and goals may be more general.
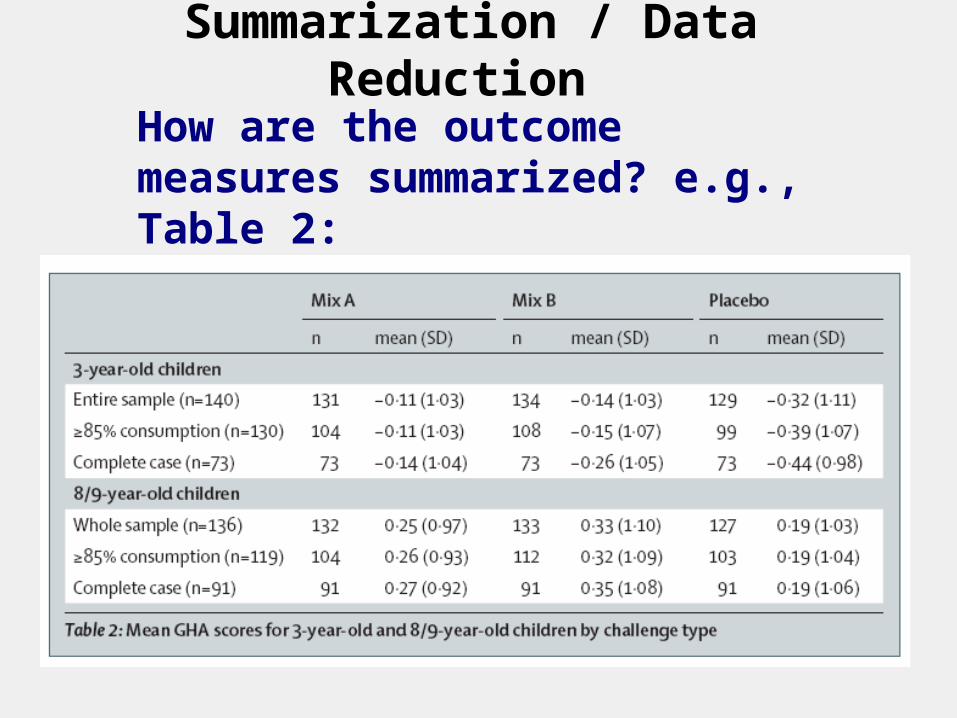
Summarization / Data Reduction
How are the outcome measures summarized? e.g., Table 2:
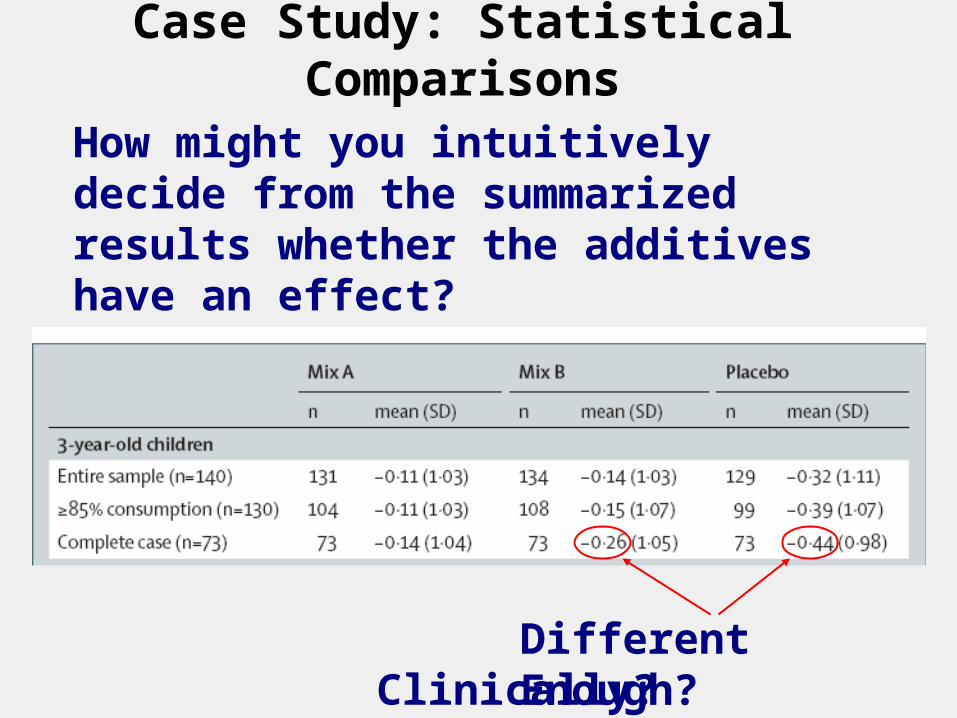
Case Study: Statistical Comparisons
How might you intuitively decide from the summarized results whether the additives have an effect?
Different Enough?Clinically? Statistically?
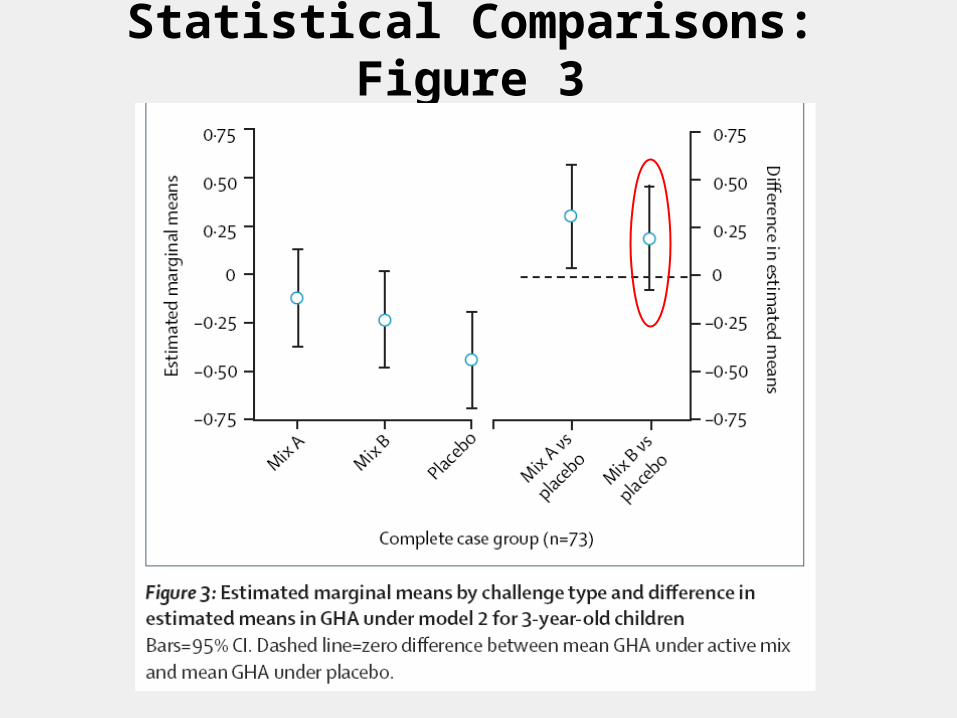
Statistical Comparisons: Figure 3
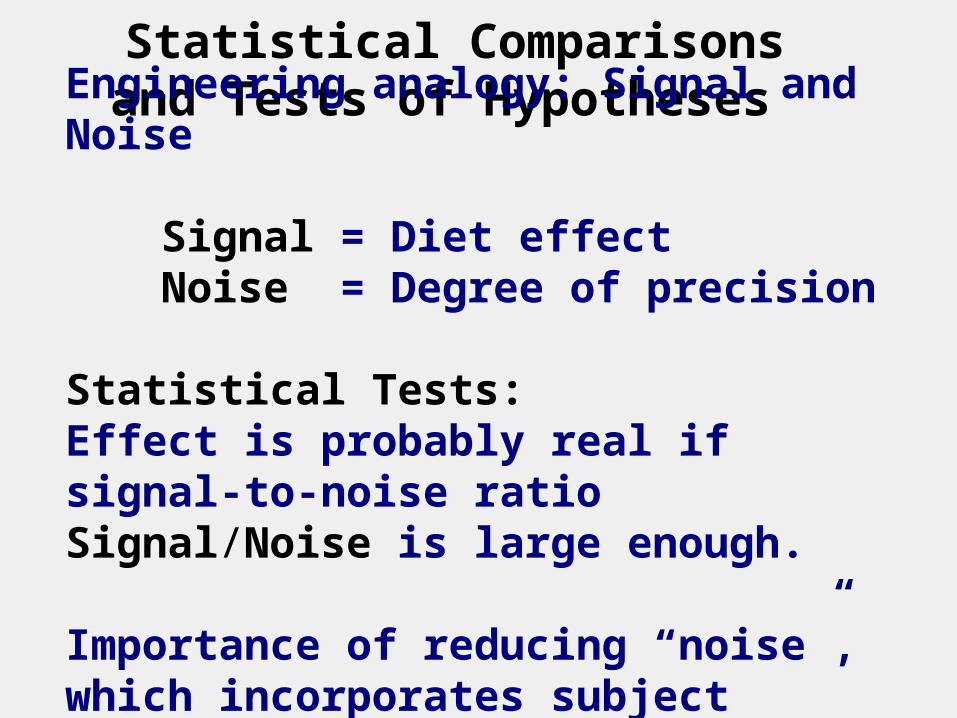
Statistical Comparisons and Tests of Hypotheses
Engineering analogy: Signal and Noise
Signal = Diet effectNoise = Degree of precision
Statistical Tests: Effect is probably real if signal-to-noise ratio Signal/Noise is large enough.
Importance of reducing “noise”, which incorporates subject variability and N.
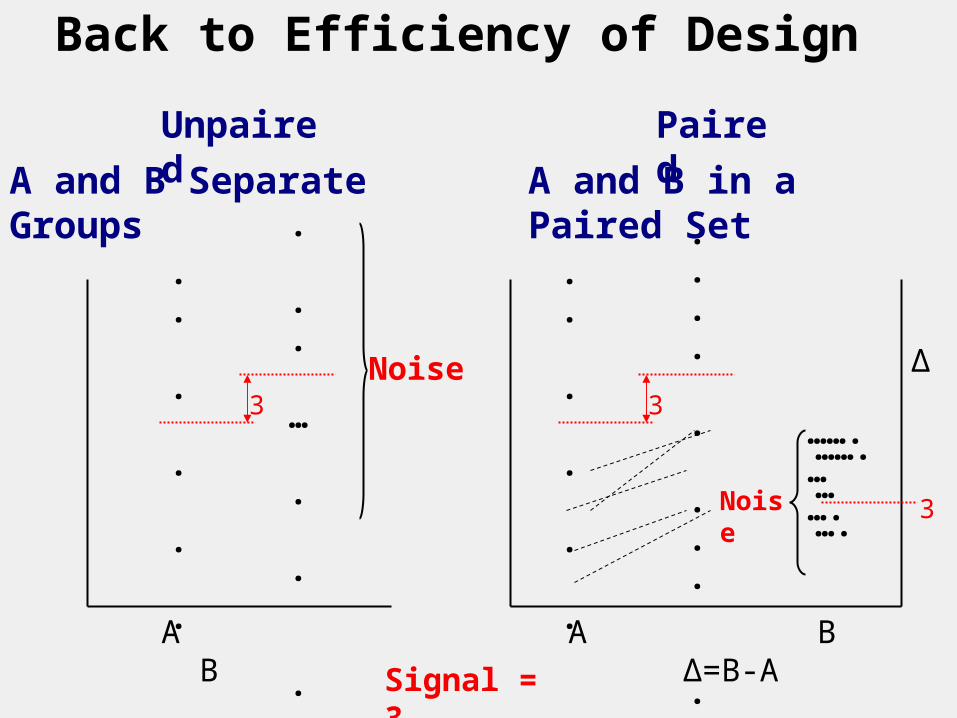
Back to Efficiency of Design
. .
.
.
. . . . … . .. .. ..
. .
.
.
. . . . … . .. .. ..
.
. . … . . . . . .. . . . .
. .
..
.
. .
. . . . . . ..
A B A B Δ=B-A
…….… ….
…….… ….
Δ3 3
3
Unpaired
A and B Separate Groups
Paired
A and B in a Paired Set
Noise
Noise
Signal = 3
Study Size
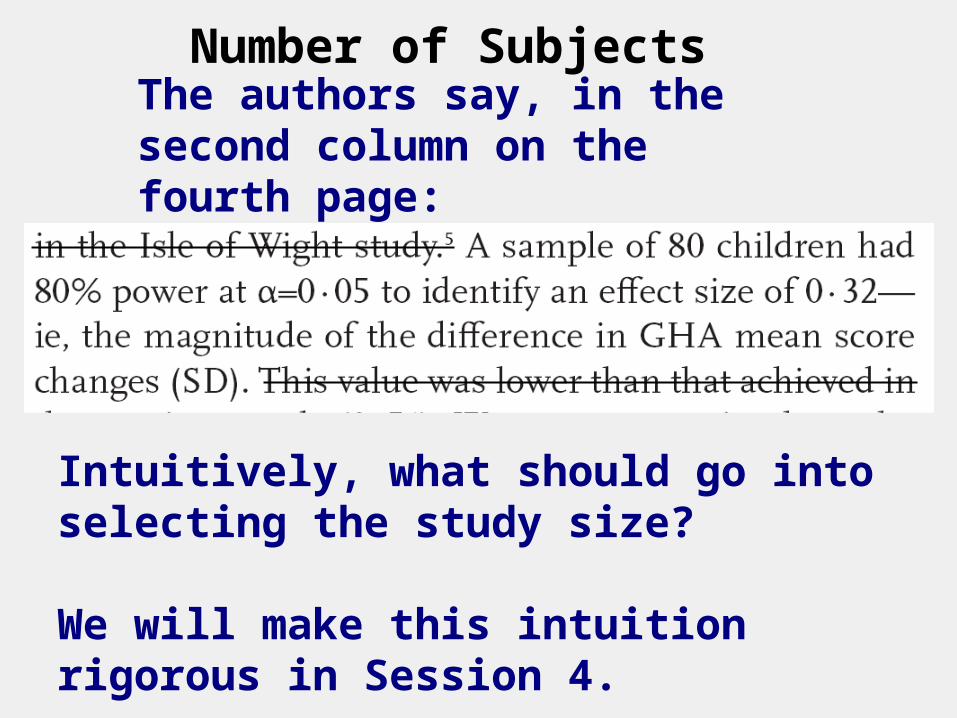
Number of Subjects
The authors say, in the second column on the fourth page:
Intuitively, what should go into selecting the study size?
We will make this intuition rigorous in Session 4.
Attributability of Study Results
Other Effects, Potential Biases
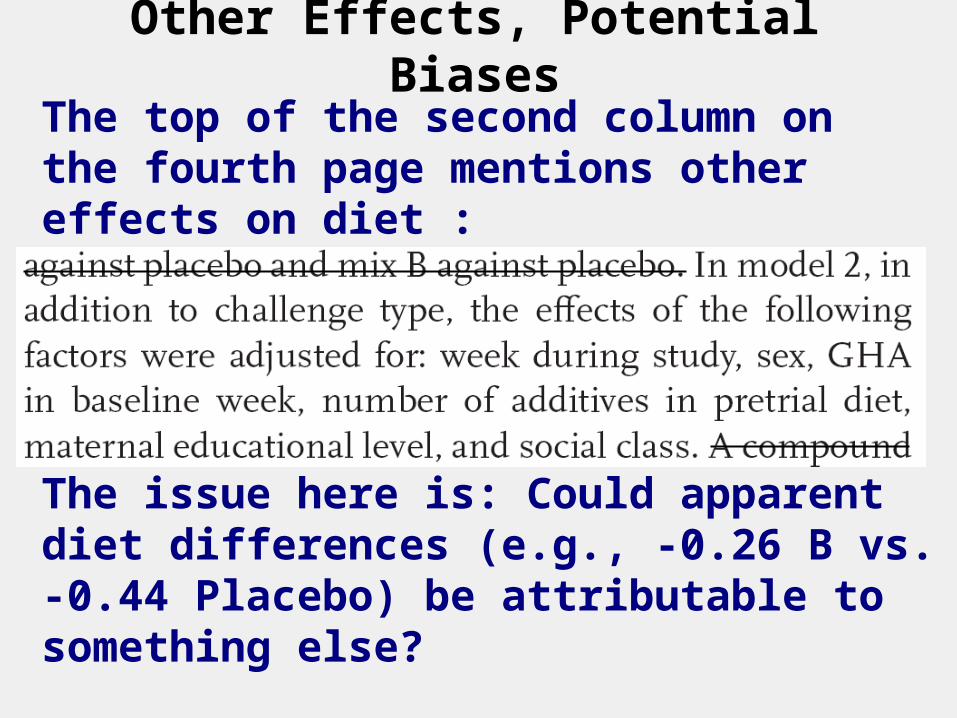
The top of the second column on the fourth page mentions other effects on diet :
The issue here is: Could apparent diet differences (e.g., -0.26 B vs. -0.44 Placebo) be attributable to something else?
Efficacy vs. Effectiveness
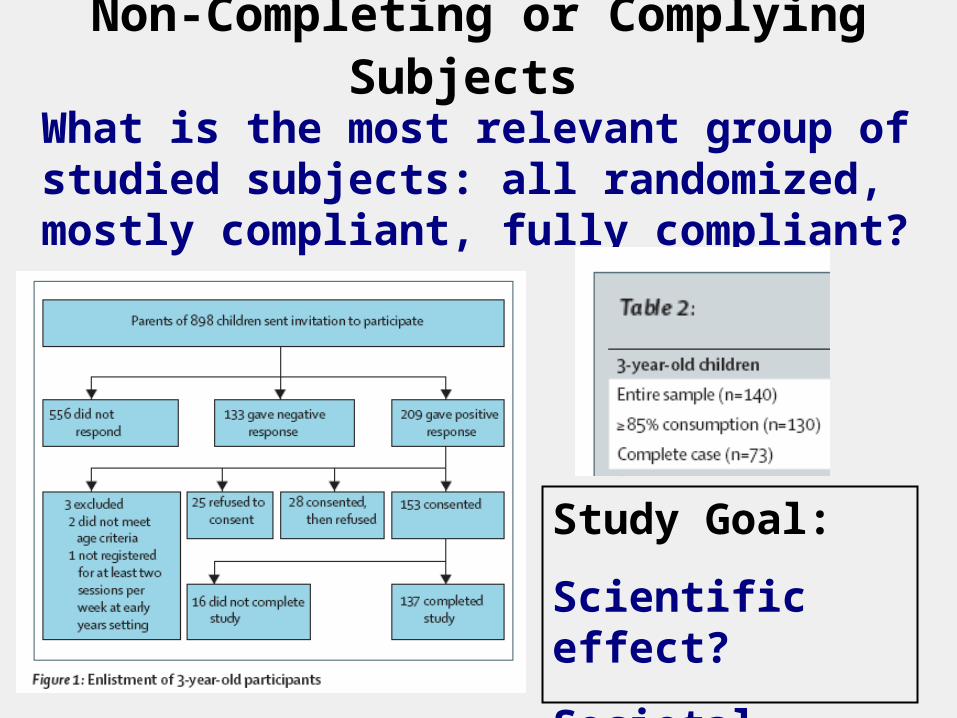
Non-Completing or Complying Subjects
What is the most relevant group of studied subjects: all randomized, mostly compliant, fully compliant?
Study Goal:
Scientific effect?
Societal impact?
Exploring vs.
Proving
Multiple and Mid-Study Analyses Many more analyses could have been performed on each of the individual behavior ratings that are described in the first column of the 3rd page.
Wouldn’t it be negligent not to do them, and miss something?
Is there a downside to doing them?
Should effects be monitored as more and more subjects complete?
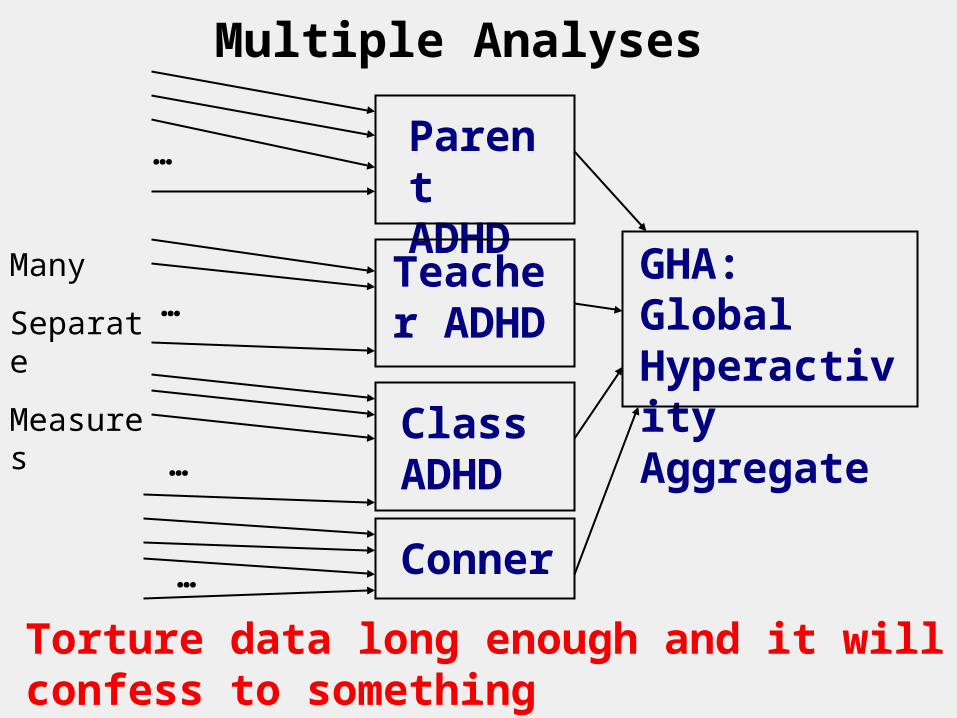
Multiple Analyses
GHA: Global Hyperactivity Aggregate
Teacher ADHD
Parent ADHD
Class ADHD
Conner
…
…
…
…
Many
Separate
Measures
Torture data long enough and it will confess to something
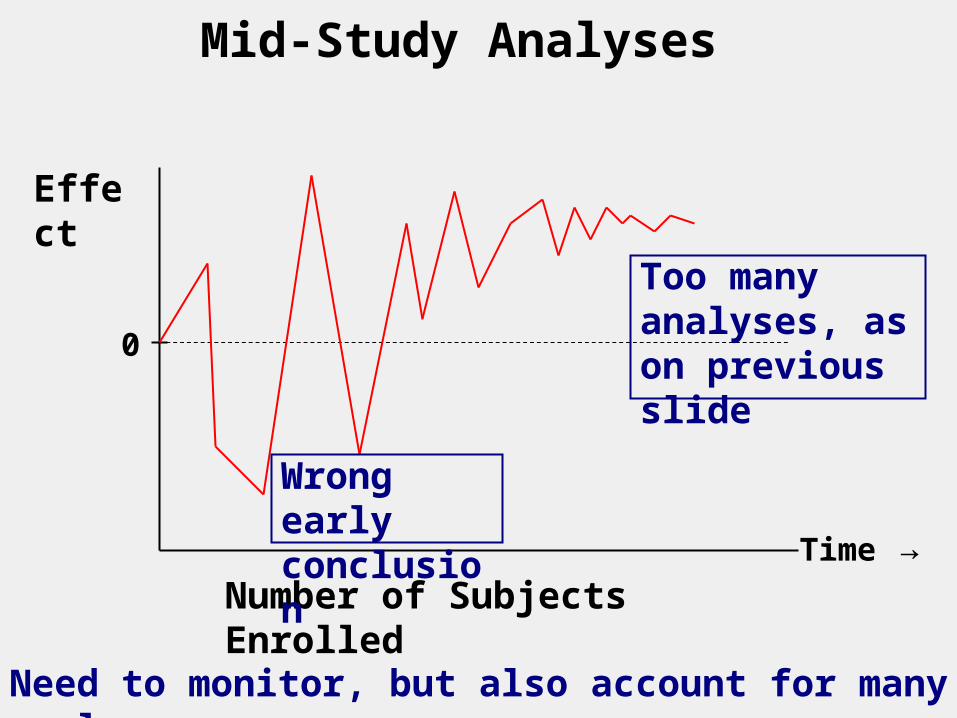
Mid-Study Analyses
Effect
0
Number of Subjects EnrolledTime →
Too many analyses, as on previous slide
Wrong early conclusion
Need to monitor, but also account for many analyses
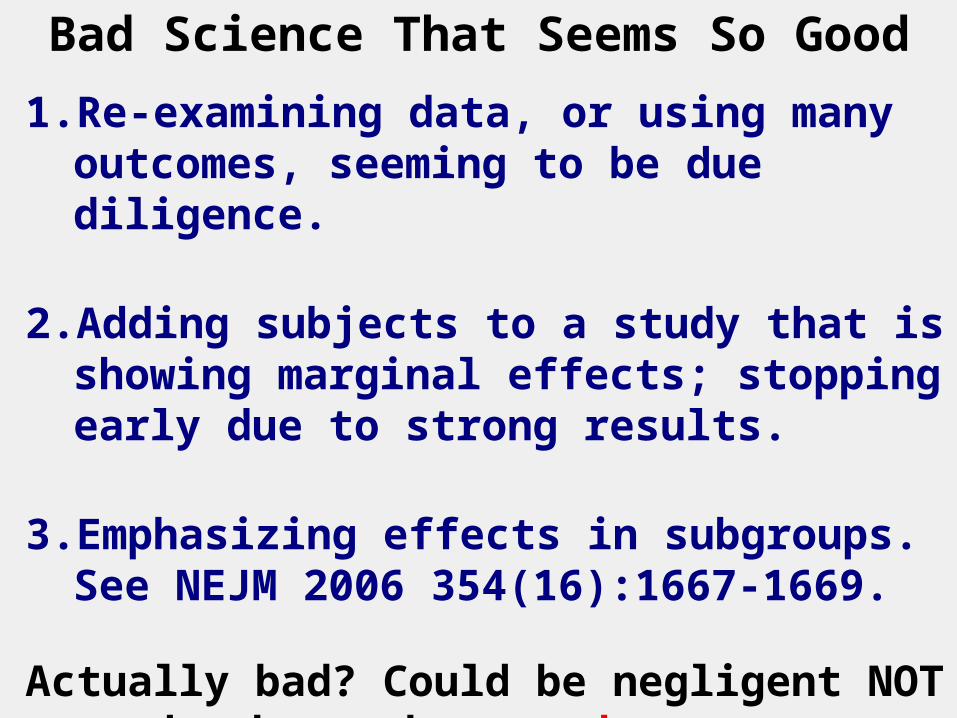
Bad Science That Seems So Good
1. Re-examining data, or using many outcomes, seeming to be due diligence.
2. Adding subjects to a study that is showing marginal effects; stopping early due to strong results.
3. Emphasizing effects in subgroups. See NEJM 2006 354(16):1667-1669.
Actually bad? Could be negligent NOT to do these, but need to account for doing them.