biomarkers of injury and infection - defence...
TRANSCRIPT

Biomarkers of Injury and Infection
Prepared By:
Dr. Christoph W. Sensen, Dr. rer. nat.; Dipl.- Biol. University of Calgary
Faculty of Medicine
Department of Biochemistry and Molecular Biology
Institute of Child and Maternal Health
Visual Genomics Centre
3330 Hospital Drive NW
Calgary, AB, Canada, T2N 4N1
PWGSC Contract Number: W7702‐145655/001EDM
Contract Scientific Authority: Barry Ford, Defence Scientist
The scientif ic or technical validity of this Contract Report is entirely the responsibility of the Contractor and the contents do
not necessarily have the approval or endorsement of Department of National Defence of Canada.
Contract Report
DRDC-RDDC-2015-C245
March 2015

© Her Majesty the Queen in Right of Canada, as represented by the Minister of National Defence, 2015 © Sa Majesté la Reine (en droit du Canada), telle que représentée par le ministre de la Défense nationale, 2015

2
Executive Summary:
Background : Sepsis is an important cause of morbidity and mortality in post-surgery, and in the case of infection with bio-threat agents. Sepsis can be defined as Systemic Inflammatory Response Syndrome (SIRS), in combination with verified microbiological infection, as determined by positive microbial culture from blood. When symptoms of SIRS are observed (fever (or low body temperature), elevated heart rate, elevated breathing rate, falling white cell count), sequelae of the infection may already be present. Serious effects include hypotension, multiple organ dysfunction, coagulopathy, renal failure, CNS dysfunction, and gastrointestinal bleeding. Such patients are extremely ill. The earlier a clear diagnosis can be made, the sooner life saving treatment can be initiated. Conversely,
In collaboration with Dstl Porton Down, (U.K.), DRDC Suffield has been involved in searching for pre-symptomatic host biomarkers of sepsis, with a view to identifying sepsis cases early, so that pre-emptive treatment can occur. Dstl has embarked on a multi-year multi-center recruitment of health pre-surgical patients, with a view to capturing some of the sepsis cases which will arise in post-surgical recovery. Patients are recruited as healthy elective surgery cases, and blood samples collected daily until the patient is discharged healthy, or diagnosed with sepsis.
Method : From the timed collection of blood, a multi-methodology search is undertaken for biomarkers of sepsis and identification of the earliest pre-sepsis time point at which the biomarkers can be detected. Using anonymized samples from the Dstl project, DRDC undertook a preliminary analysis of serum to identify circulating fragments of DNA (circulating nucleic acids, CNA), which were correlated to sepsis outcomes. In addition, DNA sequence data were analyzed to determine whether or not putative microbial sequences could be found and identified as to species.
Results : Using high-throughput sequencing (see Section 2), serum CNA were identified and analyzed (see Section 3 and 4) for DNA sequences over-represented in sepsis cases relative to the control cases. Various quality control and data assurance methods have been applied. The result of this analysis is a panel of 25 CNA fragments (see Table 5) which are only in sepsis samples, not seen in control samples. As well, 16 of the 25 CAN fragments were detected 3 or more days before sepsis was diagnosed based on clinical criteria, thus satisfying the pre-symptomatic requirement.
Conclusion : Using high-throughput sequencing and advanced bioinformatics analysis , we have been able to identify a panel of 25 candidate DNA fragment (CAN) biomarkers which merit further investigation, either by direct assay using existing methods, or by the development of novel assays for point of care use. Subsequent efforts will focus on expanding the biomarker panel, and verifying the existing (or new) markers with increased sample numbers and robust statistics.
Impact : A rapid point of care assay for sepsis, several days before onset of symptoms, could enable useful treatment early enough to reduce morbidity or prevent death from systemic infection.

3
This page intentionally left blank.

Fina
Project:ProjecttProjectsProjectcPrincipa
‐‐‐‐‐‐‐‐‐‐‐
C
lReporton
DRDC,Sufftitle:Biomastartdate:Dcompletion
alInvestigatUniveFaculDeparInstitVisua3330CalgaPhone
‐‐‐‐‐‐‐‐‐‐‐‐‐‐‐
hristophSE
De
D
Medic
nPerforma
field,GrantarkersofInDecember20date:March
tor:Dr.ChriersityofCaltyofMedicirtmentofButeofChildalGenomicsHospitalDrry,AB,Canae:(403)220
‐‐‐‐‐‐‐‐‐‐‐‐‐‐‐
ENSEN
epartment
DefenseR&
POBOX40
cineHat,Al
anceofServ
t#W7702‐1njuryandIn0,2013h31,2015
istophW.SgaryineiochemistrydandMaternCentreriveNWada,T2N4N0‐4301
‐‐‐‐‐‐April1
ofNationa
&DCanada
000Station
berta,T1A
vices,Dece
145655/00nfection
Sensen,Dr.
yandMolecnalHealth
N1
15,2015
alDefense
Suffield
nMain
A8K6,Cana
ember20,2
01EDM
rer.nat.;D
cularBiolog
ada
2013–Mar
Dipl.‐Biol.
gy
rch31,201
4
5
1. ProThegoalinfection
Id D
2. CNAAstheehumans
1w
1h
Table1ltobeint
Seth
Taex
Tsewa
Sese
Sco
ject goals loftheprojnorsepsis.
dentifyCircDetectmicro
A samplesexperimentaserumsamp
06sepsis‐infwhichsampl19 controlumanvarie
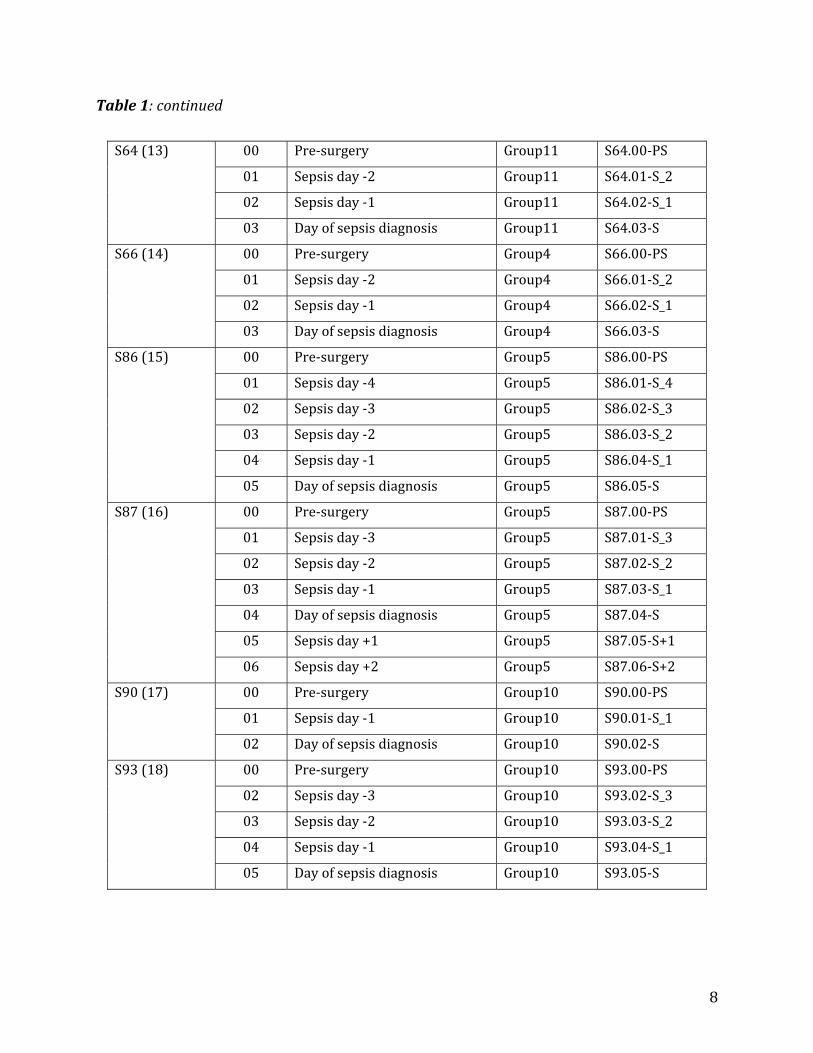
liststhe106erpretedas
epsisgrouphegroup.ThTimepoint:tlways 0 buxample,forTimepointreepsisdiagnwithafewdfterthedayequencing gequencingcamplefilenonsistsof<
jectistodeWehavepe
ulatingNucobespresen
s almodel forplesatdiffer
fectedsamplesweretaksamples obesfrom1to
6sepsissamsfollows:
(number):gheserialnutimepointaut the subsSepsisGrouelativetoseosis.Thesedaysbeforeyofdiagnosigroup: groucentreandsame:name<Sepsisgrou
etectbiomarerformedtw
cleicAcid(CntinCNAth
r identifyingrenttimepo
plesobtainekenfromapbtained fro6.
mplestaken
groupnameumberrunsfatwhicheasequent timupS38thesepsisdiagnosusuallyrunthedayofis.up numberstoredasasofthedataup>.<Timep
rkersinDNwoprimary
NA)biomarhatareindic
gbiomarkeoints.There
edfrom22ppatientrangom 51 huma
from22pa
e(IDgivenfrom1tothchsamplehme points asecondtimesis: timeponfromPre‐sdiagnosis.O
r the sampseparatefolafileasstorpoint>‐<Tim
NAbasedpretasksinord
rkersofsepcativeofsep
erspresentearetwoma
patients.Thgesfrom3tans. The n
atients,whe
toapatienhenumberohasbeentaare not neepointis2,oint indicatesurgerytotOnlyS19an
ple belongslderonthepredonthepmepointrel
esymptomadertoachie
psispsisinfectio
inCNA,weaingroupso
henumberoo7.umber of t
erethecolum
t)andthesofthesepsisaken.Thefirecessarily cnot1.ed inrelatiotheDayofsndS87have
to, as recprojectdataprojectdatalativetosep
aticindicatovethisgoal
on
ehaveusedofsamples:
oftimepoin
time points
mnheading
serialnumbsgroups.rsttimepoconsecutive.
ontothedsepsisdiagnesamplest
ceived fromadisk.adisk.Thenpsisdiagnos
5
orsofl:
d225
ntsat
s per
gsare
berof
intis. For
ayofnosis,taken
m the
namesis>.

6
Table1:Compositionofsepsis‐infectedsamplesintermsofpatientsandtimepoints
Sepsisgroup(number)
Timepoint
Timepointrelativetosepsisdiagnosis
Sequencinggroup
Samplefilename
S19(1) 00 Pre‐surgery Group3 S19.00‐PS
01 Sepsisday‐2 Group3 S19.01‐S_2
02 Sepsisday‐1 Group3 S19.02‐S_1
03 Dayofsepsisdiagnosis Group3 S19.03‐S
04 Sepsisday+1 Group3 S19.04‐S+1
S24(2) 00 Pre‐surgery Group3 S24.00‐PS
01 Sepsisday‐2 Group3 S24.01‐S_2
02 Sepsisday‐1 Group3 S24.02‐S_1
03 Dayofsepsisdiagnosis Group3 S24.03‐S
S28(3) 00 Pre‐surgery Group3 S28.00‐PS
01 Sepsisday‐3 Group3 S28.01‐S_3
02 Sepsisday‐2 Group3 S28.02‐S_2
03 Sepsisday‐1 Group3 S28.03‐S_1
04 Dayofsepsisdiagnosis Group3 S28.04‐S
S38(4) 00 Pre‐surgery Group11 S38.00‐PS
02 Sepsisday‐3 Group11 S38.02‐S_3
03 Sepsisday‐2 Group11 S38.03‐S_2
04 Sepsisday‐1 Group12 S38.04‐S_1
05 Dayofsepsisdiagnosis Group12 S38.05‐S
S41(5) 00 Pre‐surgery Group10 S41.00‐PS
01 Sepsisday‐3 Group10 S41.01‐S_3
02 Sepsisday‐2 Group10 S41.02‐S_2
03 Sepsisday‐1 Group10 S41.03‐S_1
04 Dayofsepsisdiagnosis Group10 S41.04‐S
S42(6) 00 Pre‐surgery Group4 S42.00‐PS
01 Sepsisday‐2 Group4 S42.01‐S_2
02 Sepsisday‐1 Group4 S42.02‐S_1
03 Dayofsepsisdiagnosis Group4 S42.03‐S

7
Table1:continued
S44(7) 00 Pre‐surgery Group11 S44.00‐PS
03 Sepsisday‐3 Group11 S44.03‐S_3
04 Sepsisday‐2 Group11 S44.04‐S_2
05 Sepsisday‐1 Group11 S44.05‐S_1
06 Dayofsepsisdiagnosis Group11 S44.06‐S
S48(8) 00 Pre‐surgery Group11 S48.00‐PS
01 Sepsisday‐3 Group11 S48.01‐S_3
02 Sepsisday‐2 Group11 S48.02‐S_2
03 Sepsisday‐1 Group11 S48.03‐S_1
04 Dayofsepsisdiagnosis Group11 S48.04‐S
S49(9) 00 Pre‐surgery Group10 S49.00‐PS
01 Sepsisday‐1 Group10 S49.01‐S_1
02 Dayofsepsisdiagnosis Group10 S49.02‐S
S55(10) 00 Pre‐surgery Group5 S55.00‐PS
03 Sepsisday‐3 Group5 S55.03‐S_3
04 Sepsisday‐2 Group5 S55.04‐S_2
05 Sepsisday‐1 Group5 S55.05‐S_1
06 Dayofsepsisdiagnosis Group5 S55.06‐S
S57(11) 00 Pre‐surgery Group10 S57.00‐PS
04 Sepsisday‐3 Group10 S57.04‐S_3
05 Sepsisday‐2 Group11 S57.05‐S_2
06 Sepsisday‐1 Group11 S57.06‐S_1
07 Dayofsepsisdiagnosis Group11 S57.07‐S
S63(12) 00 Pre‐surgery Group4 S63.00‐PS
01 Sepsisday‐5 Group4 S63.01‐S_5
02 Sepsisday‐4 Group4 S63.02‐S_4
03 Sepsisday‐3 Group4 S63.03‐S_3
04 Sepsisday‐2 Group4 S63.04‐S_2
05 Sepsisday‐1 Group4 S63.05‐S_1
06 Dayofsepsisdiagnosis Group4 S63.06‐S
8
Table1:continued
S64(13) 00 Pre‐surgery Group11 S64.00‐PS
01 Sepsisday‐2 Group11 S64.01‐S_2
02 Sepsisday‐1 Group11 S64.02‐S_1
03 Dayofsepsisdiagnosis Group11 S64.03‐S
S66(14) 00 Pre‐surgery Group4 S66.00‐PS
01 Sepsisday‐2 Group4 S66.01‐S_2
02 Sepsisday‐1 Group4 S66.02‐S_1
03 Dayofsepsisdiagnosis Group4 S66.03‐S
S86(15) 00 Pre‐surgery Group5 S86.00‐PS
01 Sepsisday‐4 Group5 S86.01‐S_4
02 Sepsisday‐3 Group5 S86.02‐S_3
03 Sepsisday‐2 Group5 S86.03‐S_2
04 Sepsisday‐1 Group5 S86.04‐S_1
05 Dayofsepsisdiagnosis Group5 S86.05‐S
S87(16) 00 Pre‐surgery Group5 S87.00‐PS
01 Sepsisday‐3 Group5 S87.01‐S_3
02 Sepsisday‐2 Group5 S87.02‐S_2
03 Sepsisday‐1 Group5 S87.03‐S_1
04 Dayofsepsisdiagnosis Group5 S87.04‐S
05 Sepsisday+1 Group5 S87.05‐S+1
06 Sepsisday+2 Group5 S87.06‐S+2
S90(17)
00 Pre‐surgery Group10 S90.00‐PS
01 Sepsisday‐1 Group10 S90.01‐S_1
02 Dayofsepsisdiagnosis Group10 S90.02‐S
S93(18) 00 Pre‐surgery Group10 S93.00‐PS
02 Sepsisday‐3 Group10 S93.02‐S_3
03 Sepsisday‐2 Group10 S93.03‐S_2
04 Sepsisday‐1 Group10 S93.04‐S_1
05 Dayofsepsisdiagnosis Group10 S93.05‐S

9
Table1:continued
S94(19) 00 Pre‐surgery Group9 S94.00‐PS
04 Sepsisday‐3 Group9 S94.04‐S_3
05 Sepsisday‐2 Group9 S94.05‐S_2
06 Sepsisday‐1 Group10 S94.06‐S_1
07 Dayofsepsisdiagnosis Group10 S94.07‐S
S98(20) 00 Pre‐surgery Group9 S98.00‐PS
01 Sepsisday‐2 Group9 S98.01‐S_2
02 Sepsisday‐1 Group9 S98.02‐S_1
03 Dayofsepsisdiagnosis Group9 S98.03‐S
S100(21) 00 Pre‐surgery Group9 S100.00‐PS
01 Sepsisday‐3 Group9 S100.01‐S_3
02 Sepsisday‐2 Group9 S100.02‐S_2
03 Sepsisday‐1 Group9 S100.03‐S_1
04 Dayofsepsisdiagnosis Group9 S100.04‐S
S102(22) 00 Pre‐surgery Group9 S102.00‐PS
04 Sepsisday‐3 Group9 S102.04‐S_3
05 Sepsisday‐2 Group9 S102.05‐S_2
06 Sepsisday‐1 Group9 S102.06‐S_1
07 Dayofsepsisdiagnosis Group9 S102.07‐S
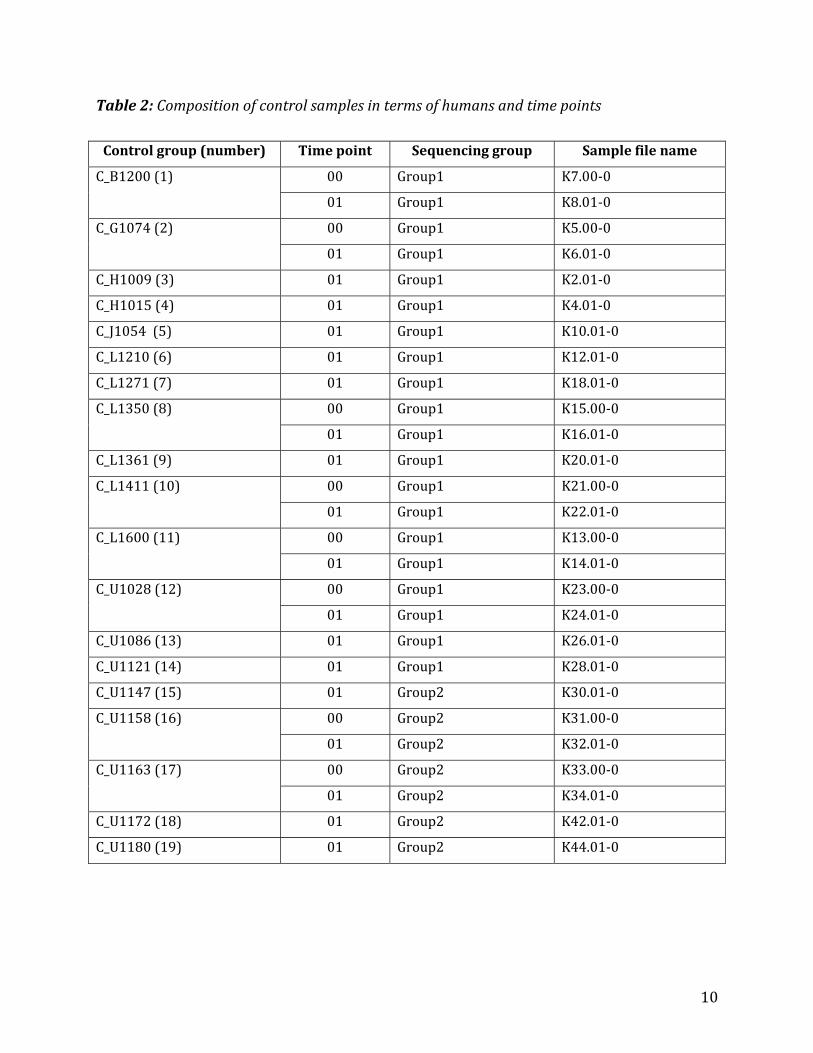
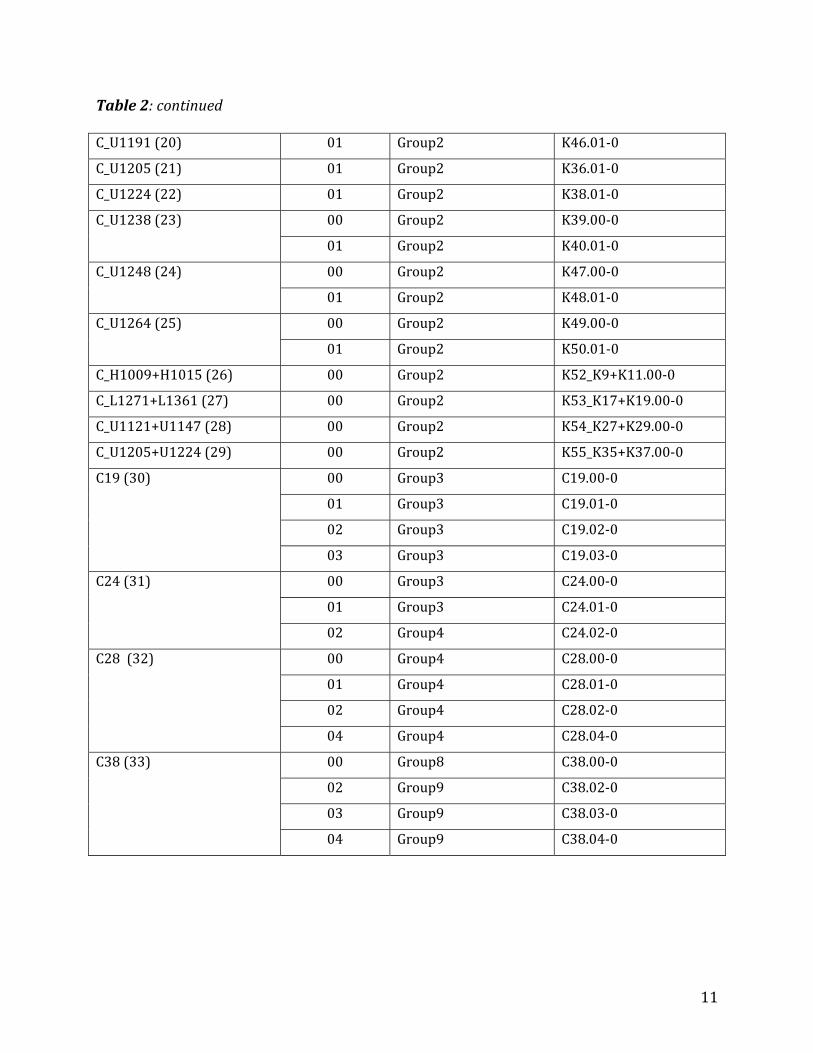
Table2liststhe119controlsamplestakenfrom51humans,wherethecolumnheadingsmean:
Controlgroup(number):groupname(IDgiventoahuman)andtheserialnumberofthe group. The serial number runs from 1 to the number of the control groups.There are four samples pooled from two humans each. For example, the Controlgroup C_H1009+H1015, time point 0 sample has been pooled from the ControlgroupsH1009andH1015,bothattimepoint0.
Timepoint:timepointatwhicheachsamplehasbeentaken.Thefirsttimepointisalways00butthesubsequenttimepointsarenotnecessarilyconsecutive.
Sequencing group: group number the sample belongs to, as received from thesequencingcentreandstoredasaseparatefolderontheprojectdatadisk.
Samplefilename:nameofthedatafileasstoredontheprojectdatadisk.Thenameconsistsof<Controlgroup>.<Timepoint>‐0.
10
Table2:Compositionofcontrolsamplesintermsofhumansandtimepoints
Controlgroup(number) Timepoint Sequencinggroup Samplefilename
C_B1200(1) 00 Group1 K7.00‐0
01 Group1 K8.01‐0
C_G1074(2) 00 Group1 K5.00‐0
01 Group1 K6.01‐0
C_H1009(3) 01 Group1 K2.01‐0
C_H1015(4) 01 Group1 K4.01‐0
C_J1054(5) 01 Group1 K10.01‐0
C_L1210(6) 01 Group1 K12.01‐0
C_L1271(7) 01 Group1 K18.01‐0
C_L1350(8) 00 Group1 K15.00‐0
01 Group1 K16.01‐0
C_L1361(9) 01 Group1 K20.01‐0
C_L1411(10) 00 Group1 K21.00‐0
01 Group1 K22.01‐0
C_L1600(11) 00 Group1 K13.00‐0
01 Group1 K14.01‐0
C_U1028(12) 00 Group1 K23.00‐0
01 Group1 K24.01‐0
C_U1086(13) 01 Group1 K26.01‐0
C_U1121(14) 01 Group1 K28.01‐0
C_U1147(15) 01 Group2 K30.01‐0
C_U1158(16) 00 Group2 K31.00‐0
01 Group2 K32.01‐0
C_U1163(17) 00 Group2 K33.00‐0
01 Group2 K34.01‐0
C_U1172(18) 01 Group2 K42.01‐0
C_U1180(19) 01 Group2 K44.01‐0
11
Table2:continuedC_U1191(20) 01 Group2 K46.01‐0
C_U1205(21) 01 Group2 K36.01‐0
C_U1224(22) 01 Group2 K38.01‐0
C_U1238(23) 00 Group2 K39.00‐0
01 Group2 K40.01‐0
C_U1248(24) 00 Group2 K47.00‐0
01 Group2 K48.01‐0
C_U1264(25) 00 Group2 K49.00‐0
01 Group2 K50.01‐0
C_H1009+H1015(26) 00 Group2 K52_K9+K11.00‐0
C_L1271+L1361(27) 00 Group2 K53_K17+K19.00‐0
C_U1121+U1147(28) 00 Group2 K54_K27+K29.00‐0
C_U1205+U1224(29) 00 Group2 K55_K35+K37.00‐0
C19(30) 00 Group3 C19.00‐0
01 Group3 C19.01‐0
02 Group3 C19.02‐0
03 Group3 C19.03‐0
C24(31) 00 Group3 C24.00‐0
01 Group3 C24.01‐0
02 Group4 C24.02‐0
C28(32) 00 Group4 C28.00‐0
01 Group4 C28.01‐0
02 Group4 C28.02‐0
04 Group4 C28.04‐0
C38(33) 00 Group8 C38.00‐0
02 Group9 C38.02‐0
03 Group9 C38.03‐0
04 Group9 C38.04‐0

12
Table2:continuedC41(34) 00 Group8 C41.00‐0
01 Group8 C41.01‐0
02 Group8 C41.02‐0
C42(35) 00 Group6 C42.00‐0
01 Group6 C42.01‐0
02 Group6 C42.02‐0
C44(36) 00 Group8 C44.00‐0
03 Group8 C44.03‐0
05 Group8 C44.05‐0
C48(37) 00 Group8 C48.00‐0
01 Group8 C48.01‐0
02 Group8 C48.02‐0
03 Group8 C48.03‐0
C49(38) 00 Group8 C49.00‐0
01 Group8 C49.01‐0
C55(39) 00 Group6 C55.00‐0
03 Group6 C55.03‐0
04 Group6 C55.04‐0
05 Group6 C55.05‐0
C57(40) 00 Group8 C57.00‐0
04 Group8 C57.04‐0
05 Group8 C57.05‐0
06 Group8 C57.06‐0
C63(41) 00 Group5 C63.00‐0
01 Group5 C63.01‐0
02 Group6 C63.02‐0
03 Group6 C63.03‐0
04 Group6 C63.04‐0
05 Group6 C63.05‐0

13
Table2:continuedC64(42) 00 Group8 C64.00‐0
04 Group8 C64.04‐0
05 Group8 C64.05‐0
C66(43) 00 Group6 C66.00‐0
01 Group6 C66.01‐0
02 Group6 C66.02‐0
C86(44) 01 Group6 C86.01‐0
02 Group6 C86.02‐0
03 Group6 C86.03‐0
04 Group6 C86.04‐0
C87(45) 00 Group6 C87.00‐0
01 Group6 C87.01‐0
02 Group12 C87.02‐0
03 Group12 C87.03‐0
05 Group12 C87.05‐0
C90(46) 00 Group7 C90.00‐0
01 Group7 C90.01‐0
C93(47) 00 Group7 C93.00‐0
02 Group7 C93.02‐0
03 Group7 C93.03‐0
04 Group7 C93.04‐0
C94(48) 00 Group7 C94.00‐0
04 Group7 C94.04‐0
05 Group7 C94.05‐0
06 Group7 C94.06‐0
C98(49) 00 Group7 C98.00‐0
01 Group7 C98.01‐0
02 Group7 C98.02‐0
14
Table2:continuedC100(50) 00 Group7 C100.00‐0
01 Group7 C100.01‐0
02 Group7 C100.02‐0
03 Group7 C100.03‐0
C102(51) 04 Group7 C102.04‐0
05 Group7 C102.05‐0
06 Group7 C102.06‐0
2.1 CNA extraction
WeextractedCNAusingtheHighPureViralNucleicAcidKit(RocheAppliedScience;Cat.No.11858874001).Theextractionprocedureisasfollows:
Preparebuffersfollowingthemanual− Add40ml96%EtOHtoWashBuffer.− Add20ml96%EtOHtoInhibitorRemovalBuffer− LyselyophilizedProteinaseKin5mlElutionBuffer,store50µlaliquotsat‐20°C.− DONOTaddpoly(A)carrierRNAtoBindingBuffer
Make4Kspinbeforestartwithextractiontoremovecelldebris− Centrifuge250µlserumat4000rpmfor20min− Transfersupernatantinfreshtube,leave50µlinoldtube,donotdisturbpellet
(celldebris) Add200µlbindingbufferand50µlProteinaseK(20mg/ml,Roche)to200µlserum.
− Vortexsampleandincubatefor10min@72°C. Add100µlbindingbufferandmixsamplesbyvortexing Pipette550µlsampleonthecolumn.
− Spinsamplefor1min@8000rcf− Discardcollectiontube.
Add500µlinhibitorremovalbuffer− Spinsamplefor1min@8000rcf− Discardcollectiontube
Add450µlwashbuffer− Spinsamplefor1min@8000rcf− Discardcollectiontube
Add450µlwashbuffer− Spinsamplefor1min@8000rcf− Emptythecollectiontube− Centrifugesamplefor10satmaxspeed− Discardcollectiontube
Transfercolumnsin1.5mleppendorfcups Add50µlofelutionbuffer
− Spinsamplefor1min@8000rcf
15
2.2 Amplification of extracted CNA
2.2.1MaterialsThefollowingmaterialshavebeenusedforamplificationofextractedCNA:
Kit/MaterialName Vendor
Order#(GER)
RXNinKit
RXNpersample
GenomePlexSingleCellWholeGenomeAmplificationKit
Sigma
WGA4‐50RXN
50 1
EvaGreen(20x,RTdye) Biotium
31000‐T Ca.500 2
GenElute™PCRClean‐UpKit Sigma
NA1020‐1KT
70 2
AgaroseGel any N/A N/A twolanespersample
Molecularweightladder any N/A N/A twolanespergel
Positivecontrol:1µlControlDNA(WGA4Kit)+4µlnucl.freewater Negativecontrol:5µlnucl.freewater
2.2.2Procedure1. SingleCellLyseandFragmentation
PrepareLysisandFragmentationbuffer:− 2µl ProteinaseKSolution,− 32µl 10xSingleCellLysis&FragmentationBuffer
Pipetteto5µlextractedCNA0.5µlpreparedLysis&FragmentationBuffer Totalreactionvolumenow5.5µlin200µlPCR‐Tube Incubation:setcycler:50°Cfor1hand99°Cfor4min Coolsamplesoniceimmediately Spintocollectanyliquidfromtubecaps
2. LibraryPreparation Addtoeachsample1µl1xSingleCellLibraryPrep.Bufferand0.5µlLibrary
StabilizationSolution,mixsolutionbypipettingupanddown Totalreactionvolumenow7µl Incubateincyclerfor2min@95°C. Coolsamplesonice,spinandadd0.5µlLibraryPrep.Enzyme. Mixbypipettingupanddown
16
Totalreactionvolumenow7.5µl Incubateincyclerasfollows:
− 16°C 20min− 24°C 20min− 37°C 20min− 75°C 5min− 4°C hold
3.Amplification(inReal‐TimeCycler)
Addtoeachsamplethefollowingreagents:
− 3.75 µl 10xAmplificationMastermix − 21.875 µl Nuclease‐freewater − 1.875 µl EVAGreen − 2.5 µl WGADNAPolymerase
Preparemastermixforallsamplesandadd30µltoeachsample. Totalreactionvolumenow37.5µl. CyclinginReal‐TimeCyclerwithfluorescencemonitoringineachcycle
− InitialDenaturation: 95°C 3min
− 25cycles: 94°C 30s 65°C 5min 80°C 1s Fluorescencedetection
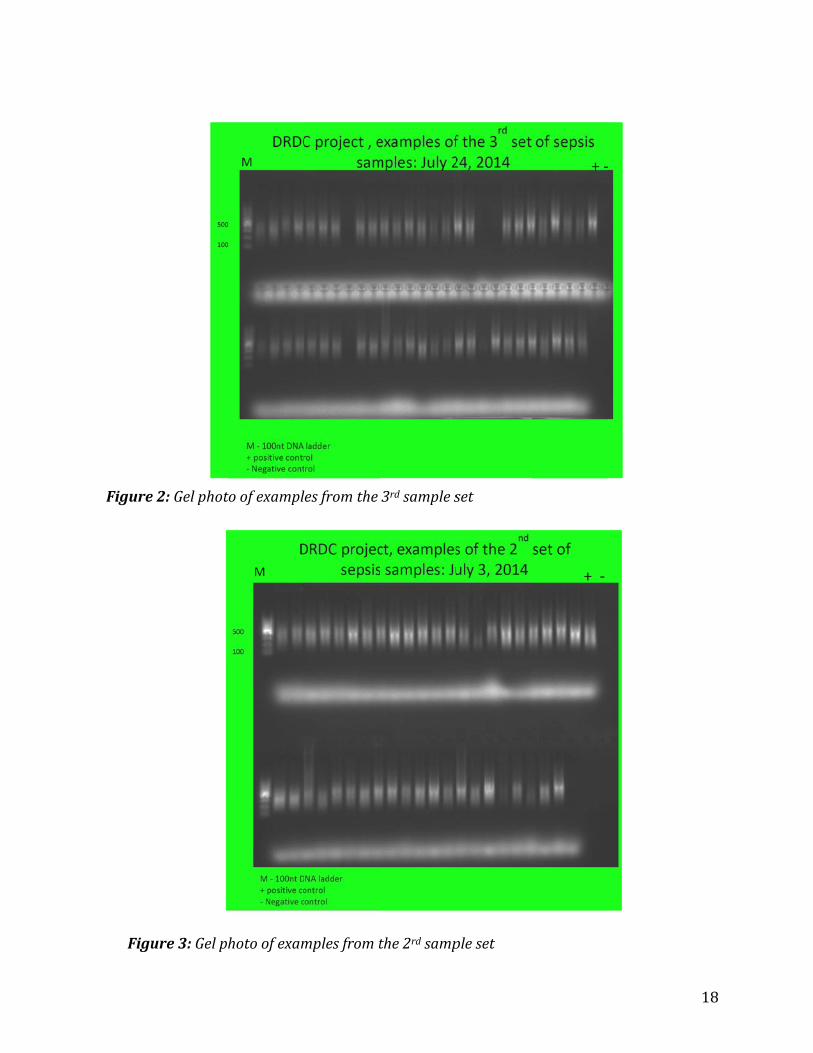
Thereactionswerestoppedattheinflationpointoftheamplificationcurvetoavoidovercycling.Somesamplesreachedtheinflationpointearlierthanothers(Figure1).
ControlGel− 5µlofeachreaction(WGA4)wereloadedona1.5%agarose/EtBrgel.− thegelswererunfor35min@120V.
Twoindependentreactionspersamplewereprepared,thencheckedon1.5%agarosegel.
Afterwardsthetworeactionsofthesamesamplewerepooled. At last we purified the reactions using the GenElute™ PCR Clean‐Up Kit (Sigma)
according to the instructions of manufacturer and submitted the samples forsequencing.

Figure12.2.3Re
5µl of eaquality asamplessufficienreaction
1:CNAampl
esults
achWGA4and the amwere omit
ntthatPCRfromexam
lificationcur
PCR reactiomount.Whentted from treactionwa
mplesofthe3
rve
onwas loadn the PCR dthe furtherasrepeated3rd,2nd,and
dedon a1.did not givr analysis. Id.Figures2d1stsetofsa
5%agaroseve any resuIf one of t,3,and4samples,resp
e/EtBr gellts in boththe two reashowthegepectively.
to checkupreactions tactions waselphotosof
17
p thethoses notfPCR
Figure
Figu
e2:Gelphot
ure3:Gelp
toofexampl
hotoofexam
lesfromthe
mplesfromt
3rdsamples
the2rdsamp
set
pleset
18
Figu
3. SeqWereceireceivedcontroldifferent
Table3:
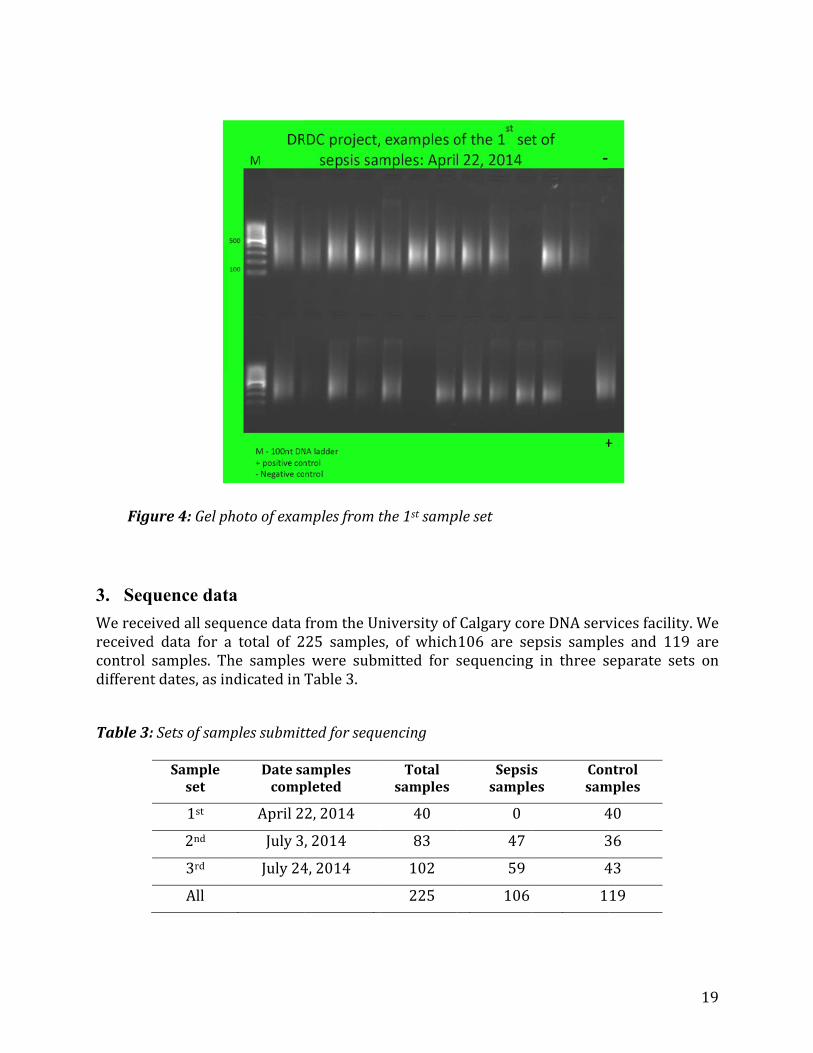
ure4:Gelp
quence dativedallseqd data for asamples. Thtdates,asin
:Setsofsam
Sampleset
1st
2nd
3rd
All
hotoofexam
ta uencedataa total of 2he samplesndicatedin
mplessubmit
Datesacomp
April2
July3
July24
mplesfromt
fromtheUn25 sampless were submTable3.
ttedforsequ
amplespleted
2,2014
,2014
4,2014
the1stsamp
niversityofs, of whichmitted for s
uencing
Totalsamples
40
83
102
225
pleset
f Calgarycorh106 are sesequencing
Sepsissample
0
47
59
106
reDNAservepsis samplg in three s
ses
Consam
4
3
4
1
vicesfacilityles and 119separate set
ntrolmples
40
36
43
19
19
y.We9 arets on

20
ThesequencingdatahavebeendeliveredtotheSensenlabin12groups,whereeachgroupconsistsof20samples,exceptGroup12.Table4showsthebreakdownofthesequencingdataintothegroupsandtheresultsofthealignmenttothehumangenomes(detailsofthealignmentdescribedinDataAnalysisMethodsection).
Table4:Groupsofsamplesreceivedfromsequencingcentre
GroupSamplenumberand
type TotalreadsTotalaligned
reads
Percentageofalignedreads
Group1 20controls 641,292,770 537,120,770 83.76
Group2 20controls 663,985,610 567,111,180 85.41
Group3 14sepsis+6controls 1,287,073,030 1,052,965,712 81.81
Group4 15sepsis+5controls 680,284,574 566,045,748 83.21
Group5 18sepsis+2controls 664,621,878 550,577,438 82.84
Group6 20controls 616,853,292 526,793,888 85.40
Group7 20controls 806,863,126 648,098,936 80.32
Group8 20controls 844,205,872 681,976,552 80.78
Group9 17sepsis+3controls 637,011,226 532,440,668 83.58
Group10 20sepsis 641,622,180 528,781,074 82.41
Group11 20sepsis 608,086,388 509,915,786 83.86
Group12 2sepsis+3controls 192,383,044 159,704,264 83.01
Total106sepsis+119controls(=225total) 8,284,282,990 6,861,532,016 82.83
ThealignmentresultsaregeneratedbytheLifeScopegenomicanalysissoftware(http://www.lifetechnologies.com/ca/en/home/technical‐resources/software‐downloads/lifescope‐genomic‐analysis‐software.html)offeredbyLifeTechnologies.
4. Data analysis method Figure5showstheworkflowoftheanalysispipeline,whichisasfollows:
1.Alignmentfileanalysis Extracttwosetsofgenomicregionsfromthereferencegenome
− Regionsmappedtoinfectedsamples− Regionsmappedtocontrolsamples

21
Deletethoseregionsfromthefirstsetofregionswhosepositionsoverlapwiththesecondsetofregions.Thismethodextracts“control‐free”regions.
Collectthecontrol‐freeregionswithahighnumberofhitsfrominfectedsamplesandlisttheirgenomicfeatures(e.g.genes,codingsequences,RNA)thatareclosest.
Analyzetheregionsforvarioustimepoints2.Bacteria/virusdetection Collectthereadsthatarenotmappedtothereferencegenome(i.e.unmappedreads) Aligntheunmappedreadstothebacteria/virusdatabase Findthebacterial/virustracesfromthealignedreadsStartingwiththesequencedata,weperformedaseriesofprocessingstepstoidentifyDNAbiomarkersandtodetectmicrobes, thus formingananalysispipeline.TheCNAsequenceanalysispipelinehasfourmajorsteps:3.Datapreprocessing Clipadaptorbases Trimlowqualitybases(baseswithlowerthanPhredqualityscore20,correspondingto
99%basecallconfidence)4.Alignmentfilecreation
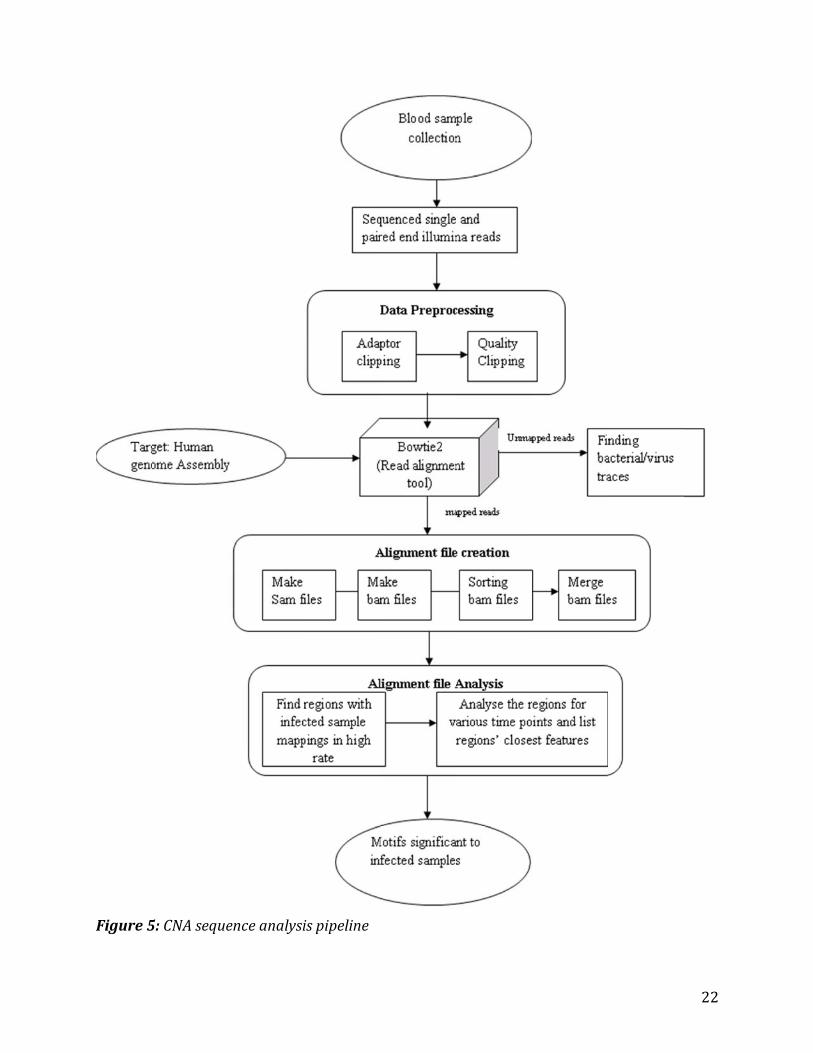
Figure55:CNAsequeenceanalysiispipeline
22

23
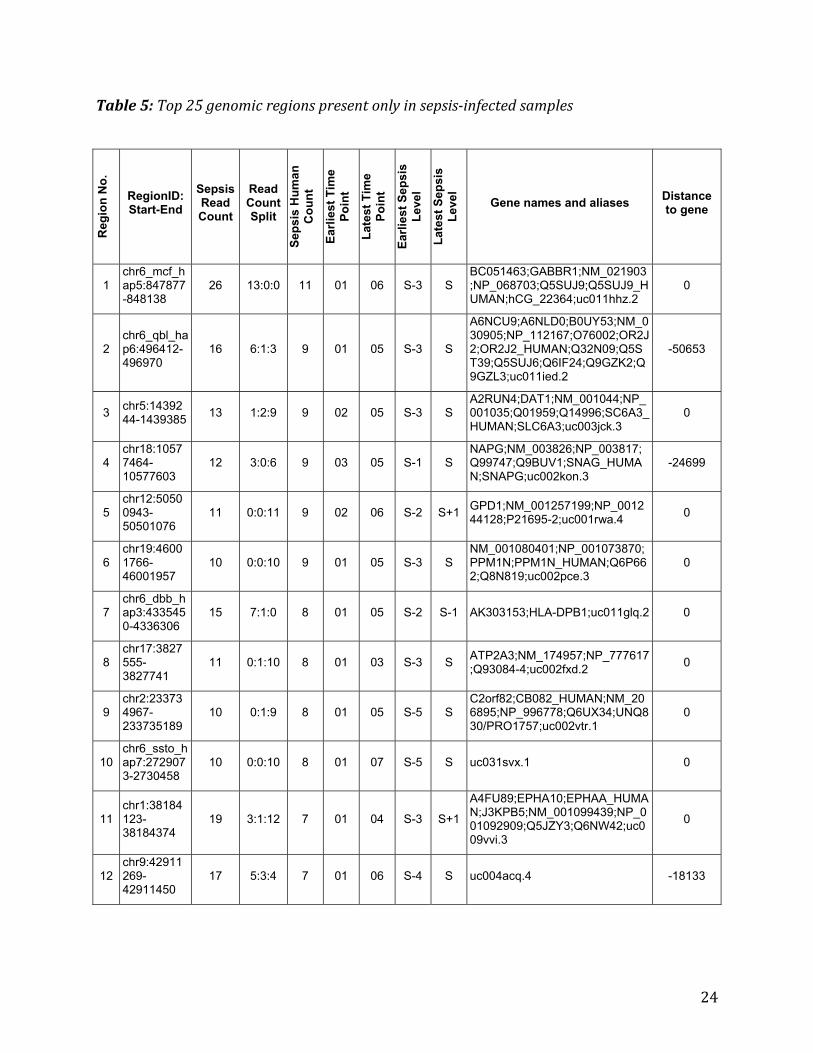
5. Results of detecting biomarkers of infection Acomparativeanalysisofthealignmentfilesrevealsthegenomicregionsthatarepresentininfectedsamplesbutnotincontrolsamples.Thesearecalledcontrol‐freeregionsandformthecoreoftheinfectionbiomarkerdetectionresults.Table5liststop25suchgenomicregions.Theregionshavebeensortedindescendingorderofthecountofhumanswhosesampleshadareadmappingtotheregion.Eachrowofthetablepresentsmanyimportantattributesofasignificantgenomicregion.Thedefinitionsoftheattributes(i.e.columnheadings)areasfollows: RegionNo.:serialnumberoftheregionstartingfrom1. RegionID:Start‐End:genomicpositionincludingtheregionID,startbpandendbp Asperthereferencegenomedownloadedfrom
http://hgdownload.cse.ucsc.edu/goldenPath/hg19/chromosomes SepsisReadCount:totalcountofthesepsissamplereadsmappedtotheregion
(consideringbothproperlypairedmappedandsinglemappedreads). ReadCountSplit:threevaluesseparatedbyacolontoindicatethebreakdownofthe
mappedreadswithrespecttoreadpairing. Firstvalue:countofproperlypairedandmappedreadpairs.Forexample,ifthisvalue
is3,thenthereare3properlypairedreadpairs(3x2=6reads)mappedwithintheregion,whichmeansthat3DNAfragmentsarepresentinthatregion.
Secondvalue:countofproperlypairedreadpairs,whereonlyoneofthereadsinthepairispresentwithintheregion
Thirdvalue:countofreadsthatnotproperlypairedandmapped.Thesecanbeconsideredassingleendreads.
Forexample,aReadCountSplitrepresentedas6:1:3amountstothetotalreadcountof6x2+1+3=16,whichisequaltotheSepsisReadCountvalueoftheregion.
SepsisHumanCount:countofhumansinfectedbysepsiswhosesampleshadareadmappedtothisregion.Themaximumpossiblecountis22,asthetotalnumberofsepsis‐infectedhumansis22.
EarliestTimePoint:earliesttimepointwhenareadmappedtotheregion.Thetimepointrangesfrom01to07.
LatestTimePoint:latesttimepointwhenareadmappedtotheregion.Thetimepointrangesfrom01to07.
EarliestSepsisLevel:earliestsepsislevelwhenareadmappedtotheregion.SepsislevelrangesfromS‐5toS+2,whereSreferstothedayofsepsisdiagnosis.
LatestSepsisLevel:latestsepsislevelwhenareadmappedtotheregion. Genenames/aliases:knownnames/aliasesofthegenethatisclosesttotheregion.
− Basedontheannotationfilesdownloadedfromhttp://hgdownload.cse.ucsc.edu/goldenPath/hg19/database
Distancetogene:shortestdistance(inbp)fromtheregiontothegenelocation.− Distanceiswithrespecttotheregion.− Anegativedistancerepresentsadistancetoupstreamfeatures.− Whentheregionisonthenegativestrand,"upstream"meansthegenehasahigher
(start,stop)bpnumbers.
24
Table5:Top25genomicregionspresentonlyinsepsis‐infectedsamples
Reg
ion
No
.
RegionID: Start-End
Sepsis Read Count
Read Count Split
Sep
sis
Hu
man
C
ou
nt
Ear
liest
Tim
e P
oin
t
Lat
est
Tim
e P
oin
t
Ear
liest
Sep
sis
Lev
el
Lat
est
Sep
sis
Lev
el
Gene names and aliases Distance to gene
1 chr6_mcf_hap5:847877-848138
26 13:0:0 11 01 06 S-3 S BC051463;GABBR1;NM_021903;NP_068703;Q5SUJ9;Q5SUJ9_HUMAN;hCG_22364;uc011hhz.2
0
2 chr6_qbl_hap6:496412-496970
16 6:1:3 9 01 05 S-3 S
A6NCU9;A6NLD0;B0UY53;NM_030905;NP_112167;O76002;OR2J2;OR2J2_HUMAN;Q32N09;Q5ST39;Q5SUJ6;Q6IF24;Q9GZK2;Q9GZL3;uc011ied.2
-50653
3 chr5:1439244-1439385 13 1:2:9 9 02 05 S-3 S
A2RUN4;DAT1;NM_001044;NP_001035;Q01959;Q14996;SC6A3_HUMAN;SLC6A3;uc003jck.3
0
4 chr18:10577464-10577603
12 3:0:6 9 03 05 S-1 S NAPG;NM_003826;NP_003817;Q99747;Q9BUV1;SNAG_HUMAN;SNAPG;uc002kon.3
-24699
5 chr12:50500943-50501076
11 0:0:11 9 02 06 S-2 S+1 GPD1;NM_001257199;NP_001244128;P21695-2;uc001rwa.4 0
6 chr19:46001766-46001957
10 0:0:10 9 01 05 S-3 S NM_001080401;NP_001073870;PPM1N;PPM1N_HUMAN;Q6P662;Q8N819;uc002pce.3
0
7 chr6_dbb_hap3:4335450-4336306
15 7:1:0 8 01 05 S-2 S-1 AK303153;HLA-DPB1;uc011glq.2 0
8 chr17:3827555-3827741
11 0:1:10 8 01 03 S-3 S ATP2A3;NM_174957;NP_777617;Q93084-4;uc002fxd.2 0
9 chr2:233734967-233735189
10 0:1:9 8 01 05 S-5 S C2orf82;CB082_HUMAN;NM_206895;NP_996778;Q6UX34;UNQ830/PRO1757;uc002vtr.1
0
10 chr6_ssto_hap7:2729073-2730458
10 0:0:10 8 01 07 S-5 S uc031svx.1 0
11 chr1:38184123-38184374
19 3:1:12 7 01 04 S-3 S+1
A4FU89;EPHA10;EPHAA_HUMAN;J3KPB5;NM_001099439;NP_001092909;Q5JZY3;Q6NW42;uc009vvi.3
0
12 chr9:42911269-42911450
17 5:3:4 7 01 06 S-4 S uc004acq.4 -18133

25
Table5:continued
13 chr6_mcf_hap5:1159975-1160669
15 7:1:0 7 01 07 S-2 S uc011hjd.2 0
14 chr6_mcf_hap5:3205001-3205262
15 6:3:0 7 01 06 S-3 S NANH;NEU1;NEUR1_HUMAN;NM_000434;NP_000425;Q99519;uc011huo.2
1445
15 chr6_mcf_hap5:662177-662553
14 7:0:0 7 01 07 S-2 S B0S862;NM_013936;NP_039224;O12D2_HUMAN;OR12D2;P58182;Q5SUN9;Q6IET9;uc011hhp.2
5045
16 chr6_mcf_hap5:418315-419128
12 5:2:0 7 02 06 S-2 S uc011hhl.2 0
17 chr6_cox_hap2:4422799-4423390
11 3:1:4 7 01 04 S-3 S
DOA_HUMAN;HLA-DNA;HLA-DOA;HLA-DZA;NM_002119;NP_002110;P06340;Q58HU0;Q58HU1;Q5STC7;Q9TQC6;Q9TQC7;Q9TQC8;Q9TQC9;Q9TQD0;Q9TQD1;Q9TQD2;Q9TQD3;uc011fpd.1
-914
18 chr10:18429179-18429456
9 0:0:9 7 01 05 S-3 S-1
A6PVM5;A6PVM7;A6PVM8;CACB2_HUMAN;CACNB2;CACNLB2;MYSB;NM_201596;NP_963890;O00304;Q08289;Q5QJ99;Q5QJA0;Q5VVG9;Q5VVH0;Q5VWV6;Q6TME1;Q6TME2;Q6TME3;Q8WX81;Q96NZ3;Q96NZ4;Q96NZ5;Q9BWU2;Q9HD32;Q9Y340;Q9Y341;uc001ipr.2
150
19 chr12:56469524-56469642
9 0:0:9 7 01 05 S-2 S-1 ERBB3;HER3;NM_001005915;NP_001005915;P21860-2;uc001sjg.3
4167
20 chr18:36889043-36889496
9 0:0:9 7 01 03 S-3 S LINC00669;NR_024391;uc010xcj.1 0
21 chr6:170778730-170779113
9 2:1:4 7 01 06 S-3 S AB209078;NM_002793;PSMB1;uc003qxq.2 994
22 chr6_mcf_hap5:3513362-3515031
9 1:1:6 7 02 04 S-2 S AK296648;B7Z424;B7Z424_HUMAN;E9PFW1;PPT2;PPT2-EGFL8;uc021zsg.1
0
23 chr17:46101470-46101720
8 0:0:8 7 01 07 S-3 S uc002imy.3 1813
24 chr3:141384733-141384883
8 0:0:8 7 01 05 S-2 S GAP1M;NM_006506;NP_006497;Q15283-2;RASA2;RASGAP;uc003etz.1
-53537
25 chr10:50818520-50818921
7 0:0:7 7 01 05 S-1 S CHAT;D3DX95;D3DX95_HUMAN;NM_020984;NP_066264;hCG_1996663;uc001jhv.1
0

26
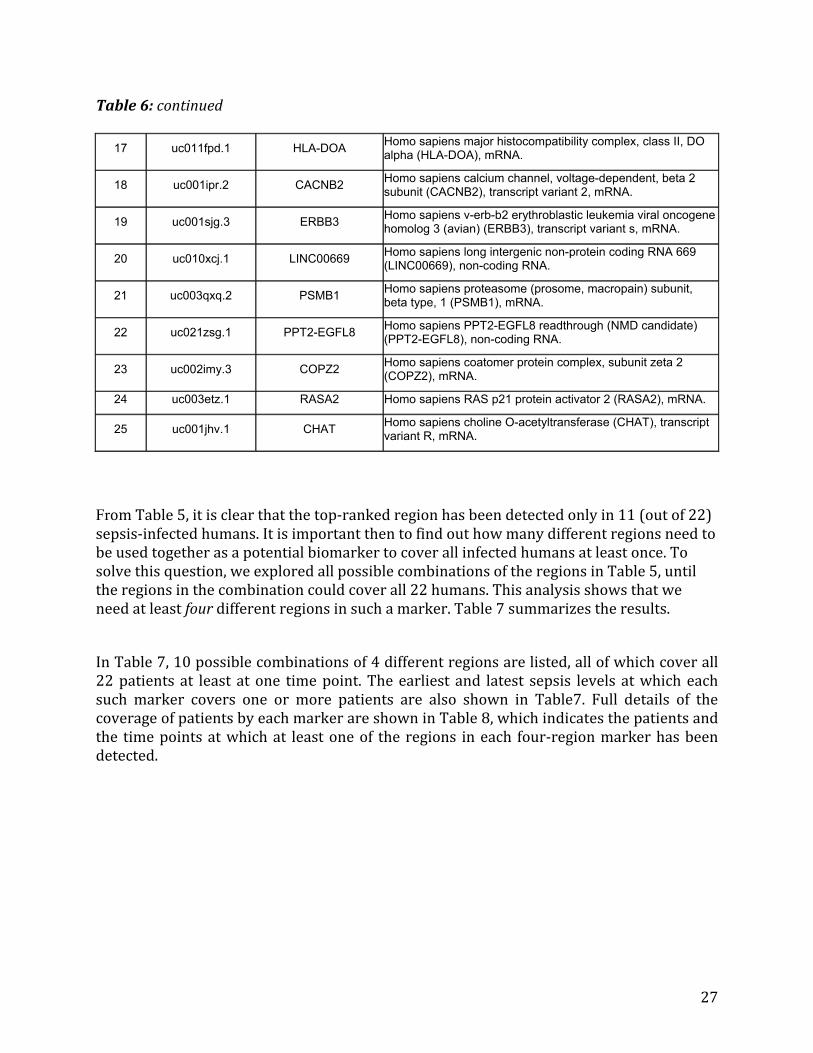
Additionally,Table6providesdescriptionsofthegenespresentinthetopregionsshowninTable5.
Table6:Descriptionofgenespresentintopcontrol‐freeregions
Region No.
Gene name (UCSC)
Gene symbol(RefSeq) Gene description
1 uc011hhz.2 GABBR1 Homo sapiens gamma-aminobutyric acid (GABA) B receptor, 1 (GABBR1), transcript variant 2, mRNA.
2 uc011ied.2 OR2J2 Homo sapiens olfactory receptor, family 2, subfamily J, member 2 (OR2J2), mRNA.
3 uc003jck.3 SLC6A3 Homo sapiens solute carrier family 6 (neurotransmitter transporter, dopamine), member 3 (SLC6A3), mRNA.
4 uc002kon.3 NAPG Homo sapiens N-ethylmaleimide-sensitive factor attachment protein, gamma (NAPG), mRNA.
5 uc001rwa.4 GPD1 Homo sapiens glycerol-3-phosphate dehydrogenase 1 (soluble) (GPD1), transcript variant 2, mRNA.
6 uc002pce.3 PPM1N Homo sapiens protein phosphatase, Mg2+/Mn2+ dependent, 1N (putative) (PPM1N), mRNA.
7 uc011glq.2 HLA-DPB1 Homo sapiens major histocompatibility complex, class II, DP beta 1 (HLA-DPB1), mRNA.
8 uc002fxd.2 ATP2A3 Homo sapiens ATPase, Ca++ transporting, ubiquitous (ATP2A3), transcript variant 6, mRNA.
9 uc002vtr.1 C2orf82 Homo sapiens chromosome 2 open reading frame 82 (C2orf82), mRNA.
10 uc031svx.1 MICB Homo sapiens MHC class I polypeptide-related sequence B (MICB), mRNA.
11 uc009vvi.3 EPHA10 Homo sapiens EPH receptor A10 (EPHA10), transcript variant 3, mRNA.
12 uc004acq.4 AQP7P3 Homo sapiens aquaporin 7 pseudogene 3 (AQP7P3), non-coding RNA.
13 uc011hjd.2 HLA-F Homo sapiens major histocompatibility complex, class I, F (HLA-F), transcript variant 3, mRNA.
14 uc011huo.2 NEU1 Homo sapiens sialidase 1 (lysosomal sialidase) (NEU1), mRNA.
15 uc011hhp.2 OR12D2 Homo sapiens olfactory receptor, family 12, subfamily D, member 2 (OR12D2), mRNA.
16 uc011hhl.2 OR2J3 Homo sapiens olfactory receptor, family 2, subfamily J, member 3 (OR2J3), mRNA.
27
Table6:continued
17 uc011fpd.1 HLA-DOA Homo sapiens major histocompatibility complex, class II, DO alpha (HLA-DOA), mRNA.
18 uc001ipr.2 CACNB2 Homo sapiens calcium channel, voltage-dependent, beta 2 subunit (CACNB2), transcript variant 2, mRNA.
19 uc001sjg.3 ERBB3 Homo sapiens v-erb-b2 erythroblastic leukemia viral oncogene homolog 3 (avian) (ERBB3), transcript variant s, mRNA.
20 uc010xcj.1 LINC00669 Homo sapiens long intergenic non-protein coding RNA 669 (LINC00669), non-coding RNA.
21 uc003qxq.2 PSMB1 Homo sapiens proteasome (prosome, macropain) subunit, beta type, 1 (PSMB1), mRNA.
22 uc021zsg.1 PPT2-EGFL8 Homo sapiens PPT2-EGFL8 readthrough (NMD candidate) (PPT2-EGFL8), non-coding RNA.
23 uc002imy.3 COPZ2 Homo sapiens coatomer protein complex, subunit zeta 2 (COPZ2), mRNA.
24 uc003etz.1 RASA2 Homo sapiens RAS p21 protein activator 2 (RASA2), mRNA.
25 uc001jhv.1 CHAT Homo sapiens choline O-acetyltransferase (CHAT), transcript variant R, mRNA.
FromTable5,itisclearthatthetop‐rankedregionhasbeendetectedonlyin11(outof22)sepsis‐infectedhumans.Itisimportantthentofindouthowmanydifferentregionsneedtobeusedtogetherasapotentialbiomarkertocoverallinfectedhumansatleastonce.Tosolvethisquestion,weexploredallpossiblecombinationsoftheregionsinTable5,untiltheregionsinthecombinationcouldcoverall22humans.Thisanalysisshowsthatweneedatleastfourdifferentregionsinsuchamarker.Table7summarizestheresults.
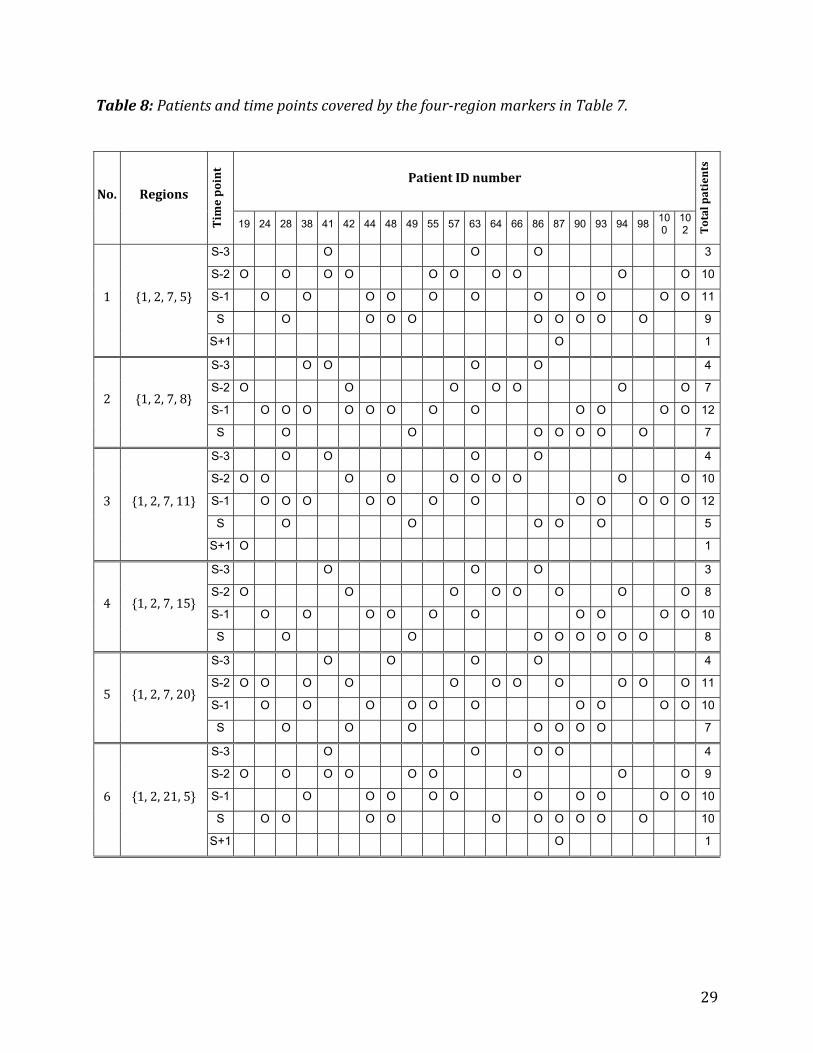
InTable7,10possiblecombinationsof4differentregionsarelisted,allofwhichcoverall22patients at least atone timepoint.Theearliest and latest sepsis levels atwhicheachsuch marker covers one or more patients are also shown in Table7. Full details of thecoverageofpatientsbyeachmarkerareshowninTable8,whichindicatesthepatientsandthe timepointsatwhichat leastoneof theregions ineach four‐regionmarkerhasbeendetected.

28
Table7:Setsofgenomicregionsandtheircoverageasbiomarkersofinfection.Theregionnumbersrangefrom1to25,whicharedefinedinTable5andusedinTable6.
Number of regions in marker
Combination of region numbers
Earliest sepsis level
Latest sepsis level
Number of patients covered
2 {1, 2}
{1, 3}
{1, 6}
{2, 9}
S−3
S−3
S−3
S−5
S
S
S
S
17
3 {1, 2, 7}
{1, 2, 21}
S−3
S−3
S
S
21
4 {1, 2, 7, 5}
{1, 2, 7, 8}
{1, 2, 7, 11}
{1, 2, 7, 15} {1, 2, 7, 20}
{1, 2, 21, 5} {1, 2, 21, 8} {1, 2, 21, 11} {1, 2, 21, 15} {1, 2, 21, 20}
S−3
S−3
S−3
S−3
S−3
S−3
S−3
S−3
S−3
S−3
S+1
S
S+1
S
S
S+1
S
S+1
S
S
22 (all)
29
Table8:Patientsandtimepointscoveredbythefour‐regionmarkersinTable7.
No. Regions
Timepoint
PatientIDnumber
Totalpatients
19 24 28 38 41 42 44 48 49 55 57 63 64 66 86 87 90 93 94 98 100
102
1 {1,2,7,5}
S-3 O O O 3
S-2 O O O O O O O O O O 10
S-1 O O O O O O O O O O O 11
S O O O O O O O O O 9
S+1 O 1
2 {1,2,7,8}
S-3 O O O O 4
S-2 O O O O O O O 7
S-1 O O O O O O O O O O O O 12
S O O O O O O O 7
3 {1,2,7,11}
S-3 O O O O 4
S-2 O O O O O O O O O O 10
S-1 O O O O O O O O O O O O 12
S O O O O O 5
S+1 O 1
4 {1,2,7,15}
S-3 O O O 3
S-2 O O O O O O O O 8
S-1 O O O O O O O O O O 10
S O O O O O O O O 8
5 {1,2,7,20}
S-3 O O O O 4
S-2 O O O O O O O O O O O 11
S-1 O O O O O O O O O O 10
S O O O O O O O 7
6 {1,2,21,5}
S-3 O O O O 4
S-2 O O O O O O O O O 9
S-1 O O O O O O O O O O 10
S O O O O O O O O O O 10
S+1 O 1

30
Table8:continued
Tocomparethedetectionpowerofthefour‐regionmarkers,thetotalnumbersofpatientscovered at different time points by them are summarized in Table 9. Note that thesenumbersaresimplycopiedfromthelastcolumnofTable8foreasiercomparison.
7 {1,2,21,8}
S-3 O O O O O 5
S-2 O O O O 4
S-1 O O O O O O O O O O O O O 13
S O O O O O O O O O O 10
8 {1,2,21,11}
S-3 O O O O O 5
S-2 O O O O O O O O 8
S-1 O O O O O O O O O O O O 12
S O O O O O O O O 8
S+1 O 1
9 {1,2,21,15}
S-3 O O O O 4
S-2 O O O O O O O 7
S-1 O O O O O O O O 8
S O O O O O O O O O O O 11
10 {1,2,21,20}
S-3 O O O O O 5
S-2 O O O O O O O O O 9
S-1 O O O O O O O O O O 10
S O O O O O O O O O 9

31
Table9:Numbersofpatientscoveredatdifferenttimepointsbyfour‐regionmarkers.Ateachtimepoint,themaximumnumberofpatientscoveredisshowninboldface.
No. Regions
Numberofpatientscovered
attimepoint
Totaldetections
(patientscountedredundantly)S−3 S−2 S−1 S S+1
1 {1,2,7,5} 3 10 11 9 1 34
2 {1,2,7,8} 4 7 12 7 30
3 {1,2,7,11} 4 10 12 5 1 32
4 {1,2,7,15} 3 8 10 8 29
5 {1,2,7,20} 4 11 10 7 32
6 {1,2,21,5} 4 9 10 10 1 34
7 {1,2,21,8} 5 4 13 10 32
8 {1,2,21,11} 5 8 12 8 1 34
9 {1,2,21,15} 4 7 8 11 30
10 {1,2,21,20} 5 9 10 9 33
Numberofpatients
withsampleattimepoint14 20 22 22 2
Minimumnumberof
patientscovered3 4 8 5 1
Maximumnumberof
patientscovered5 11 13 11 1
From Table 9, we see that the number of patients in which a sepsis‐specific region isdetectedvariesaccordingtothefour‐regionmarkerandthetimepoints:
3daysbeforesepsisdiagnosis(S−3):from3to5(of14patientswithS−3sample) 2daysbeforesepsisdiagnosis(S−2):from4to11(of20patientswithS−2sample) 1daybeforesepsisdiagnosis(S−1):from8to13(of22patientswithS−1sample) Dayofsepsisdiagnosis(S):from5to11(of22patientswithS−1sample) 1dayaftersepsisdiagnosis(S+1):1(of2patientswithS+1sample)
It isnot straightforward to choose thebestmarkerbasedon this information. Somekeyobservationsare:

32
Marker#7hadthebestdetectionpoweratbothS−3andS−1,wasthesecondbestatS(10versusmaximum11),butwastheworstatS−2.
Marker#5hadthebestdetectionpoweratS−2,butwasrelativelypooratS−1(10versusmaximum13)andS(7versusmaximum11).
Marker #9 had the best detection power at S, but was relatively poor at S−2 (7versusmaximum11)andS‐1(8versusmaximum13).

33
6. Results of microbe detection ThebiomarkerdetectionpartoftheCNAsequenceanalysispipelineusesthosereadsmappedtothereferencehumangenome.Thosereadsthatdidnotmaptoahumangenomicregionwereanalyzedforthepresenceofmicrobesincludingbacteriaandviruses.Forthisanalysis,weusedthesoftwarecalledKraken(WoodandSalzberg,2014),whichisataxonomicsequenceclassificationsystemandavailablefordownloadathttps://ccb.jhu.edu/software/kraken.GiventheKrakentaxonomydatabaseandafileofsequences,Krakenclassifieseachsequence.Krakenclassifieseachsequenceintoataxon,outputtingonelineoftaxonmappinginformationpersequence.Fromthisrawoutput,onecangeneratewhatiscalledaKrakenreport,whichsummarizestheabundanceofdifferenttaxa.Thisreportfilehassixfieldsofinformationpertaxon,defined,fromlefttoright,asfollows: Percentageofreadscoveredbythecladerootedatthistaxon
Numberofreadscoveredbythecladerootedatthistaxon
Numberofreadsassigneddirectlytothistaxon
Arankcode,indicating(U)nclassified,(D)omain,(K)ingdom,(P)hylum,(C)lass,(O)rder,(F)amily,(G)enus,or(S)pecies.Allotherranksaresimply'‐'.
NCBItaxonomyID
Indentedscientificname
Thescientificnamesareindentedusingspaces,accordingtothetreestructurespecifiedbythetaxonomy.
6.1 Analysis of Merged samples
Thegoalof thisanalysis is to findmicrobesthatarepresent insepsissamplesbutnot incontrolsamples.Firstwemergedallsepsissamplesintooneinfectedsampleandanalyzedit using Kraken. Second, we merged all control samples into one control sample andanalyzed it using Kraken. The difference between two Kraken results indicates themicrobespresentonlyinsepsissamples.
A large amount of details from this merged sample analysis can be accessed from thewebsite(http://drdc.coe.ucalgary.ca/SepsisMicrobe_MergedSample_Analysis.html).OntheWeb page, visualization of the results using Krona (Ondov et al, 2011) pie chart‐basedvisualizationsystemisavailableaswellasallthefull‐textKrakenreports.Figure6showsasnapshotofKronavisualizationforinfectedsamples.
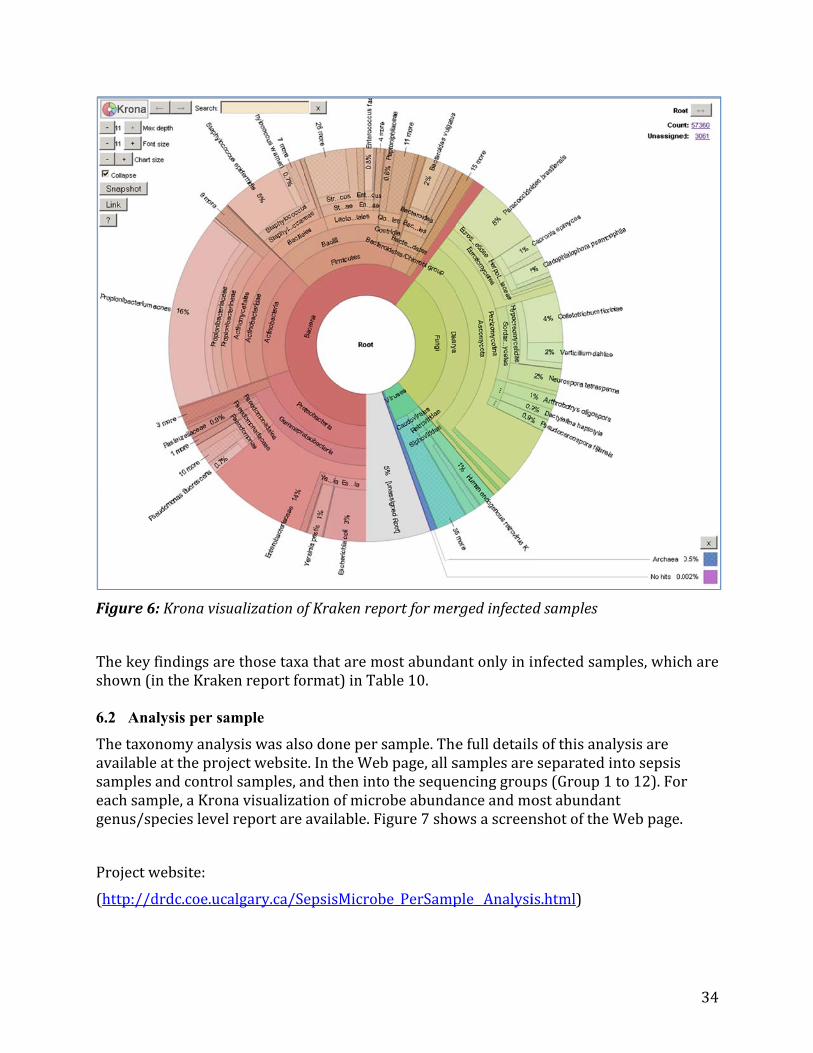
Figure6
Thekeyshown(i
6.2 Ana
Thetaxoavailablesampleseachsamgenus/sp
Projectw
(http://d
6:Kronavisu
findingsarintheKrake
alysis per sa
onomyanalyeattheprojandcontromple,aKronpecieslevel
website:
drdc.coe.uca
ualizationof
ethosetaxaenreportfo
ample
ysiswasalsjectwebsitelsamples,anavisualizatlreportare
algary.ca/S
fKrakenrep
athataremormat)inTa
odonepere.IntheWeandtheninttionofmicravailable.F
epsisMicrob
portformer
mostabundaable10.
sample.Thebpage,allstothesequerobeabundaFigure7sho
be_PerSamp
rgedinfecte
antonlyini
efulldetailssamplesareencinggroupanceandmoowsascreen
ple_Analysi
dsamples
infectedsam
softhisanaeseparatedps(Group1ostabundannshotofthe
is.html)
mples,which
alysisareintosepsis1to12).ForntWebpage.
34
hare
r

35
Table10:Mostabundanttaxafoundonlyininfectedsamples
Fungi
3094 Genus 38946 Paracoccidioides
3094 Species 121759 Paracoccidioides brasiliensis
2363 G 5455 Colletotrichum
2363 S 710243 Colletotrichum fioriniae
1045 G 5140 Neurospora
1045 S 40127 Neurospora tetrasperma
963 G 1036719 Verticillium
963 S 27337 Verticillium dahliae
682 G 47022 Orbilia
682 ‐ 261301 mitosporic Orbilia auricolor
682 S 13349 Arthrobotrys oligospora
505 ‐ 54032 mitosporic Orbiliaceae
543 G 131324 Pseudocercospora
543 S 83344 Pseudocercospora fijiensis
505 G 314122 Dactylellina
505 S 430498 Dactylellina haptotyla
223 G 5583 Exophiala
223 S 5970 Exophiala dermatitidis
120 G 221102 Moniliophthora
120 S 221103 Moniliophthora roreri
113 G 4895 Schizosaccharomyces
113 S 4897 Schizosaccharomyces japonicus
Bacteria
402 G 150022 Finegoldia
402 S 1260 Finegoldia magna
275 G 29465 Veillonella
275 S 29466 Veillonella parvula
200 G 75984 Mannheimia
Virus
234 G 10842 Microvirus

Figure7
7:Webpageeformicrobe
edetectionr
resultsperssample
36

37
7. References Ondov,B.D.,Bergman,N.H.,Phillippy,A.M.(2011)InteractivemetagenomicvisualizationinaWebbrowser.BMCBioinformatics12(1):385.
Wood, D.E., Salzberg, S.L. (2014) Kraken: ultrafast metagenomic sequence classificationusingexactalignments.GenomeBiology15:R46.