biological invasion and the conservation of endemic island
TRANSCRIPT
2017
UNIVERSIDADE DE LISBOA
FACULDADE DE CIÊNCIAS
DEPARTAMENTO DE BIOLOGIA ANIMAL
Biological invasion and the conservation of endemic island
species: São Tomé Archachatina giant land snails (Pulmonata:
Achatinidade)
Martina Panisi
Mestrado em Biologia da Conservação
Dissertação orientada por:
Doutor Ricardo Faustino de Lima
Professor Doutor Jorge Manuel Mestre Marques Palmeirim
DEDICÁTORIA E AGRADECIMENTOS
Dedico il piú desiderato, vissuto e arduo lavoro fatto finora alla mia famiglia, che mi ha
sempre appoggiato, nonostante le difficoltá materiali ed emozionali. A chi fin dalla mia prima
partenza ha saputo essermi vicino sebbene fisicamente lontano, e che non ha mai obiettato che
fossi felice dove dovevo essere. Un abbraccio al babbo piú figo del mondo, alla mamma piú
paziente e bella che esista, a un fratello campione (sei figo anche tu ma non sei Justin, quindi stai
calmo che l’importante é partecipare), nonni, zii e cugini pazzi ma con un grande cuore. Ai pelosi,
squamosi e chitinosi, comandati dalla regina Minou. Vi voglio bene.
Un bacio a un grande motociclista che lá dall’alto mi veglia e tiene a bada, e a una nonna super
coraggiosa.
Em primeiro lugar agradeço às duas pessoas que principalmente permitiram que este
trabalho inteiro se delineasse, cumprisse e, por fim, realizasse, que me ajudaram e aturaram
constantemente entre grandes reuniões de suporte metodológico, psicológicos…e tantas anedotas
de vida (até vermos ilhas a forma de peras e de búzios). Pela forte motivação transmitida, pelos
preciosos ensinamentos, pelas ideias, pelas inspirações, pela vossa ajuda e cuidado em tudo e pela
introdução aos trópicos na carta, na mente e no campo, obrigada de coração a Ricardo Lima e ao
Professor Jorge Palmeirim. Não podia ter orientação melhor.
Este trabalho não teria sido possível sem os dados recolhidos no âmbito da tese de
doutoramento “Land-use management and the conservation of endemic species in the island of
São Tomé” de Ricardo Faustino de Lima, e da “BirdLife International São Tomé and Príncipe
Initiative”. A tese de doutoramento foi financiada pela FCT - Fundação para a Ciência e
Tecnologia, através de uma bolsa de doutoramento cedida pelo Governo Português (Ref.:
SFRH/BD/36812/2007), e pela “Rufford Small Grant for Nature Conservation”, que forneceu
financiamento adicional para o trabalho de campo (“The impact of changing agricultural practices
on the endemic birds of Sao Tome” - Ref.: 50.04.09). A “BirdLife International São Tomé and
Príncipe Initiative” foi financiada pela “BirdLife’s Preventing Extinctions Programme”, através
da família Prentice no âmbito da “BirdLife’s Species Champion Programme”, pela “Royal
Society for the Protection of Birds”, pela “Disney Worldwide Conservation Fund”, pela “U.S.
Fish and Wildlife Service Critically Endangered Animals Conservation Fund” (AFR-1411 -
F14AP00529), pela “Mohammed bin Zayed Species Conservation Fund” (Project number
13256311) e pela “Waterbird Society Kushlan Research Grant”. Gostaria também de agradecer a
todos os que contribuíram para o “International Action Plan for the Conservation of Critically
ii
Endangered Birds on São Tomé”, especialmente à Direção Geral do Ambiente, ao Parque Natural
do Obô de São Tomé, à Direção das Florestas, à Associação dos Biólogos Santomenses e à
associação MARAPA. Ainda, queria agradecer ao Eng. Arlindo Carvalho, Diretor Geral do
Ambiente por apoiar as nossas atividades em São Tomé.
Um agradecimento em particular a toda a equipa de trabalho de campo da Associação
Monte Pico que esteve envolvida na recolha de dados, nomeadamente Gabriel Cabinda, Ricardo
Fonseca, Gabriel Oquiongo, Joel Oquiongo, Sedney Samba, Aristides Santana, Estevão Soares,
Nelson Solé e Leonel Viegas. O trabalho de campo não teria sido possível sem a ajuda de Silvino
Dias, José Malé, Filipe Santiago, Lidiney e inúmeros outros santomenses. Uma dedicação
especial para "Dakubala". Nem sem a coordenação do Hugo Sampaio, da Sociedade Portuguesa
para o Estudo das Aves (SPEA), ou sem o apoio institucional e empenho pessoal de Luís Costa
(SPEA) e de Alice Ward-Francis (“Royal Society for the Protection of Birds” - RSPB), a quem
agradecemos igualmente a disponibilização de dados. Finalmente, um agradecimento a Graeme
M. Buchanan, pelas orientações e pelo apoio no planeamento experimental deste trabalho.
Agradeço à Associação Monte Pico, pelo alojamento durante a minha estadia em São Tomé.
Agradeço fortemente a Filipa Soares pela ajuda e suporte constante durante a inteira realização
deste trabalho, e sobretudo pelos dados recolhidos e pelos dados fornecidos no âmbito do trabalho
de modelação da distribuição de espécies a nível da ilha inteira.
Um agradecimento especial a Manuel Sampaio pela ajuda no trabalho de campo.
Agradeço Matthias Neumann, David Holyoak e Geraldine Holyoak, para os conselhos, ajuda e
suporte relativamente ao planeamento e a realização do trabalho de campo e Ana Coelho pelos
concelhos relativamente a estadia em São Tomé e a escrita da dissertação.
Obrigada à Ricardo, Filipa, Bárbara e Manuel pela ajuda, paciência, força, inspiração e
pelas inesquecíveis memórias de São Tomé.
Obrigada à melhor turma de amigos de sempre, biólogos malucos, fomos e seremos os melhores.
Obrigada a quem me ajudou, suportou e encorajou na defesa da tese: Castle, Ana, Fernando,
Filipa, Anis, Kenzi, Amelinha, Reem e todo o resto do pessoal que assistiu à defesa.
Thanks to those friends that are and will always be there, grazie schizzi miei: Lella, Ricky, Alle,
Sabi, Nastia, Vic, Lucy, Lina, Belmy. Thanks “Lisbon Gang”, for every happy and crazy moment
spent together. Obrigada, “Amigos Internacionais”, pelos sorrisos e positividade.
Obrigada a ti, que estás sempre ao meu lado e me aturas em tudo. Se fosse eu não conseguia. Só
tu sabes quantas dormidas devo a ti e ao Roso por causa deste último ano.
iii
Não sei bem como agradecer aos companheiros de uma tão grande e linda aventura, pois ficam
no coração, bem marcados para sempre, a família São tomense: Lucy, Gegé, Juary, Kaná, Edi,
Neya, Leny, Sá, Francisco, Leonel, Nity, Estevão, Tomé, Mito e Sonia, Dodot, Lito, Sr. Filipe e
mulher, gente de Brigoma, Emolve e Monte Café.
Obrigada Francisco, Leonel e Sá por me terem ajudado nos momentos em que mais precisava de
alguém, pelos pequenos-almoços no Jardim Botânico, as lindas conversas, as folhas safa-barriga,
as Rosemas com búzio-de-mato e para o meu primeiro búzio-d’Obô, Filippo.
Obrigada a quem durante uma noite de janeiro, no meio da floresta, deu-me a força para começar
a nossa procura e, a partir daí, nunca me deixou desistir. Dois meses depois, ainda com o sorriso
do primeiro dia, mais do que quatrocentos búzios lindos depois e imensas aventuras no coração.
Obrigada Gabi (Gabriolo).
Ao transeto de Trás-os-Montes/Nova Ceilão que era suposto ser um dos mais simples e revelou-
se um pesadelo sem fim. Obrigada, agora em comparação tudo parece mais simples.
A todos os (vertebrados ou não) que nesta aventura simplesmente confiaram numa desconhecida
que lhes apareceu à frente… E começamos a fazer parte uns da vida do outro.
Por fim, como é justo, obrigada à beleza da natureza e da diversidade da vida, que nunca
para de encantar, surpreender e ensinar…
E que me fez confirmar, mais uma vez, que atrás de cada cara, cada gesto ou cada ser há uma
historia que só espera de ser contada, escutada ou então vivida, agora.
And that made me confirm, once again, that behind every face, every gesture or every living being
there is a story that only hopes to be told, heard or lived, now.
E mi ha fatto confermare, ancora una volta, che dietro ogni viso, gesto o essere vivente esiste una
storia che aspetta solo di essere raccontata, ascoltata oppure vissuta, adesso.
E’ só preciso dar-lhe uma possibilidade. E de repente estás a vivê-la.

iv
“Búzio-d ´Obô vê um humano pela primeira vez e fica amuado”.
Ilha de São Tomé – 2 de fevereiro 2017

v
RESUMO ALARGADO
A perda global de biodiversidade é uma das maiores consequências das atividades
humanas. As ilhas são hotspots mundiais de biodiversidade, com elevado grau de espécies
endémicas, mas os seus ecossistemas são também dos mais suscetíveis às alterações antrópicas.
A introdução de espécies exóticas é a principal causa de extinções em ilhas, agravada quando em
sinergia com outros fatores, como a alteração do tipo de uso do solo.
Os moluscos são um dos grupos animais com mais extinções, e os caracóis terrestres, em
particular, sofreram o maior número de extinções devido às atividades humanas. Estes organismos
são excelentes bioindicadores da qualidade do habitat, exatamente porque são muito vulneráveis
às alterações ambientais. Por outro lado, também existem diversas espécies de caracóis terrestres
com grande capacidade invasora, e que se adaptam muito bem a habitats humanizados. A
introdução de várias espécies de caracóis gigantes africanos (géneros Achatina e Archachatina)
fora do continente resultou em danos na agricultura, problemas sanitários e ameaças para os
ecossistemas nativos. Estes animais têm hábitos noturnos, são polífagos e hermafroditas,
produzindo grandes quantidades de ovos, sendo muito procurados para fins medicinais,
ornamentais, como animais de estimação e, por fim, pelo considerável valor, sobretudo no
território africano, como recurso alimentar.
A ilha de São Tomé está situada a 255 km da costa Oeste africana, no Golfo da Guiné, e
tem uma área de 857 km2. É caraterizada por uma elevada humidade e precipitações que podem
chegar até aos 7000 mm anuais no Sudoeste. As temperaturas médias anuais variam entre os 22
e os 30°C, com mínimas de 10°C em elevada altitude. Originalmente dominada por floresta,
intensas modificações da paisagem ocorreram desde a sua descoberta e colonização, no final do
século XV. Podemos atualmente identificar um gradiente de degradação ambiental ao longo da
ilha: áreas não florestadas sobretudo junto à costa, seguidas por plantações de sombra, onde se
cultiva o cacau e o café, a floresta secundária, que resulta em grande parte do abandono de antigas
plantações e onde plantas nativas e exóticas coexistem e, por fim, a floresta nativa, nas zonas mais
inacessíveis do interior da ilha, que permanece quase intocada pelas atividades humanas e alberga
uma elevada taxa de espécies endémicas. Apesar da sua reduzida extensão territorial, a ilha é
reconhecida internacionalmente pelo elevado número de endemismos em diversos grupos
taxonómicos, tais como aves, anfíbios, plantas superiores, morcegos, répteis, borboletas e
moluscos. Destes últimos, São Tomé conta com 40 espécies de moluscos, 31 dos quais são
endémicos.
O caracol gigante do Golfo da Guiné Archachatina bicarinata (Bruguière, 1792), ou
búzio-d’Obô, é uma espécie endémica das ilhas de São Tomé e Príncipe e tem sofrido um declínio
acentuado em ambas as ilhas nas últimas décadas. A introdução do caracol gigante do Oeste
vi
africano Archachatina marginata (Swainson, 1821), ou búzio-vermelho, está entre as prováveis
causas desse declínio.
No primeiro capítulo desta tese avaliamos quais os fatores que explicam a distribuição do
caracol gigante introduzido em São Tomé. O amplo gradiente de degradação ambiental que existe
na ilha providencia condições excelentes para se compreender as ligações entre a distribuição
desta espécie e a humanização da paisagem. Verificámos que este caracol existe em quase toda a
ilha, preferindo plantações e florestas secundárias de baixa altitude, e evitando as zonas de floresta
nativa. A sua presença está associada a plantas introduzidas, típicas de ecossistemas degradados,
e a sua população encontra-se em expansão, com elevada proporção de indivíduos juvenis, em
especial nas zonas mais degradadas. Este estudo é uma contribuição essencial para o planeamento
de medidas de conservação que visem limitar a ação da espécie invasora nos ecossistemas mais
suscetíveis da ilha e serve também como um alerta para a necessidade de proteger a sua floresta
nativa e as espécies que nela habitam.
No segundo capítulo avaliamos as possíveis interações entre o caracol gigante nativo e o
invasor. Recolhemos diversos relatos que associam 31o desaparecimento do endémico à expansão
do invasor ao longo do tempo. Documentamos uma forte segregação entre as duas espécies em
termos espaciais, sendo que o endémico se encontra restrito às florestas nativas mais remotas,
enquanto que o invasor se encontra maioritariamente em áreas mais degradadas, ocupando uma
proporção muito mais significativa da ilha. As duas espécies estão associadas a vegetações
totalmente diferentes, estando a endémica associa13da a flora endémica, e a introduzida a flora
exótica, por sua vez igualmente associada a habitats antrópicos. A população atual do búzio-
vermelho é composta por uma elevada proporção de juvenis, em contraste com a do endémico,
em que claramente predominam os adultos. Finalmente, registámos diferenças nos padrões de
atividade diária de ambas as espécies, com o endémico a ser principalmente diurno e o invasor a
preferir estar ativo durante a noite.
Os nossos resultados sugerem que o declínio acentuado do búzio-d’Obô pode estar
relacionado com a introdução do búzio-vermelho, representando o primeiro estudo dedicado à
ecologia e distribuição destas espécies em São Tomé. Este estudo sugere que o grau de ameaça
do búzio-d’Obô deve ser aumentado, bem como a necessidade urgente de implementar medidas
de ação de conservação que assegurem a sua sobrevivência.
Palavras-chave: modelação ecológica, Archachatina bicarinata, declínio, interações
interespecíficas, degradação do habitat
vii
ABSTRACT
The global loss of biodiversity is a major consequence of human activities. Habitat
destruction and the introduction of non-native species are among the principal drivers of this loss.
Knowing the ecology of invasive species, namely their habitat preferences, distribution and
potential interactions with local biodiversity, is thus fundamental for ecosystem management and
for minimizing negative impacts.
São Tomé Island holds an endemic-rich land snail fauna, including the Vulnerable Gulf
of Guinea Giant Land Snail Archachatina bicarinata (Bruguière, 1792). This species was
relatively widespread and abundant in the island, but its population has suffered a steep decline
since mid-twentieth century. The introduction of the West African Giant Land Snail A. marginata
(Swainson, 1821) has been implied in this decline, but very little is known about its dispersal or
about its effects on native species.
This thesis aims to assess the links between the dispersal of the introduced giant snail and
human-modified ecosystems, and if this species is displacing the endemic giant snail. We found
that the introduced giant snail is widely distributed throughout most of the island, preferring
lowland plantations and other modified ecosystems rich in introduced plants. There was a strong
spatial segregation between the two species, the endemic being restricted to the most remote
patches of native forest. The invasive appeared to be expanding, having a large proportion of
juveniles in its population, while the endemic showed the opposite trend. We also observed a
temporal displacement between the occurrence of the two species: the endemic being active
mostly during the day and the invasive principally around dusk and dawn.
This was the first study on the ecological interaction between these two species. The small
overlapping area in their distributions and the perceptions of local inhabitants suggest that the
introduced snail is displacing the endemic. Gain01ing a better understanding of the mechanisms
underlying this invasion process is essential to prevent its spread into the native forest. Immediate
conservation actions aimed to preserve the endemic snail are necessary to halt its dramatic
population collapse, which may warrant an uplisting of its conservation status.
Keywords: ecological modelling, endemism, interspecific interactions, segregation, land-use

viii
TABLE OF CONTENTS
GENERAL INTRODUCTION............................................................................................... 1
CHAPTER 1: Habitat degradation facilitates invasion: the West African Giant Land Snail
Archachatina marginata, in São Tomé Island (Gulf of Guinea)............................................... 5
INTRODUCTION........................................................................................................... 5
METHODS.......................................................................................................................7
Study Area ................................................................................................................. 7
Field Methods............................................................................................................. 8
Species distribution modelling.................................................................................... 8
Habitat associations.................................................................................................... 8
Data Analysis ............................................................................................................ 11
Species distribution modelling................................................................................... 11
Habitat associations................................................................................................... 11
Population age structure............................................................................................ 12
RESULTS ....................................................................................................................... 12
Species distribution modelling................................................................................... 12
Local habitat associations........................................................................................... 13
Population age structure.............................................................................................. 14
DISCUSSION………………………………………………………………………….. 15
Distribution in São Tomé and its determinants........................................................... 15
Local habitat associations............................................................................................ 16
Population age structure.............................................................................................. 16
Is habitat degradation facilitating African giant snail invasion?................................. 17
Implications for native biodiversity............................................................................. 18
CHAPTER 2: Is the invasive West African Giant Land Snail Archachatina marginata
displacing the Gulf of Guinea endemic Archachatina bicarinata?.............................................19
INTRODUCTION ........................................................................................................... 19
METHODS .......................................................................................................................21
Study Species and Area .............................................................................................. 21
Field Methods ............................................................................................................. 22
Local perceptions about the changes in giant land snail distribution........................ 22
Species distribution modelling..................................................................................... 22
Transect sampling: habitat associations, daily activity patterns and populations age
structure....................................................................................................................... 22
Data Analysis............................................................................................................... 23
Species distribution modelling..................................................................................... 23
ix
Habitat associations.................................................................................................... 23
RESULTS………………………………………………………………………………. 25
Local perceptions about the changes in giant land snail distribution……………….. 25
Species distribution modelling.................................................................................... 26
Habitat associations at the transect level..................................................................... 29
Daily activity patterns………………………………………………………………. 32
Populations age structure……………………………………………………………. 32
DISCUSSION…………………………………………………………………………... 32
Local perceptions about the changes in giant land snail distribution.......................... 32
Island-wide species distribution modelling................................................................. 33
Habitat associations at the transect level..................................................................... 35
Daily activity patterns................................................................................................. 36
Population age structure ............................................................................................. 36
Is the invasive West African Giant Land Snail displacing the endemic Gulf of Guinea
Giant Land Snail?…………………………………………………………..………. 36
Conservation implications…………………………………………..…..…………. 38
FINAL CONSIDERATIONS ................................................................................................. 39
REFERENCES ........................................................................................................................ 41
SUPPLEMENTARY MATERIALS ..................................................................................... 50
TABLES.......................................................................................................................... 50
Models outputs…………………………………………………………………………
FIGURES…………………………………………………………………………….... 56
RSCRIPT…………………………………………………………………………...….. 62

x
LIST OF TABLES
Table 1.1 – List of the 17 environmental variables used to assess habitat associations of the
West African Giant Land Snail………………………………………………………………...10
Table 1.2 – Relative variable importance (RVI) obtained from the island-wide distribution
model for the invasive snail…………………………………………………………………….12
Table 1.3 – Relative Variable Importance (RVI) obtained from the habitat association
analysis………………………………………………………………………………………… 14
Table 2.1 – Relative Variable Importance (RVI) obtained from the island-wide model for the
distribution of both study species……………………………………………………………… 27
Table 2.2 – ANOVA results exploring the contribution of the invasive species to explain the
occurrence of the endemic species………………………………………………………….…. 28
Table 2.3 – Relative variable importance (RVI) obtained from the habitat association analysis
for both species……………………………………………………………………………….... 31
Table S1. (Supp. Materials) – Description of the predictor variables used to model the species
distribution at island scale……………………………………………………………………... 50
Table S2. (Supp. Materials) – Habitat associations, plant species list………………………. 51
Table S3. (Supp. Materials) – Differences between population classes along the gradient of
forest degradation……………………………………………………………………………… 53
Table S4. (Supp. Materials) – Localities and their map code with the associated number of
interviewed performed………………………………………………………………………… 53
Table S4b (Supp. Materials) – Structure of the interview……………………………..…..….53
Table S5. (Supp. Materials) – Spatio-temporal dynamics in the distributions changes (year of
decline – year of appearance)…………………………………………………………………. 54
Table S6. (Supp. Materials) – Relative Variable Importance (RVI) calculated by Model
Averaging from the ONP buffer zone model for the distribution of both study
species…………………………………………………………………………………………. 54
Table S7. (Supp. Materials) – ANOVA results exploring the contribution of the invasive species
to explain the occurrence of the endemic species inside the limits of the ONP buffer zone….. 54
Table S8. (Supp. Materials) – Tests for the homogeneity of group dispersion in the vegetation
composition ordination………………………………………………………………………... 54
Models outputs
Table S9a (Supp. Materials) – Chapter 1, island-wide analysis, introduced species…………55
Table S9b (Supp. Materials) – Chapter 1, island-wide analysis, introduced species………....55
Table S10a (Supp. Materials) – Chapter 1, habitat associations, introduced species………...55

xi
Table S10b (Supp. Materials) – Chapter 1, habitat associations, introduced species………...56
Table S11a (Supp. Materials) – Chapter 2, island-wide, endemic species……………………56
Table S11b (Supp. Materials) – Chapter 2, island-wide, endemic species…………………….56
Table S12a (Supp. Materials) – Chapter 2, island - wide, endemic species (introduced species
as a predictor)…………………………………………………………………………………....57
Table S12b (Supp. Materials) – Chapter 2, island - wide, endemic species (introduced species
as a predictor)………………………………………………………………………………..…..57
Table S13a (Supp. Materials) – Chapter 2, ONP buffer area, invasive species………….........58
Table S13b (Supp. Materials) – Chapter 2, ONP buffer area, invasive species……………….58
Table S14a (Supp. Materials) – Chapter 2, ONP buffer area, endemic species………………..58
Table S14b (Supp. Materials) – Chapter 2, ONP buffer area, endemic species………………..59
Table S15a (Supp. Materials) – Chapter 2, ONP buffer area, endemic species (invasive species
as a predictor)………………………………………………………………………………........59
Table S15b (Supp. Materials) – Chapter 2, ONP buffer area, endemic species (invasive species
as a predictor)…………………………………………………………………………………....59
Table S16a (Supp. Materials) – Chapter 2, transects, invasive species ………………….........60
Table S16b (Supp. Materials) – Chapter 2, transects, invasive species ………………………60
Table S17a (Supp. Materials) – Chapter 2, transects, endemic species ………………………60
Table S17b (Supp. Materials) – Chapter 2, transects, endemic species…………..……………61
xii
LIST OF FIGURES
Figure 1.0 – Study species……………………….……………………………………………..4
Figure 1.1 – Maps of São Tomé showing the West African Giant Land Snail sampling
locations………………………………………………………………………………………...9
Figure 1.2 – Maps of São Tomé showing the a) observations and b) modelled potential
distribution of the West African Giant Land Snail in São Tomé………………………………13
Figure 1.3 – First two axes of the 20m vegetation composition NMDS (stress= 0.18)……….14
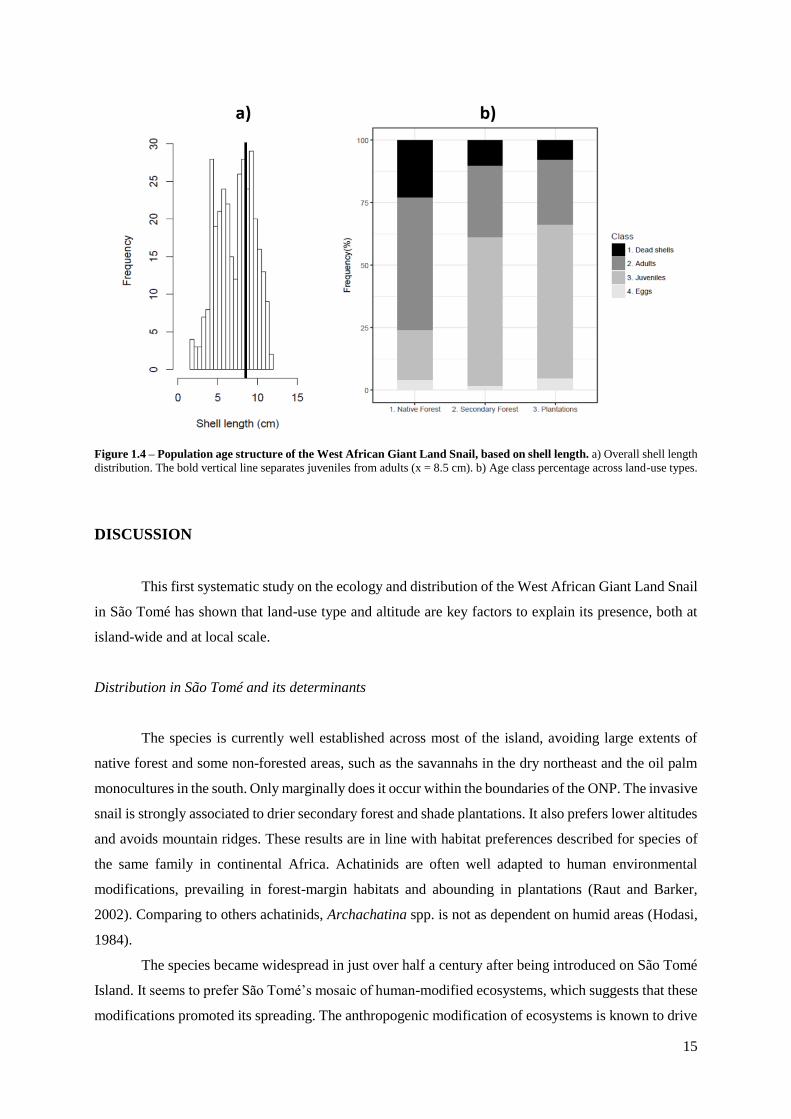
Figure 1.4 – Population age structure of the West African Giant Land Snail, based on shell
length………………………………………………………………………………………….. 15
Figure 2.1 – Maps of São Tomé showing the sampling locations for both species………….. 23
Figure 2.2 – Spatio-temporal dynamics of the introduction of the West African Giant Land Snail
and the decline of the Gulf of Guinea Giant Land Snail in São Tomé……………………….. 26
Figure 2.3 – Maps of São Tomé showing the potential distribution of both species………… 28
Figure 2.4 – NMDS analysis and the association of the plant and snail species to the axes of
ordination …………………………………………………………………………………….. 30
Figure 2.5 – Distribution and abundance of the giant land snail species along the transects... 32
Figure 2.6 – Age structure histograms, based on shell length distribution for the invasive species
(a) and the endemic species (b) ...…………………………………………………………….. 33
Figure 2.7 – Comparison of populations stru0000cture between species using a density plot….…
33
Figure S1. (Supp. Materials) – Proportion of observed presences of West African Giant Land
Snail, depending on a) Land-use type and b) Topographic Position Index (TPI)……………….62
Figure S2. (Supp. Materials) – Observed and predicted presence of the West African Giant Land
Snail depending on Elevation and Rainfall…………………………………………………… 62
Figure S3. (Supp. Materials) – Population shell width distribution of the West African Giant
Land Snail………………………………………………………………………………….….. 63
Figure S4. (Supp. Materials) – Association between the correct identification of the endemic
species and the age of the interviewed…………………………………………………….…... 63
Figure S5. (Supp. Materials) – Causes associated to the demise of the endemic species from the
locals’ perceptions……………………………………………………………………..........…. 63
xiii
Figure S6. (Supp. Materials) – Proportion of observed presences of the endemic species,
depending on a) Land-use type and b) Topographic Position Index (TPI)……………………. 64
Figure S7. (Supp. Materials) – Observed and predicted presence of the endemic species
depending on Elevation and Rainfall…………………………………………………………… 64
Figure S8. (Supp. Materials) – Comparison of the performance of the models for the endemic
species………………………………………………………………………………………..… 64
Figure S9. (Supp. Materials) – Maps of São Tomé showing the potential distribution of both
species inside the limits of the ONP Buffer Area……………………………………………. 65
Figure S10. (Supp. Materials) – Substrate composition ordination plot (stress= 0.17)……… 65
Figure S11. (Supp. Materials) – Plant species association with NMDS axes………………… 66
Figure S12. (Supp. Materials) – Selection of the best models and the most important variables
for the West African Giant Land Snail in the habitat association analysis…………………….. 66
Figure S13. (Supp. Materials) – Selection of the best models and the most important variables
for the Gulf of Guinea Giant Land Snail in the habitat association analysis…………………… 67
Figure S14. (Supp. Materials) – Daily activity patterns of São Tomé giant land snails……… 67
Figure S15. (Supp. Materials) – Population shell width variation for both species………..… 67
1
GENERAL INTRODUCTION
Changes in ecosystems and species extinctions have always occurred, but human activities have
accelerated these processes, threatening ecosystem functioning and biodiversity (Dirzo et al., 2014;
Ceballos et al., 2015). Land-use change has had one of the largest impacts on global biodiversity,
especially in areas with high species richness and endemism (Sala et al 2000). In many parts of Africa,
for example, the rainforest is being cleared to grow cocoa, oil palm, rubber and timber, within global
biodiversity hotspots (Oke et al., 2008). In addition, the last half century has witnesses an unprecedented
acceleration in the importance of worldwide trade (Hulme, 2009). Increased trade in commodities has
resulted in a legacy of recent biological invasions, often with catastrophic consequences on native
biodiversity (Hulme, 2009; Spatz et al., 2017). Land-use changes and biological invasion can act in
synergy with severe implications. Some species, such as terrestrial snails, are particularly sensitive to
their impacts (Oke et al., 2008; Chiba and Cowie, 2016).
Terrestrial molluscs are one of the most diverse groups of animals, including more than 30,000
species described. However, they also have the highest number of documented extinctions of any major
taxonomic group (Lydeard et al., 2004). Habitat loss coupled with the introduction of alien species have
caused most of the current global wave of terrestrial mollusc extinctions (Lydeard et al. 2004, Chiba
and Roy, 2011).
Land snails represent one of the most important groups of invertebrates in terrestrial ecosystems
(Idohou et al., 2013). In forests, they contribute to soil production, calcium concentration in the soil, and
are involved in the process of plant litter decomposition, as many species consume of decaying vegetal
material. Terrestrial snails are useful indicators of environmental conditions, such as environmental
health, and soil structure and texture (Dedov and Penev, 2004; Idohou et al., 2013, Nicolai et al., 2017).
Land snails have particularly low abilities for active dispersal (Nicolai et al., 2017) and, in the humid
tropics, where land snail diversity is highest, this results in spectacular radiations, with large numbers
of locally endemic species and genera (Schilthuizen et al., 2002).
Land snails that inhabit oceanic islands are more susceptible to extinction, because of their
restricted distribution and because they have evolved in the absence of high predation pressure. Many
snail extinctions have been attributed to introduced species (Cameron et al., 2013). The introduction of
Euglandina rosea, a carnivorous land snail, on several Pacific islands has been one of the most
catastrophic, and resulted from an attempt to control a previous introduction, of the agricultural pest
Achatina (Lissachatina) fulica. E. rosea is likely to have contributed to the extinction of 134 land snail
species, and did not control the invasive A. fulica (Lowe et al., 2000; Chiba and Cowie, 2016).
Giant African land snails are grouped in two genera of terrestrial snails: Achatina and
Archachatina. These are among the largest land snails and belong to the family Achatinidae, which
2
includes 13 genera in total. Archachatina spp. are mainly distributed throughout west Africa, while
Achatina spp. have a wider distribution across sub-Saharan Africa (Raut and Barker, 2002). In the last
two centuries, giant African Land Snails have spread in every continent as invasive species, and are now
globally recognized as a threat to biodiversity, as agricultural pests and as vector of diseases (Lowe et
al., 2000; Thiengo et al., 2007; Meyer et al., 2008; Agongnikpo, 2010). Their invasion success is mainly
due to human voluntary introductions, motivated by their use as food source, ornament, medicine or
even as pets. Their invasion is also favoured by high breeding rates, since they are hermaphrodites and
can lay several clutches of eggs per year (Raut and Barker, 2002; Vásquez et al., 2017;). Achatina
(Lissachatina) fulica, one of the most invasive species, can easily adapt and spreads in human-modified
ecosystems (Tomyiama, 2000). However, it is not clear if the expansion of other invasive giant African
land snails is also facilitated by their preferential dispersal through human-modified ecosystems. Giant
African land snails are thus commonly known for their negative ecological, economical and
epidemiological impact in many countries around the world. However, among these species, only some
have been largely dispersed and are considered invasive.
Many Achatinidae are currently threatened in their native range of occurrence, but few studies
have focused on understanding their decline, and few policies are implemented to ensure their
conservation (Hodasi, 1984; Oke et al., 2008). In recent years, large areas of tropical lowland African
rainforest have been cleared for agriculture and converted to plantations (e.g. oil palm, cocoa). The
introduction of exotic tree species in many parts of equatorial Africa has altered the composition of the
forest, some are being now dominated by a high abundance of monoculture tree species and other fast-
growing exotics (Oke et al., 2008). The deep transformations of natural ecosystems are a main cause for
the demise of many giant snail species, including several native and endemic taxa (Hodasi, 1984; Idohou
et al., 2013). Moreover, many Achatinidae are edible and common in Africa, being an important food
source and having a cultural value for medicinal and religious purposes in many countries (Adeola,
1992; Raut and Barker, 2002). Land-use changes, combined with an intense snail harvesting led to the
decline of several Acatinidae in Africa (Osemeobo, 1992; Idohou et al., 2013). Forest-restricted species,
such as Archachatina knorrii, are particularly vulnerable to habitat loss (Raut and Barker, 2002). Some
are largely diffused as invasive, but are threatened in their native range because, regardless of being
adapted to human disturbed habitat, are susceptible to intense harvest, such as the West African Giant
Land Snail, Archachatina marginata (Swainson, 1821) (Idohou et al., 2013).
The Democratic Republic of São Tomé and Príncipe is the second smallest African country, but
it is internationally recognized for its remarkable endemic species richness in several flora and fauna
taxa (Jones, 1994). It is incorporated in the global biodiversity hotspot of the “Guinean forests of West
Africa”, and it has been targeted by several ecology and conservation studies (e.g. de Lima et al., 2016).
São Tomé is an 857 km2 oceanic island, located about 255 km west of mainland Africa. The volcanic
origin of the island determines its rugged topography, marked by deep valleys and high ridges, up to
3
2024 meters above sea level (Salgueiro & Carvalho 2001). The high mountains in the centre and south
of the island promote a variety of climates. The south-west is characterized by frequent rains and almost
permanent cloud cover, while the north-east is fairly dry and sunny (Tenreiro, 1961). The island was
almost entirely covered by forests when first discovered by a Portuguese expedition in the late 15th
century. The colonization of the island has largely modified its habitat composition, mostly due to the
conversion of native forest into plantations. Sugar-cane was the first wide-scale plantation in São Tomé,
still in the 16th century. Three centuries afterwards, great part of the lowland forests was already replaced
by cocoa and, to a lesser extent, coffee shade plantations (Tenreiro, 1961). Four main land-use types are
currently recognized: native forest, secondary forest, shade plantation and non-forested areas (Jones et
al., 1991). The native forest still covers most of the centre and the southwest of the island. It is
characterized by dense canopy cover and by having few introduced plant species. Native forest is usually
located in steep inaccessible terrains, ranging from sea level to the highest altitudes (Diniz et al., 2002).
Most of these forests are inside the Obô Natural Park (ONP), which covers around one third of the
island. The ONP was created in 2006, under the European Commission “Écosystèmes Forestiers en
Afrique Centrale” (ECOFAC) program, which aimed to promote the conservation and sustainable use
of forests in Central Africa (Direcção Geral do Ambiente, 2006). Native forest is surrounded by areas
of secondary forest, most of which resulted from forest regeneration of abandoned plantations, and
usually composed by smaller trees and a higher proportion of introduced species. Shade plantations are
an agroforestry system dedicated to growing of coffee and cacao, shaded by large tree species, such as
the coral tree Erythrina poeppigiana. Other crops, such as banana Musa spp., taro Xanthosoma
saggitifolium, oil palm Elaeis guineensis and avocado Persea americana are also commonly found in
shade plantations (Jones, 1994; Diniz et al., 2002; Salgueiro and Carvalho, 2002). Finally, non-forested
areas are mainly represented by agricultural areas, small-holder horticulture and by coconut and oil palm
productions that area characterized by lacking a continuous tree canopy cover (Diniz et al., 2002).
São Tomé holds 40 species of land snails, 31 of which are endemic to the island (CBD, 2015).
In the Achatinidae family, São Tomé has one endemic genus, the monotypic Atopocochlis (Cross and
Fisher, 1888), and shares with Príncipe Island, the endemic Gulf of Guinea Giant Land Snail
Archachatina bicarinata (Bruguière, 1792), (Raut and Barker, 2002). Land-use changes,
overexploitation and introduced species are main threats in São Tomé, and their consequences on the
avifauna have been fairly well assessed (de Lima et al. 2016). However, almost no investigation has
assessed the consequences on the terrestrial snail fauna of the island (Gascoigne, 1994a, 1994b). In
these, the endemic Gulf of Guinea Giant Land Snail is said to have been widely distributed in São Tomé
island, before having suffered a steep population decline. The decline has been linked to the introduction
of the mainland West African Giant Land Snail, during the second half of the past century (Gascoigne,
1994a). Nevertheless, no systematic study has evaluated the dispersal of the introduced giant snail in
São Tomé Island, or its interactions with the endemic species.

4
Between August 2013 and February 2015, the “BirdLife International São Tomé and Príncipe
Initiative”, conducted a systematic survey of the two species of giant land snails, focusing on the main
forest block of the island (de Lima et al., 2016). These data were complemented with survey data
collected between January and March 2017, covering under-sampled portions of the island, and used to
analyse the distribution and interaction between the two species.
In the first chapter, we describe the distribution and habitat associations of the introduced West
African Giant Land Snail in São Tomé Island. In the second chapter, we evaluate the interactions
between the endemic Gulf of Guinea Giant Land Snail and the invasive West African Giant Land Snail
in São Tomé Island. This is the first study on the ecology and distribution of these two species in São
Tomé Island and its contribute is essential for any future action toward the protection of the endemic
species or the control of the introduced snail.
Fig. 0.1 – Study species. Study species. The São Tomé and Príncipe endemic Archachatina bicarinata (b,d) and the introduced
West African Giant Land Snail Archachatina marginata (a,c). The two species have shells with opposite coiling directions: the
introduced snail is right-handed, while the endemic is left-handed. This allows identifying both adult (a,b) and juvenile (c,d)
individuals. The photos show adults (a,b), juveniles and eggs (c,d) in proportion, to highlight differences in size.
5
CHAPTER 1.
Habitat degradation facilitates invasion: the West African Giant Land Snail
Archachatina marginata, in São Tomé Island (Gulf of Guinea)
Abstract: Habitat loss and invasive alien species are major causes for biodiversity loss worldwide and
anthropogenic habitat modification might have a role in facilitating invasive species’ expansion.
Oceanic islands have been particularly susceptible to invasions; however, few studies have assessed
island’s land-use modification as an important factor for an invasive species success. In this study, we
modelled the current distribution of the introduced West African Giant Land Snail Archachatina
marginata (Swainson, 1821) on São Tomé Island and we predicted its habitat preferences and population
structure across a gradient of forest degradation. We found that this species is widely distributed on most
of the island, preferring lowland plantations and modified forests, while avoiding well-preserved areas.
The species’ presence was also associated with introduced plants, typical of human modified
ecosystems, and its population outnumbers of juveniles occurring primarily in more degraded habitats.
This is the first systematic study ever on the distribution and ecology of the invasive West African Giant
Land Snail on São Tomé after its introduction on the island. Its contribute is essential for strategic
ecological management actions aimed to limit the invasive species in those more susceptible areas and
as a call for the protection of the island’s native forest and its vulnerable flora and fauna.
Keywords: ecological modelling, land-use, Achatinidae, species distribution, conservation
INTRODUCTION
Invasive alien species are one of the major drivers of biodiversity loss (IUCN, 2016). The
accidental or deliberated introduction of species worldwide is contributing to global changes, through
the gradual replacement of native biotas, resulting in taxonomic, functional and genetic homogenization
(Olden et al., 2004). However, the overall impact of invasive species on ecosystems often co-occurs
with other anthropogenic impacts (Gutiérrez et al., 2014). Land-use change is usually considered to be
having the largest effect on biodiversity in terrestrial ecosystems (Sala et al., 2000). Habitat loss and
modification have been implied in facilitating invasions, so these two processes might be acting
synergistically in the ongoing extinction crisis (Brook et al., 2008).
Thanks to their discrete geographical boundaries, islands have often been used as case studies
to better understand the impact of invasive species on native diversity (Sax et al., 2002). The low levels
of genetic diversity found in island species may limit their ability to adapt to changing environments,
thus making them more susceptible to the impacts of biological invasions (Hofman and Rick, 2017).
The ability to adapt to new environments, the suitability of the environment and the ease of human
mediated dispersal are all factors that may influence the success of an invasion (Colautti et al., 2006;
6
Anderson, 2009). Many cases of invasions on islands by non-native birds or mammals have been
investigated, but invertebrate introductions have arguably been less studied, even though they can also
have large, sometimes irreparable, ecological impact.
The giant East African land snail Achatina (Lissachatina) fulica, for instance, has been listed as
one of worst invasive alien species (Lowe et al., 2000). Widely introduced in the tropics and subtropics
since 1800, it soon exhibited wide environmental tolerances and high reproductive capacity, and it is
now considered a pest, a vector of several diseases, an aggressive competitor for native mollusc fauna
and a threat to native flora (Craze and Mauremootoo, 2002; Raut and Barker, 2002; Thiengo et al.,
2007). In many cases of land-snail introductions on island, the species behave invasively, becoming
widespread in a few decades, including secondary and primary forests. That is the case of A. fulica in
many islands of the Pacific and Indian oceans ( Griffiths et al., 1993; Agongnikpo et al., 2010). However,
in other cases, such as A. fulica’s introduction on Christmas Island and of Euglandina rosea in Mauritius,
the snails avoided well-preserved forest, probably due to the scarcity of suitable food plants or to the
presence of native predators and/or competitors (Lake and O’Dowd, 1991; Griffiths et al., 1993). Islands
resulted particularly susceptible to invasion by giant African snails, and the African giant land snail
family Achatinidae, has been largely and deliberately introduced in and outside Africa, for medicinal,
ornamental and food purposes (Cowie, 2001; Raut and Barker, 2002; Thiengo et al., 2007).
The West African Giant Land Snail Archachatina marginata (Swainson, 1821), has been introduced in
the islands of São Tomé and Príncipe probably for its value as a source of protein in mainland Africa
(Gascoigne, 1994a; Raut and Barker, 2002; Babalola and Akinsoyinu, 2009). The snail’s introduction
on Príncipe island was followed by a fast expansion throughout human-modified ecosystems over the
past 20 years. However, the species was never encountered inside the native forest (Dallimer and Melo,
2010). Its introduction in São Tomé is dated around 50 or 70 years ago, anticipating the Príncipe one
(Gascoigne, 1994a). In 1994, it was restricted to the north and east of the island, found mostly in cocoa
and coffee plantations, and could not be found in forest or at higher altitudes (Gascoigne, 1994a). The
species rapidly started spreading on the island, probably facilitated by a deliberated diffusion as a food
source. Rural populations in São Tomé rely on introduced wild species for protein, and the introduced
snail certainly has an important, since a preliminary study found that it accounted for 45.7% of all protein
intake consumed in a community (Carvalho et al., 2015). This species has certainly a remarkable
importance as food source on the island, but its rapid spread may result in secondary consequences
concerning agriculture damages, health issues and threats to native flora and fauna.
This work intends to quantify the success of this introduced species as an invader on the highly
human-modified landscape, while assessing which factors might explain its distribution. São Tomé
Island holds a strong gradient of environmental degradation, from the densely populated coast to the
centre still widely covered by native forest, which represents a good experimental setting to assess the
links between the distribution of the introduced snail and land-use human modification. In this context,
our specific objectives are to: (1) model the current distribution of the species to identify important
7
island-wide explanatory factors; (2) assess local habitat preferences to understand which variables
facilitate invasion along the plantation-forest transition; and (3) study population structure across the
land-use intensification gradient.
METHODS
Study area
São Tomé is a volcanic island situated in the Gulf of Guinea, just north of the Equator and
255km west of the African continent. It has a well-marked seasonality: the rainy season extends from
September to May, and the dry season, called the gravana, which extends from June to August. A
smaller and less intensive dry season, the gravanito, occurs during some weeks sometime between
December and February. The steep mountains and altitudinal differences promote a variety of climates.
The annual rainfall varies from less than 600 mm in the northeast to over 7,000 mm in the southwest
(Tenreiro, 1961). Humidity is high and constant in most the island (Carvalho et al., 2015). The
temperature at sea level is fairly constant, varying between 22 and 30º C. In altitude, temperature is more
variable, reaching similar maxima, but dropping below 10º C (Silva, 1958; Bredero et al., 1977).
São Tomé is internationally recognized as an important biodiversity hotspot, in particular due
to its richness in endemic plants and birds, as well as its remarkable mollusc diversity (Jones, 1994).
Most of its biodiversity lies within the São Tomé Obô Natural Park (ONP), which includes great part of
the remaining native forest. Despite being a protected area, overexploitation, land-use intensification
and the spread of exotic species represent major threats (De Lima et al, 2016).
Complex landscape modifications have occurred in the island since it was first discovered in
1471, totally covered by forest. Nowadays, a gradient of forest degradation can be identified, from the
mountainous areas in the centre and southwest of the island, where well-preserved forest prevails, to the
surrounding secondary forest, resulting from abandoned cultivations and to the plantations. These
extend to the coast, and are mostly composed by cocoa and coffee shade plantations intermixed with
non-forest land-use types, such as oil palm monocultures, horticultural fields, urban areas and open
savanna. (Jones et al., 1991; Salgueiro and Carvalho, 2001; Diniz et al., 2002; de Lima et al., 2014).
A. marginata is said to have been introduced in São Tomé as a food source, between 1950 and
1970.
8
Field Methods
This study took place across São Tomé, mostly during the gravanito and rainy seasons, when
the species is known to be active (Raut and Barker, 2002).
Species distribution modelling
To map the distribution of the snail in the island, we first compiled occasional and systematic
observations registered by the BirdLife International São Tomé and Príncipe Initiative (BISTPI)
between August 2013 and February 2015 (de Lima et al., 2016). These were later supplemented by
additional occasional and systematic observations, collected between January and March 2017 (Soares,
2017). Both of these sources divided São Tomé in 4 km2 quadrats (Fig. 1.1a). One-hundred-seventy-two
of these quadrats were sampled by performing five 10-minutes point counts, separated by at least 200m,
in one of the four randomly selected 1 km2 tetrads (de Lima et al., 2013). Additional records were also
made, especially when the species was found in interesting locations. For both type of records, the
presence of the snail, location and altitude were registered using a GPS.
Habitat associations
To assess habitat preferences along the gradient of forest degradation, we created seven transects
of variable length, totalling 16.8 km (Fig. 1.1b). The transects were chosen to have an overall
representation of the forest degradation gradient throughout the island. The shade plantations and non-
forested areas were combined in a unique class, representing mostly the cultivated areas surrounding the
forest. Each transect was divided in 50 m long sectors that were characterized by recording coordinates,
elevation and habitat type. All transects were sampled three times between mid-January and mid-March
2017 by two observers actively searching giant snails in a 4m wide band, while walking the transects at
a constant and slow pace. Every egg, dead or live individual was recorded, taking note of the length and
width of the shell.
9
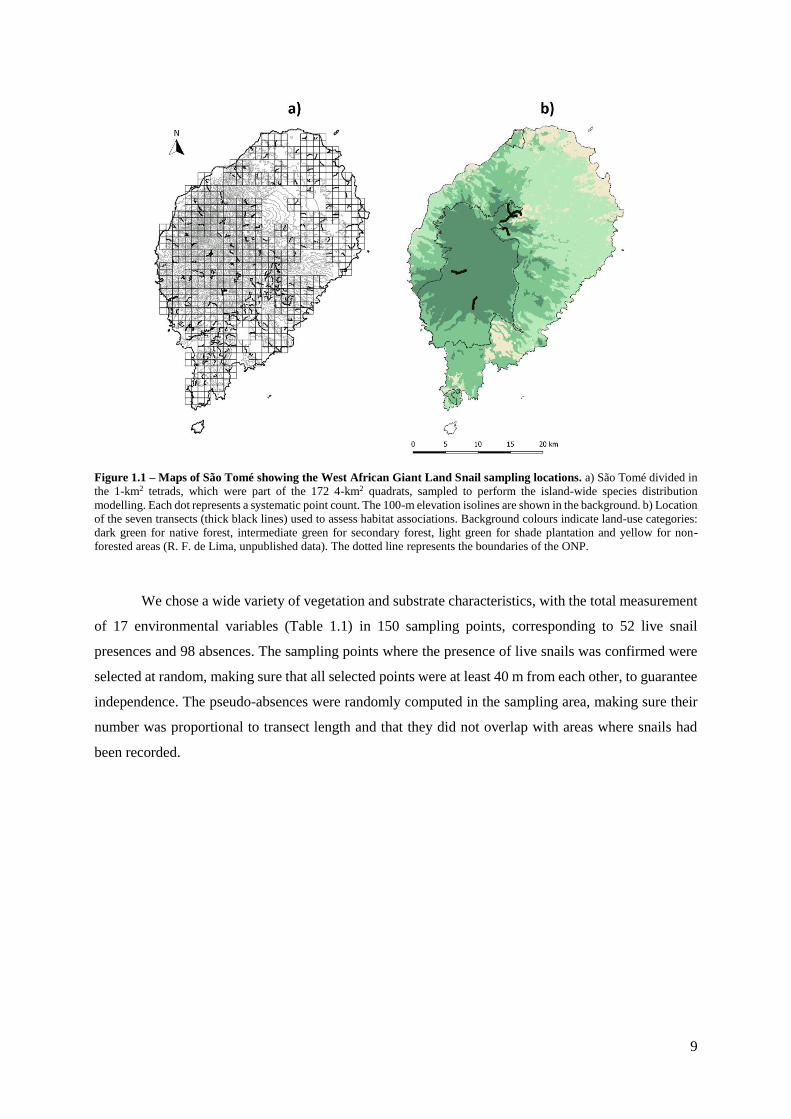
Figure 1.1 – Maps of São Tomé showing the West African Giant Land Snail sampling locations. a) São Tomé divided in
the 1-km2 tetrads, which were part of the 172 4-km2 quadrats, sampled to perform the island-wide species distribution
modelling. Each dot represents a systematic point count. The 100-m elevation isolines are shown in the background. b) Location
of the seven transects (thick black lines) used to assess habitat associations. Background colours indicate land-use categories:
dark green for native forest, intermediate green for secondary forest, light green for shade plantation and yellow for non-
forested areas (R. F. de Lima, unpublished data). The dotted line represents the boundaries of the ONP.
We chose a wide variety of vegetation and substrate characteristics, with the total measurement
of 17 environmental variables (Table 1.1) in 150 sampling points, corresponding to 52 live snail
presences and 98 absences. The sampling points where the presence of live snails was confirmed were
selected at random, making sure that all selected points were at least 40 m from each other, to guarantee
independence. The pseudo-absences were randomly computed in the sampling area, making sure their
number was proportional to transect length and that they did not overlap with areas where snails had
been recorded.
10
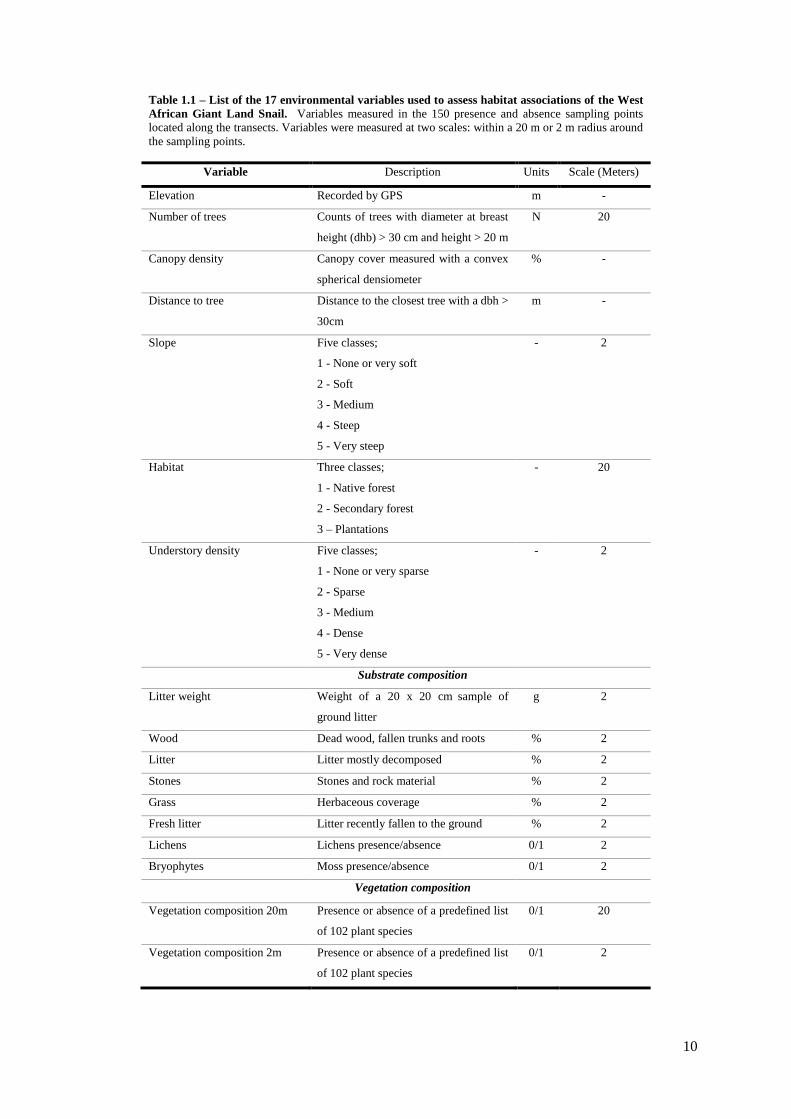
Table 1.1 – List of the 17 environmental variables used to assess habitat associations of the West
African Giant Land Snail. Variables measured in the 150 presence and absence sampling points
located along the transects. Variables were measured at two scales: within a 20 m or 2 m radius around
the sampling points.
Variable Description Units Scale (Meters)
Elevation Recorded by GPS m -
Number of trees Counts of trees with diameter at breast
height (dhb) > 30 cm and height > 20 m
N 20
Canopy density Canopy cover measured with a convex
spherical densiometer
% -
Distance to tree Distance to the closest tree with a dbh >
30cm
m -
Slope Five classes;
1 - None or very soft
2 - Soft
3 - Medium
4 - Steep
5 - Very steep
- 2
Habitat Three classes;
1 - Native forest
2 - Secondary forest
3 – Plantations
- 20
Understory density Five classes;
1 - None or very sparse
2 - Sparse
3 - Medium
4 - Dense
5 - Very dense
- 2
Substrate composition
Litter weight Weight of a 20 x 20 cm sample of
ground litter
g 2
Wood Dead wood, fallen trunks and roots % 2
Litter Litter mostly decomposed % 2
Stones Stones and rock material % 2
Grass Herbaceous coverage % 2
Fresh litter Litter recently fallen to the ground % 2
Lichens Lichens presence/absence 0/1 2
Bryophytes Moss presence/absence 0/1 2
Vegetation composition
Vegetation composition 20m Presence or absence of a predefined list
of 102 plant species
0/1 20
Vegetation composition 2m Presence or absence of a predefined list
of 102 plant species
0/1 2
11
Data Analysis
Statistical analyses were made in R, version 3.3.3 (R core team, 2017) and in QGIS, version
2.18.4 (Quantum GIS Development Team, 2017).
Species distribution modelling
We performed Generalized Linear Models (GLM, McCullagh and Nelder, 1989) with binomial
errors to model the species distribution in São Tomé, using 70% of the presence/absence records. As
explanatory variables, we used Land-use type, Rainfall, Topographical Positioning Index (TPI),
Elevation, Slope, Distance to rivers, Distance to the coast, Ruggedness and Remoteness (Table S1).
Multicollinearity was assessed by calculating variance inflation factors (VIFs). We ranked all possible
GLMs, without interactions, based on Akaike information criteria corrected for small sample size (AICc,
Burnham and Anderson, 2002), using the function “dredge” of the “MuMIn” package (Barton, 2016).
The contribution of each environmental variable was quantified calculating the relative variable
importance (RVI), using the “model averaging” function of the same package. We validated the model
with the remaining 30% of the presence/absence records. To assess model goodness of fit we used the
curve (AUC) of the receiver operating characteristic curve (ROC), from the “pROC” package (Robin et
al., 2011), and the McFadden’s Index, from the “pscl” package (Jackman et al., 2015). Finally, we used
the “predict” function of the “stats” package (R core team 2017) to fit the best model to raster data and
obtain the species potential distribution map.
Habitat associations
We started by doing a non-metric multidimensional scaling (NMDS) ordination using the
function “metaMDS” of the “vegan” package (Oksanen et al., 2017) to compile information on substrate
composition variables (litter weight, wood, litter, grass, stones, fresh litter, lichens, bryophytes) and
another one on vegetation composition variables (vegetation composition assessed in a 20 m and in a 2
m radius), based on a Bray-Curtis distance matrix (Minchin 1987; Chechina & Hamann 2015).
Subsequently, we performed a GLM with binomial errors to identify habitat associations. As
explanatory variables, we used elevation, trees number, canopy density, tree distance, slope, habitat,
understory density and the first two axes of the NMDSs. We calculated the VIFs to assess
multicollinearity and the GLMs were ranked using the function “dredge” of the “MuMIn” package
(Barton, 2016) based on AICc. We calculated RVI to assess the overall contribution of each
environmental variable to explain the occurrence of the snail. Finally, to test differences in the species
abundance calculated for every 50 m of transect sampled, a Kruskal-Wallis test was used with the three
different habitats as a grouping factor.

12
Population age structure
The shell length and width were used to estimate the population age structure. The individuals
of this species reach sexual maturity at the age of 9 months, when the average shell length is around
8.5cm (Plummer, 1975). We used this parameter to distinguish juveniles from adults, and divided the
population in eggs, juveniles, adults and dead shells, to analyse population age structure across land-
uses.
RESULTS
Species distribution modelling
Across the island, we recorded 957 presences and 891 absences. To avoid multicollinearity
between variables; Distance to coast, Remoteness and Rugosity were excluded from the modelling. The
GLM showed no multicollinearity (VIF < 2.69) and a good model fit (AUC = 0.83 and McFadden
pseudo R-Square = 0.25). Land-use type was identified as the most important variable to explain the
presence of the snail (Table 1.2), which clearly avoided native forest. The species was also associated
with lower altitudes, lower rainfall, valleys, and middle and upper slope areas (Table 1.2, Fig. S2, Fig.
S3, Table S9a, Table S9b). The potential distribution map shows that the snail avoids some coastal areas
and the centre of the island, only marginally entering the ONP, especially in the south. It also shows that
the species is well established in the ONP buffer area (Fig. 1.2).
Table 1.2 – Relative variable importance (RVI) obtained from the island-wide distribution
model for the invasive snail. The most important predictor variables are highlighted in bold.
Predictor variable RVI
Land-use type 1.00
Rainfall 1.00
TPI 1.00
Elevation 1.00
Slope 0.89
Distance to Rivers 0.62
13
Figure 1.2 – Maps of São Tomé showing the a) observations and b) modelled potential distribution of the West
African Giant Land Snail in São Tomé.
Local habitat associations
More than half of the length of the transects comprised native forest (55%), followed by
secondary forest (28%) and plantation (17%). We recorded 293 live snails and 41 shells. We excluded
the first axis of the 20m radius vegetation NMDS because it was highly correlated with other
environmental variables and we used the second axis instead. The GLM showed no multicollinearity
(VIF < 5.92).
Land-use type was the best variable to explain the presence of the giant West African Giant
Land Snail (Table 1.3, Table S10a, Table S10b) along the transects. It was mostly found in plantations
(32.9 snails per km), followed by secondary forest (31.4 snails per km). This species was less abundant
in the native forest (5.5 snails per km, Kruskal-Wallis test, p < 0.001). This preference is also associated
with the presence of introduced plants, such as taro Xanthosoma saggitifolium, banana Musa sp., coral
tree Erythrina poeppigiana, Cinchona sp., sweet potato Ipomea batatas, avocado tree Persea
americana, jackfruit tree Artocarpus heterophylla and chayote Sechium edule (Fig. 1.3b). The snail
tends to occur at lower altitudes, having been found only up to 1,330 m a.s.l., despite the transects
elevation varying between 350 and 1,480 m a.s.l.. Finally, it also showed a positive association with the
second axis of the vegetation NMDS (Fig. 1.3a), and particularly with the presence of grass and shrubs
such as Pauridiantha floribunda, Costus giganteus, Psychotria peduncularis and Leea tinctoria and
introduced trees, such as oil palm tree Elaeis guineensis, and spiny tree fern Alsophila manniana.

14
Table 1.3 –Relative Variable Importance (RVI) of predictor variables obtained from the habitat
association analysis. RVI are calculated by model averaging of the Binomial GLM used to explain the
presence of the West African Giant Land Snail along the sampling transects.
Predictor variable RVI
Elevation 1.00
Trees number 0.41
Canopy density 0.24
Tree distance 0.28
Substrate (NMDS 1 axis) 0.37
Substrate (NMDS 2 axis) 0.26
Slope 0.05
Land-use type 1.00
Understory density 0.53
Vegetation (NMDS 2 axis) 1.00
Figure 1.3 – First two axes of the 20m vegetation composition NMDS (stress= 0.18). a) West African Giant Land Snail
abundance in each sampling location. The triangles represent presences, and points are absences. Symbol size is proportional
to species abundance. The colours indicate land-use types: black is native forest, red is secondary forest and green is non-
forested. b) Association between vegetal species (Table S2) and NMDS axes. The length of the arrows is proportional to the
species association with each axis.
Population age structure
The snails found in the transects ranged between 1.8 and 11.9 cm, with a median of 7.6 cm (Fig.
1.4a). We didn’t analyse in detail the shell width because it resulted strongly correlated with shell length
(Spearman’s rank correlation rho=0.95, p < 0.001, Fig. S3). We estimate that 65% of the snails were
juveniles because their size was below than the threshold of 8.5 cm of shell length. The juveniles which
predominated in secondary forest and plantations, while adults and dead shells prevailed in native forest
(Pearson’s Chi-squared test, p<0.001, Fig. 1.4b, Table S3).
15
Figure 1.4 – Population age structure of the West African Giant Land Snail, based on shell length. a) Overall shell length
distribution. The bold vertical line separates juveniles from adults (x = 8.5 cm). b) Age class percentage across land-use types.
DISCUSSION
This first systematic study on the ecology and distribution of the West African Giant Land Snail
in São Tomé has shown that land-use type and altitude are key factors to explain its presence, both at
island-wide and at local scale.
Distribution in São Tomé and its determinants
The species is currently well established across most of the island, avoiding large extents of
native forest and some non-forested areas, such as the savannahs in the dry northeast and the oil palm
monocultures in the south. Only marginally does it occur within the boundaries of the ONP. The invasive
snail is strongly associated to drier secondary forest and shade plantations. It also prefers lower altitudes
and avoids mountain ridges. These results are in line with habitat preferences described for species of
the same family in continental Africa. Achatinids are often well adapted to human environmental
modifications, prevailing in forest-margin habitats and abounding in plantations (Raut and Barker,
2002). Comparing to others achatinids, Archachatina spp. is not as dependent on humid areas (Hodasi,
1984).
The species became widespread in just over half a century after being introduced on São Tomé
Island. It seems to prefer São Tomé’s mosaic of human-modified ecosystems, which suggests that these
modifications promoted its spreading. The anthropogenic modification of ecosystems is known to drive
16
increases in the local abundance or regional distribution of invaders (Marvier et al., 2004; Didham et
al., 2007). Moreover, dispersion was probably actively facilitated by people, since this snail is a key
source of protein. Significantly higher amounts of wild snails are consumed in more remote areas
inhabited by poorer families (Carvalho et al., 2015). Thus, it seems likely that its spread in rural areas
might have contributed to the current widespread distribution of the species, which includes forests in
protected areas.
The species association to lower altitudes is very likely also linked to more intensive human
disturbance in the lowlands. Its scarcity on the coast and in the palm-oil monoculture may be due to the
higher temperature and lower humidity, coupled with the oversimplified vegetation structure, which
provide overall lower habitat suitability (Osemeobo, 1992).
Local habitat associations
At local scale, the species maintains the preference for lowland secondary forest and plantations.
The vegetation analysis revealed that the species is associated with introduced plants, typical of human-
disturbed ecosystems and with shrubs and grasses typical of riparian forest and sub forest, normally
found at the edge of the native forest (Diniz et al., 2002). These results reinforce that elevation and land-
use type are key factors to explain the presence of this snail in São Tomé.
Population age structure
The shell length measurements suggest that most individuals were juveniles. Even though the
West African Giant Land Snail can reach up to 16 cm in shell length, the individuals we measured never
surpassed 11.9 cm. This rather small size suggests that the life span is no longer than 2 years (Plummer,
1975), which is probably linked to intensive local harvesting. Nevertheless, since published
measurements refer to captive individuals, we must consider that, in the wild, growth rate and life span
could be influenced by other factors, such as aestivation, food shortages and competition.
In proportion, juveniles prevail in secondary forest and plantations, but not in native forest.
Knowing that locals tend to harvest bigger individuals (Pers. Observ.), a higher anthropogenic pressure
in ecosystems closer to local villages could lead to a prevalence of smaller individuals. The poorness of
juveniles and the prevalence of adults and dead shells in native forest could indicate that this is not a
highly suitable ecosystem for this species.
We observed several egg clutches, often just laid on the soil surface. Some of these hatched
between February and March, suggesting that this species’ first hatch of the year occurs at the end of
the small dry season and the juveniles are only three months old when the main dry season starts. This
timing partially matches the cycle of Nigerian conspecifics, which hatch when the wet season begins,
so that the young snails are able to feed during the wettest months. The growth of the snails is faster
17
during the first 3 to 5 months of life, to ensure provision and increased chances of survival during the
following dry season (Plummer, 1975). Our conclusions are mainly based on observations in the wild,
and provide a first glimpse into the life cycle adaptations of this species in São Tomé. However, whole
year observations complemented with captivity experiments performed in standard conditions are
needed to gain a better knowledge of this key aspect of the species biology, which will be key for future
management plans to control this invasive species.
Is habitat degradation facilitating African giant snail invasion?
In São Tomé, we have found adult snails moving and feeding inside native forest (n=37), up to
1.5 kilometres away from other ecosystems. These observations indicate that the species might migrate
and survive inside well-preserved forests, despite occurring at lower densities (5.5 snails per km
compared to 31.4 in secondary forest). This low density and adult-dominated population inside the
native forest may be the sign of a recent expansion, and that the species is currently only marginally
able to use this ecosystem. It is known that the success of an invasion depends on the capacity of a
species to adapt to new conditions, or on the invasibility of the recipient ecosystem, and that plants and
animals dispersed by humans may cause radical disturbances in the environment that encourage
invasions (Vitousék et al., 1997; Marvier et al., 2004). Thus, the snail’s preference for feeding on
cultivated plant species may have favoured its expansion in human-altered environments (Imevbore,
1992; Raut et al., 2002). Lettuce, taro, banana, sweet potato, avocado, chayote, jackfruit tree, and other
species with succulent leaves, tubers and fruits, commonly found in plantations and forested areas
around plantations, are examples of edible plants associated to the occurrence of the exotic snail in São
Tomé. Other introduced plants occur in more preserved land-use types, including native forests, thus
functioning as a dispersion pathway for the snail to reach well-preserved forest patches. Such plant
species include the oil palm tree E. guineensis and the coral tree, whose flowers were confirmed as food
items for the snail in the study area. Whether the current restricted distribution of the species inside the
native forest is due to limited food availability, biological control by predation or parasitism, or by others
factors it is not known. A better understanding of the factors constraining the species invasion of the
ONP is essential to ensure that conservation strategies are in place to avoid or minimize this invasion,
as it is most likely due to a lag time rather than to an ecological impossibility. Species management may
attain its broadest success by simply identifying and protecting large stands of minimally disturbed and
relatively unfragmented ecosystems (Marvier et al., 2004). The species distribution map and the most
important predictors of presence are, for this purpose, a useful tool for future management plans
involving those well-preserved areas with a current higher risk of invasion by the West African Giant
Land Snail.
18
Implications for native biodiversity
There are anecdotal indications that anthropogenic snail gathering pressure may already be
forcing the species to adapt and survive in many of the secondary forests that compose the ONP buffer
zone. The continuation of such pressure might help promoting the species invasion of native forests,
which are mostly found inside the ONP. Since this invasive species is known to feed on a great variety
of plants species, it can be a threat to the native plants (Agongnikpo et al., 2010). It has already been
documented that invasive Achatinidae can also feed on other snails (Meyer et al., 2008), and indirect
ecosystem disruption might threaten the endemic-rich native ecosystems and their species (Peterson et
al., 1998; Orwig, 2002; Dukes & Mooney, 2004).
The endemic São Tomé and Príncipe giant land snail, Archachatina bicarinata was common
throughout the islands, including at low altitudes, until the introduction of the invasive West African
Giant Land Snail (Gascoigne, 1994a). In Príncipe island this species is now restricted to the native
forests, at higher altitude or in less accessible areas, mostly outside the distribution range of the invasive
species, while no systematic survey has been carried in São Tomé (Dallimer and Melo, 2010). The
introduced snail has been implied in the rapid decline of the endemic snail (Gascoigne, 1994b), but no
specific process linking the two species has been identified. To identify effective conservation measures
to protect the endemic species it is key to clarify how these two species interact. A broader evaluation
of the ecological repercussions of introduced snail on the ecosystems and species of these islands is also
urgent to ensure negative impacts are avoided.
Finally, we concluded that anthropogenic ecosystem degradation facilitated the spread of the
invasive giant land snail up until the marginal portions of the native forest. Thus, future conservation
actions must consider the management of the West African Giant Land Snail inside the ONP and in its
buffer zone. This species has already spread throughout the island, occurring in high densities, therefore
eradication measures will not be very feasible. Future research should focus on identifying which factors
are associated with the pervasiveness of the invasive species in the native forest.
On a wider context this study shows how anthropogenic ecosystem changes can facilitate the
spreading of invasive species. In particular, how the introduction of exotic species, creates favourable
conditions for the survival, growth and reproduction of invasives.
19
Chapter 2.
Is the invasive West African Giant Land Snail Archachatina marginata
displacing the Gulf of Guinea endemic Archachatina bicarinata?
Abstract: The biodiversity loss crisis is severely affecting invertebrates worldwide. Island terrestrial
molluscs are among the most vulnerable taxa, being particularly affected by habitat destruction and
introduced species. The Gulf of Guinea Giant Land Snail Archachatina bicarinata, endemic to the
islands of São Tomé and Príncipe, has suffered a severe population decline in the last decades. However,
knowledge of its distribution, ecology and major threats remains very scarce. One of the most likely
causes for the demise of this endemic species is the introduction of the West African Giant Land Snail
Archachatina marginata, which in just half a century spread across much of the island. This study aims
to understand possible interactions between the exotic and native giant land snails in São Tomé Island.
We found a strong temporal and spatial segregation between the two species. The reports of local
inhabitants seem to match written accounts in that the contraction of the endemic giant snail’s
distribution coincided and is linked to the expansion of the introduced. Nowadays, the distribution of
the two species in São Tomé is almost complementary, and they use very distinct habitats: the endemic
is restricted to the most remote patches of native forest, while the invasive prefers degraded habitats,
only marginally occurring in native forest. The current population of the invasive snail includes a high
proportion of juveniles, which contrasts with the worrisome adult-dominated situation of the endemic.
Finally, we found a displacement in the daily activity patterns of the two snails, with the endemic being
active mostly during the day and the invasive during the night. Our results represent the first systematic
report on the distribution and habitat preferences of the Gulf of Guinea Giant Land Snail in São Tomé
Island, providing further indications that the introduced West African Giant Land Snail is behaving as
an invasive and seems to be linked to its dramatic decline. The situation of this endemic species requires
immediate conservation action and that its conservation status on the IUCN Red List is upgraded.
Keywords: species distribution modelling, biological invasion, habitat degradation, interspecific
competition, São Tomé and Príncipe
Introduction
Over the past 500 years, human activities have led to habitat modifications, overexploitation of
species and introduction of exotic species, which are the key drivers of the current biodiversity crisis
(Briggs, 2015). These are often interlinked, namely because the invasibility of introduced species is
increased by habitat disturbance, which opens ecological space for the penetration of recently arrived
species (Gillespie, 2007). Human colonization and subsequent biological invasions have been
particularly damaging to island ecosystems (Sax and Gaines, 2008; Ceballos et al., 2015). These have
evolved in isolation, have high rates of endemism with naturally small population sizes and ranges, and

20
simple ecological networks marked by reduced competition, thus being particularly susceptible to
invasion (Gillespie, 2007). Oceanic islands have high extinctions rates among terrestrial vertebrates and
invertebrates (Briggs, 2015). However, invertebrates are highly underrepresented in conservation
research, in favour to more charismatic vertebrate taxa (Clarke and May, 2002; Lydeard et al., 2004).
Land snails are useful ecosystem health indicators, as they are very sensitive to habitat
degradation. This sensitivity is linked to their low mobility and restricted geographic distributions, as
well as to being closely associated to soil properties (Dedov and Penev, 2004; Horsák et al., 2009; Oke
and Omoregie, 2015; Nicolai et al., 2017). Among all animal groups, land snails have suffered the largest
number of species extinctions due to human activities, with the great majority of extinctions taking place
in oceanic islands (Lydeard et al. 2004; Chiba and Cowie, 2016). In addition to the direct impacts of
anthropogenic activities, intentionally or unintentionally introduced species on islands also affect native
land snail faunas (Chiba and Cowie, 2016).
São Tomé is an oceanic island in the Gulf of Guinea, off the west coast of Africa and is one of
the 25 global biodiversity hotspots, due to its diverse range of unique and threatened species (Myers at
al., 2000; Jones, 1994). The island harbours seven endemic genera, at least one endemic family of
terrestrial molluscs, and endemic species account for 77% of its land snail fauna (Jones, 1994; CBD,
2015). Despite some taxonomic studies on the unique land snail fauna of São Tomé, few studies have
explored their distribution, ecology and conservation status.
The Gulf of Guinea Giant Land Snail Archachatina bicarinata (Bruguière, 1792), is one of the
most iconic terrestrial molluscs of São Tomé Island. Endemic to the islands of São Tomé and Príncipe,
this giant snail used to be relatively common, especially inside the forest (Moller, 1894; Gascoigne,
1994a). From the 19th century, a reduction of its range has been documented, at an alarming rate in
recent decades (Gascoigne, 1994b; Dallimer and Melo, 2010). The causes of this decline are not entirely
clear, but have been attributed to the introduction of the West African Giant Land Snail Archachatina
marginata (Swainson, 1821) (Gascoigne, 1994a). The exotic snail, probably introduced as a food source,
has rapidly spread through human-modified habitat, being currently present in great part of São Tomé
Island, including the native forest (Panisi, 2017). The rapid decline of the endemic snail in Príncipe
Island (Dallimer and Melo, 2010) underlines the importance of addressing its conservation. This requires
an understanding of the major threats affecting the species, namely habitat degradation and the spread
of the introduced congener.
This study focuses on the ecology of the endemic Gulf of Guinea Giant Land Snail and of the
invasive West African Giant Land Snail, to understand how these species might be interacting in São
Tomé Island. More specifically, we aim: (1) reconstructing the historic changes in the distribution of
both species using knowledge of local people; (2) modelling the current island-wide distribution of both
species, identifying important ecological determinants and; (3) assessing habitat preferences, activity
21
patterns and population age structure along a gradient of forest degradation, to understand how the
introduced snail might be linked to the demise of the endemic.
METHODS
Study species and area
São Tomé is an 857 km2 island, located 255km west of the African mainland, in the Gulf of
Guinea. It was discovered in 1471 and since then its territory has been widely modified, mostly by
agriculture (de Lima et al., 2014). The human population is currently estimated at 201.025,
corresponding to three times more than half a century ago (CIA, 2017). Most of its population is located
along the coast, mostly dominated by savannah in the north and other non-forested ecosystems in the
centre and south. Inland, towards higher elevation, different types of ecosystems can be found, including
plantations and vast secondary forests, most of which derived from abandoned plantations (Jones et al.,
1991; Diniz et al., 2002). Finally, the remaining native forest can be found in remote areas, most of
which in the steep mountains extending through the west-centre and south of the island. Annual rainfall
varies across the island from less than 600 mm in the northeast to over 7,000 mm in the southwest
(Bredero et al. 1997). Rain is concentrated during the wet season, from September to May. The dry
season, the gravana, extends from June to August, with a less demarcated dry period, the gravanito,
from December to March. Humidity is high throughout the year in most of the island (de Lima et al.,
2016). Altitude creates a temperature gradient, with annual averages ranging from 23 to 30 ºC at sea
level to less than 13.5 °C above 1500 m (Silva, 1958).
São Tomé is an important biodiversity hotspot, holding a remarkable richness of endemic flora
and fauna, such as birds, orchids and terrestrial molluscs (Jones, 1994). The Ôbo Natural Park (ONP),
covering around one third of the island, was established, together with its buffer zone, in 2006 and
includes most of the island’s remaining native forest. Despite being a protected area, hunting, logging
and harvesting of several other forest products persist (de Lima et al., 2016). Most of the numerous
endemics of São Tomé are concentrated in this protected area, including the Gulf of Guinea Giant Land
Snail. This species was described as common throughout São Tomé, namely at low altitudes (Gascoigne
1994a). However, it seems to have been subject to a rapid decline in the last decades, presumably
associated to the introduction of the invasive West African Giant Land Snail between decades 50s-70s
(Girard, 1893; Gascoigne, 1994a, 1994b). A recent systematic survey on Príncipe Island revealed a
dramatic population decrease, describing that the endemic species currently occurs exclusively in the
less accessible areas of the primary rainforest (Dallimer and Melo, 2010). In 1994, the known
distribution of the invasive West African Giant Land Snail in São Tomé was limited to cocoa and coffee
plantations in the north and east of the island, while it was absent from primary and secondary forest,
and higher altitudes (Gascoigne, 1994a, 1994b). In the last couple of decades, the species spread rapidly
22
and nowadays it is distributed across most of the island, being associated to more degraded ecosystems,
even though marginally it can appear within the native forest (Panisi, 2017). Our work took place mostly
during the short dry season and the rainy season, and across São Tomé Island, focusing on the ONP and
its buffer zone.
Field methods
Local perceptions about the changes in giant land snail distribution
To understand the perceptions of local rural inhabitants on the distribution changes of the giant
land snails of São Tomé, we performed 86 interviews in 21 villages (Table S4, Table S4b). These
villages are located across São Tomé, but most are within the ONP buffer zone. Each interviewee was
asked to identify photos of both study species, to assess if they could identify them correctly. Then, we
asked when and how the invasive species arrived in São Tomé, to reconstruct a spatio-temporal gradient
of expansion in the island. Furthermore, we enquired about the spatio-temporal changes in the
distribution of the endemic species. Finally, we questioned about the anthropogenic uses of both species.
Island-wide species distribution modelling
To model the distribution of the two species island-wide, we jointed occasional and systematic
observations registered by the BirdLife International São Tomé and Príncipe Initiative (BISTPI)
between August 2013 and February 2015 (de Lima et al. 2016). Additionally, we collected
supplementary systematic records between January and March 2017 to ensure that the entire island was
sampled adequately (Soares, 2017). This sampling included five 10-minutes point counts in 174 1-km2
quadrats, spread across the island (de Lima et al. 2013; Panisi, 2017; Fig. 2.1a). Additional records were
also made, registering the location and altitude with GPS whenever the endemic species was found, but
only in unusual locations for the invasive.
Transect sampling: habitat associations, daily activity patterns and population age structure
To assess the habitat preferences of both species, and compare the distribution of the two
species, we sampled seven transects of variable length along the gradient of forest degradation, totalling
16.8 km (Fig. 2.1b). The transects were chosen to cover the transition between the distribution of both
study species, and to represent the forest degradation gradient throughout the island. The shade
plantations and non-forested areas were combined in the unique class “plantations”, representing the
cultivated areas surrounding the forest, which was the focus of this sampling effort. Each transect was
sampled three times between mid-January and mid-March 2017. The transects were divided in 50 m
long sectors, each of which was characterized by recording GPS location, elevation and predominant
habitat type.

23
The transects were sampled simultaneously by two observers walking at constant slow pace,
while actively searching for both species of giant land snails in a 4 m wide band (about 1.5 km/h). We
recorded exact location, species, time, elevation, habitat type, activity, and shell length and width for
every dead or live specimen found during the transects. To assess daily activity patterns, we tried to
keep an equal proportion of day and night sampling hours, and the activity (e.g. eating or crawling) or
inactivity were assessed for each giant snail detected. All transects were sampled around sunrise (5.30
AM), between 4 AM and 11 AM, and around sunset (5.30 PM), between 13 PM and 21 PM.
Shell length and width were used to estimate the population age structure of each species. The
West African Giant Land Snail reaches sexual maturity at the age of 9 months, when the average shell
length is estimated at 8.5cm (Plummer, 1975). We used this parameter to distinguish juveniles from
adults in both species, since there is no information about the exact size of the endemic species when it
reaches sexual maturity. We built a density plot to compare the population structure of both species.
We measured 17 environmental variables (Panisi, 2017), which included a wide variety of
vegetation and substrate measurements, to describe the sampled locations in detail. The variables were
collected in 150 sampling points, including 52 places where the presence of live invasive snails was
confirmed, 17 where the presence of live endemic snails was confirmed, and 84 pseudo-absences. The
sampling points where the presence of live snails was confirmed were selected at random, making sure
that all selected points were at least 40 m from each other, to guarantee independence. The pseudo-
absences were computed randomly in the sampling area to ensure that their number was proportional to
the length of each transect and that they did not overlap with areas where live snails had been recorded.
Figure 2.1 – Maps of São Tomé showing sampling locations for both species. a) São Tomé divided in the 1-km2 tetrads,
which were part of the 172 4-km2 quadrats, sampled to perform the island-wide species distribution modelling. Each dot
represents a systematic point count. The 100-m elevation isolines are shown in the background. b) Location of the villages
where the interviews were performed (green points) and of the seven transects (thick red lines) used to assess smaller-scale
habitat associations, daily activity patterns and population age structure. Background colours indicate land-use categories: dark
green for native forest, intermediate green for secondary forest, light green for shade plantation and yellow for non-forested
areas (Soares, 2017). The black line represents the boundaries of the ONP, the dotted line represents the limits of the ONP
buffer area.

24
Data Analysis
To perform the data analysis, we used the software R, version 3.3.3 (R core team, 2017) and in
QGIS, version 2.18.4 (Quantum GIS Development Team, 2017).
Species distribution modelling
We used 70% of the island-wide sampling records compiled to build models for the distribution
of the two species of giant land snails occurring in São Tomé (McCullagh and Nelder, 1989). We used
Generalized Linear Models (GLM) with binomial errors, having the presence of each species as the
response variable and the following explanatory variables; Land-use type, Rainfall, Topographical
Positioning Index (TPI), Elevation, Slope, Distance to rivers, Distance to the coast, Ruggedness and
Remoteness (Table S1). We ranked all possible GLMs, without interactions, based on Akaike
information criteria corrected for small sample size (AICc, Burnham and Anderson, 2002), using the
function “dredge” of the “MuMIn” package (Barton, 2016). Then, we used the “predict” function of the
“stats” package (R core team, 2017) to fit the best model for each species to raster data, and thus obtain
the species potential distribution maps. To assess the influence of the invasive snail in the occurrence
and distribution of the endemic snail, we created a new model for the endemic species, with the presence
of the projected/effective invasive snail as predictor variable. We performed an ANOVA analysis to test
for a significant reduction in the residual deviances after the inclusion of the invasive snail presence as
a predictor (Ros et al., 2015). Finally, we assessed the distribution of both species in the native and
secondary forest inside the ONP and corresponding buffer zone, to focus on the areas where the
transition between the two species occurs. For each model we assessed multicollinearity calculating the
relative variance inflation factors (VIFs), and ranked all possible GLMs, without interactions, based on
Akaike information criteria corrected for small sample size (AICc, Burnham and Anderson, 2002),
calculating the relative variable importance (RVI) of each variable. The remaining 30% of the
presence/absence records was used to assess the goodness of fit of each model by calculating the curve
(AUC) of the receiver operating characteristic curve (ROC), from the “pROC” package (Robin et al.,
2011), and the McFadden’s Index, from the “pscl” package (Jackman et al., 2015).
Habitat associations
To assess habitat associations, we compiled substrate (litter weight, wood, litter, grass, stones,
fresh litter, lichens, bryophytes) and vegetation variables (Panisi, 2017; Table 1.1), using a two-
dimensions non-metric multidimensional scaling (NMDS) ordination through the function “metaMDS”
of the “vegan” package (Oksanen et al., 2017). To assess the link between vegetation and the distribution
of the giant land snails, we plotted the probability density function of each species on to the first axis of
the NMDS ordination. Subsequently, we performed a GLM with binomial errors to identify associations
between the presence of each study species and environmental characteristics. As explanatory variables
we used elevation, number of trees, canopy density, distance to the closest tree, slope, habitat type,
25
understory density, the first two axes of the substrate and vegetation NMDSs, and presence of the other
giant land snail species. We calculated the VIFs to assess multicollinearity and all possible models for
each species were ranked using the function “dredge” of the “MuMIn” package (Barton, 2016), based
on AICc. Finally, we calculated RVI to assess the overall contribution of each environmental variable
to explain the occurrence of the snails. To test differences in the species abundance calculated for every
50 m of transect sampled, a Kruskal-Wallis test was used with the three different habitats as a grouping
factor.
RESULTS
Local perceptions about the changes in giant land snail distribution
All the 86 interviewees recognized the invasive species, but only 65 recognized the endemic.
We found a significant association between the correct identification of the endemic snail and the age
of the interviewed (Spearman’s rank correlation rho= 0.58, p < 0.001, Fig. S4): most of the interviewees
that did not recognize the endemic snail were younger than 15 years old. All the interviewees that
recognized the endemic species referred its decline. According to them, in most of the localities the
demise of the endemic occurred after the introduction of the invasive species, exception made for the
localities in the south-east (Fig. 2.2). Most interviewees linked the decline of the endemic snail to the
invasive species (48.75%, Fig. S5), but other causes of its demise were also cited, such as snail harvest
(16.2%), predation by feral pigs Sus scrofa (15%), habitat destruction (10%), predation by black snake
Naja peroescobari (7.5%) and diseases (2.5%). The endemic species disappeared from many localities
inside and in the surrounding of the PNO buffer zone limits, but it has been also recently sighted in
several localities inside and closer to the buffer zone (Fig. 2.2). The invasive species was said to have
been first introduced in the north of the island, and then voluntarily introduced in many localities across
the island. Some of the interviewees (n = 8) believe that the invasive species was introduced by Nigerian
or Cameroonian expatriates, working in Bobo Forro, near the capital of São Tomé (nr. 10 in Fig. 2.2).
The endemic species resulted in an important cultural and food value for all the interviews that knew
the species (n = 65). Its importance as food source was highlighted in 53.9% of the answers (with 16.7%
supporting that this species is a healthier food supply than the invasive one), its use for medicinal
purposes in 38.2% of the answers and its biodiversity value in 7.9 % of the answers. All the interviewed
cited the importance of the invasive species as a food source and for its trade, however, 46.5% of the
total interviewees also highlights that the introduced species is a severe pest for horticulture and for
plantations.
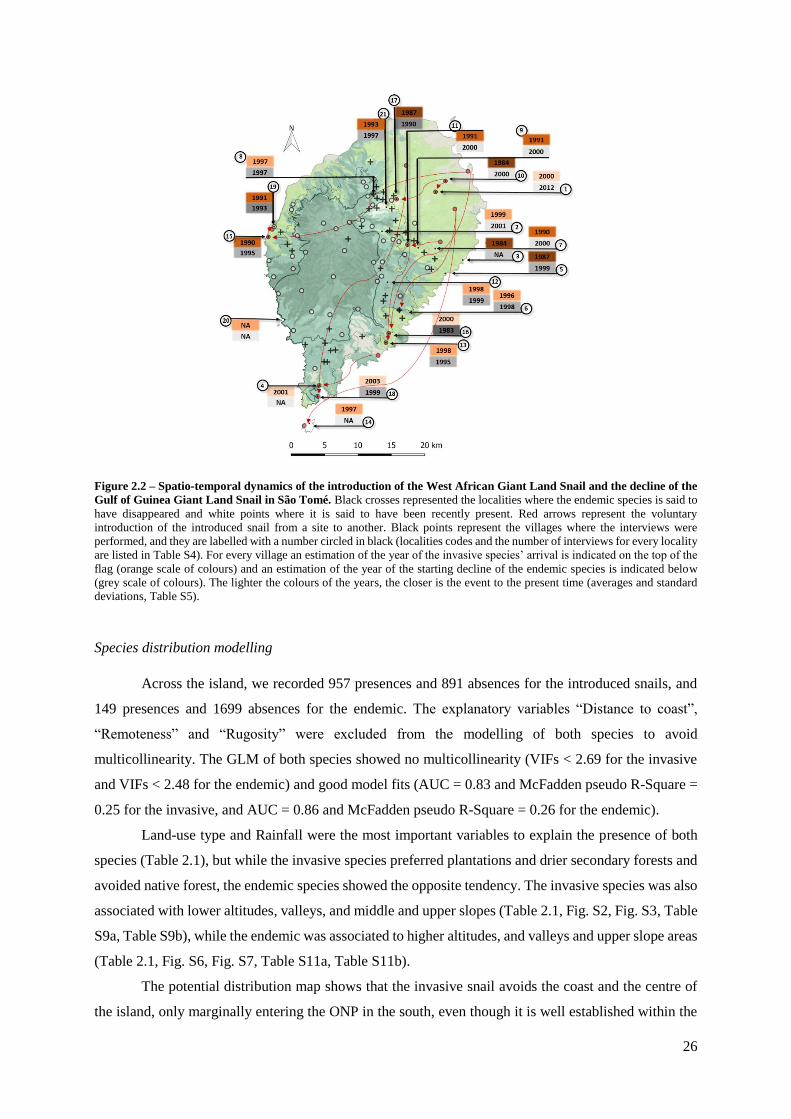
26
Figure 2.2 – Spatio-temporal dynamics of the introduction of the West African Giant Land Snail and the decline of the
Gulf of Guinea Giant Land Snail in São Tomé. Black crosses represented the localities where the endemic species is said to
have disappeared and white points where it is said to have been recently present. Red arrows represent the voluntary
introduction of the introduced snail from a site to another. Black points represent the villages where the interviews were
performed, and they are labelled with a number circled in black (localities codes and the number of interviews for every locality
are listed in Table S4). For every village an estimation of the year of the invasive species’ arrival is indicated on the top of the
flag (orange scale of colours) and an estimation of the year of the starting decline of the endemic species is indicated below
(grey scale of colours). The lighter the colours of the years, the closer is the event to the present time (averages and standard
deviations, Table S5).
Species distribution modelling
Across the island, we recorded 957 presences and 891 absences for the introduced snails, and
149 presences and 1699 absences for the endemic. The explanatory variables “Distance to coast”,
“Remoteness” and “Rugosity” were excluded from the modelling of both species to avoid
multicollinearity. The GLM of both species showed no multicollinearity (VIFs < 2.69 for the invasive
and VIFs < 2.48 for the endemic) and good model fits (AUC = 0.83 and McFadden pseudo R-Square =
0.25 for the invasive, and AUC = 0.86 and McFadden pseudo R-Square = 0.26 for the endemic).
Land-use type and Rainfall were the most important variables to explain the presence of both
species (Table 2.1), but while the invasive species preferred plantations and drier secondary forests and
avoided native forest, the endemic species showed the opposite tendency. The invasive species was also
associated with lower altitudes, valleys, and middle and upper slopes (Table 2.1, Fig. S2, Fig. S3, Table
S9a, Table S9b), while the endemic was associated to higher altitudes, and valleys and upper slope areas
(Table 2.1, Fig. S6, Fig. S7, Table S11a, Table S11b).
The potential distribution map shows that the invasive snail avoids the coast and the centre of
the island, only marginally entering the ONP in the south, even though it is well established within the

27
ONP buffer area. On the other hand, the endemic snail appears to be restricted to remote areas of the
ONP. The two species were found together in only 10 points on a total of 1848 (Fig. 2.3).
When the occurrence of the invasive species was added as an explanatory variable to model the
occurrence of the endemic, residual deviance reduced significantly (Table 2.2). Model performance was
also improved (AUC = 0.89 and McFadden pseudo R-Square = 0.30, Fig. S8), maintaining no
multicollinearity (VIFs <2.59). In fact, the presence of the invasive species became the most important
variable to explain the endemic species’ occurrence, through a negative correlation (Table 2.1,
Spearman’s rank correlation rho= - 0.27, p < 0.001, Table S12a, Table S12b).
Table 2.1 – Relative Variable Importance (RVI) calculated by Model Averaging
obtained from the island-wide model for the distribution of both study species. The
most important predictor variables for each model are highlighted in bold and numbered
by order of importance. Regarding the endemic models; model (b) differs to model (a) for
the presence of the invasive species as a predictor variable.
RVI
Predictor variable Invasive Endemic (a) Endemic (b)
Land-use type 1.001 1.002 0.99
Rainfall 1.002 1.001 1.003
TPI 1.003 1.003 1.002
Elevation 1.004 1.004 0.98
Slope 0.89 0.40 0.43
Distance to Rivers 0.62 0.82 0.55
Invasive species presence - - 1.001
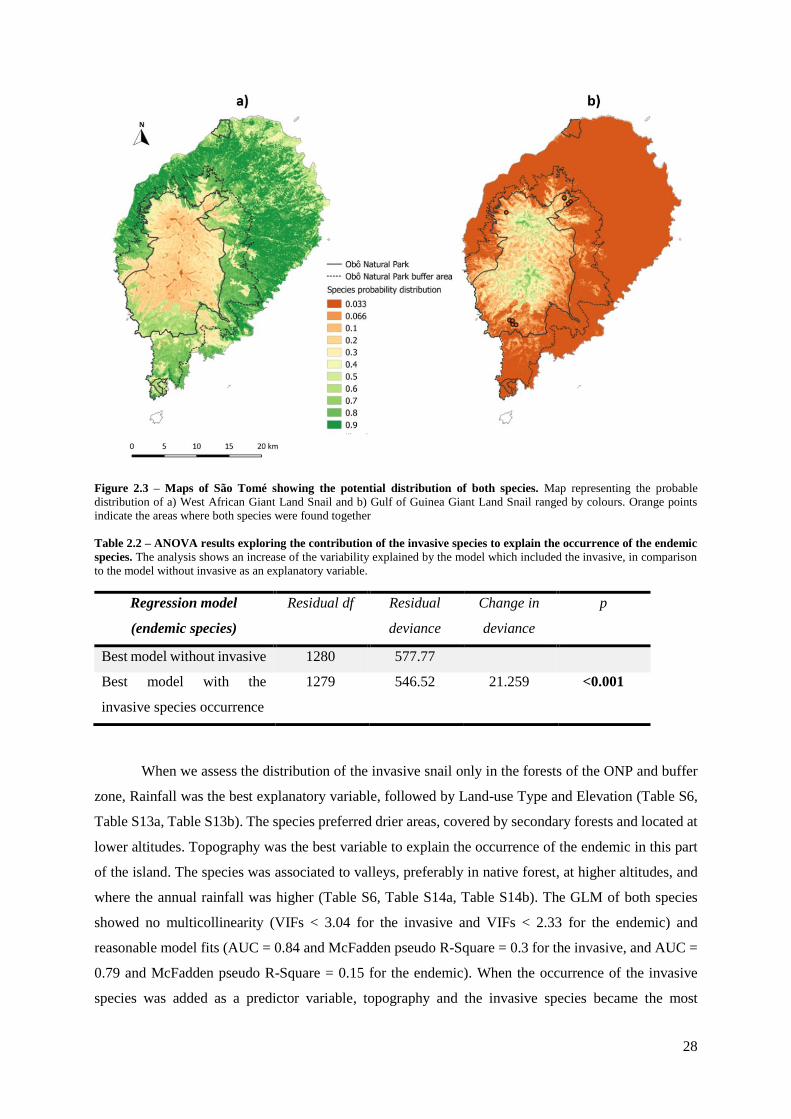
28
Figure 2.3 – Maps of São Tomé showing the potential distribution of both species. Map representing the probable
distribution of a) West African Giant Land Snail and b) Gulf of Guinea Giant Land Snail ranged by colours. Orange points
indicate the areas where both species were found together
Table 2.2 – ANOVA results exploring the contribution of the invasive species to explain the occurrence of the endemic
species. The analysis shows an increase of the variability explained by the model which included the invasive, in comparison
to the model without invasive as an explanatory variable.
Regression model
(endemic species)
Residual df Residual
deviance
Change in
deviance
p
Best model without invasive 1280 577.77
Best model with the
invasive species occurrence
1279 546.52 21.259 <0.001
When we assess the distribution of the invasive snail only in the forests of the ONP and buffer
zone, Rainfall was the best explanatory variable, followed by Land-use Type and Elevation (Table S6,
Table S13a, Table S13b). The species preferred drier areas, covered by secondary forests and located at
lower altitudes. Topography was the best variable to explain the occurrence of the endemic in this part
of the island. The species was associated to valleys, preferably in native forest, at higher altitudes, and
where the annual rainfall was higher (Table S6, Table S14a, Table S14b). The GLM of both species
showed no multicollinearity (VIFs < 3.04 for the invasive and VIFs < 2.33 for the endemic) and
reasonable model fits (AUC = 0.84 and McFadden pseudo R-Square = 0.3 for the invasive, and AUC =
0.79 and McFadden pseudo R-Square = 0.15 for the endemic). When the occurrence of the invasive
species was added as a predictor variable, topography and the invasive species became the most
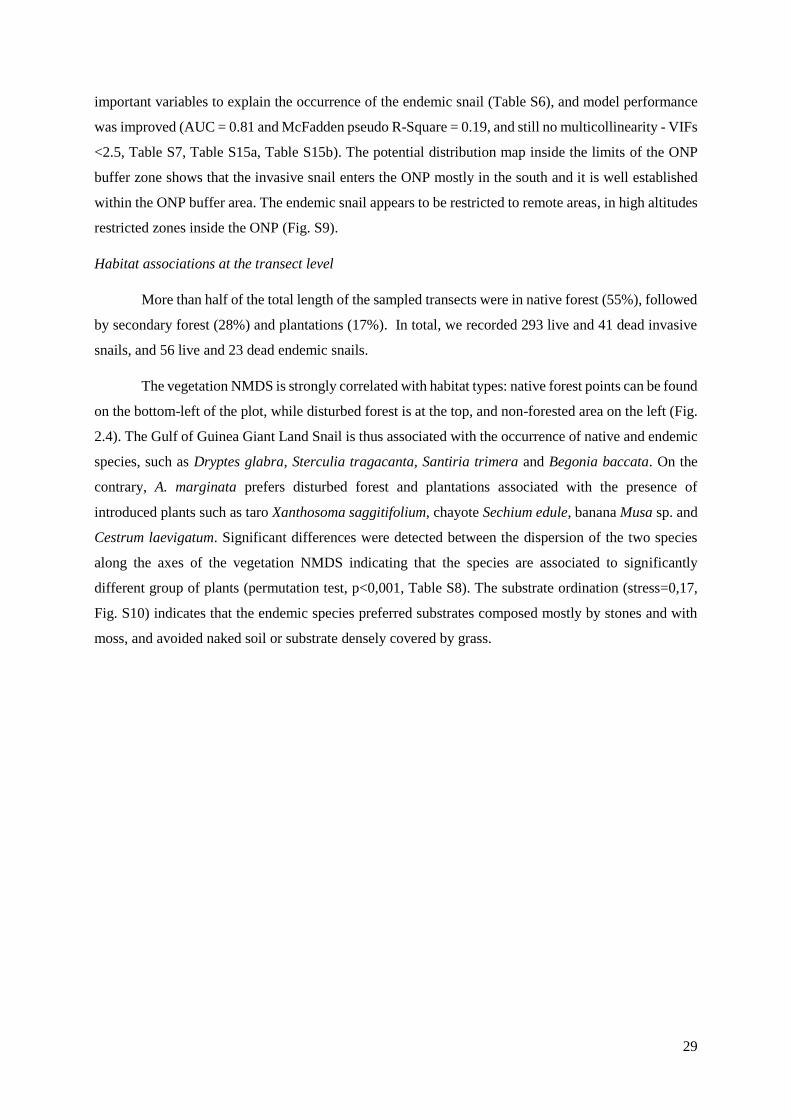
29
important variables to explain the occurrence of the endemic snail (Table S6), and model performance
was improved (AUC = 0.81 and McFadden pseudo R-Square = 0.19, and still no multicollinearity - VIFs
<2.5, Table S7, Table S15a, Table S15b). The potential distribution map inside the limits of the ONP
buffer zone shows that the invasive snail enters the ONP mostly in the south and it is well established
within the ONP buffer area. The endemic snail appears to be restricted to remote areas, in high altitudes
restricted zones inside the ONP (Fig. S9).
Habitat associations at the transect level
More than half of the total length of the sampled transects were in native forest (55%), followed
by secondary forest (28%) and plantations (17%). In total, we recorded 293 live and 41 dead invasive
snails, and 56 live and 23 dead endemic snails.
The vegetation NMDS is strongly correlated with habitat types: native forest points can be found
on the bottom-left of the plot, while disturbed forest is at the top, and non-forested area on the left (Fig.
2.4). The Gulf of Guinea Giant Land Snail is thus associated with the occurrence of native and endemic
species, such as Dryptes glabra, Sterculia tragacanta, Santiria trimera and Begonia baccata. On the
contrary, A. marginata prefers disturbed forest and plantations associated with the presence of
introduced plants such as taro Xanthosoma saggitifolium, chayote Sechium edule, banana Musa sp. and
Cestrum laevigatum. Significant differences were detected between the dispersion of the two species
along the axes of the vegetation NMDS indicating that the species are associated to significantly
different group of plants (permutation test, p<0,001, Table S8). The substrate ordination (stress=0,17,
Fig. S10) indicates that the endemic species preferred substrates composed mostly by stones and with
moss, and avoided naked soil or substrate densely covered by grass.
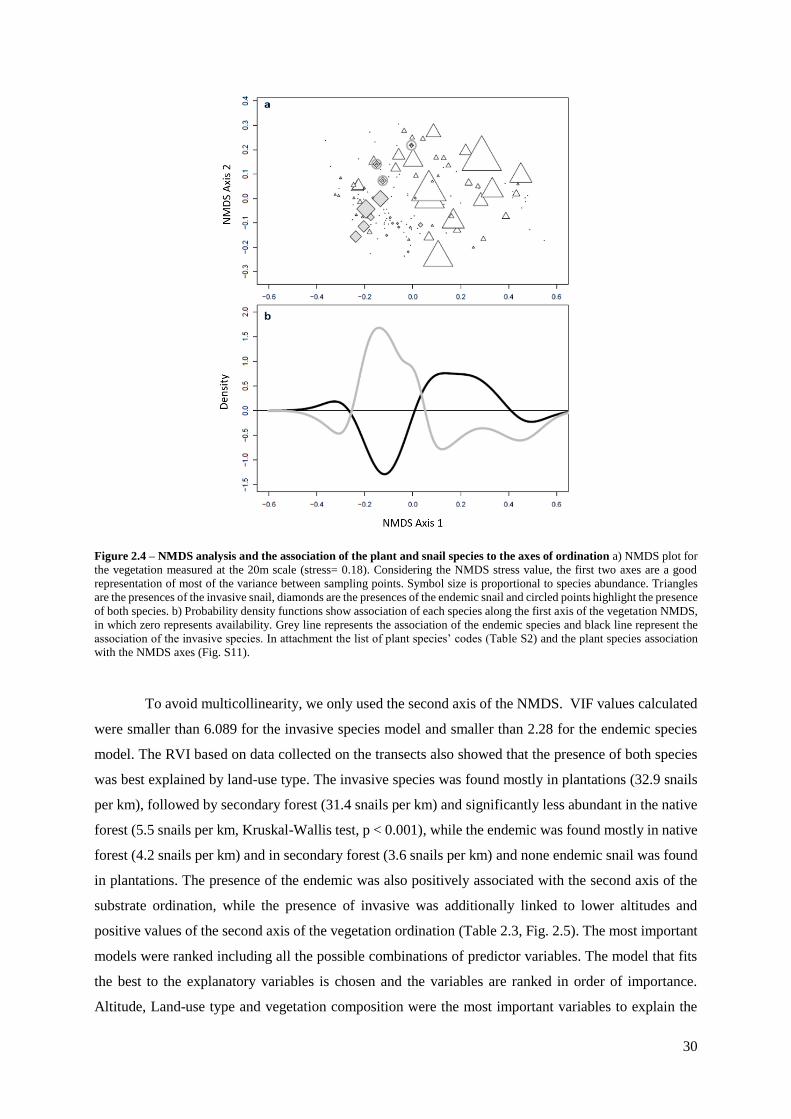
30
Figure 2.4 – NMDS analysis and the association of the plant and snail species to the axes of ordination a) NMDS plot for
the vegetation measured at the 20m scale (stress= 0.18). Considering the NMDS stress value, the first two axes are a good
representation of most of the variance between sampling points. Symbol size is proportional to species abundance. Triangles
are the presences of the invasive snail, diamonds are the presences of the endemic snail and circled points highlight the presence
of both species. b) Probability density functions show association of each species along the first axis of the vegetation NMDS,
in which zero represents availability. Grey line represents the association of the endemic species and black line represent the
association of the invasive species. In attachment the list of plant species’ codes (Table S2) and the plant species association
with the NMDS axes (Fig. S11).
To avoid multicollinearity, we only used the second axis of the NMDS. VIF values calculated
were smaller than 6.089 for the invasive species model and smaller than 2.28 for the endemic species
model. The RVI based on data collected on the transects also showed that the presence of both species
was best explained by land-use type. The invasive species was found mostly in plantations (32.9 snails
per km), followed by secondary forest (31.4 snails per km) and significantly less abundant in the native
forest (5.5 snails per km, Kruskal-Wallis test, p < 0.001), while the endemic was found mostly in native
forest (4.2 snails per km) and in secondary forest (3.6 snails per km) and none endemic snail was found
in plantations. The presence of the endemic was also positively associated with the second axis of the
substrate ordination, while the presence of invasive was additionally linked to lower altitudes and
positive values of the second axis of the vegetation ordination (Table 2.3, Fig. 2.5). The most important
models were ranked including all the possible combinations of predictor variables. The model that fits
the best to the explanatory variables is chosen and the variables are ranked in order of importance.
Altitude, Land-use type and vegetation composition were the most important variables to explain the
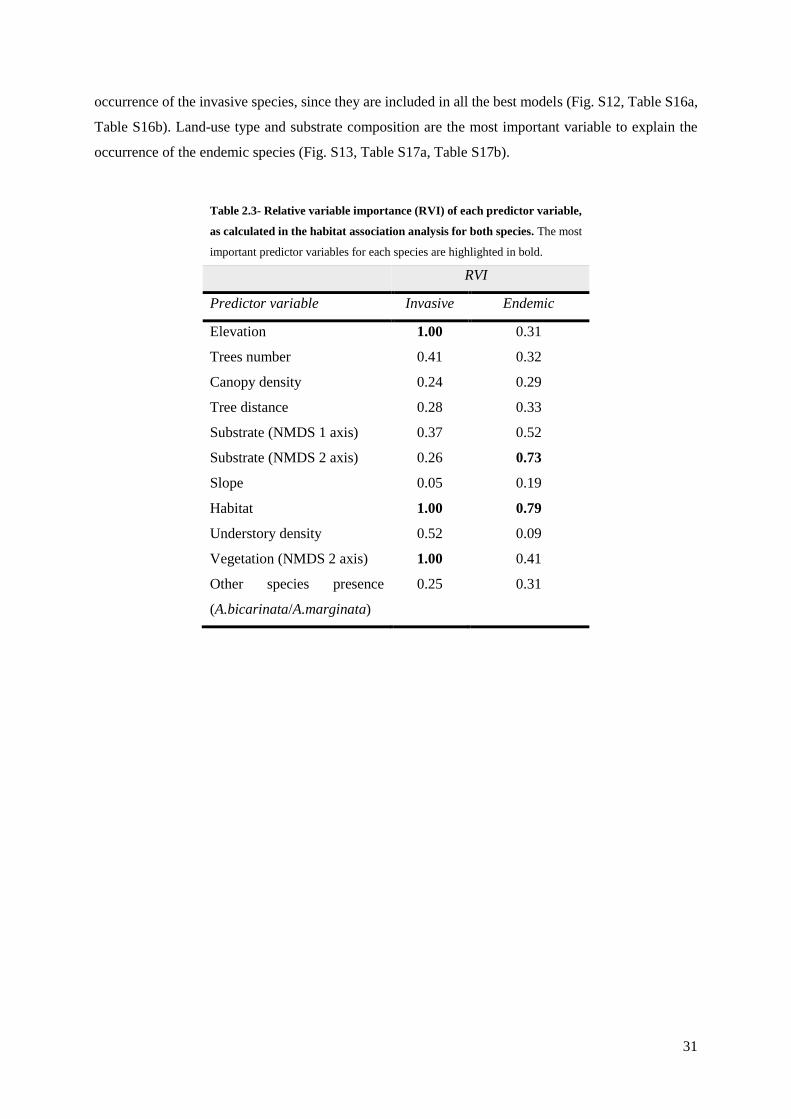
31
occurrence of the invasive species, since they are included in all the best models (Fig. S12, Table S16a,
Table S16b). Land-use type and substrate composition are the most important variable to explain the
occurrence of the endemic species (Fig. S13, Table S17a, Table S17b).
Table 2.3- Relative variable importance (RVI) of each predictor variable,
as calculated in the habitat association analysis for both species. The most
important predictor variables for each species are highlighted in bold.
RVI
Predictor variable Invasive Endemic
Elevation 1.00 0.31
Trees number 0.41 0.32
Canopy density 0.24 0.29
Tree distance 0.28 0.33
Substrate (NMDS 1 axis) 0.37 0.52
Substrate (NMDS 2 axis) 0.26 0.73
Slope 0.05 0.19
Habitat 1.00 0.79
Understory density 0.52 0.09
Vegetation (NMDS 2 axis) 1.00 0.41
Other species presence
(A.bicarinata/A.marginata)
0.25 0.31
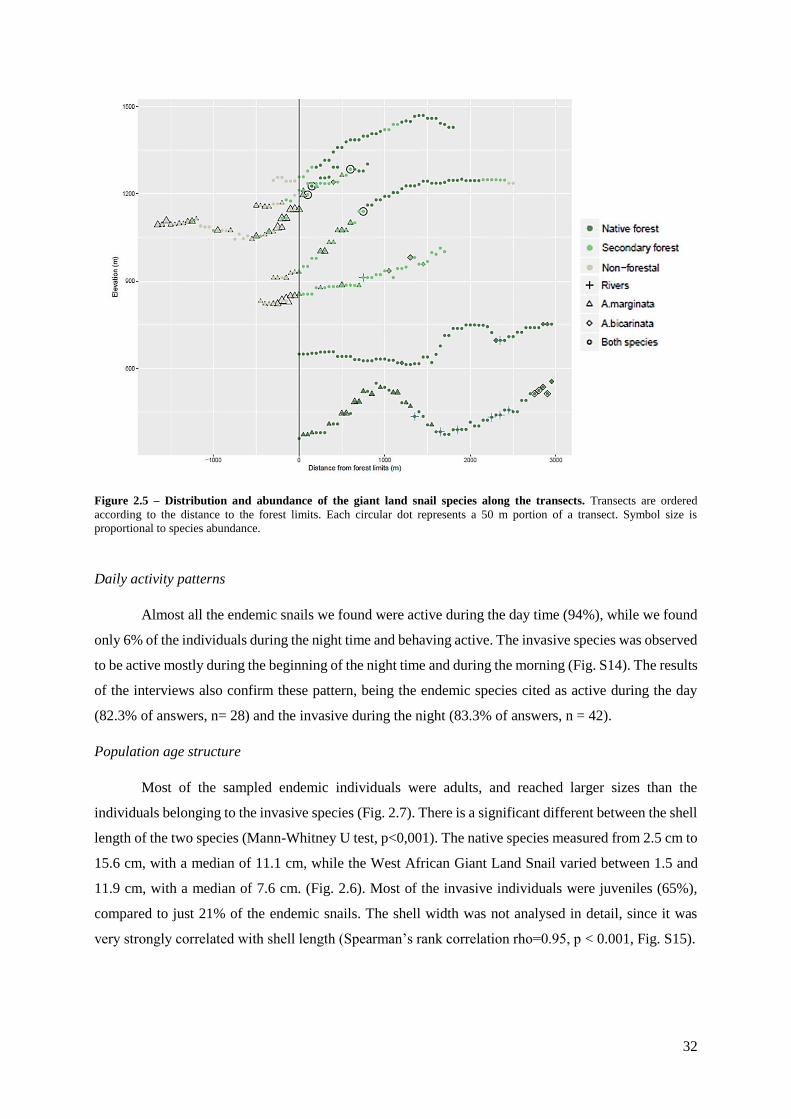
32
Figure 2.5 – Distribution and abundance of the giant land snail species along the transects. Transects are ordered
according to the distance to the forest limits. Each circular dot represents a 50 m portion of a transect. Symbol size is
proportional to species abundance.
Daily activity patterns
Almost all the endemic snails we found were active during the day time (94%), while we found
only 6% of the individuals during the night time and behaving active. The invasive species was observed
to be active mostly during the beginning of the night time and during the morning (Fig. S14). The results
of the interviews also confirm these pattern, being the endemic species cited as active during the day
(82.3% of answers, n= 28) and the invasive during the night (83.3% of answers, n = 42).
Population age structure
Most of the sampled endemic individuals were adults, and reached larger sizes than the
individuals belonging to the invasive species (Fig. 2.7). There is a significant different between the shell
length of the two species (Mann-Whitney U test, p<0,001). The native species measured from 2.5 cm to
15.6 cm, with a median of 11.1 cm, while the West African Giant Land Snail varied between 1.5 and
11.9 cm, with a median of 7.6 cm. (Fig. 2.6). Most of the invasive individuals were juveniles (65%),
compared to just 21% of the endemic snails. The shell width was not analysed in detail, since it was
very strongly correlated with shell length (Spearman’s rank correlation rho=0.95, p < 0.001, Fig. S15).
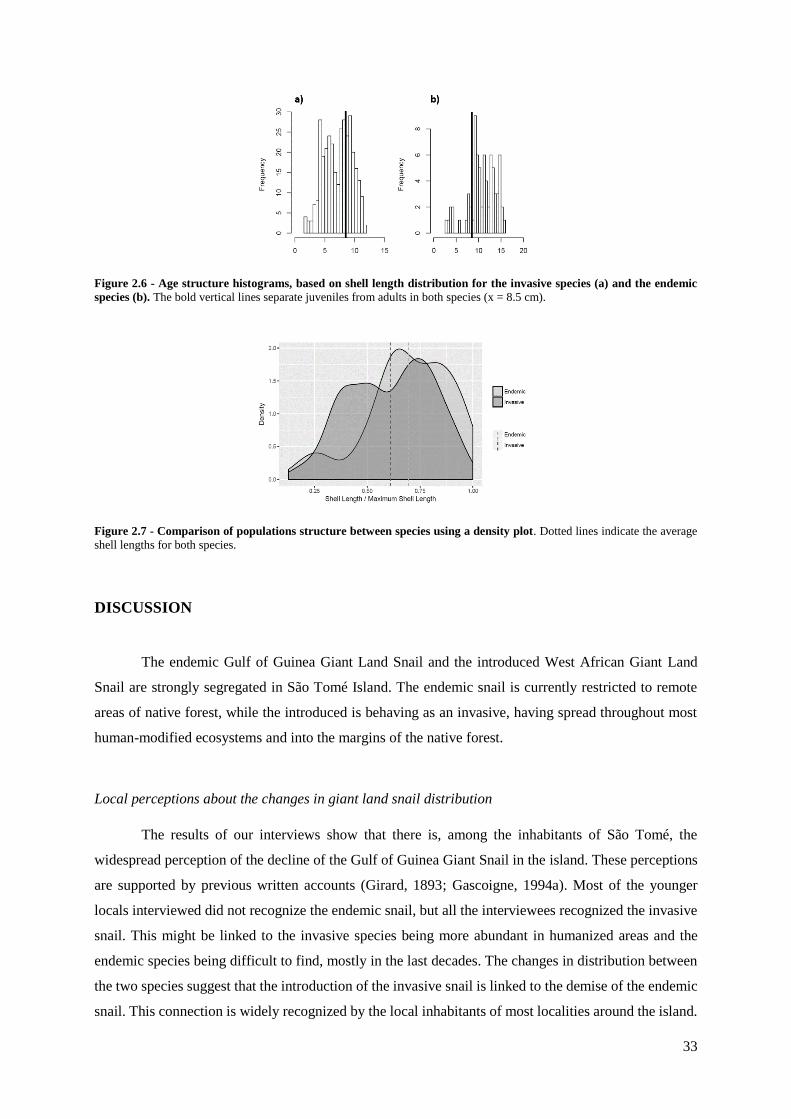
33
Figure 2.6 - Age structure histograms, based on shell length distribution for the invasive species (a) and the endemic
species (b). The bold vertical lines separate juveniles from adults in both species (x = 8.5 cm).
Figure 2.7 - Comparison of populations structure between species using a density plot. Dotted lines indicate the average
shell lengths for both species.
DISCUSSION
The endemic Gulf of Guinea Giant Land Snail and the introduced West African Giant Land
Snail are strongly segregated in São Tomé Island. The endemic snail is currently restricted to remote
areas of native forest, while the introduced is behaving as an invasive, having spread throughout most
human-modified ecosystems and into the margins of the native forest.
Local perceptions about the changes in giant land snail distribution
The results of our interviews show that there is, among the inhabitants of São Tomé, the
widespread perception of the decline of the Gulf of Guinea Giant Snail in the island. These perceptions
are supported by previous written accounts (Girard, 1893; Gascoigne, 1994a). Most of the younger
locals interviewed did not recognize the endemic snail, but all the interviewees recognized the invasive
snail. This might be linked to the invasive species being more abundant in humanized areas and the
endemic species being difficult to find, mostly in the last decades. The changes in distribution between
the two species suggest that the introduction of the invasive snail is linked to the demise of the endemic
snail. This connection is widely recognized by the local inhabitants of most localities around the island.
34
However, in the south, this pattern is not so clear and local inhabitants refer overharvest, habitat
destruction or diseases as the main causes for the regression of the endemic snail. It is possible that in
the south, the land-use conversion to coffee and cocoa cultivation, or to more recently oil palm
monocultures, had a strong impact on the population of the endemic species before the introduction of
the invasive species (Gascoigne 1994b).
Interviewees consistently described that the West African Giant Land Snail had been voluntarily
introduced in many localities, facilitating its spread. The species is now an important source of protein
for the local population, being much more consumed than the endemic. However, the endemic is the
preferred species for consumption, having also an important cultural value as, unlike the introduced, it
is used in traditional medicine.
Species distribution modelling
Even though we sampled most of the island, the rarity of the endemic species associated with
the remoteness of the locations where it persists, made it difficult to identify important environmental
determinants of its distribution. We found this species in just 148 out of the 1848 overall sampling sites,
a clear indication that it has become very rare and that it has a severely restricted distribution.
Land-use type and rainfall were the most important variables to explain the distribution of both
species at island-scale. The invasive species is associated to drier lowlands and more degraded
ecosystems, while the endemic is restricted to native rainforest in remote areas. The West African Giant
Land Snail can inhabit from savannah to forested areas in the mainland, but its abundance is influenced
by favourable humid conditions (Osemeobo, 1992; Idohou et al., 2013). In São Tomé, the snail spread
in a variety of habitats, but its occurrence in native forest is still limited, since human-modified habitat
might better fit their food preferences (Imevbore, 1993, Panisi, 2017). This species widely spread inside
the buffer zone. However, its entrance inside the ONP appears to be restricted in the north, where it is
probably difficulted due to higher altitudes. On the contrary, the endemic species clearly avoids human-
modified landscapes, occurring in remoted areas at higher altitudes, probably limited to specific
restricted valleys. A similar result has been described for the endemic species population in Príncipe
Island (Dallimer and Melo, 2010).
When we included the occurrence of the invasive species as a predictor to model the distribution
of the native species, this became the most important variable at island-wide scale and the second most
important at the buffer zone scale. In fact, the species are strongly spatially segregated, with the invasive
appearing just barely until the limits of the distribution of the endemic species, in native forest. Congener
species frequently have parapatric distribution characterized by very narrow contact zones, which
suggests that a competitive relationship may be occurring (Mooney and Cleland, 2001; Anderson et al.,
2002). The displacement of the native species can occur because the introduced species uses the
available food resources more efficiently (Byers, 2000). Thus, the West African Giant Snail might have
35
benefited from the anthropogenic habitat modification providing resources that confer it a competitive
advantage over the endemic. The few contact zones that we identified were located at the limits of the
native forest, both in montane secondary forest in the north and in lowland native rainforest in the south.
The extremely limited number of sympatric locations (sampling points = 10) and their wide
environmental variability made it impossible to identify the key determinants for the simultaneous
occurrence of both species.
Habitat associations at the transect level
The vegetation analyses revealed that the two species are associated to totally different groups
of plant species, which relate to the gradient of forest degradation. The invasive snail is associated to
introduced plants, such as taro, chayote and banana, while the endemic snail is associated to native
plants, some of which are endemic. At the local scale, as observed at island-scale, a few sympatric areas
were recorded, corresponding to the edge between native and secondary forest. However, the scarce
records (three sampling points) do not allow to define patterns in the vegetation composition for the
areas of sympatry.
The substrate analysis revealed that the endemic species is associated to rock outcrops and
mossy substrates. Rocky substrates are likely to be preferred by endemic giant land snails due to
favourable microclimatic conditions and to the security that rock crevices provide against pests and
predators (Osemeobo, 1992). In São Tomé this type of habitat is often found in the proximity of streams,
creating moist conditions and an environment suitable for rich and abundant land snails’ assemblages
(Martin and Sommer, 2004).
Elevation was an important factor explaining the island-wide distribution of both species, but at
the local scale it was only important to explain the occurrence of the invasive, confirming its preference
for lowlands. The endemic species was found both in the wettest lowland forests of the south and in the
montane forests of the north.
Despite the lack of statistical significance in the correlation between the two species at local
scale, they are almost totally segregated in space, sometimes separated by natural barriers such as
streams. The contact areas were limited to higher elevations, above which none of the species occurred.
Probably environmental conditions, such as lower temperatures and montane vegetation composition,
do not favour the occurrence of either species.
Finally, the difference between the number of dead individuals for the two species is remarkable
(14% of the invasive snails found were dead, in comparison to 41% of the endemic). We include the
probable occurrence of a disease among the factor responsible for the decline of the endemic population,
maybe spread by the invasive as previously cited (Gascoigne 1994).

36
Daily activity patterns
We observed an unusual activity pattern for the Gulf of Guinea Giant Snail, which was active
mainly during day time. The giant African land snails are usually nocturnal (Raut and Barker, 2002).
Daily activity of terrestrial snails is normally related to acceptable combinations of high humidity, low
temperature conditions and food availability (Cook, 2001). This exception might be linked to a high
availability of food and to favourable temperature and humidity conditions inside the native forest.
Another nocturnal animal, the bat Hipposideros ruber, was also found to be active during daylight in
São Tomé, a behaviour mostly associated to reduced predation risk during the light hours (Russo et al.,
2011). A similar explanation may apply to the daily activity of the Gulf of Guinea Giant Land Snail, but
data on its predators is insufficient to evaluate this hypothesis. Most of the endemic snails we found
were active, but a large proportion of the invasive was inactive. When inactive, snails normally hide in
refuges, and during adulthood settle for a specific refuge. Nevertheless, in large densities they may rest
in exposed sites due to the scarcity of available hiding spots (Raut and Barker, 2002). This suggests that
during sampling the invasive may have been more visible while inactive, because it occurs at larger
densities.
Population age structure
The invasive species has a large proportion of juveniles, while the Gulf of Guinea Giant Snail
had very few young individuals. The larger size of the endemic may indicate that it takes longer to reach
sexual maturity. In various animal taxa, island lineages tend to lay larger eggs, in smaller numbers. Such
island syndromes have been associated to decreased predation pressure and environmental factors, such
as temperature and humidity (Chiba and Cowie, 2016). The endemic species lays fewer but bigger eggs
than the West African Giant Land Snail (Pers. Observ.). Such a reproduction strategy may have
increased fitness in the environment with little competition in which the endemic presumably evolved,
but may now be a disadvantage for the competition with the exotic species.
Is the West African Giant Land Snail displacing the Gulf of Guinea Giant Land Snail?
This study provides several lines of evidence that suggest that there is interspecific competition
between the two giant land snail species occurring in São Tomé. However, the specific dynamics of
their interaction are not totally understood, and further research is needed, namely regarding sympatric
areas.
Nowadays, the introduced giant snail is widespread and extremely abundant in plantations. This
is probably due to its high reproductive rate, together with multiple voluntary introductions across the
island and with its preference for human-modified habitats. Its increase in degraded environments may
have been the main driver for retraction of the endemic snail, which has become restricted to the most
37
remote patches of native forest. Very few studies have focused on the interactions between species of
terrestrial molluscs (Miranda and Pecora, 2017). However, there is evidence that interference among
terrestrial snails may be mediated through aggressive behaviour or through the production of mucus that
inhibits the growth and behaviour of other conspecifics or other closely related species from the same
genera, and may result in exclusion from food and home sites when the latest are scarce (Cameron and
Carter 1979; Cook, 2001).
The exact mechanisms underlying interspecific competition are difficult to fully understand and
most likely are a combination of interconnected causes (Gutiérrez et al., 2014, Chiba and Cowie, 2016).
In São Tomé, a combination of several factors may have been responsible for the observed decline of
the native giant snail, in which the introduction and spread of the invasive congener might have been
the final triggering factor for the accelerated contraction in recent times. However, habitat destruction,
overharvesting, animal predation and diseases have almost surely also played an important role.
Some giant land snail species are restricted to native forests, rapidly disappearing or declining
in second-growth or plantations land-use changes (Raut and Barker, 2002). In São Tomé, habitat loss
was probably one of the first factor contributing to the decline of the native snail, even before the
introduction of the invasive West African Giant Land Snail, especially in the south of the island
(Gascoigne, 1994b). However, the native snail often appeared to be resilient to land-use changes, since
its distribution used to extend well outside the limits of the native forest and include some anthropogenic
ecosystems. In recent decades, habitat degradation seems to have facilitated the spread of the invasive
species (Panisi, 2017), which in turn has pushed the endemic towards the inaccessible native forest
patches where it persists.
The endemic snail has long been used as food and for traditional medicine (Girard 1893;
Gascoigne 1994b; Carvalho et al., 2015). Nonetheless, even if snail harvest is involved in its population
reduction, it is not likely that it is solely responsible for such a rapid decline. Since the endemic has
disappeared from the proximity of villages and the invasive has become very abundant, people started
feeding on the latter (Gascoigne 1994b). This does not mean that there is no longer pressure on the
endemic, since these are still purchased for medicinal purposes. In fact, anecdotical observations suggest
that the endemic snail has become much more valuable in the market, promoting harvest even in the
most remote locations.
Various species are suspected of predation on the native giant land snails, such as: feral pigs
(Sus scrofa), São Tomé thrush (Turdus olivaceofuscus), malacophagous flatworms and beetles
(Gascoigne, 1994b; Ogren, 1995; Krauss, 1964; Walker, 2003; Dallimer and Melo, 2010). However,
these are not likely to cause such a steep and widespread decline, namely because there is no indication
that their abundance has increased in both islands.
Finally, it is worth mentioning that during our survey we found, in a very remote and restricted
native forest location, near Cabumbé Peak, in the south of São Tomé, 22 freshly dead adult native snails.
We did not find evidence of the presence of the invasive snail in the surroundings. Such a mass mortality
38
may have been caused by a disease, which could have contributed to the decline of the species. It has
been suggested that such a disease could have been introduced in the island together with the West
African Giant Snail (Gascoigne, 1994a).
Conservation implications
The Gulf of Guinea Giant Land Snail is classified as “Vulnerable” since 1994, due to a suspected
population reduction during the previous ten years and to a reduced extent of its occurrence through a
decline in its area of occupancy, potential levels of exploitations and introduced taxa (criteria A1cde and
B1+2b, Clarke and Naggs, 1996; IUCN, 2017). Considering the result of our study and the severe decline
of the species on Príncipe Island (Dallimer and Melo, 2010), we suggest that this species might be better
qualified as “Endangered”, since it has an extent of occurrence estimated to be less than 5000 km2,
limited to two locations (São Tomé and Príncipe), where a continuous decline in its extent of occurrence,
area of occupancy, area and quality of habitat and number of subpopulations has been observed and
estimated (criterion B1 and B2ab (i, ii, iii, iv)).
The Gulf of Guinea Giant Land Snail has been suggested as an indicator to assess the
effectiveness of the protected areas for biodiversity conservation in São Tomé e Principe (Dallimer and
Melo, 2010). A great part of its distribution is within the limits of the protected ONP, but human
harvesting and the invasion of the West African Giant Land Snail penetrate these limits. The last remote
areas where the species occurs must be specifically preserved and conservation measures need to be
implemented. For example, the populations of both islands must be estimated and monitored, and
harvesting inside the native forest must be forbidden. Specific conservation efforts must focus on the
edge of the distribution of the species, where the invasive species also occurs. Also, there is still a lack
of knowledge critical for addressing the conservation of the species, such as its breeding ecology,
population genetic structure, and vulnerability to diseases. Finally, most locals recognize the decline of
this species and conservation efforts will be most effective if they involve the Santomean people. The
iconic Gulf of Guinea Giant Snail is the type species for the Archachatina genus, and we cannot risk
that it becomes solely another legendary island giant. Conservation action is urgently needed, and this
study contributes toward its safeguard.

39
FINAL CONSIDERATIONS
This study has shown how human activities may have multiple cascading effects on ecosystems
and on native biodiversity. Land-use changes and the introduction of plant species lead to deep habitat
modifications, reflected in distinct vegetation and substrate composition, and associated climatic
variations (Peterson et al., 1998; Dukes and Mooney, 2004). Non-native species subsequently
introduced in these habitats, may be less constrained by these environmental changes than native species
and, thus, successfully spread throughout human-modified habitats (MacDougall and Turkington,
2005).
The first chapter concludes that habitat disturbance may be a main factor involved in the success
of an invasion. The introduction of the West African Giant Land Snail in São Tomé Island resulted in
its wide dispersal across modified ecosystems in less than half a century, only marginally occupying
native forest located inside the ONP. Future studies should evaluate how much human disturbance
promotes invasion suitability.
The second chapter shows how a combination of direct and indirect anthropogenic factors
determined the rapid decline of the native Gulf of Guinea Giant Land Snail, which is currently restricted
to remote areas of native forest. Namely, it provides multiple lines of evidence suggesting that the
invasive giant snail is displacing the endemic, highlighting strong temporal and spatial segregations
between these species and relating the historical changes in the two species’ distributions.
The dynamics between an introduced and an endemic species described in this thesis may be
interpreted in the light of taxon cycling. Taxon cycles are phases of expansion and contraction of species,
associated with shifts in distribution and that can be framed within the theory of island biogeography
(Wilson, 1959). Expanding widespread taxa, often originating from continental sources, first occupy
marginal, lowland habitats at the edges of islands, while contracting native taxa exhibit reduced or
fragmented ranges occupying interior and montane, forested habitats. Shifts between expanding and
contracting phases are accompanied by complementary habitat shifts, until the recent arrival fully
replaces the native species, thus balancing the number of species occurring in the island as a whole
(Ricklefs and Bermingham, 2002). The current situation of giant snail species in São Tomé present
strong analogies to what is described in taxon cycle. The speed at which the changes have occurred in
this specific case, raises further concern about the persistence of the endemic species, since taxon cycling
culminates with the extinction of the native species.
As an island, São Tomé economy is particularly reliant on imports, and intense trade is often
associated to biological invasions (Hulme, 2009). Human population density is increasing fast, as well
as the extent of both urbanized and agricultural land cover. The rare endemic species are thus likely to
be facing growing pressures in the nearby future, as the quality of the remaining forest will continue to
40
be negatively affected by introduced organisms and direct anthropogenic ecosystem degradation
(Dallimer et al., 2009; Vásquez et et al, 2017).
This study provides an important overview of the current situation regarding São Tomé giant
snail species, assessing vulnerability to invasion and subsequent interspecific interactions, linked to the
direct impact of human activities. Considering that resources available for conservation are limited and
the importance of the invasive species to feed the human population in the island, we suggest that future
research and conservation actions focus in the ONP. The best way to maintain native biodiversity is to
reduce the spread of invasives inside the protected area, where most of the endemic and threatened
species occur. Therefore, it is also key to focus research on the factors that explain the distribution of
the introduced snail inside the Park. At the same time, local communities need to be made aware of the
extraordinary malacofauna of the island, and the Gulf of Guinea Giant Land Snail can be used as a flag
species to engage them in its protection.

41
REFERENCES
(Following the citation rules of Biological Conservation)
Adeola, M.O., 1992. Importance of wild animals and their parts in the culture, religious festivals, and traditional
medicine, of Nigeria. Environmental Conservation. 19, 125-134.
Agongnikpo, E., Karamoko, M., Otchoumou, A., 2010. Diet of the giant African land snail Archachatina
marginata Swainson 1821, in Ivory Coast: preferences and estimate of damages. Revue d' Écologie. 4, 319-330.
Anderson, A., 2009. The rat and the octopus: Initial human colonization and the prehistoric introduction of
domestic animals to Remote Oceania. Biological Invasions. 11, 1503–1519.
Anderson, R.P., Peterson, A.T., Gómez‐Laverde, M., 2002. Using niche‐based GIS modelling to test geographic
predictions of competitive exclusion and competitive release in South American pocket mice. Oikos. 98, 3-16.
Babalola, O.O., Akinsoyinu, A.O., 2009. Proximate composition and mineral profile of snail meat from different
breeds of land snail in Nigeria. Pakistan Journal of Nutrition. 8, 1842-1844.
Barton K., 2016. MuMIn: Multi-model inference. R package version 1.15.6. https://cran.r-
project.org/web/packages/MuMIn/MuMIn.pdf/ (accessed 27 September 2017).
Byers, J. E., 2000. Competition between two estuarine snails: implications for invasions of exotic
species. Ecology. 81, 1225-1239.
Bredero, J.T., Heemskerk, W., Toxopeus, H., 1977. Agriculture and livestock production in São Tomé and Príncipe
(West Africa). Foundation for Agricultural Plant Breeding. Monograph.
Briggs, J.C., 2015. Species extinction: Frequency and biogeography. Environmental Sceptics and Critics. 4, 96.
Brook, B.W., Sodhi, N.S. and Bradshaw, C.J., 2008. Synergies among extinction drivers under global change.
Trends in ecology & evolution. 23, 453-460.
Burnham, K.P., Anderson, D.R., 2002. Model selection and multimodel inference: a practical information-
theoretic approach, Springer Science & Business Media, second ed. Springer, Verlag.
Cameron RAD, Carter MA., 1979. Intra- and interspecific effects of population density on growth and activity in
some helicid land snails (Gastropoda: Pulmonata). J Anim Ecol. 48, 237–246.

42
Cameron, R.A., Triantis, K.A., Parent, C.E., Guilhaumon, F., Alonso, M.R., Ibánez, M., Frias Martins, A.M.,
Ladle, R.J., Whittaker, R.J., 2013. Snails on oceanic islands: testing the general dynamic model of oceanic island
biogeography using linear mixed effect models. Journal of Biogeography. 40, 117-130.
Carvalho, M., Rego, F., Palmeirim, J.M., Fa, J.E., 2015. Wild meat consumption on São Tomé Island, West Africa:
implications for conservation and local livelihoods. Ecology and Society. 20, 27.
CBD (Convention on Biological Diversity), 2015. National Biodiversity Strategy and Action Plan 2015-2020
(NBSAP II). São Tomé e Príncipe. https://www.cbd.int/doc/world/st/st-nbsap-v2-en.pdf/ (accessed 08 October
2017).
Ceballos, G., Ehrlich, P.R., Barnosky, A.D., García, A., Pringle, R.M., Palmer, T.M., 2015. Accelerated modern
human–induced species losses: Entering the sixth mass extinction. Science advances. 1.
Chechina, M., Hamann, A., 2015. Choosing species for reforestation in diverse forest communities: social
preference versus ecological suitability. Ecosphere. 6, 1-13.
Chiba, S., Cowie, R.H., 2016. Evolution and extinction of land snails on oceanic islands. Annual Review of
Ecology, Evolution, and Systematics. 47, 123-141.
Chiba S., Roy K. 2011. Selectivity of terrestrial gastropod extinctions on an oceanic archipelago and insights into
the anthropogenic extinction process. PNAS. 108, 9496–501.
CIA, 2017. “São Tomé and Príncipe in CIA World Factbook”. https://www.cia.gov/library/publications/the-world-
factbook/geos/tp.html/ (accessed 19 October 2017).
Clark J.A., May R.M., 2002. Taxonomic bias in conservation research. Science. 297, 191–192.
Clarke, D. & Naggs, F. 1996. Archachatina bicarinata. The IUCN Red List of Threatened Species,1996.
http://dx.doi.org/10.2305/IUCN.UK.1996.RLTS.T2039A9194771.en/ (accessed 20 October 2017).
Colautti, R.I., Grigorovich, I.A., MacIsaac, H.J., 2006. Propagule pressure: a null model for biological invasions.
Biological Invasions. 8, 1023-1037.
Cook A. 2001. Behavioural ecology: On doing the right thing, in the right place at the right time. Baker GM, editor.
The biology of terrestrial molluscs. CAB International. 1st ed. New York. 447–488.
Cowie, R.H., 2001. Decline and homogenization of Pacific faunas: the land snails of American Samoa. Biological
Conservation. 99, 207-222.
43
Craze, P. G., Mauremootoo J., R., 2002. A test of methods for estimating population size of the invasive land snail
Achatina fulica in dense vegetation. Journal of applied ecology. 39, 653-660.
Dallimer, M., King, T., Atkinson, R.J., 2009. Pervasive threats within a protected area: conserving the endemic
birds of São Tomé, West Africa. Animal Conservation. 12, 209-219.
Dallimer, M. and Melo, M., 2010. Rapid decline of the endemic giant land snail Archachatina bicarinata on the
island of Príncipe, Gulf of Guinea. Oryx. 44, 213-218.
Dedov, I., Penev, L. 2004. Spatial variation in terrestrial gastropod communities (Gastropoda, Pulmonata) along
urban-rural gradients in Sofia City, Bulgaria. Ecology of the city of Sofia: species and communities in an urban
environment. Pensoft, Sofia. 307-318.
Didham, R.K., Tylianakis, J.M., Gemmell, N.J., Rand, T.A., Ewers, R.M., 2007. Interactive effects of habitat
modification and species invasion on native species decline. Trends in ecology & evolution. 22, 489-496.
Diniz, M. A., R. Fernandes, E. S. Martins, I. Moreira, J. Paiva. 2002. Carta de zonagem agro-ecológica e da
vegetacão de São Tomé e Príncipe. Garc. Orta. 15, 1–72.
Direção Geral do Ambiente. 2006. Lei do Parque Natural do Obô (Lei n.6/2006). Ministério dos Recursos Naturais
e Ambiente, São Tomé e Príncipe.
Dirzo, R., Young, H.S., Galetti, M., Ceballos, G., Isaac, N.J. Collen, B., 2014. Defaunation in the Anthropocene.
Science. 345, 401-406.
Dukes, J.S., Mooney, H.A., 2004. Disruption of ecosystem processes in western North America by invasive
species. Revista Chilena de Historia Natural. 77,411-437.
Figueiredo, E., Paiva, J., Stevart, T., Oliveira, F., Smith, G.F., 2011. Annotated catalogue of the flowering plants
of São Tomé and Príncipe. Bothalia, 41.
Gascoigne, A., 1994a. The biogeography of land snails in the islands of the Gulf of Guinea. Biodiversity &
Conservation. 3, pp.794-807.
Gascoigne, A., 1994b. The dispersal of terrestrial gastropod species in the Gulf of Guinea. Journal of Conchology.
35, 1-7.
Gillespie, R.G., 2007. Oceanic islands: models of diversity. Encyclopaedia of biodiversity. 1-13.
44
Girard, A.A., 1893. Revision de la faune malacologique des îles St. Thomé et du Prince. Jorn. Sci. math., phys.
nat. 2, 198-208.
Griffiths, O., Cook, A., Wells, S.M., 1993. The diet of the introduced carnivorous snail Euglandina rosea in
Mauritius and its implications for threatened island gastropod faunas. Journal of Zoology. 229, 79-89.
Gutiérrez, J.L., Jones, C.G., Sousa, R., 2014. Toward an integrated ecosystem perspective of invasive species
impacts. Acta ecologica. 54, 131-138.
Hodasi, J.K.M., 1984. Some observations on the edible giant land snails of West Africa. World Animal Review.
52, 24-28.
Hofman, C.A., Rick, T.C., 2017. Ancient Biological Invasions and Island Ecosystems: Tracking Translocations of
Wild Plants and Animals. Journal of Archaeological Research. 1-51.
Horsák, M., Juřičková, L., Kintrová, K., Hájek, O., 2009. Patterns of land snail diversity over a gradient of habitat
degradation: a comparison of three Czech cities. Biodiversity and conservation. 18, 3453-3466.
Hulme, P.E., 2009. Trade, transport and trouble: managing invasive species pathways in an era of globalization.
Journal of applied ecology. 46, 10-18.
Idohou, R., Djagoun, C.A., Kassa, B., Assogbadjo, A.E. Codjia, J.T.C., 2013. Soil factors affecting density of
three giant land snail species in different habitats of Dassa-Zoumè district (Central Benin). QScience Connect, 31.
Imevbore, E.A., Ajayi, S.S., 1993. Food preference of the African giant snail (Archachatina marginata) in
Captivity. African Journal of Ecology. 31, 265-267.
IUCN, 2016. International Union for Conservation of Nature annual report 2016.
https://portals.iucn.org/library/sites/library/files/documents/2017-001-v.1-En.pdf/ (accessed 08 October 2017).
IUCN, 2017. The IUCN Red List of Threatened Species. Version 2017-2. http://www.iucnredlist.org/ (Accessed
14 September 2017).
Jackman S., Tahk A., Zeileis A., Maimone C., Fearon J., 2015. pscl: Political Science Computational Laboratory,
Stanford University. R package version 1.4.9. https://cran.r-project.org/web/packages/pscl/pscl.pdf/ (accessed 18
May 2017).
Jenness JS. 2007. Some Thoughts on Analyzing Topographic Habitat Characteristics. Jenness Enterprises,
Flagstaff, United States of America. http://www.jennessent.com/downloads/topographic_analysis_online.pdf/
(accessed 10 January 2016).

45
Jones PJ, Burlison JP, Tye A., 1991. Conservação dos ecossistemas florestais na República Democrática de São
Tomé e Príncipe. International Union for the Conservation of Nature and Natural Resources, Gland, Switzerland.
Jones, P.J., 1994. Biodiversity in the Gulf of Guinea: an overview. Biodiversity and conservation. 3, 772-784.
Krauss, N.L.H., 1964. Investigations on biological control of giant African (Achatina fulica) and other land
snails. Nautilus, 78.
Lake, P.S., O'Dowd, D.J., 1991. Red crabs in rain forest, Christmas Island: biotic resistance to invasion by an
exotic snail. Oikos. 25-29.
de Lima, R. F., Sampaio, H., Buchanan, G., 2013. Survey of critically endangered birds South of the São Tomé
Obô Natural Park. BirdLife International. Unpublished report, Cambridge, UK.
de Lima, R.F., Viegas, L., Solé, N., Soares, E., Dallimer, M., Atkinson, P.W., Barlow, J., 2014. Can management
improve the value of shade plantations for the endemic species of São Tomé Island?. Biotropica. 46, 238-247.
de Lima, R.F., Sampaio, H., Dunn, J.C., Cabinda, G., Fonseca, R., Oquiongo, G., Oquiongo, J., Samba, S., Santana,
A., Soares, E., Viegas, L., 2016. Distribution and habitat associations of the critically endangered bird species of
São Tomé Island (Gulf of Guinea). Bird Conservation International. 1-15.
Lydeard, C., Cowie, R.H., Ponder, W.F., Bogan, A.E., Bouchet, P., Clark, S.A. et al. (2004) The global decline of
non-marine mollusks. BioScience, 54, 321–330.
Lowe, S., Browne, M., Boudjelas, S., De Poorter, M., 2000. 100 of the world's worst invasive alien species: a
selection from the global invasive species database. Auckland: Invasive Species Specialist Group. 12.
MacDougall, A.S., Turkington, R., 2005. Are invasive species the drivers or passengers of change in degraded
ecosystems?. Ecology. 86, 42-55.
Martin, K., Sommer, M., 2004. Relationships between land snail assemblage patterns and soil properties in
temperate‐humid forest ecosystems. Journal of Biogeography. 31, 531-545.
Marvier, M., Kareiva, P., Neubert, M.G., 2004. Habitat destruction, fragmentation, and disturbance promote
invasion by habitat generalists in a multispecies metapopulation. Risk analysis. 24, 869-878.
McCullagh, P., Nelder, J.A., 1989. Generalized Linear Models, second ed. Chapman and Hall, London.
46
Meyer, N., W.M., Hayes, K.A., Meyer, A.L., 2008. Giant African snail, Achatina fulica, as a snail predator.
American Malacological Bulletin. 24, 117-119.
Minchin, P.R., 1987. An evaluation of the relative robustness of techniques for ecological ordination. In Theory
and models in vegetation science. Springer Netherlands. 89-107.
Miranda, M., Pecora, I., 2017. Conservation implications of behavioural interactions between the Giant African
Snail and a Native Brazilian species. Ethology Ecology & Evolution. 29, 209-217.
Myers, N., Mittermeier, R.A., Mittermeier, C.G., Da Fonseca, G.A., Kent, J., 2000. Biodiversity hotspots for
conservation priorities. Nature. 403, 853-858.
Moller, A.E., 1984. Achatina bicarinata. Annaes de Sciencias Naturaes. 1, 203.
Mooney, H.A., Cleland, E.E., 2001. The evolutionary impact of invasive species. Proceedings of the National
Academy of Sciences. 98, 5446-5451.
Nicolai, A. and Ansart, A., 2017. Conservation at a slow pace: terrestrial gastropods facing fast-changing climate.
Conservation Physiology. 5, 7.
Ogren, R.E., 1995. Predation behaviour of land planarians. Hydrobiologia. 305, 105-111.
Oke, C. O., Omoregie, C. E., 2008. Land snail species richness in a cocoa agro-forest in Ile-Oluji, Ondo State,
Nigeria. Zoologist (The), 10.
Oksanen J. 2015. Multivariate Analysis of Ecological Communities in R: vegan tutorial. R package version 2.3.0.
http://cc.oulu.fi/~jarioksa/opetus/metodi/vegantutor.pdf/ (accessed 18 April 2017).
Olden, J.D., Poff, N.L., Douglas, M.R., Douglas, M.E., Fausch, K.D., 2004. Ecological and evolutionary
consequences of biotic homogenization. Trends in ecology & evolution. 19, 18-24.
Orwig, D. A., 2002. Ecosystem to regional impacts of introduced pests and pathogens: historical context, questions
and issues. Journal of Biogeography. 29, 1471–1474.
Osemeobo, G.J., 1992. Effects of land-use and collection on the decline of African giant snails in Nigeria.
Environmental conservation. 19, 153-159.
Panisi, M., 2017. Biological invasion and the conservation of endemic island species: São Tomé Archachatina
giant land snails (Pulmonata: Achatinidae). Chapter 1: “Habitat degradation facilitates invasion: the giant West

47
African snail Archachatina marginata, in São Tomé Island (Gulf of Guinea)”. University of Lisbon, Faculty of
Science. Master Thesis Dissertation.
Peterson, G., Allen C.R., Holling, C.S., 1998. Ecological Resilience, Biodiversity, and Scale. Ecosystems. 1, 6–
18.
Plummer, J.M., 1975. Observations on the reproduction, growth and longevity of a laboratory colony of
Archachatina (Calachatina) marginata (Swainson) subspecies ovum. Journal of Molluscan Studies. 41, 395-413.
Quantum GIS Development Team, 2017. Quantum GIS Geographic Information System. Open Source Geospatial
Foundation Project. http://qgis.osgeo.org/ (accessed 20 December 2016).
R Core Team, 2017. R: A language and environment for statistical computing. R Foundation for Statistical
Computing, Vienna, Austria. https://www.R-project.org/ (accessed 04 April 2017).
Raut, S., Barker, G., 2002. Achatina fulica Bowdich and Other Achatinidae as Pests. Molluscs as crop pests. 55.
Ricklefs, R.E., Bermingham, E., 2002. The concept of the taxon cycle in biogeography. Global Ecology and
Biogeography. 11, 353-361.
Ros, M., Vázquez-Luis, M., Guerra-García, J.M., 2015. Environmental factors modulating the extent of impact in
coastal invasions: the case of a widespread invasive caprellid (Crustacea: Amphipoda) in the Iberian Peninsula.
Marine pollution bulletin. 98, 247-258.
Russo, D., Maglio, G., Rainho, A., Meyer, C.F., Palmeirim, J.M., 2011. Out of the dark: diurnal activity in the bat
Hipposideros ruber on São Tomé island (West Africa). Mammalian Biology-Zeitschrift für Säugetierkunde. 76,
701-708.
Sala, O.E., Chapin, F.S., Armesto, J.J., Berlow, E., Bloomfield, J., Dirzo, R., Huber-Sanwald, E., Huenneke, L.F.,
Jackson, R.B., Kinzig, A., Leemans, R., 2000. Global biodiversity scenarios for the year 2100. Science. 287, 1770-
1774.
Salgueiro, A., Carvalho, S., 2001. Proposta de Plano Nacional de Desenvolvimento Florestal 2003–2007. Ecofac,
Agreco and Cirad Foret, São Tomé.
Sax, D.F., Gaines, S.D., Brown, J.H., 2002. Species invasions exceed extinctions on islands worldwide: a
comparative study of plants and birds. The American Naturalist. 160, 766-783.
Sax, D.F., Gaines, S.D., 2008. Species invasions and extinction: the future of native biodiversity on islands.
Proceedings of the National Academy of Sciences. 105, 11490-11497.
48
Schilthuizen, M., Teräväinen, M. I. F., Tawit, N. F. K., Ibrahim, H., Chea, S. M., Chuan, C. P., Daim, L. J., Jubaidi,
A., Madjapuni, M. J., Sabeki, M., Mokhtar, A., 2002. Microsnails at microscales in Borneo: Distributions of
Prosobranchia versus Pulmonata. Journal of Molluscan Studies. 68-3, 255–258.
Silva, H.L.E., 1958. Esboço da carta de aptidão agrícola de São Tomé e Príncipe. Garcia de Orta. 6, 61-86 .
Soares, F., 2017. Modelling the distribution of São Tomé bird species: Ecological determinants and conservation
prioritization. Faculty of Science, Lisbon University. Master Thesis Dissertation.
Spatz, D. R., Zilliacus, K. M., Holmes, N. D., Butchart, S. H. M., Genovesi, P., Ceballos, G., Tershy, B. R., Croll,
D. A., 2017. Globally threatened vertebrates on islands with invasive species. Science Advances.
Tenreiro, F., 1961. A ilha de São Tomé. Junta de Investigações Científicas do Ultramar. Lisboa, Portugal.
Thiengo, S.C., Faraco, F.A., Salgado, N.C., Cowie, R.H., Fernandez, M.A., 2007. Rapid spread of an invasive
snail in South America: the giant African snail, Achatina fulica, in Brasil. Biological Invasions. 9, 693-702.
Tomiyama, 2000. Daily Dispersals from Resting Sites of the Giant African Snail, Achatina fulica (Ferussac)
(Pulmonata; Achatinidae), on a North Pacific Island. Tropics. 10, 243-249.
Vázquez, A.A., Sánchez, J., Martínez, E., Alba, A., 2017. Facilitated invasion of an overseas invader: human
mediated settlement and expansion of the giant African snail, Lissachatina fulica, in Cuba. Biological Invasions.
19, 1-4.
Vitousek, P. M., D'Antonio C. M., Loope, L. L., Rejmánek, M., Westbrooks R., 1997. Introduced species: A
significant component of human-caused global change. New Zealand Journal of Ecology 21, 1-16.
Walker, K.J., 2003. Recovery plans for Powelliphanta land snails. Threatened species recovery plan. 49, 208.
Wilson, E.O., 1959. Adaptive shift and dispersal in a tropical ant fauna. Evolution. 13, 122-144.
Robin X., Turck, N., Hainard, A., Tiberti, N., Lisacek, F., Sanchez, J.C., Müller, M., 2011. pROC: an open-source
package for R and S+ to analyze and compare ROC curves. BMC Bioinformatics. 12, 77.
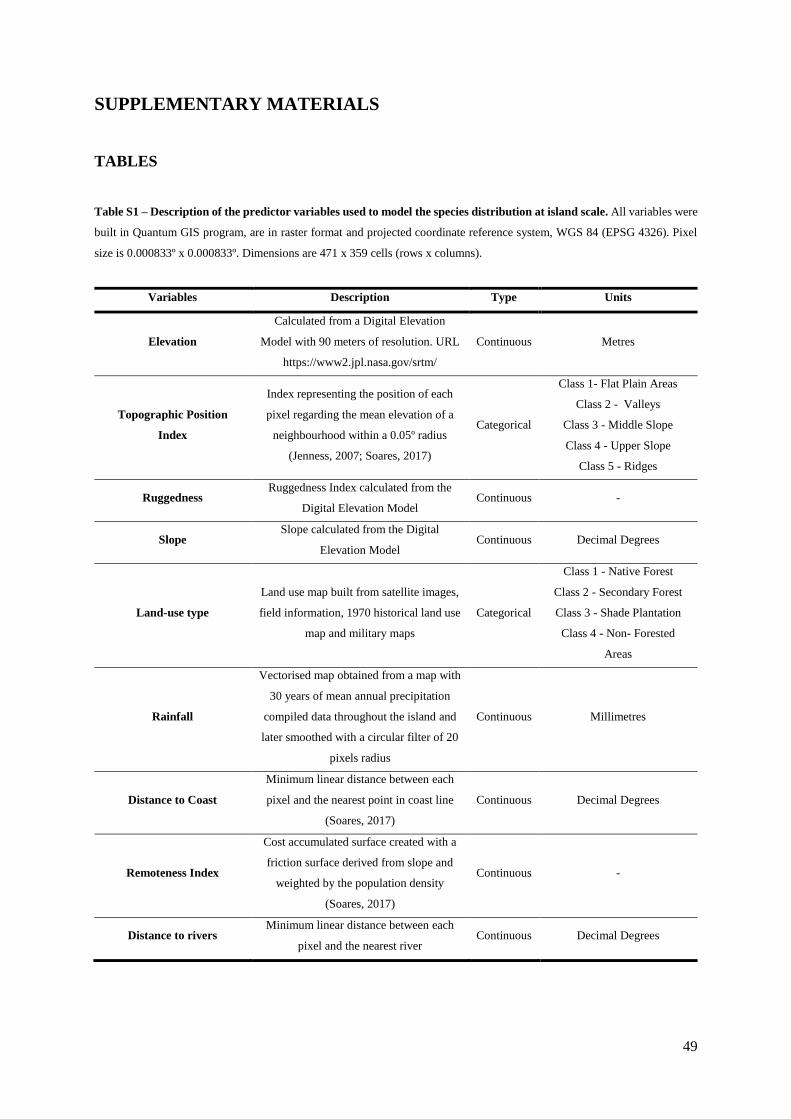
49
SUPPLEMENTARY MATERIALS
TABLES
Table S1 – Description of the predictor variables used to model the species distribution at island scale. All variables were
built in Quantum GIS program, are in raster format and projected coordinate reference system, WGS 84 (EPSG 4326). Pixel
size is 0.000833º x 0.000833º. Dimensions are 471 x 359 cells (rows x columns).
Variables Description Type Units
Elevation
Calculated from a Digital Elevation
Model with 90 meters of resolution. URL
https://www2.jpl.nasa.gov/srtm/
Continuous Metres
Topographic Position
Index
Index representing the position of each
pixel regarding the mean elevation of a
neighbourhood within a 0.05º radius
(Jenness, 2007; Soares, 2017)
Categorical
Class 1- Flat Plain Areas
Class 2 - Valleys
Class 3 - Middle Slope
Class 4 - Upper Slope
Class 5 - Ridges
Ruggedness Ruggedness Index calculated from the
Digital Elevation Model Continuous -
Slope Slope calculated from the Digital
Elevation Model Continuous Decimal Degrees
Land-use type
Land use map built from satellite images,
field information, 1970 historical land use
map and military maps
Categorical
Class 1 - Native Forest
Class 2 - Secondary Forest
Class 3 - Shade Plantation
Class 4 - Non- Forested
Areas
Rainfall
Vectorised map obtained from a map with
30 years of mean annual precipitation
compiled data throughout the island and
later smoothed with a circular filter of 20
pixels radius
Continuous Millimetres
Distance to Coast
Minimum linear distance between each
pixel and the nearest point in coast line
(Soares, 2017)
Continuous Decimal Degrees
Remoteness Index
Cost accumulated surface created with a
friction surface derived from slope and
weighted by the population density
(Soares, 2017)
Continuous -
Distance to rivers Minimum linear distance between each
pixel and the nearest river Continuous Decimal Degrees
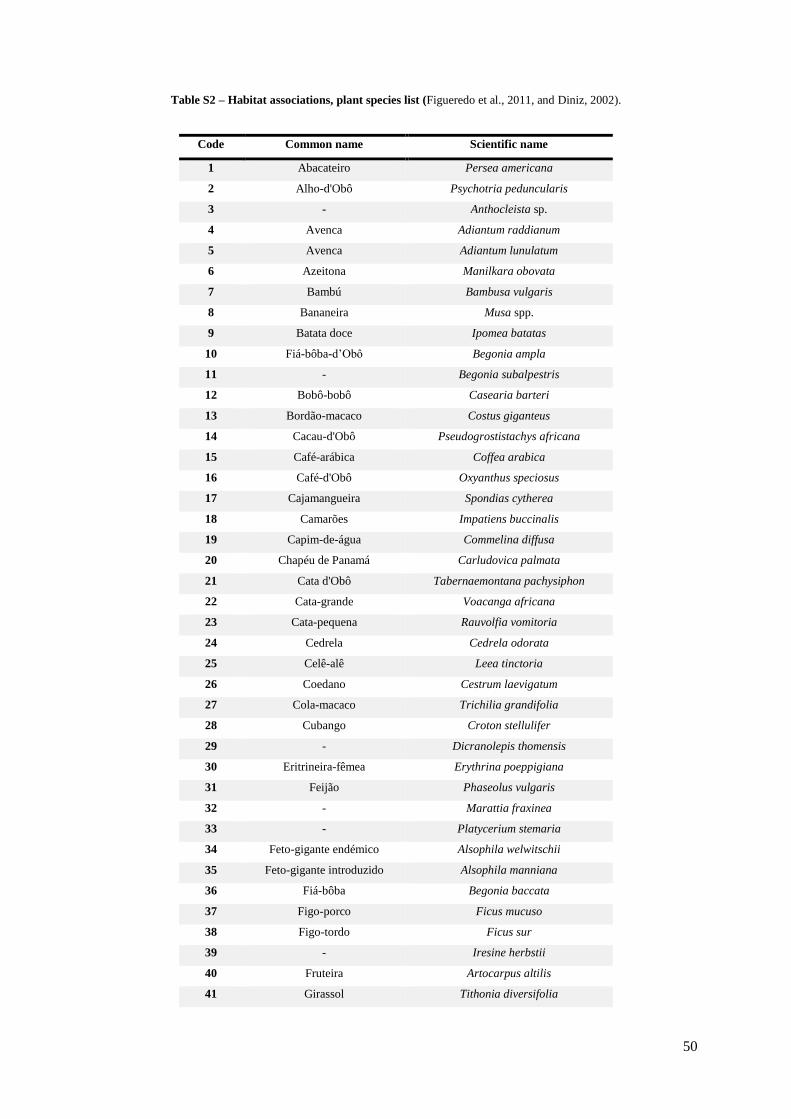
50
Table S2 – Habitat associations, plant species list (Figueredo et al., 2011, and Diniz, 2002).
Code Common name Scientific name
1 Abacateiro Persea americana
2 Alho-d'Obô Psychotria peduncularis
3 - Anthocleista sp.
4 Avenca Adiantum raddianum
5 Avenca Adiantum lunulatum
6 Azeitona Manilkara obovata
7 Bambú Bambusa vulgaris
8 Bananeira Musa spp.
9 Batata doce Ipomea batatas
10 Fiá-bôba-d’Obô Begonia ampla
11 - Begonia subalpestris
12 Bobô-bobô Casearia barteri
13 Bordão-macaco Costus giganteus
14 Cacau-d'Obô Pseudogrostistachys africana
15 Café-arábica Coffea arabica
16 Café-d'Obô Oxyanthus speciosus
17 Cajamangueira Spondias cytherea
18 Camarões Impatiens buccinalis
19 Capim-de-água Commelina diffusa
20 Chapéu de Panamá Carludovica palmata
21 Cata d'Obô Tabernaemontana pachysiphon
22 Cata-grande Voacanga africana
23 Cata-pequena Rauvolfia vomitoria
24 Cedrela Cedrela odorata
25 Celê-alê Leea tinctoria
26 Coedano Cestrum laevigatum
27 Cola-macaco Trichilia grandifolia
28 Cubango Croton stellulifer
29 - Dicranolepis thomensis
30 Eritrineira-fêmea Erythrina poeppigiana
31 Feijão Phaseolus vulgaris
32 - Marattia fraxinea
33 - Platycerium stemaria
34 Feto-gigante endémico Alsophila welwitschii
35 Feto-gigante introduzido Alsophila manniana
36 Fiá-bôba Begonia baccata
37 Figo-porco Ficus mucuso
38 Figo-tordo Ficus sur
39 - Iresine herbstii
40 Fruteira Artocarpus altilis
41 Girassol Tithonia diversifolia
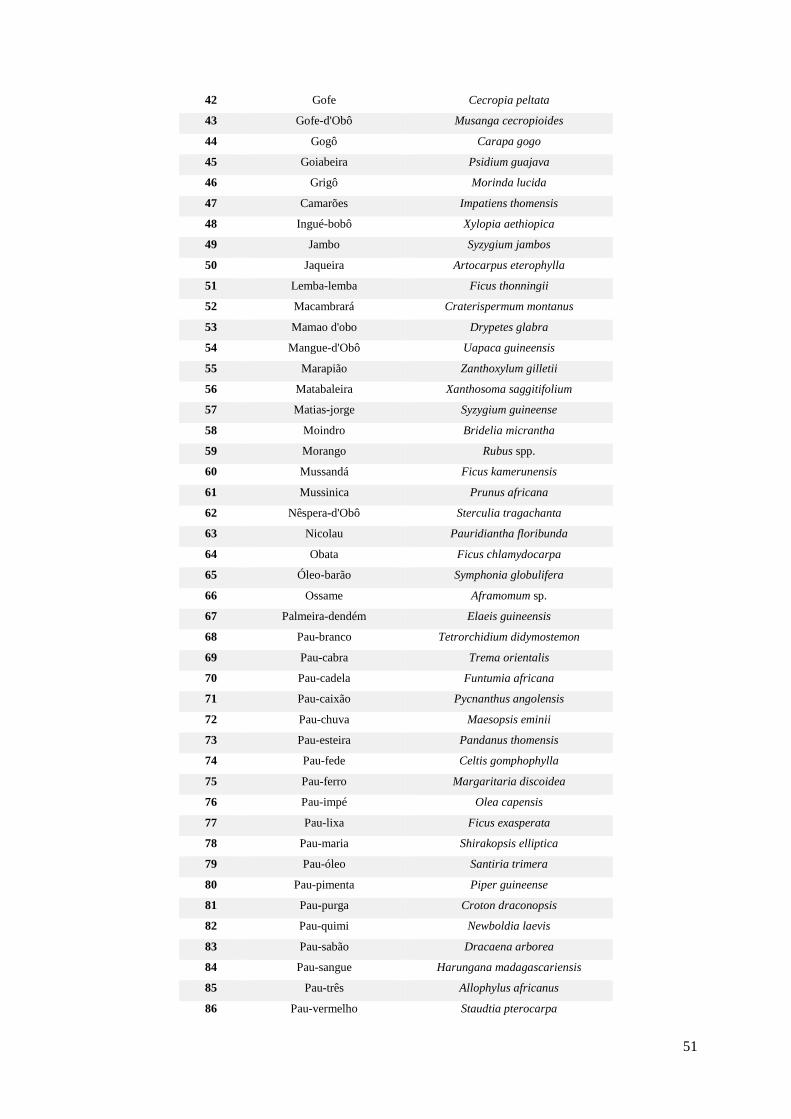
51
42 Gofe Cecropia peltata
43 Gofe-d'Obô Musanga cecropioides
44 Gogô Carapa gogo
45 Goiabeira Psidium guajava
46 Grigô Morinda lucida
47 Camarões Impatiens thomensis
48 Ingué-bobô Xylopia aethiopica
49 Jambo Syzygium jambos
50 Jaqueira Artocarpus eterophylla
51 Lemba-lemba Ficus thonningii
52 Macambrará Craterispermum montanus
53 Mamao d'obo Drypetes glabra
54 Mangue-d'Obô Uapaca guineensis
55 Marapião Zanthoxylum gilletii
56 Matabaleira Xanthosoma saggitifolium
57 Matias-jorge Syzygium guineense
58 Moindro Bridelia micrantha
59 Morango Rubus spp.
60 Mussandá Ficus kamerunensis
61 Mussinica Prunus africana
62 Nêspera-d'Obô Sterculia tragachanta
63 Nicolau Pauridiantha floribunda
64 Obata Ficus chlamydocarpa
65 Óleo-barão Symphonia globulifera
66 Ossame Aframomum sp.
67 Palmeira-dendém Elaeis guineensis
68 Pau-branco Tetrorchidium didymostemon
69 Pau-cabra Trema orientalis
70 Pau-cadela Funtumia africana
71 Pau-caixão Pycnanthus angolensis
72 Pau-chuva Maesopsis eminii
73 Pau-esteira Pandanus thomensis
74 Pau-fede Celtis gomphophylla
75 Pau-ferro Margaritaria discoidea
76 Pau-impé Olea capensis
77 Pau-lixa Ficus exasperata
78 Pau-maria Shirakopsis elliptica
79 Pau-óleo Santiria trimera
80 Pau-pimenta Piper guineense
81 Pau-purga Croton draconopsis
82 Pau-quimi Newboldia laevis
83 Pau-sabão Dracaena arborea
84 Pau-sangue Harungana madagascariensis
85 Pau-três Allophylus africanus
86 Pau-vermelho Staudtia pterocarpa
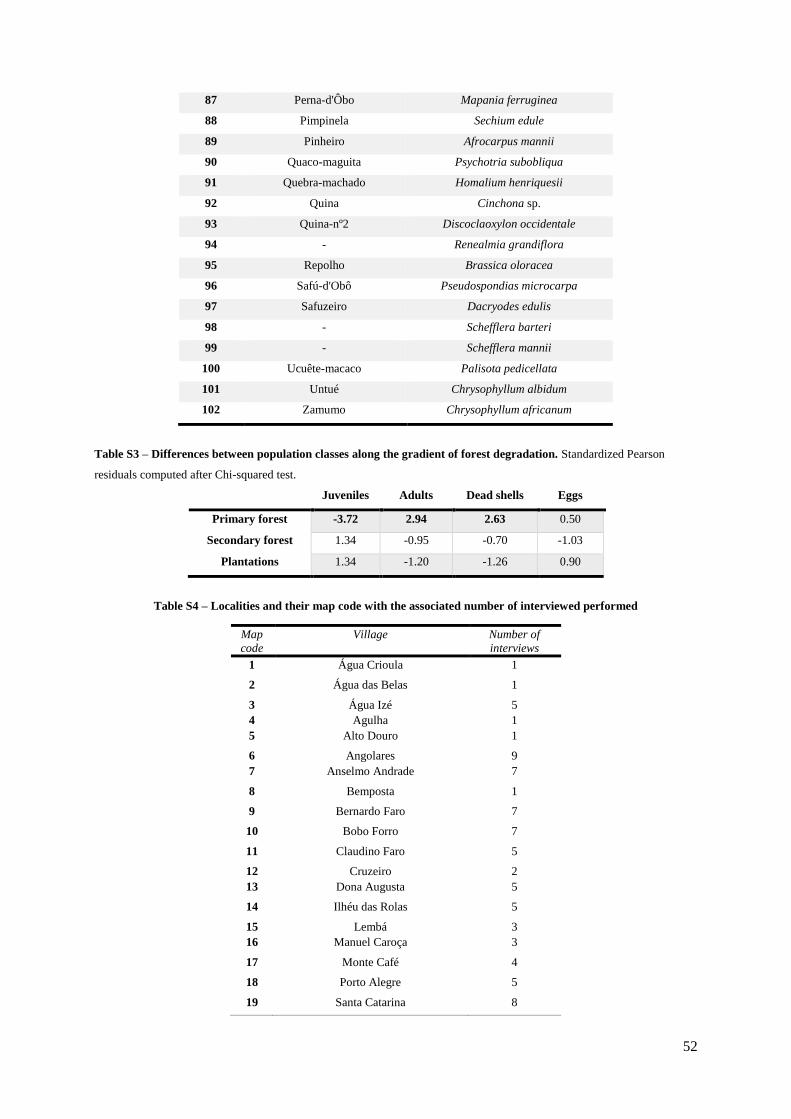
52
87 Perna-d'Ôbo Mapania ferruginea
88 Pimpinela Sechium edule
89 Pinheiro Afrocarpus mannii
90 Quaco-maguita Psychotria subobliqua
91 Quebra-machado Homalium henriquesii
92 Quina Cinchona sp.
93 Quina-nº2 Discoclaoxylon occidentale
94 - Renealmia grandiflora
95 Repolho Brassica oloracea
96 Safú-d'Obô Pseudospondias microcarpa
97 Safuzeiro Dacryodes edulis
98 - Schefflera barteri
99 - Schefflera mannii
100 Ucuête-macaco Palisota pedicellata
101 Untué Chrysophyllum albidum
102 Zamumo Chrysophyllum africanum
Table S3 – Differences between population classes along the gradient of forest degradation. Standardized Pearson
residuals computed after Chi-squared test.
Juveniles Adults Dead shells Eggs
Primary forest -3.72 2.94 2.63 0.50
Secondary forest 1.34 -0.95 -0.70 -1.03
Plantations 1.34 -1.20 -1.26 0.90
Table S4 – Localities and their map code with the associated number of interviewed performed
Map
code
Village Number of
interviews
1 Água Crioula 1
2 Água das Belas 1
3 Água Izé 5
4 Agulha 1
5 Alto Douro 1
6 Angolares 9
7 Anselmo Andrade 7
8 Bemposta 1
9 Bernardo Faro 7
10 Bobo Forro 7
11 Claudino Faro 5
12 Cruzeiro 2
13 Dona Augusta 5
14 Ilhéu das Rolas 5
15 Lembá 3
16 Manuel Caroça 3
17 Monte Café 4
18 Porto Alegre 5
19 Santa Catarina 8
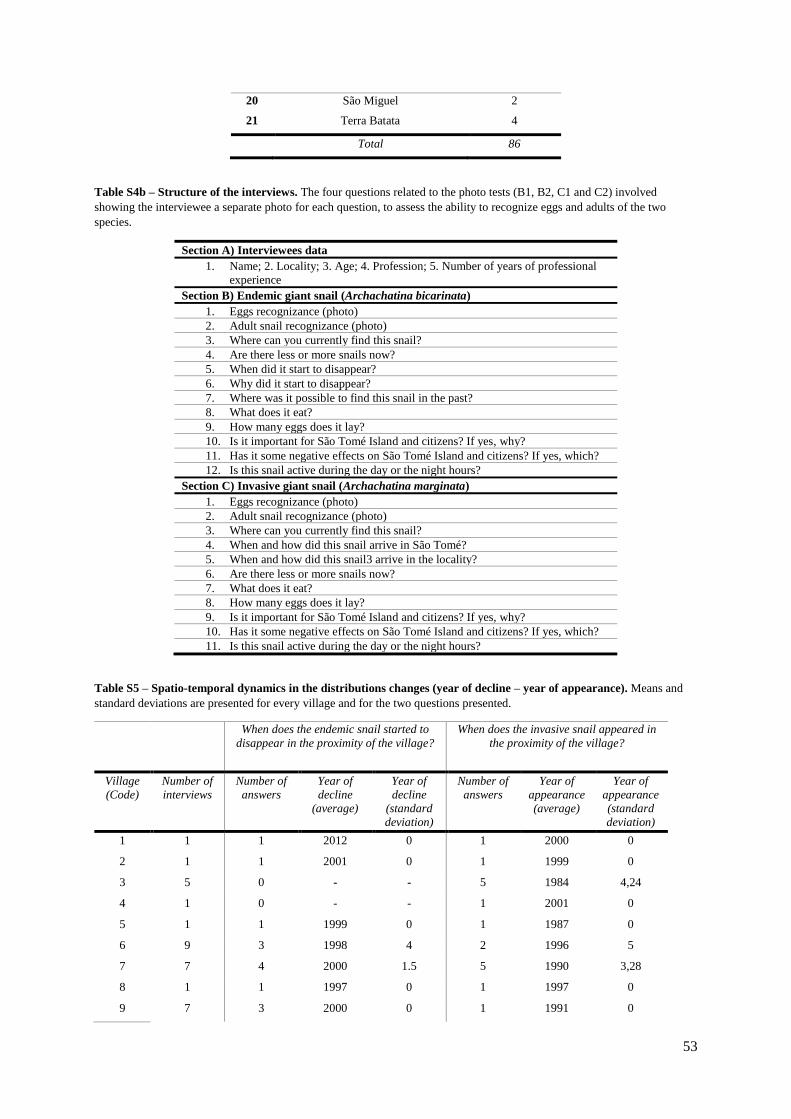
53
20 São Miguel 2
21 Terra Batata 4
Total 86
Table S4b – Structure of the interviews. The four questions related to the photo tests (B1, B2, C1 and C2) involved
showing the interviewee a separate photo for each question, to assess the ability to recognize eggs and adults of the two
species.
Section A) Interviewees data
1. Name; 2. Locality; 3. Age; 4. Profession; 5. Number of years of professional
experience
Section B) Endemic giant snail (Archachatina bicarinata)
1. Eggs recognizance (photo)
2. Adult snail recognizance (photo)
3. Where can you currently find this snail?
4. Are there less or more snails now?
5. When did it start to disappear?
6. Why did it start to disappear?
7. Where was it possible to find this snail in the past?
8. What does it eat?
9. How many eggs does it lay?
10. Is it important for São Tomé Island and citizens? If yes, why?
11. Has it some negative effects on São Tomé Island and citizens? If yes, which?
12. Is this snail active during the day or the night hours?
Section C) Invasive giant snail (Archachatina marginata)
1. Eggs recognizance (photo)
2. Adult snail recognizance (photo)
3. Where can you currently find this snail?
4. When and how did this snail arrive in São Tomé?
5. When and how did this snail3 arrive in the locality?
6. Are there less or more snails now?
7. What does it eat?
8. How many eggs does it lay?
9. Is it important for São Tomé Island and citizens? If yes, why?
10. Has it some negative effects on São Tomé Island and citizens? If yes, which?
11. Is this snail active during the day or the night hours?
Table S5 – Spatio-temporal dynamics in the distributions changes (year of decline – year of appearance). Means and
standard deviations are presented for every village and for the two questions presented.
When does the endemic snail started to
disappear in the proximity of the village?
When does the invasive snail appeared in
the proximity of the village?
Village
(Code)
Number of
interviews
Number of
answers
Year of
decline
(average)
Year of
decline
(standard
deviation)
Number of
answers
Year of
appearance
(average)
Year of
appearance
(standard
deviation)
1 1 1 2012 0 1 2000 0
2 1 1 2001 0 1 1999 0
3 5 0 - - 5 1984 4,24
4 1 0 - - 1 2001 0
5 1 1 1999 0 1 1987 0
6 9 3 1998 4 2 1996 5
7 7 4 2000 1.5 5 1990 3,28
8 1 1 1997 0 1 1997 0
9 7 3 2000 0 1 1991 0
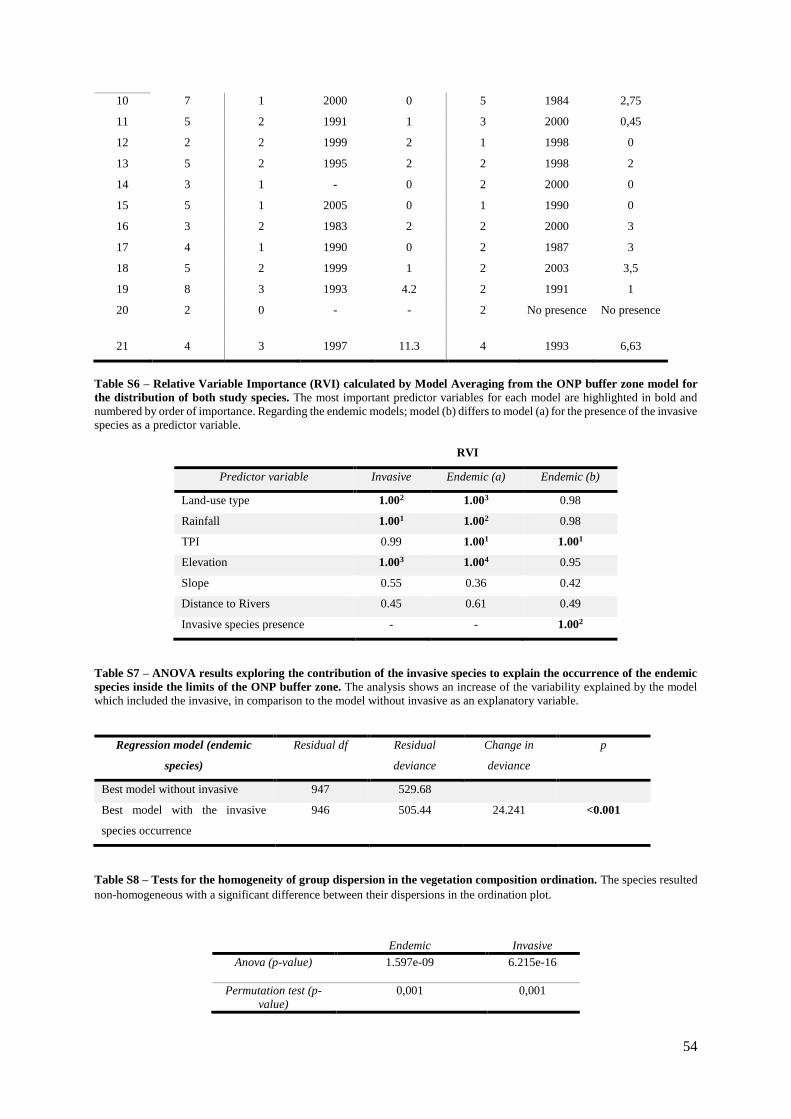
54
10 7 1 2000 0 5 1984 2,75
11 5 2 1991 1 3 2000 0,45
12 2 2 1999 2 1 1998 0
13 5 2 1995 2 2 1998 2
14 3 1 - 0 2 2000 0
15 5 1 2005 0 1 1990 0
16 3 2 1983 2 2 2000 3
17 4 1 1990 0 2 1987 3
18 5 2 1999 1 2 2003 3,5
19 8 3 1993 4.2 2 1991 1
20 2 0 - - 2 No presence No presence
21 4 3 1997 11.3 4 1993 6,63
Table S6 – Relative Variable Importance (RVI) calculated by Model Averaging from the ONP buffer zone model for
the distribution of both study species. The most important predictor variables for each model are highlighted in bold and
numbered by order of importance. Regarding the endemic models; model (b) differs to model (a) for the presence of the invasive
species as a predictor variable.
RVI
Predictor variable Invasive Endemic (a) Endemic (b)
Land-use type 1.002 1.003 0.98
Rainfall 1.001 1.002 0.98
TPI 0.99 1.001 1.001
Elevation 1.003 1.004 0.95
Slope 0.55 0.36 0.42
Distance to Rivers 0.45 0.61 0.49
Invasive species presence - - 1.002
Table S7 – ANOVA results exploring the contribution of the invasive species to explain the occurrence of the endemic
species inside the limits of the ONP buffer zone. The analysis shows an increase of the variability explained by the model
which included the invasive, in comparison to the model without invasive as an explanatory variable.
Regression model (endemic
species)
Residual df Residual
deviance
Change in
deviance
p
Best model without invasive 947 529.68
Best model with the invasive
species occurrence
946 505.44 24.241 <0.001
Table S8 – Tests for the homogeneity of group dispersion in the vegetation composition ordination. The species resulted
non-homogeneous with a significant difference between their dispersions in the ordination plot.
Endemic Invasive
Anova (p-value)
1.597e-09 6.215e-16
Permutation test (p-
value)
0,001 0,001
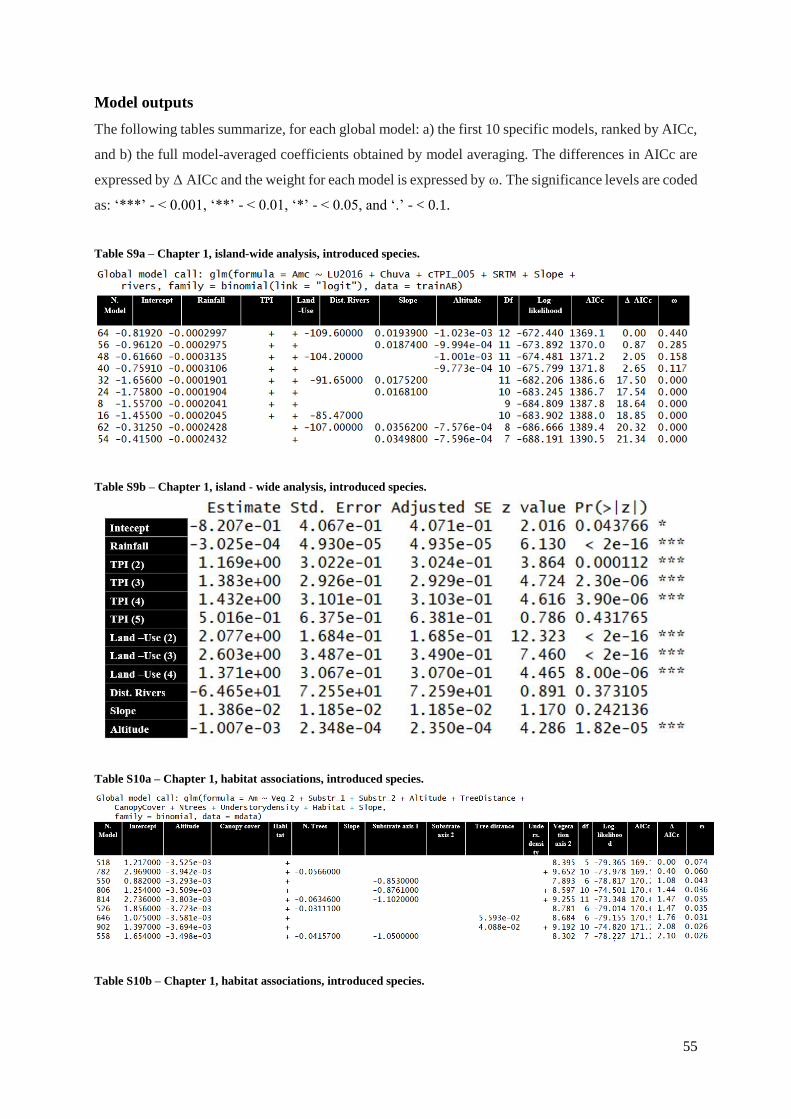
55
Model outputs
The following tables summarize, for each global model: a) the first 10 specific models, ranked by AICc,
and b) the full model-averaged coefficients obtained by model averaging. The differences in AICc are
expressed by Δ AICc and the weight for each model is expressed by ω. The significance levels are coded
as: ‘***’ - < 0.001, ‘**’ - < 0.01, ‘*’ - < 0.05, and ‘.’ - < 0.1.
Table S9a – Chapter 1, island-wide analysis, introduced species.
Table S9b – Chapter 1, island - wide analysis, introduced species.
Table S10a – Chapter 1, habitat associations, introduced species.
Table S10b – Chapter 1, habitat associations, introduced species.
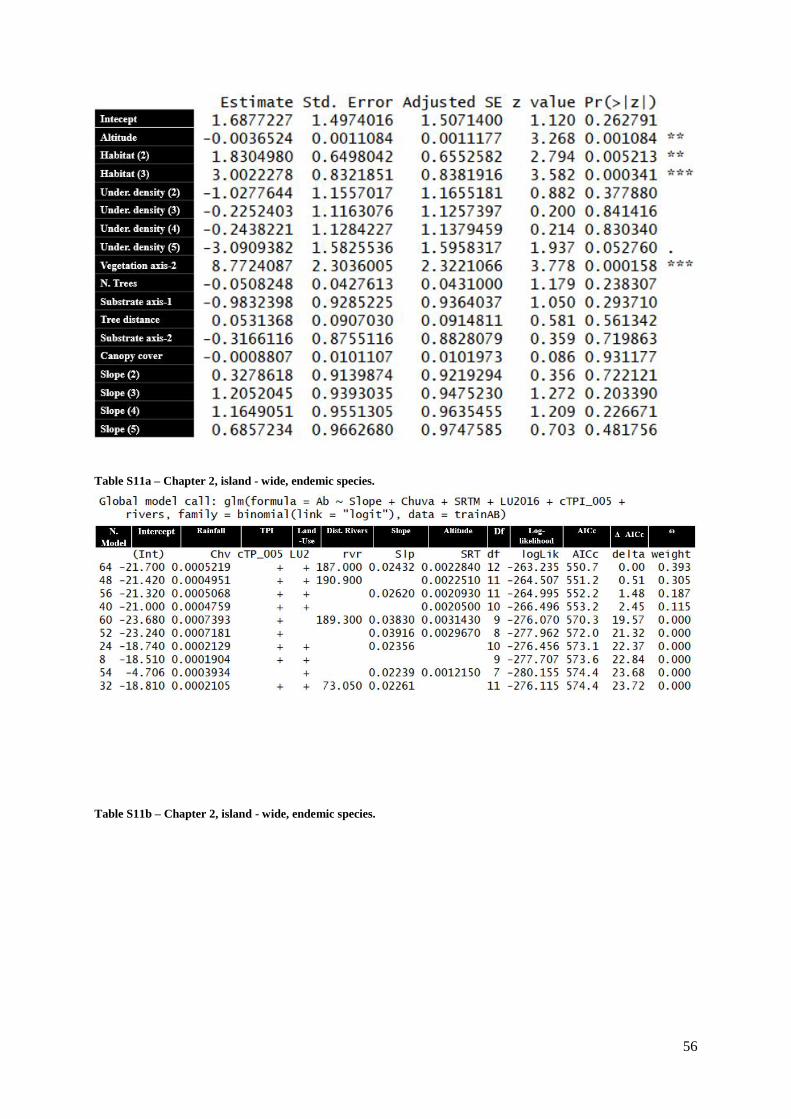
56
Table S11a – Chapter 2, island - wide, endemic species.
Table S11b – Chapter 2, island - wide, endemic species.
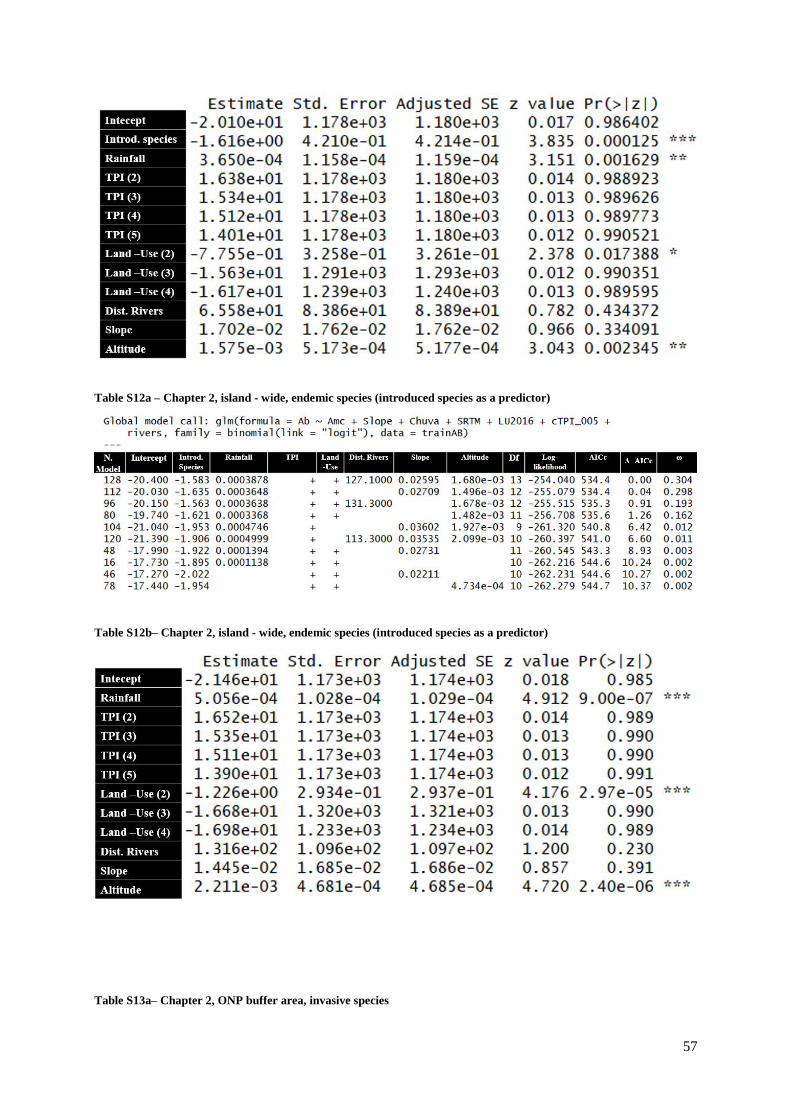
57
Table S12a – Chapter 2, island - wide, endemic species (introduced species as a predictor)
Table S12b– Chapter 2, island - wide, endemic species (introduced species as a predictor)
Table S13a– Chapter 2, ONP buffer area, invasive species
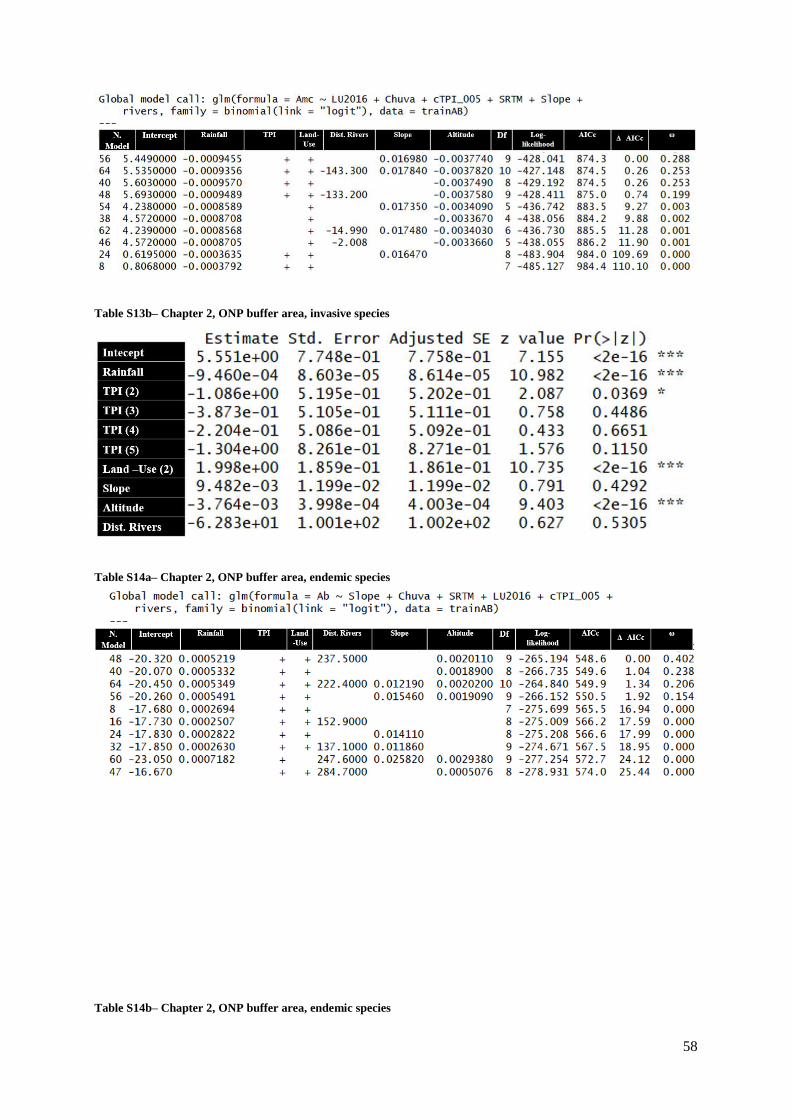
58
Table S13b– Chapter 2, ONP buffer area, invasive species
Table S14a– Chapter 2, ONP buffer area, endemic species
Table S14b– Chapter 2, ONP buffer area, endemic species

59
Table S15a– Chapter 2, ONP buffer area, endemic species (invasive species as a predictor)
Table S15b – Chapter 2, ONP buffer area, endemic species (invasive species as a predictor)
Table S16a – Chapter 2, transects, invasive species
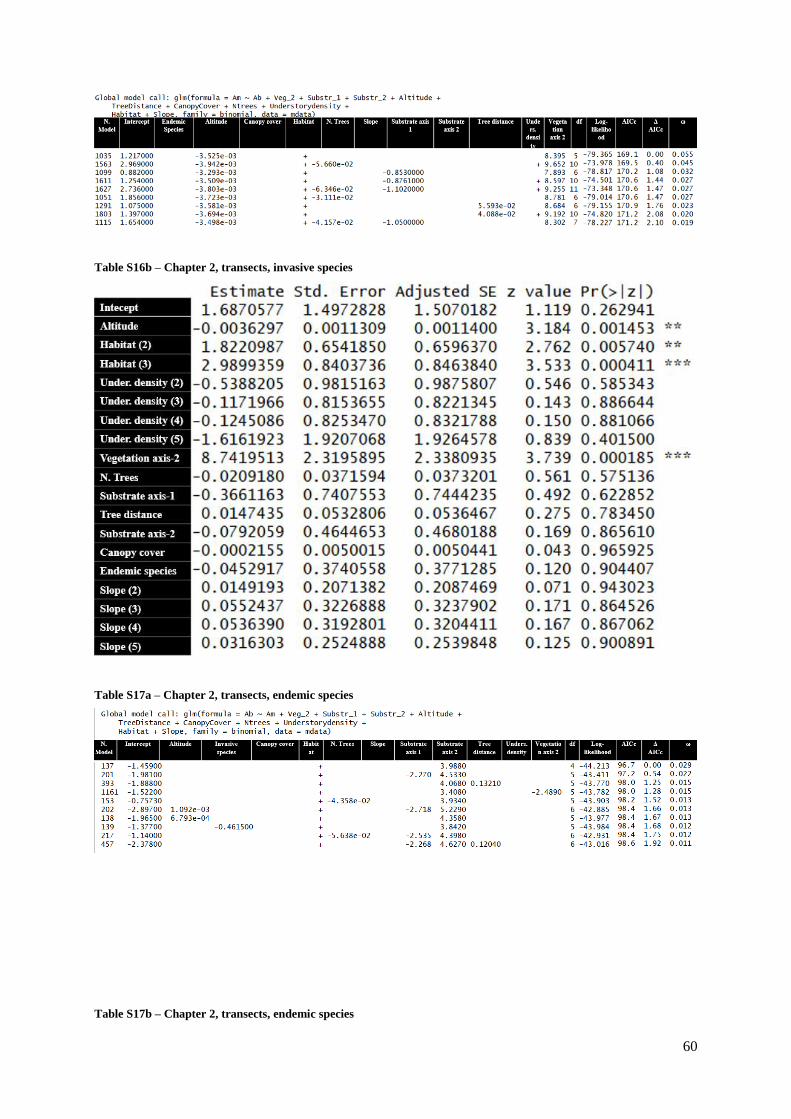
60
Table S16b – Chapter 2, transects, invasive species
Table S17a – Chapter 2, transects, endemic species
Table S17b – Chapter 2, transects, endemic species
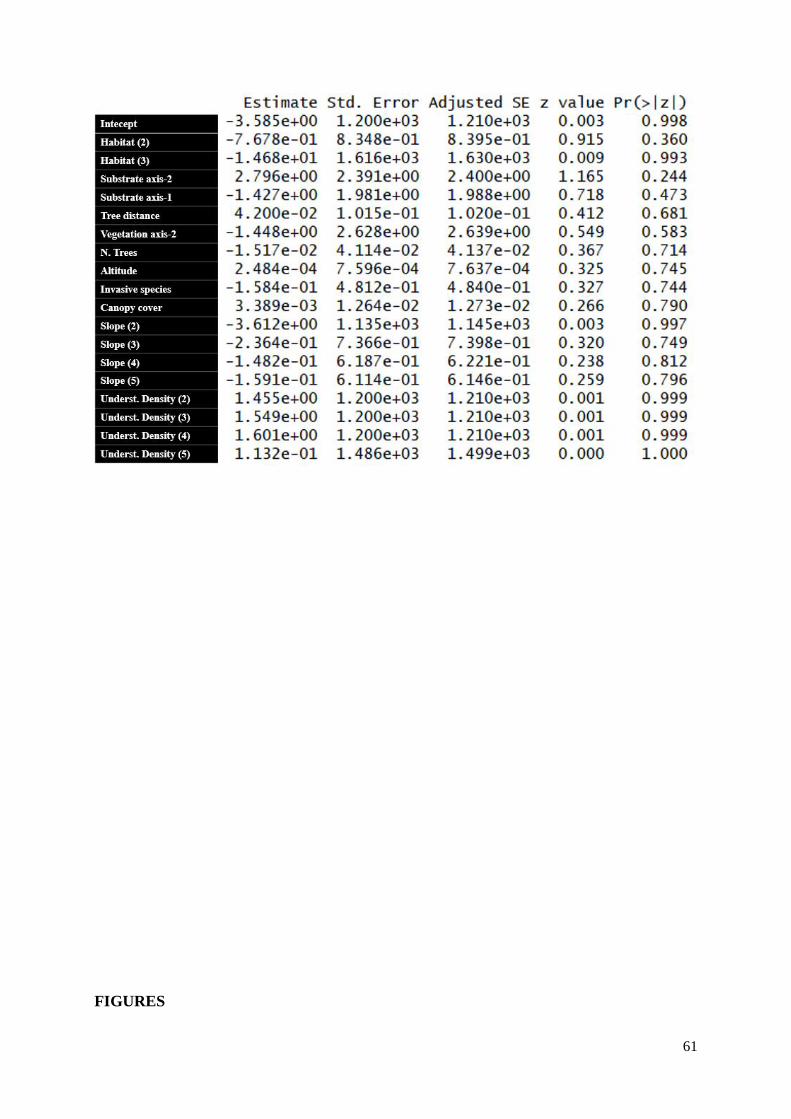
61
FIGURES
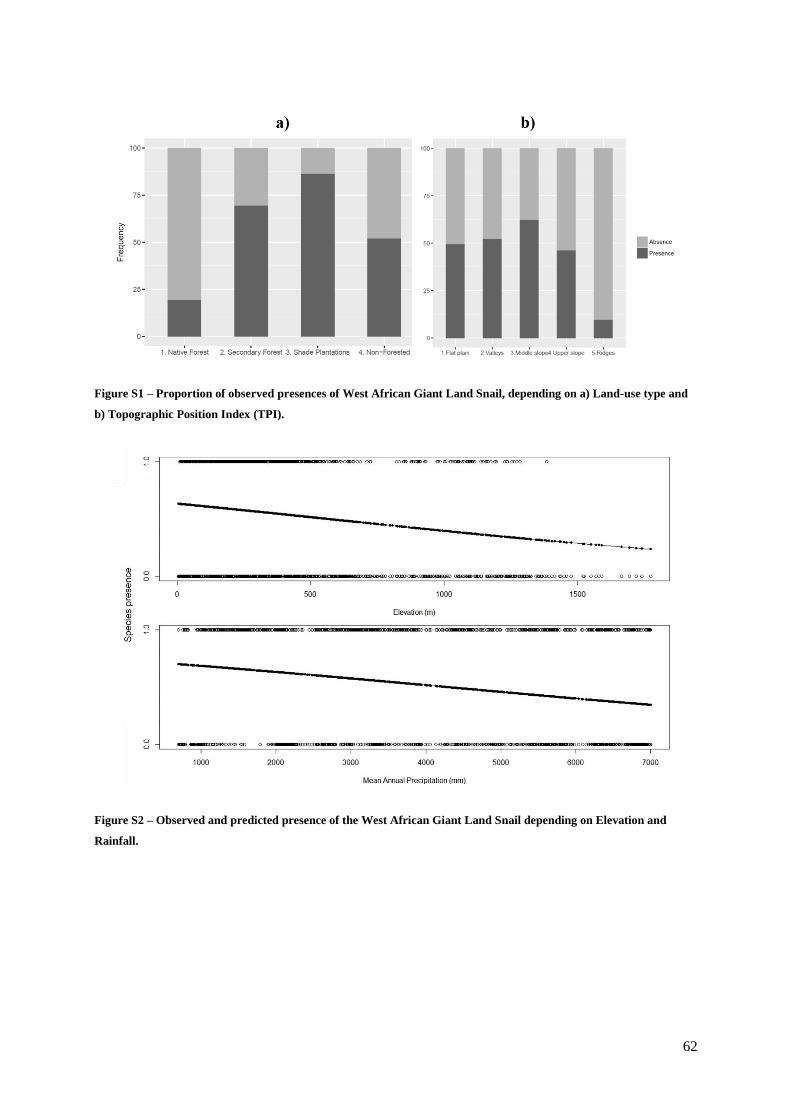
62
Figure S1 – Proportion of observed presences of West African Giant Land Snail, depending on a) Land-use type and
b) Topographic Position Index (TPI).
Figure S2 – Observed and predicted presence of the West African Giant Land Snail depending on Elevation and
Rainfall.

63
Figure S3 – Population shell width distribution of the West African Giant Land Snail. Min = 1.10 cm, max = 7.0 cm,
mean = 4.41 cm.
Figure S4 – Association between the correct identification of the endemic species and the age of the interviewed.
Figure S5 – Causes associated to the demise of the endemic species from locals’ perceptions. The number of answers and
their overall proportions are represented in the graph. The graph indicates exclusively the answers given from the interviewed
that knew the species (n=65) and, inside this class, from those who knew the causes (n=52). Each interviewed answered one
or more causes (N tot=80).
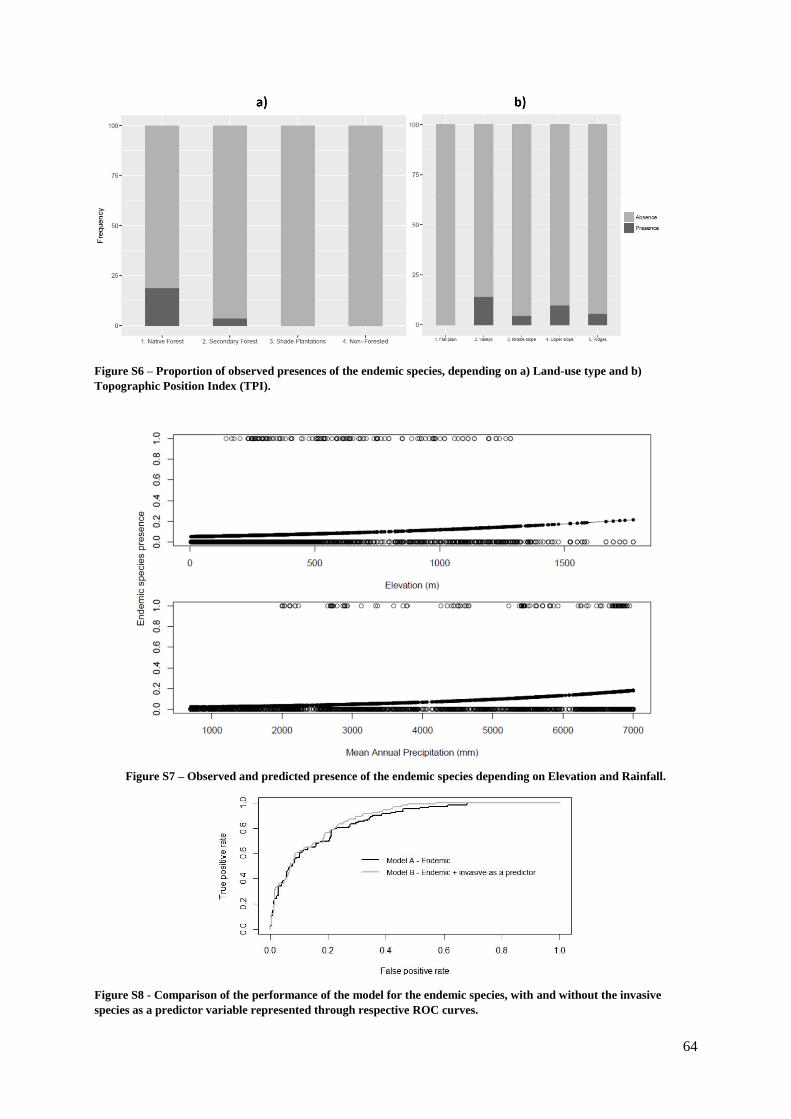
64
Figure S6 – Proportion of observed presences of the endemic species, depending on a) Land-use type and b)
Topographic Position Index (TPI).
Figure S7 – Observed and predicted presence of the endemic species depending on Elevation and Rainfall.
Figure S8 - Comparison of the performance of the model for the endemic species, with and without the invasive
species as a predictor variable represented through respective ROC curves.
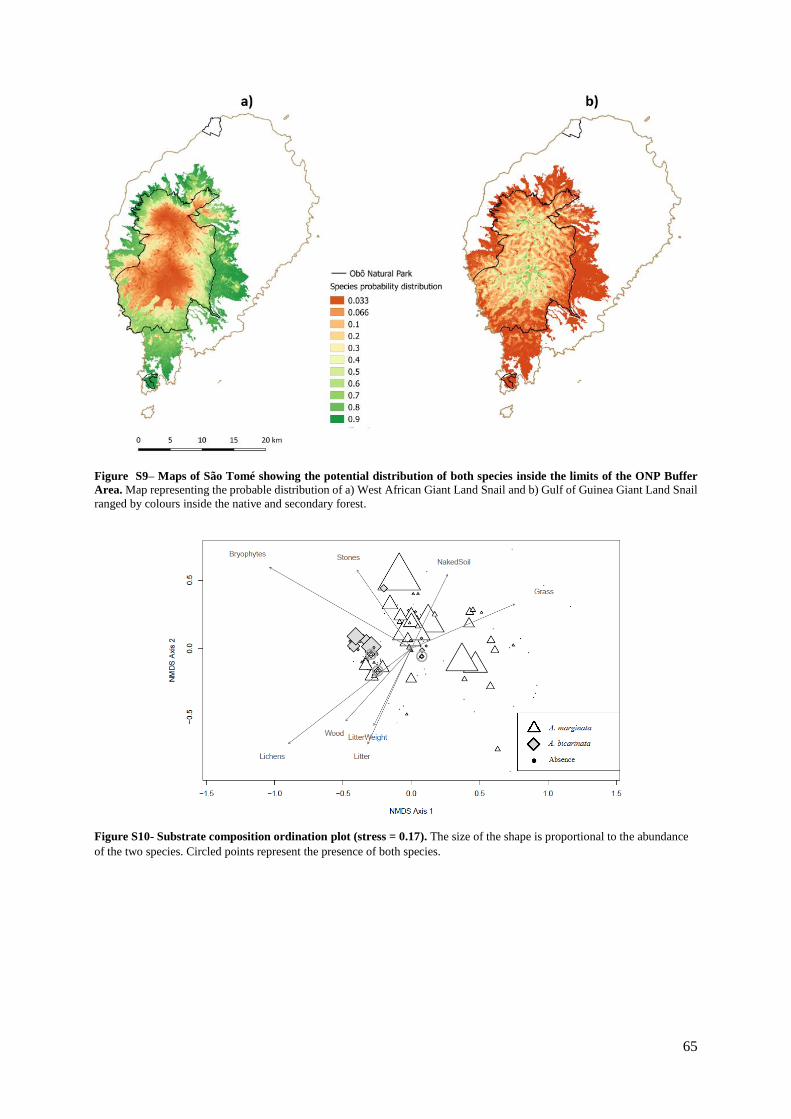
65
Figure S9– Maps of São Tomé showing the potential distribution of both species inside the limits of the ONP Buffer
Area. Map representing the probable distribution of a) West African Giant Land Snail and b) Gulf of Guinea Giant Land Snail
ranged by colours inside the native and secondary forest.
Figure S10- Substrate composition ordination plot (stress = 0.17). The size of the shape is proportional to the abundance
of the two species. Circled points represent the presence of both species.

66
Figure S11 – Plant species association with NMDS axes. The numbered species are fitted in the ordination plot to represent
their association with the first two axes of the NMDS for the vegetation analysis.
Figure S12 – Selection of the best models and the most important variables for the West African Giant Land Snail in
the habitat association analysis. Models are ranked by AICc and represented through rows, the thicker is the row, the best is
the model. The most important variables for every model are highlighted by filled rows. Elevation, Land-use and Vegetation
composition are the best variables, being highlighted in every model.
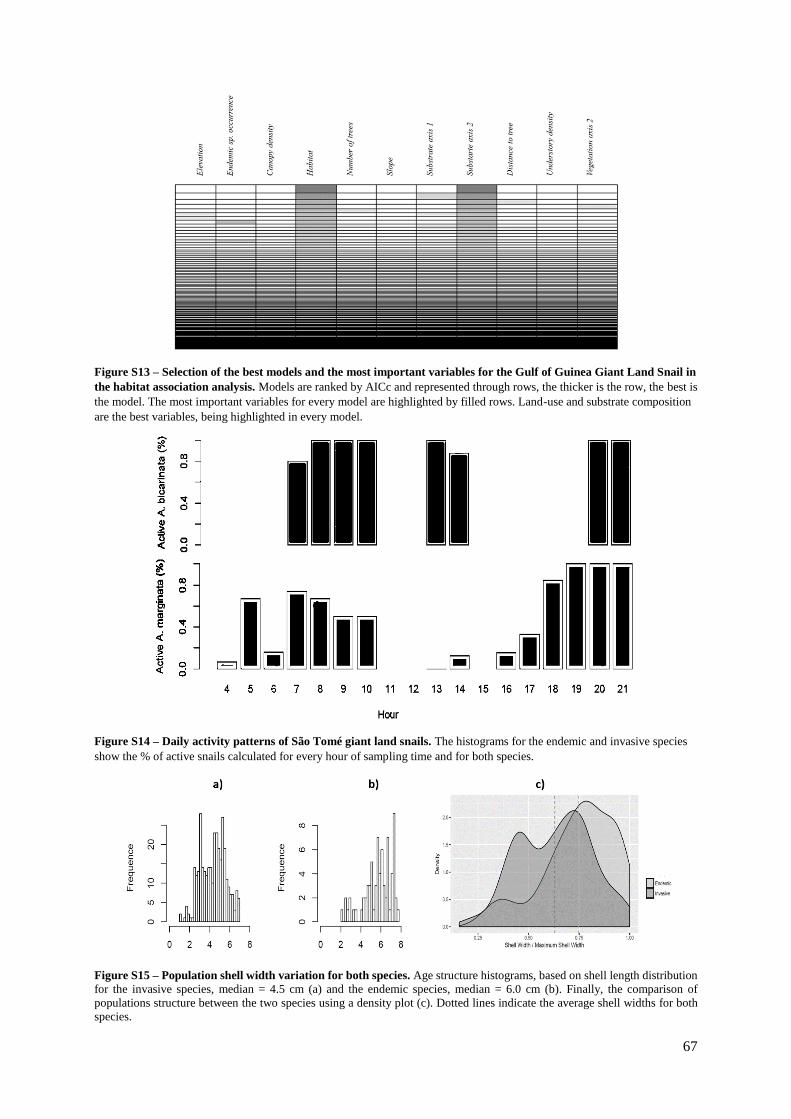
67
Figure S13 – Selection of the best models and the most important variables for the Gulf of Guinea Giant Land Snail in
the habitat association analysis. Models are ranked by AICc and represented through rows, the thicker is the row, the best is
the model. The most important variables for every model are highlighted by filled rows. Land-use and substrate composition
are the best variables, being highlighted in every model.
Figure S14 – Daily activity patterns of São Tomé giant land snails. The histograms for the endemic and invasive species
show the % of active snails calculated for every hour of sampling time and for both species.
Figure S15 – Population shell width variation for both species. Age structure histograms, based on shell length distribution
for the invasive species, median = 4.5 cm (a) and the endemic species, median = 6.0 cm (b). Finally, the comparison of
populations structure between the two species using a density plot (c). Dotted lines indicate the average shell widths for both
species.
68
R SCRIPTS
* ”Ab” is the acronym for the endemic species (A.bicarinata), “Am” is the acronym for the
invasive species (A.marginata).
#1) SPECIES DISTRIBUTION MODELLING ISLAND-WIDE
#Import AB.csv for Ab analysis
View(AB)
#Import ModelsFinal9.csv for Am analysis
View(ModelsFinal9)
dadAB<- AB
dadm<-ModelsFinal9
op <- par(mfrow = c(1, 1), mar = c(3, 3, 3, 1))
dotchart(dadm$Slope, main = "Slope", group = NULL)
dotchart(dadm$Tobler, main = "Remoteness", group = NULL)
dotchart(dadm$Rugosidade, main = "Rugosidade", group = NULL)
dotchart(dadm$DistCosta, main = "CoastDistance", group = NULL)
dotchart(dadm$Chuva, main = "Rain", group = NULL)
dotchart(dadm$SRTM, main = "Elevation", group = NULL)
dotchart(dadm$rivers, main="Distance to rivers", group=NULL)
par(op)
#Visualize categorical variables
op <- par(mfrow = c(1, 2))
hist(dadm$LU2016)
hist(dadm$cTPI_005)
par(op)
#Correlation between variables
z<-
cbind(dadm$Ab,dadm$Am,dadm$Slope,dadm$Tobler,dadm$Rugosidade,dadm$DistCosta,dadm$Chuva,dadm$
LU2016,dadm$cTPI_005,dadm$SRTM,dadm$rivers)
colnames(z)<-
c("Ab","Am","Slope","Remoteness","Rugosidade","CoastDist","Rain","Habitat","TPI","SRTM","Rivers")
panel.smooth2<-function (x, y, col = par("col"), bg = NA, pch = par("pch"),
cex = 1, col.smooth = "red", span = 2/3, iter = 3, ...)
{
points(x, y, pch = pch, col = col, bg = bg, cex = cex)
ok <- is.finite(x) & is.finite(y)
if (any(ok))
lines(stats::lowess(x[ok], y[ok], f = span, iter = iter),
col = 1, ...)
}
panel.cor<-function(x, y, digits=1, prefix="", cex.cor)
{
usr <- par("usr"); on.exit(par(usr))
par(usr = c(0, 1, 0, 1))
r1=cor(x,y,use="pairwise.complete.obs")
r <- abs(cor(x, y,use="pairwise.complete.obs"))
txt <- format(c(r1, 0.123456789), digits=digits)[1]
txt <- paste(prefix, txt, sep="")
if(missing(cex.cor)) cex <- 0.9/strwidth(txt)
text(0.5, 0.5, txt, cex = cex * r)
}
panel.hist<-function(x, ...)
{
usr <- par("usr"); on.exit(par(usr))
par(usr = c(usr[1:2], 0, 1.5) )
69
h <- hist(x, plot = FALSE)
breaks <- h$breaks; nB <- length(breaks)
y <- h$counts; y <- y/max(y)
rect(breaks[-nB], 0, breaks[-1], y, col="white", ...)
}
pairs(z,lower.panel=panel.smooth2,upper.panel=panel.cor,diag.panel=panel.hist)
# I remove "Rugosity", "Coast Distance" and “Remoteness” because of multicollinearity
#Set train and test data
#Am
library(caTools)
set.seed(101)
sample = sample.split(dadm$Code, SplitRatio = .70)
trainA = subset(dadm, sample == TRUE)
testA = subset(dadm, sample == FALSE)
trainA
#Same for Ab
#Set categorical variables
#Am
trainA$LU2016<-as.factor(trainA$LU2016)
trainA$cTPI_005<-as.factor(trainA$cTPI_005)
testA$cTPI_005<-as.factor(testA$cTPI_005)
testA$LU2016<-as.factor(testA$LU2016)
#Same for Ab
#Model_Am
modam<-glm(Am~LU2016+Chuva+cTPI_005+SRTM+Slope+rivers,data=trainA, family=binomial(link='logit'))
summary(modam)
#Model_Ab
modab<-glm(Ab~LU2016+Chuva+cTPI_005+SRTM+Slope+rivers,data=trainAB,
family=binomial(link='logit'))
summary(modab)
#Model Ab + Am presence/absence
modab2<-glm(Ab~Amc+Slope+Chuva+SRTM+LU2016+cTPI_005+rivers,data=trainAB,
family=binomial(link='logit'))
summary(modab2)
# VIFs
library(car)
vif(modam)
max(vif(modam))
#Same for Ab models
# Dredge and Model Averaging
library(MuMIn)
options(na.action = "na.fail")
#dredge Am
ddam<-dredge(modam)
ddam
avgddam<-model.avg(ddam)
summary(avgddam)
op <- par(mfrow = c(1, 1))
plot(ddam)
par(op)
#Same for Ab
#ROC curves
#Am
modam1t<-glm(Am~LU2016+Chuva+cTPI_005+SRTM+Slope+rivers,data=testA,
family=binomial(link='logit'))
prob=predict(modam1t, type=c("response"))
prob
library(pROC)
g <- roc(testA$Am ~ prob)
plot(g)
70
auc(g)
#Same for Ab
#Mc Fadden index
library (pscl)
pR2(modam1)
#Same for Ab
#or
nullmodel<-glm(Am~1,data=testA, family=binomial(link='logit'))
1-logLik(modam1t)/logLik(nullmodel)
#Comparing Ab models with and without Am as a predictor variable plotting ROC curves
library(ROCR)
#Obtain true positives and false positives for the first model
pred1 <- prediction(fitted(modab), trainAB$Ab)
stats1a <- performance(pred1, 'tpr', 'fpr')
#Same for the second model
pred2 <- prediction(fitted(modab2), trainAB$Ab)
stats2 <- performance(pred2, 'tpr', 'fpr')
#Plot
mod1.lab <- expression('Model A - Endemic')
mod2.lab <- expression('Model B - Endemic + invasive as a predictor')
plot([email protected][[1]], [email protected][[1]], type='s', [email protected], [email protected], col=1,
lwd=2, lty=1)
lines([email protected][[1]], [email protected][[1]], type='s', col="grey70", lty=1, lwd=2)
legend('right', c(mod1.lab, mod2.lab), col=c(1,'grey70',1), lwd=c(2,2,1), lty=1, cex=.9, bty='n')
#SPECIES DISTRIBUTION MAPS
#Modelling and mapping the endemic species distribution with the potential occurrence of the invasive as a
predictor variable is not possible because AM’s values of potential presence and habitat are highly correlated
##Import environmental variables
library(raster)
Chuva = raster("C:/Users/ASUS/Desktop/rasteraligned/Chuva.tif")
NAvalue(Chuva) <- -3.4028234663852886e+38
par(mfrow=c(1,1),mar=c(2,4,2,4))
plot(Chuva)
Slope = raster("C:/Users/ASUS/Desktop/rasteraligned/Slope.tif")
NAvalue(Slope) <- 3.4028234663852886e+38
plot(Slope)
cTPI_005 = raster("C:/Users/ASUS/Desktop/rasteraligned/cTPI_005.tif")
NAvalue(cTPI_005) <- 255
plot(cTPI_005)
LU2016 = raster("C:/Users/ASUS/Desktop/rasteraligned/LU2016.tif")
NAvalue(LU2016) <- 255
plot(LU2016)
rivers = raster("C:/Users/ASUS/Desktop/rasteraligned/rivers.tif")
NAvalue(rivers) <- -999
plot(rivers)
SRTM = raster("C:/Users/ASUS/Desktop/rasteraligned/SRTM.tif")
NAvalue(SRTM) <- -32768
plot(SRTM)
#Stack rasters
rasters <- stack(SRTM, Slope, cTPI_005, LU2016, Chuva, rivers, bands=NULL)
names(rasters)
plot(rasters)
##Predict
par()
par(mfrow=c(1,2),mar=c(2,2,2,2))
#Am distribution map
AMdis <- predict(rasters, modam , type="response")
plot(AMdis, xaxt='n', yaxt='n', main = "Archachatina marginata")
writeRaster(AMdis, 'AM6var.tif')

71
#Same for Ab
#ANOVA between the two Ab models
anova(modab, modab2, test="Chisq")
#Represent categorical variables_Am
library(ggplot2)
y<-categorical_var_represent
yhab<-y[1:8,6:8]
yhab
g <- ggplot(yhab, aes(x=Land_use, y=Frequency))
g + geom_bar(aes(fill=Class),stat="identity", width = 0.5)
yTPI<-y[1:10,6:8]
yTPI
t <- ggplot(yTPI, aes(x=TPI, y=Frequency_1))
t + geom_bar(aes(fill=Class_TPI),stat="identity", width = 0.5)
#Same for Ab
library(ggplot2)
y<-categorical_ab
yhab<-y[1:8,7:9]
yhab
g <- ggplot(yhab, aes(x=Land_use, y=Frequency))
g + geom_bar(aes(fill=Class),stat="identity", width = 0.5)
yTPI<-y[1:10,21:23]
yTPI
t <- ggplot(yTPI, aes(x=TPI_1, y=Frequency_1))
t + geom_bar(aes(fill=Class_TPI),stat="identity", width = 0.5)
#Representing continuous variables_Am
x<-ModelsFinal9
op<-par(mfrow=c(1,2),mar=c(4,4,1,1))
plot(x$SRTM,x$Am,xlab="Elevation (m)",ylab="Species presence")
go=glm(Am~SRTM,family=binomial,x)
curve(predict(go,data.frame(SRTM=x),type="resp"),add=TRUE)
points(x$SRTM,fitted(go),pch=20)
plot(x$Chuva,x$Am,xlab="Mean Annual Precipitation (mm)",ylab="Species presence")
gol=glm(Am~Chuva,family=binomial,x)
curve(predict(gol,data.frame(Chuva=x),type="resp"),add=TRUE)
points(x$Chuva,fitted(gol),pch=20)
# Same for AB
#All the island-wide modelling analysis was repeated for the buffer area and considering only the forested areas
inside this area.
#2) HABITAT ASSOCIATIONS
#VEGETATION COMPOSITION NMDS
#Import X20m150_ABU.csv
mdad<-X20m150_ABU
names(mdad)
str(mdad)
library(vegan)
library(FactoMineR)
mdad1<-mdad[,7:108]
names(mdad1)
veg <- decostand(mdad1,"hell",diag=T,upper=T)
dveg <- vegdist(veg,diag=T,upper=T,method="jaccard")
vmds <- metaMDS(dveg,trymax=999)
vmds
str(vmds)
#Graphs
op<-par(mfrow=c(1,1))
plot(vmds,type="n",display="sites", xlab="NMDS Axis 1", ylab="NMDS Axis 2", xlim=c(-0.6,0.6))
points(vmds$points[,1],vmds$points[,2],pch=19,cex=mdad$Abs*0.2,col=adjustcolor("black"))
points(vmds$points[,1],vmds$points[,2],pch=24,cex=mdad$Am*0.6,col="black", bg="white",lwd=1.5)
points(vmds$points[,1],vmds$points[,2],pch=23,cex=mdad$Ab*0.6,col="black", bg="gray87",lwd=1.5)
72
points(vmds$points[,1],vmds$points[,2],pch=1,cex=mdad$Both*3,col="darkgrey",lwd=3)
points(vmds$points[,1],vmds$points[,2],pch=24,cex=mdad$Both*0.6,col="black",bg="white",lwd=1.5)
##Variables NMDS
op<-par(mfrow=c(1,1))
plot(vmds,display="sites",type="n",xlab="NMDS1",ylab="NMDS2", xlim=c(-0.6,0.6), ylim=c(-0.5,0.5))
ef1<-envfit(vmds,mdad1, permu = 999)
ef1
plot(ef1, p.max = 0.001,col=grey(0.1))
###To know vectors length factor
vegan:::ordiArrowMul(scores(ef1, display="vectors"))
##Density curves graph
###Import vmds1 csv
vmds1 <- read.csv("C:/Users/Ricardo/Desktop/Martina_20_06_17/vmds1.csv", sep=";")
names(vmds1)
vmds2<-vmds1[,10:12]
names(vmds2)
Am0x<-density(vmds2$Am.2[1:52],from=-0.6,to=0.8)$x
Am0y<-(density(vmds2$Am.2[1:52],from=-0.6,to=0.8)$y-density(vmds2$Absence.2[1:84],from=-
0.6,to=0.8)$y)
Ab0x<-(density(vmds2$Ab.2[1:17],from=-0.6,to=0.8)$x)
Ab0y<-(density(vmds2$Ab.2[1:17],from=-0.6,to=0.8)$y-density(vmds2$Absence.2[1:84],from=-0.6,to=0.8)$y)
###Plot
plot(Am0x,Am0y,ylim=c(-1.5,2),xlim=c(-0.6,0.6),type="n",lwd=1, xlab="NMDS Axis 1",ylab="Density")
abline(h=0)
lines(Am0x,Am0y,lwd=5)
lines(Ab0x,Ab0y,lwd=5,col="grey")
#Species presence in function of NMDS axis 1 and 2
op<-par(mfrow=c(1,2))
boxplot(vmds$points[,1]~mdad$AmPA)
cor.test(vmds$points[,1],mdad$AmPA,method="spearman")
boxplot(vmds$points[,2]~mdad$AmPA)
cor.test(vmds$points[,2],mdad$AmPA,method="spearman")
#Same for Ab
#Tests for groups dispersion_presence/absence (PERMDISP2)
#Am
op<-par(mfrow=c(1,2))
vdispAM<-betadisper(dveg,AM)
plot(vdispAM)
boxplot(vdispAM)
anova(vdispAM)
permutest(vdispAM)
#Same for Ab
#Exportar coordenadas axis 1 and 2
mdad$nmds1<-as.numeric(vmds$points[,1])
mdad$nmds2<-as.numeric(vmds$points[,2])
list(mdad$nmds1)
list(mdad$nmds2)
library(WriteXLS)
write.table(mdad$nmds1, file='vmds1.csv', sep=';', dec=',', row.names=FALSE)
write.table(mdad$nmds2, file='vmds2.csv', sep=';', dec=',', row.names=FALSE)
#SUBSTRATE COMPOSITION NMDS
##Import NMDSsoil.csv
mdada<-NMDSsoil[,8:16]
names(mdada)
mmdsS<-metaMDS(mdada,trymax=999)
mmdsS
str(mmdsS)
#Graphs
##Points NMDS
73
op<-par(mfrow=c(1,1))
plot(mmdsS,type="n",display="sites", xlab="NMDS Axis 1", ylab="NMDS Axis 2", xlim=c(-0.6,0.6))
points(mmdsS$points[,1],mmdsS$points[,2],pch=19,cex=NMDSsoil$Abs*0.2,col=adjustcolor("black"))
points(mmdsS$points[,1],mmdsS$points[,2],pch=24,cex=NMDSsoil$AmABU*0.6,col="black",
bg="white",lwd=1.5)
points(mmdsS$points[,1],mmdsS$points[,2],pch=23,cex=NMDSsoil$AbABU*0.6,col="black",
bg="gray87",lwd=1.5)
points(mmdsS$points[,1],mmdsS$points[,2],pch=1,cex=NMDSsoil$Both*3,col="darkgrey",lwd=3)
points(mmdsS$points[,1],mmdsS$points[,2],pch=24,cex=NMDSsoil$Both*0.8,col="black",bg="white",lwd=1.5
)
ef2<-envfit(mmdsS,mdada, permu = 999)
ef2
plot(ef2, p.max = 0.001,col=grey(0.4))
#Species presence in function of NMDS axis 1 and 2
#AM_Presence/absence
op<-par(mfrow=c(1,2))
boxplot(mmdsS$points[,1]~NMDSsoil$Am)
cor.test(mmdsS$points[,1],NMDSsoil$Am,method="spearman")
boxplot(mmdsS$points[,2]~NMDSsoil$Am)
cor.test(mmdsS$points[,2],NMDSsoil$Am,method="spearman")
#Same for Ab
#Exportar coordenadas MMDS axis 1 and 2_ Same as for the vegetation comp. analysis
# HABITAT ASSOCIATIONS MODELS
##Import matrix Final Model.csv
mdata<-FinalModel
names(mdata)
str(mdata)
library(vegan)
library(FactoMineR)
#Correlation between variables_ Same as the island-wide analysis
#Veg 20m and Veg 2m are correlated, I remove Veg axis 1 2m, Veg axis 2m because the 20m measures is more
complete, I remove Veg axis 1 because correlated with Habitat
#Perform models
names(mdata[,3:15])
#Categorical variables
mdata$Slope<-as.factor(mdata$Slope)
mdata$Understorydensity<-as.factor(mdata$Understorydensity)
mdata$Habitat<-as.factor(mdata$Habitat)
#TOTAL
#GLM_AM paper 2
modAM<-
glm(Am~Ab+Veg_2+Substr_1+Substr_2+Altitude+TreeDistance+CanopyCover+Ntrees+Understorydensity+Ha
bitat+Slope,data=mdata, family=binomial)
summary(modAM)
#GLM_AM paper 1 (without Ab occurrence)
modAM1<-
glm(Am~Veg_2+Substr_1+Substr_2+Altitude+TreeDistance+CanopyCover+Ntrees+Understorydensity+Habitat
+Slope,data=mdata, family=binomial)
summary(modAM1)
#GLM_AB
modAB<-
glm(Ab~Am+Veg_2+Substr_1+Substr_2+Altitude+TreeDistance+CanopyCover+Ntrees+Understorydensity+Ha
bitat+Slope,data=mdata, family=binomial)
summary(modAB)
#VIFs, Dredge and Model Averaging_ Same as the island-wide analysis
#POPULATION AGE STRUCTURE
##Import Shell Length1.csv
length<-Shell_length1
74
op<-par(mfrow=c(1,3))
#Differente in between species’ shell length and width
library(car)
shapiro.test(length$ABLength)
leveneTest(length$ShellLength, length$Species)
wilcox_test(length$ABLength, length$AMLength)
wilcox.test(length$Abwidth, length$Amwidth)
#Density plots
library(plyr)
library(ggplot2)
t<-Shell_lengthFIN
mu <- ddply(t, "Species_2", summarise, grp.mean=mean(StSW))
head(mu)
legth<-ggplot(length, aes(x=StShellLength, fill=factor(Species))) +
geom_density(alpha=0.4)+geom_vline(data=mu, aes(xintercept=grp.mean, color=Species), linetype="dashed")+
labs(title="",x="Shell Length / Maximum Shell Length", y = "Density")
width<-ggplot(t, aes(x=StSW, fill=factor(Species_2))) + geom_density(alpha=0.4)+geom_vline(data=mu,
aes(xintercept=grp.mean, color=Species_2), linetype="dashed")+ labs(title="",x="Shell Width / Maximum Shell
Width", y = "Density")
#Histograms
op<-par(mfrow=c(1,2),mar=c(4,4,1,1), xlab="Shell length (cm)")
hist(length$AMLength, breaks=20, main="", xlim=range(0:15), xlab="Invasive snail - Shell length (cm)",
ylab="Frequency")
abline(v=8.5,lwd=3)
#Same for Ab
hist(length$Amwidth, breaks=25, main="", xlab="Shell width (cm)", ylab="Frequency", xlim=range(0:8))
#Same for Ab
#Correlation shell length and shell width
cor.test(length$ABLength,length$Abwidth,method="spearman")
cor.test(length$AMLength,length$Amwidth,method="spearman")
#AM_ POPULATION STRUCTURE vs HABITATS
#Import x.csv
library(ggplot2)
theme_set(theme_classic())
x<-AMclassesPOPHab
x1<-x[,8:11]
names(x1)
# Histogram
g <- ggplot(x1, aes(x=Habitat, y=Frequence))
c<- g + geom_bar(aes(fill=Class),stat="identity", width = 0.5)+ ylab("Frequency(%)")+ xlab("")
c + scale_fill_grey(start = 0, end = .9)+ theme_bw()
#Test for significance between groups and habitats
#Import M.csv
(Xsq <- chisq.test(M)) # Prints test summary
Xsq$observed # observed counts (same as M)
Xsq$expected # expected counts under the null
Xsq$residuals # Pearson residuals
Xsq$stdres # standardized residuals
#ABUNDANCE IN FUNCTION OF ALTITUDE AND HABITAT
library(ggplot2)
#Import TUDO.csv
#Starting point separation between forest and non- forested areas
ggplot(GraphTR,aes(x=Transects,y=Elevation))+labs(x="Distance from forest limits (m)",y="Elevation
(m)")+geom_point(aes(size=ABUND,shape=factor(SPECIES),color=factor(SPECIES)))+geom_point(aes(color
=factor(Habitat)))+scale_color_manual(values=c("palegreen3","palegreen4","palegreen3","lightyellow3","steelb
lue3","black","black","black"),labels=c("HABITAT","Native forest","Secondary forest","Non-
forestal","Rivers","","",""),name="")+scale_shape_manual(values=c(1,3,24,23,1),name="SPECIES",labels=c("",
"Rivers","A.marginata","A.bicarinata","Both species"))+ geom_vline(xintercept = 0)
75
#ACTIVITY PATTERNS
#Import act.csv
names(act)
par(mfrow=c(2,1),mar=c(2,4,1,6))
barplot(height=act$ABActivo,xlim=c(0,18),ylim=c(0,1),ylab="Active A. bicarinata (%)")
barplot(height=act$AMActivo, names.arg=act$Hour,xlim=c(0,18),ylim=c(0,1),ylab="Active A. marginata (%)")
hist(x=act$ABActivo, width=act$AB.h,xlim=c(0,18),ylim=c(0,1))
barplot(height=act$ABActivo, xlim=c(0,18),ylim=c(0,1))
barplot(height=act$AMActivo, xlim=c(0,18),ylim=c(0,1))
barplot(height=act$ABActivo)
barplot(height=act$AMActivo,ylim=c(0,1))
library(ggplot2)
ggplot(act[,4:5])
#KW TEST SPECIES ABUNDANCE/HABITAT
#AM
KWtest1$Habitat <- as.factor(KWtest1$Habitat)
kruskal.test(KWtest1$AmAbu,KWtest1$Habitat)
dunn.test.control(KWtest1$AmAbu, KWtest1$Habitat)
#Same for Ab
#3) INTERVIEWS
#Import BP.csv
#Age_Rec Photos
dat<-InterviewANalys
hist(dat$Idade, xlab="Age of the interwieved", breaks=90)
op<-par(mfrow=c(1,2),mar=c(4,4,1,1))
#Ab
plot(dat$Idade_1,dat$BP,xlab="Age of the interviewed",ylab="Endemic recognizance", main="")
gi=glm(BP~Idade_1,family=binomial,dat)
curve(predict(gi,data.frame(Idade_1=x),type="resp"),add=TRUE)
points(dat$Idade_1,fitted(gi),pch=20)
cor.test(dat$Idade_1,dat$BP, method="spearman")