biohydrogen production from waste glycerol and sludge by anaerobic mixed cultures
TRANSCRIPT
ww.sciencedirect.com
i n t e r n a t i o n a l j o u r n a l o f h y d r o g e n en e r g y 3 7 ( 2 0 1 2 ) 1 3 7 8 9e1 3 7 9 6
Available online at w
journal homepage: www.elsevier .com/locate/he
Biohydrogen production from waste glycerol and sludgeby anaerobic mixed cultures
Sureewan Sittijunda a,b, Alissara Reungsang a,c,*aDepartment of Biotechnology, Faculty of Technology, Khon Kaen University, Khon Kaen 40002, ThailandbCenter for Alternative Energy Research and Developement, Khon Kaen University, Khon Kaen 40002, Thailandc Fermentation Research Center for Value-Added Agricultural Products, Khon Kaen University, Khon Kaen 40002, Thailand
a r t i c l e i n f o
Article history:
Received 5 December 2011
Received in revised form
23 March 2012
Accepted 24 March 2012
Available online 22 April 2012
Keywords:
Biohydrogen
Co-digestion
Waste glycerol
Sludge
* Corresponding author. Department of BioTel./fax: þ66 43 362 121.
E-mail address: [email protected] (A. Re0360-3199/$ e see front matter Copyright ªdoi:10.1016/j.ijhydene.2012.03.126
a b s t r a c t
Key factors affecting biohydrogen production from waste glycerol and sludge by anaerobic
mixed cultures were optimized using response surface methodology (RSM) with central
composite design (CCD). Investigated parameters were waste glycerol concentration,
sludge concentration, and the amount of Endoenutrient addition. Concentrations of waste
glycerol and sludge had a significant individual effect on hydrogen production rate (HPR)
( p � 0.05). The interactive effect on HPR ( p � 0.05) was found between waste glycerol
concentration and sludge concentration. The optimal conditions for the maximum HPR
were: waste glycerol concentration 22.19 g/L, sludge concentration 7.16 g-total solid (TS/L),
and the amount of Endoenutrient addition 2.89 mL/L in which the maximum HPR of
1.37 mmol H2/L h was achieved. Using the optimal conditions, HPR from a co-digestion of
waste glycerol and sludge (1.37 mmol H2/L h) was two times greater than the control (waste
glycerol without addition of sludge) (0.76 mmol H2/L h), indicating a significant enhance-
ment of HPR by sludge. Major metabolites of the fermentation process were ethanol,
1,3-propanediol (1,3-PD), lactate, and formate.
Copyright ª 2012, Hydrogen Energy Publications, LLC. Published by Elsevier Ltd. All rights
reserved.
1. Introduction glycerol which is a good carbon source for dark fermentation
Recently, biohydrogen production has received an increasing
attention due to a high demand of sustainable energy [1].
Biologically, hydrogen can be produced by photo and dark
fermentations [1]. Dark fermentation has advantages over
photo fermentation process in terms of better cost-effective,
higher rate of hydrogen production, and the ability to utilize
various kinds of substrates [1,2].
Waste glycerol generated during biodiesel production
process can also be utilized as feed stock for hydrogen
production [3,4]. Waste glycerol contains high content of
technology, Faculty of T
ungsang).2012, Hydrogen Energy P
of biohydrogen. However, waste glycerol lacks nitrogen
source which is essential for growth and activities of micro-
organisms during a production of hydrogen. Therefore,
nitrogen source to co-digest with waste glycerol is needed to
achieve maximum production of hydrogen [4]. In this
research, sludge from wastewater treatment plant was used
to co-digest with waste glycerol to produce hydrogen owing to
its high nitrogen and carbon contents [5]. Successful efforts
for the co-digestion of sludge with several other substrates to
produce hydrogen and methane have been reported such as
with confectionery waste [6], food waste [7], coffee waste [8],
echnology, Khon Kaen University, Khon Kaen 40002, Thailand.
ublications, LLC. Published by Elsevier Ltd. All rights reserved.
i n t e rn a t i o n a l j o u r n a l o f h y d r o g e n en e r g y 3 7 ( 2 0 1 2 ) 1 3 7 8 9e1 3 7 9 613790
organic fraction of municipal solid waste [9], sludge from the
pulp and paper industry [10], and grease-trap sludge from
meat processing plant [11]. However, information on co-
digestion usage of sludge and waste glycerol for hydrogen
production is still limited. Therefore, the attempt of this study
is to explore the possibility of using sludge to co-digest with
waste glycerol for biohydrogen production.
Inorder tomaximizehydrogenproduction, the optimization
of fermentation conditions especially environmental factors
and nutritional, are needed. Optimal substrate concentration
could increase the efficiency of hydrogen production of the
hydrogen producers [12]. Lower or higher substrate concentra-
tion than the optimum level could result in the adverse effects
on hydrogen producers by causing substrate limitation and
substrate inhibition, respectively [12,13]. Nitrogen is required
for the synthesis of nucleic acid, protein and enzyme. Appro-
priate concentration of nitrogen could enhance bacterial
growthandactivity [5,12]. Endoenutrient is oftenused to enrich
microorganisms capable of producinghydrogen. The important
elements contained in the Endoenutrient such as Cuþ2, Coþ2,
Mg2þ and Fe2þ are essential for microorganisms growth
and hydrogenase activity which is an important enzyme for
hydrogen production [12,14].
Accordingly, in the present work, sludge was used to co-
digest with waste glycerol for producing hydrogen by anaer-
obic mixed cultures. RSM with CCD was employed in order to
investigate the effects of key factors and improve HPR. Results
from this study help reduce the amount of these two wastes
(waste glycerol and sludge) and add value by converting them
into energy (hydrogen). In addition, the information obtained
would pave the way toward continuous hydrogen production
from waste glycerol and sludge.
2. Materials and methods
2.1. Substrates
Waste glycerol was obtained from the biodiesel production
process of the Krungtep Produce Public Company Limited,
Saraburi Province, Thailand. The company produces fried
chicken using approximately 202.60 tons/month of oil with
Table 1 e Compositions of waste glycerol and sludge.
Waste glycerol
Parameters Concentration
Glycerol (g/L) 441.26
Total nitrogen (g-N/L) 0.50
Total phosphorus (g-P/L) 0.05
Salt (NaCl) (g/L) 10.00
Methanol (g/L) 230.00
an average 44,000 L of biodiesel and 4400 L of waste glycerol
generated monthly.
Sludge was taken from the dissolved air floatation tank of
the wastewater treatment plant of Charoen Pokphand Foods
Public Company Limited, Nakhonratchasima, Thailand. The
company produces 5000 tons/day of frozen meat product and
1600 tons/day of ready meal. The plant handles an average of
6500 m3 of wastewater and generates 70e80 tons of sludge
daily. Chemical characteristics of waste glycerol and sludge
are shown in Table 1.
2.2. Inoculum preparation
The anaerobic granule obtained from an upflow anaerobic
sludge blanket (UASB) reactor was used as seed inoculum for
hydrogen production. This UASB reactor was used for
methane production from wastewater of brewery production
process. The UASB granule was pretreated at 105 �C for 2 h in
a hot air oven (LDO-100E, Daihan Labtech Co., Ltd., Korea) to
inactivate methanogenic bacteria. The inoculum was
prepared by cultivating 150 g of heat treated UASB granules in
1 L laboratory glass bottle containing 550 mL of 25 g/L pure
glycerol as carbon source with a supplementation of 1 mL/L of
Endoenutrient solution [14]. The culture was adjusted to the
initial pH of 5.5 with 1 mol/L NaOH or 1 mol/L HCl. The glass
bottle was capped with rubber stopper and flushed with
nitrogen gas for 20 min to create anaerobic conditions. The
culture was incubated on the shaker at room temperature
(35 � 2 �C) at 150 rpm. Every 7 days, 50% of culture broth was
replaced with the fresh medium containing 25 g/L of pure
glycerol. This process was repeated until constant hydrogen
production volume was observed (6 times sub-culture). The
obtained culture was used as the seed inoculum for hydrogen
production. The pH and volatile suspended solid (VSS)
concentration of the seed inoculums were 5.50 and 14.15 g-
VSS/L, respectively.
2.3. Experimental design
CCD was used to optimize environmental factors including
waste glycerol concentration (g/L) (X1), sludge concentration
(g-TS/L) (X2), and the amount of Endoenutrient addition
(mL/L) (X3). The response variable is HPR (YHPR) (Table 2). The
Poultry slaughterhouse sludge
Parameters Concentration
tCOD (g/L) 128.85
sCOD (g/L) 41.38
Total nitrogen (g-N/L) 69.15
Total phosphorus (g-P/L) 10.06
Volatile fatty acid (g CH3COOH/L) 18.84
Total solid (TS) (g/L) 40.10
Volatile solid (VS) (g/L) 34.48
Fat concentration (g/L) 5.38
Carbohydrate concentration (g/L) 0.63
Soluble protein concentration (g/L) 11.72
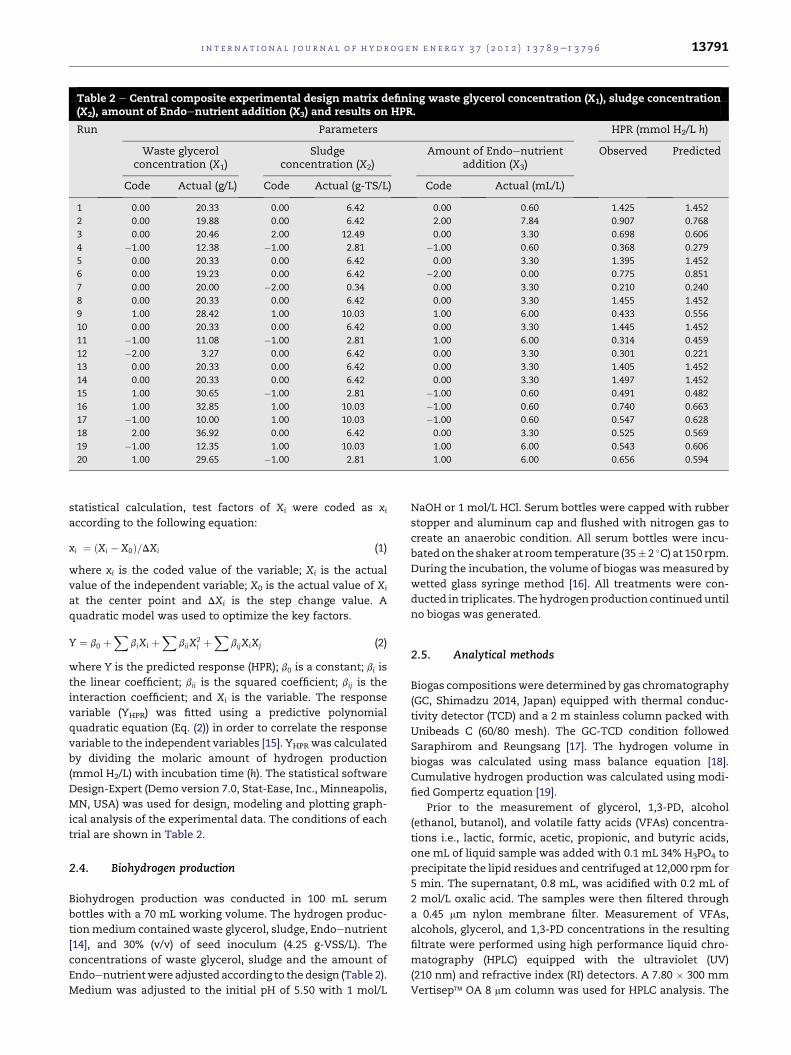
Table 2 e Central composite experimental design matrix defining waste glycerol concentration (X1), sludge concentration(X2), amount of Endoenutrient addition (X3) and results on HPR.
Run Parameters HPR (mmol H2/L h)
Waste glycerolconcentration (X1)
Sludgeconcentration (X2)
Amount of Endoenutrientaddition (X3)
Observed Predicted
Code Actual (g/L) Code Actual (g-TS/L) Code Actual (mL/L)
1 0.00 20.33 0.00 6.42 0.00 0.60 1.425 1.452
2 0.00 19.88 0.00 6.42 2.00 7.84 0.907 0.768
3 0.00 20.46 2.00 12.49 0.00 3.30 0.698 0.606
4 �1.00 12.38 �1.00 2.81 �1.00 0.60 0.368 0.279
5 0.00 20.33 0.00 6.42 0.00 3.30 1.395 1.452
6 0.00 19.23 0.00 6.42 �2.00 0.00 0.775 0.851
7 0.00 20.00 �2.00 0.34 0.00 3.30 0.210 0.240
8 0.00 20.33 0.00 6.42 0.00 3.30 1.455 1.452
9 1.00 28.42 1.00 10.03 1.00 6.00 0.433 0.556
10 0.00 20.33 0.00 6.42 0.00 3.30 1.445 1.452
11 �1.00 11.08 �1.00 2.81 1.00 6.00 0.314 0.459
12 �2.00 3.27 0.00 6.42 0.00 3.30 0.301 0.221
13 0.00 20.33 0.00 6.42 0.00 3.30 1.405 1.452
14 0.00 20.33 0.00 6.42 0.00 3.30 1.497 1.452
15 1.00 30.65 �1.00 2.81 �1.00 0.60 0.491 0.482
16 1.00 32.85 1.00 10.03 �1.00 0.60 0.740 0.663
17 �1.00 10.00 1.00 10.03 �1.00 0.60 0.547 0.628
18 2.00 36.92 0.00 6.42 0.00 3.30 0.525 0.569
19 �1.00 12.35 1.00 10.03 1.00 6.00 0.543 0.606
20 1.00 29.65 �1.00 2.81 1.00 6.00 0.656 0.594
i n t e r n a t i o n a l j o u r n a l o f h y d r o g e n en e r g y 3 7 ( 2 0 1 2 ) 1 3 7 8 9e1 3 7 9 6 13791
statistical calculation, test factors of Xi were coded as xiaccording to the following equation:
xi ¼ ðXi � X0Þ=DXi (1)
where xi is the coded value of the variable; Xi is the actual
value of the independent variable; X0 is the actual value of Xi
at the center point and DXi is the step change value. A
quadratic model was used to optimize the key factors.
Y ¼ b0 þX
biXi þX
biiX2i þ
XbijXiXj (2)
where Y is the predicted response (HPR); b0 is a constant; bi is
the linear coefficient; bii is the squared coefficient; bij is the
interaction coefficient; and Xi is the variable. The response
variable (YHPR) was fitted using a predictive polynomial
quadratic equation (Eq. (2)) in order to correlate the response
variable to the independent variables [15]. YHPR was calculated
by dividing the molaric amount of hydrogen production
(mmol H2/L) with incubation time (h). The statistical software
Design-Expert (Demo version 7.0, Stat-Ease, Inc., Minneapolis,
MN, USA) was used for design, modeling and plotting graph-
ical analysis of the experimental data. The conditions of each
trial are shown in Table 2.
2.4. Biohydrogen production
Biohydrogen production was conducted in 100 mL serum
bottles with a 70 mL working volume. The hydrogen produc-
tionmedium containedwaste glycerol, sludge, Endoenutrient
[14], and 30% (v/v) of seed inoculum (4.25 g-VSS/L). The
concentrations of waste glycerol, sludge and the amount of
Endoenutrientwere adjusted according to the design (Table 2).
Medium was adjusted to the initial pH of 5.50 with 1 mol/L
NaOH or 1 mol/L HCl. Serum bottles were capped with rubber
stopper and aluminum cap and flushed with nitrogen gas to
create an anaerobic condition. All serum bottles were incu-
bated on the shaker at room temperature (35� 2 �C) at 150 rpm.
During the incubation, the volume of biogas was measured by
wetted glass syringe method [16]. All treatments were con-
ducted in triplicates. Thehydrogenproduction continueduntil
no biogas was generated.
2.5. Analytical methods
Biogas compositionswere determined by gas chromatography
(GC, Shimadzu 2014, Japan) equipped with thermal conduc-
tivity detector (TCD) and a 2 m stainless column packed with
Unibeads C (60/80 mesh). The GC-TCD condition followed
Saraphirom and Reungsang [17]. The hydrogen volume in
biogas was calculated using mass balance equation [18].
Cumulative hydrogen production was calculated using modi-
fied Gompertz equation [19].
Prior to the measurement of glycerol, 1,3-PD, alcohol
(ethanol, butanol), and volatile fatty acids (VFAs) concentra-
tions i.e., lactic, formic, acetic, propionic, and butyric acids,
one mL of liquid sample was added with 0.1 mL 34% H3PO4 to
precipitate the lipid residues and centrifuged at 12,000 rpm for
5 min. The supernatant, 0.8 mL, was acidified with 0.2 mL of
2 mol/L oxalic acid. The samples were then filtered through
a 0.45 mm nylon membrane filter. Measurement of VFAs,
alcohols, glycerol, and 1,3-PD concentrations in the resulting
filtrate were performed using high performance liquid chro-
matography (HPLC) equipped with the ultraviolet (UV)
(210 nm) and refractive index (RI) detectors. A 7.80 � 300 mm
Vertisep� OA 8 mm column was used for HPLC analysis. The

Table 3 e Model coefficients estimated by multiple linearregressions (significance of regression coefficients).
Factors HPR (mmol H2/L h)
Coefficient estimate Probability
Model 1.44,835 < 0.0001
X1 0.11,077 0.0039
X2 0.10,845 0.0036
X3 �0.03023 0.3169
i n t e rn a t i o n a l j o u r n a l o f h y d r o g e n en e r g y 3 7 ( 2 0 1 2 ) 1 3 7 8 9e1 3 7 9 613792
HPLC condition followed the method described by Selembo
et al. [20]. Detection limit for VFAs was 0.002% (w/v). Detection
limit for glycerol, 1e3 PD, ethanol and butanol was 0.009% (w/
v). The regression coefficient (R2) of the standard curves for
analyzing concentrations of VFAs, glycerol, 1e3 PD, ethanol
and butanol are in the ranges of 0.97e0.99. Total nitrogen and
phosphorus were measured according to the AOAC method
[21]. Total COD (tCOD) and TS weremeasured according to the
standard method [22].
X1X2 �0.05136 0.0098X1X3 �0.06198 0.2249
X2X3 �0.11,971 0.1531
X12 �0.37,237 < 0.0001
X22 �0.36,257 < 0.0001
X32 �0.22,242 < 0.0001
2.6. Calculation of chemical oxygen demand (COD)balance
Concentrations of each fermentative product and biomass
were converted to the COD concentration (g-COD/L) followed
the method described by Adrianus and Jeroen [23]. The
fermentative products included 1,3-PD, ethanol, lactic, formic,
acetic, propionic and butyric acids. The COD distribution of
each fermentative product was calculated bymultiplying COD
concentration with 100 and then divided by COD concentra-
tion of glycerol consumed. The COD distribution for glycerol
consumption was set to �100. The COD balance was then
calculated as follows:
COD balance ð%Þ¼COD distribution of substrate consumption
þX
ðCOD distribution of fermentative
products and biomassÞ ð3Þ
3. Results and discussions
3.1. Effects of waste glycerol concentration, sludgeconcentration and the amount of Endoenutrient addition onHPR
The effects of waste glycerol concentration (X1), sludge
concentration (X2) and the amount of Endoenutrient addition
(X3) on HPR were investigated. Regression analysis of the data
from Table 2 resulted in the quadratic equation (Eq. (4)) as
follows:
YHPR ¼ 1:4483þ 0:110X1 þ 0:108X2 � 0:030X3 � 0:051X1X2
� 0:062X1X3 � 0:119X2X3 � 0:372X21 � 0:362X2
2 � 0:222X23
(4)
The model presented a high determination coefficient
(R2¼ 0.97) explaining 97% of the variability in the response and
a high value of the adjusted determination coefficient
(adjusted R2¼ 0.94) suggested a high significance of themodel.
A very low probability ( p < 0.0001) obtained from the regres-
sion analysis of variance (ANOVA) demonstrated that the
model was significant.
The significance of each coefficient was determined by
probability values (Table 3). Linear terms of waste glycerol
concentration (X1) and sludge concentration (X2) showed
a significant individual effect on HPR ( p � 0.05). The quadratic
model terms of all variables (X12,X2
2 andX32) are highly significant
( p< 0.0001).Asignificant interactiononHPRwas foundbetween
waste glycerol concentration and sludge concentration (X1X2)
( p � 0.05). The optimum conditions to maximize the HPR were
calculatedusingEq. (4). Themaximumresponsevalue forHPRof
1.46 mmol H2/L h was estimated at a waste glycerol concentra-
tion of 22.19 g/L, sludge concentration of 7.16 g-TS/L, and the
amount of Endoenutrient addition of 2.89 mL/L.
Response surface plots are based on Eq. (4) with one vari-
able kept constant at its optimum level, and varying the other
two variables within the experimental range (Fig. 1aec). HPR
increased with an increase in waste glycerol concentration
from 10 to 22.19 g/L but decreased with further increase of
waste glycerol concentration over 22.19 g/L (Fig. 1a and b). An
increase in substrate concentration within an optimal range
could increase the ability of hydrogen producing bacteria to
produce hydrogen. However, increasing the concentration of
substrate reducedHPR due to substrate inhibition [12,13,24]. In
addition, waste glycerol contains some impurities such as
NaCl, and methanol. Thus, a high concentration of waste
glycerol could contribute to a high concentration of NaCl
which is toxic to microorganisms [25e27]. Consequently, low
HPR was obtained at high waste glycerol concentration.
HPR increased with an increase in the amount of
Endoenutrient addition from 0.60 to 2.89 mL/L (Fig. 1b and c).
Endoenutrient contains elements that are essential for cell
synthesis such as Fe2þ, Co2þ, Cu2þ, and Mg2þ. Fe2þ is the most
important element in hydrogen production because it forms
ferredoxin in hydrogenase enzyme which is directly respon-
sible for hydrogen formation [12]. Co2þ and Cu2þ are the
enzyme cofactors [14,28]. Mgþ2 plays a role in the stability of
all polyphosphate compounds in the cell, including those
associatedwith DNA and RNA synthesis [29]. In addition,Mgþ2
is required for the biologically activity of ATP which is the
main source of energy in cells [29]. NaHCO3 and NH4HCO3 in
the Endoenutrient can prevent the dramatically decreased of
pH occurred during the acidogenesis phase (accumulation of
VFAs) of hydrogen production process [12]. A decrease of HPR
was found when the amount of Endoenutrient addition was
greater than 2.89 mL/L.
Fig. 1a and c revealed that an increase in sludge concen-
tration from 2.81 g-TS/L to 7.16 g-TS/L resulted in an increase
in HPR and decreased when concentration of sludge was
greater than 7.16 g-TS/L. The addition of sludge increased the
concentration of nitrogen due to its high nitrogen content
(Table 1). Nitrogen is a very important component of protein,
nucleic acid and enzyme that are of great significance to the

10.00 15.00
20.00 25.00
30.00
0.2
0.525
0.85
1.175
1.5
10.00 15.00
20.00 25.00
30.00
0.60 1.95
3.30 4.65
6.00
0.3
0.6
0.9
1.2
1.5
0.60 1.95
3.30 4.65
6.00
0.2
0.525
0.85
1.175
1.5
Waste glycerol
conc. (g/L)
Endo–nutrient
(mL/L)
HP
R(m
mol
H2/
L h
)a
c
b
HP
R(m
mol
H2/
L h
)
Waste glycerol
conc. (g/L)
Sludge conc.
(g-TS/L)
10.028.04
6.414.61
2.81
HP
R(m
mol
H2/
L h
)
Endo–nutrient
(mL/L)
Sludge conc.
(g-TS/L)
10.028.04
6.414.61
2.81
Fig. 1 e Response surface plots showing the effects of
waste glycerol concentration, sludge concentration and
their mutual interaction on HPR with optimum level of
Endoenutrient addition (2.89 mL/L) (a); the effects of waste
glycerol concentration, amount of Endoenutrient addition
and their mutual interaction on HPR with optimum level of
sludge concentration (7.16 g-TS/L) (b); the effects of sludge
concentration, amount of Endoenutrient addition and their
mutual interaction on HPR with optimum level of waste
glycerol concentration (22.19 g/L) (c).
i n t e r n a t i o n a l j o u r n a l o f h y d r o g e n en e r g y 3 7 ( 2 0 1 2 ) 1 3 7 8 9e1 3 7 9 6 13793
growth of hydrogen producing bacteria [7,12]. Therefore, an
increase in nitrogen concentration to the optimum require-
ment of microorganisms could increase the synthesis of
protein, nucleic acid and enzyme. However, a high concen-
tration of ammonia ion released from protein containing in
the sludge develops osmotic pressure inside the microbial
cells due to the permeation of water molecules out of the
microbial cells. Hence, a reduction of hydrogen production
occurred [30].
3.2. Confirmation experiment
Three replications of batch fermentation experiments were
conducted under optimum, low (runs 4), medium (runs 1, 5, 8,
10, 13, 14) and high (runs 20) (Table 4) to confirm the validity of
the obtained model. The results of the confirmation experi-
ments were in close agreement with the predicted values of
HPR. The HPR of 1.37 mmol H2/L h was obtained at the
optimum condition (Table 4) which was only 6.16% different
from the predicted value (1.46mmol H2/L h). Results suggested
that the model obtained from CCD experiment is valid.
ThemaximumHPR (1.37mmol H2/L), obtained in this study
was comparable to the HPR (0.98 mmol H2/L) reported by
Seifert et al. [25] whom produced hydrogen from 30 g/L waste
glycerol by anaerobic mixed cultures. However, our HPR was
much lower than the HPR obtained from 20.40 g/L waste
glycerol by Klebsiella pneumoniae (17.88 mmol H2/L h) [31]
(Table 5). The discrepancy might be due to the types of inoc-
ulums i.e. mixed cultures vs. pure culture. Using the mixed
cultures as the seed inoculums has more advantages than
pure culture in terms of low operation cost (sterilization cost),
easy to operate, and less sensitive to changes in environ-
mental factors [1,2,12]. Our results suggested that in order to
efficiently utilize waste glycerol as feed stock to produce
hydrogen, some strategies for improved hydrogen production
is needed. These include blocking the pathway of 1,3-PD,
inhibition of lactic acid production by adding itaconic acid to
substrate [32], and blocking the pathways of organic acid
formation using the proton-suicide technique with NaBr and
NaBrO3 [33].
Using optimum conditions, production of hydrogen from
waste glycerol (control) was conducted to examine the effect
of sludge addition on HPR. Results indicated that HPR
obtained from waste glycerol (0.76 mol H2/L h) was approxi-
mately two times lesser than from waste glycerol and sludge
(1.37 mol H2/L h) indicating a significant enhancement of HPR
by sludge.
3.3. Metabolites production and COD balance
Metabolites production and COD balancewas shown in Tables
4 and 6. The COD balance at low, medium, high, optimum and
control were 2.68, 7.86, 11.33, 3.22, and 8.78% error indicating
that the measurements of metabolites were quite accurate.
Ethanol, 1,3-PD, lactic acid and formic acid are the major
metabolites in the fermentation broth of waste glycerol and
sludge (Table 4). Minor metabolites are propionic butyric and
acetic acids. No butanol was detected. High concentrations of
ethanol, and formic acid were coincided with the high HPR
obtained at optimum and medium conditions. The additional
of sludge enhanced the formic and ethanol production which
coincided with higher HPR.
The present of ethanol and 1,3-PD in fermentation broth
indicated that the microorganisms degraded waste glycerol
through both oxidative and reductive pathways [34]. A low

Table 5 e Comparison of HPR from waste glycerol using various types of bacteria.
Inoculum Substrate Media component and condition HPR(mmol H2/L h)
References
Klebsiella pneumonia Waste glycerol (all in g/L): 20.40 waste glycerol; 5.70 KCl; 13.80
NH4Cl; 1.50 CaCl2; 3.00 yeast extract pH 6.5;
Temp 37 �C; 10% (v/v) inoculum
17.88 31
Anaerobic digested sludge
from municipal wastes
Waste glycerol (all in g/L): 30.00 waste glycerol; 1.00 NaHCO3; 0.50
NH4Cl; 0.25 KH2PO4; 0.25 K2HPO4; 0.32 MgSO4$7H2O; 0.05
FeCl3; 0.03 NiSO4; 0.05 CaCl2; 0.007 Na2B2O7$H2O;
0.014(NH4)6Mo7O21; 0.023 ZnCl2; 0.021 CoCl2$H2O; 0.01
CuCl2$H2O; 0.03 MnCl2$4H2O; 0.86 yeast extract
Inoculum 5.80 g-VSS/L; Temp 37 �C
0.98 25
UASB granules from
wastewater of the beer
production process
Waste glycerol 22.19 g/L waste glycerol; 2.89 mL/L Endoenutrient pH 5.5;
Temp 35 �C; inoculum 4.25 g-VSS/L
0.76 This study
UASB granules from
wastewater of the beer
production process
Waste glycerol
and sludge
22.19 g/L waste glycerol; 7.16 g-TS/L sludge; 2.89 mL/L
Endoenutrient pH 5.5; Temp 35 �C; inoculum 4.25 g-VSS/L
1.37 This study
Table 4 eMetabolites concentration and HPR at the end of fermentative hydrogen production in confirmation experiment.
Parameters/Trails Low Medium High Optimum Control
Waste glycerol concentration (g/L) 10.00 20.33 32.85 22.19 22.19
Sludge concentration (g-TS/L) 2.81 6.42 10.02 7.16 e
Amount of Endoenutrient addition (mL/L) 0.60 3.30 6.00 2.89 2.89
HPR (mmol H2/L h) 0.41 0.82 0.34 1.37 0.76
1,3-PD (mmol/L) 19.06 64.67 82.45 70.29 42.50
Ethanol (mmol/L) 28.92 68.74 25.83 118.84 49.57
Lactic acid (mmol/L) 15.73 39.01 28.98 44.94 13.78
Formic acid (mmol/L) 20.88 13.91 18.22 50.88 20.17
Acetic acid (mmol/L) 6.47 11.47 5.01 4.14 3.83
Propionic acid (mmol/L) 8.99 36.24 27.29 34.48 13.65
Butyric acid (mmol/L) 5.17 6.86 3.81 9.11 13.98
Table 6 e Hydrogen production, metabolites production and COD balance at the end of fermentation.
Products Concentration (g-COD/L) COD distribution (%)
Low Medium High Optimum Control Low Medium High Optimum Control
Substrate consumption 10.59 31.68 26.62 37.89 21.04 �100.00 �100.00 �100.00 �100.00 �100.00
Hydrogen 0.06 0.11 0.08 0.12 0.10 0.61 0.35 0.30 0.31 0.47
1,3-PD 2.43 8.26 10.53 8.97 5.43 22.98 26.06 39.54 23.69 25.79
Ethanol 2.78 6.61 2.48 11.43 4.77 26.25 20.86 9.33 30.15 22.65
Lactic acid 1.51 3.76 2.79 4.33 1.33 14.30 11.86 10.48 11.42 6.31
Formic acid 0.34 0.22 0.29 0.82 0.36 3.17 0.71 1.10 2.16 1.70
Acetic acid 0.42 0.74 0.32 0.27 0.25 0.25 2.32 1.21 0.70 1.17
Propionic acid 1.01 4.05 3.05 3.85 1.53 9.49 12.78 11.45 10.17 7.25
Butyric acid 0.83 1.10 0.61 1.46 2.24 7.82 3.47 2.29 3.85 10.64
Biomass 1.32 4.35 3.45 5.43 3.21 12.46 13.73 12.96 14.33 15.26
Balance �2.68 �7.86 �11.33 �3.22 �8.78
i n t e rn a t i o n a l j o u r n a l o f h y d r o g e n en e r g y 3 7 ( 2 0 1 2 ) 1 3 7 8 9e1 3 7 9 613794
hydrogen production obtained in this study is coincided with
the detection of 1,3-PD and lactic acid (Table 4, 6). This is
because for production of one mol of 1,3-PD, one mol of H2 is
consumed whereas production of lactic acid does not yield
hydrogen [25,34].
3.4. Energy conversion efficiency of the process
The total energy efficiency of glycerol was calculated based on
heat of combustion of glycerol, ethanol and hydrogen of 1674,
1377, and 285 kJ/mol, respectively. Under the optimum
i n t e r n a t i o n a l j o u r n a l o f h y d r o g e n en e r g y 3 7 ( 2 0 1 2 ) 1 3 7 8 9e1 3 7 9 6 13795
conditions, a maximum hydrogen yield was 0.30 mol H2/mol
glycerol while a maximum ethanol yield was 1.10 mol
ethanol/mol glycerol (data not shown). Therefore, the energy
conversion efficiency for hydrogen was [(0.30∙285)/1674]∙100% ¼ 5.10%, and for ethanol was [(1.10∙1377)/1674]∙100%¼ 90.69%. So, the total energy conversion efficiencywas
95.79%. Our results suggested that the co-production of
hydrogen and ethanol from waste glycerol would be more
efficient than a production of hydrogen alone.
4. Conclusions
This study employed the statistical methodology, RSM with
CCD, to optimize the environmental factors that bring
maximum HPR from a co-digestion of waste glycerol with
sludge. The results demonstrated that the statistical experi-
ment design is an effective tool to optimize the effects of
environmental factors on HPR. Experimental results illus-
trated that waste glycerol and sludge concentration had
a significant individual effect on HPR. Interaction effect on
HPR was found between waste glycerol concentration and
sludge concentration. Optimum conditions formaximumHPR
were: waste glycerol concentration 22.19 g/L, sludge concen-
tration 7.16 g-TS/L, and the amount of Endoenutrient addition
2.89 mL/L. Under optimum conditions, a maximum HPR of
1.37 mmol H2/L h was achieved which was two times greater
than the control (waste glycerol without addition of sludge)
(0.76 mmol H2/L h), indicating a significant enhancement of
HPR by sludge.
Acknowledgments
The authors acknowledge Ph.D. Scholarship to SS from Office
of the Higher Education Commission, Thailand, under the
Program Strategic Scholarship for Frontier Research Network
for the Ph.D. Program/Thai Doctoral Degree. Additional
acknowledge goes to research funds from the Research Group
for Development of Microbial Hydrogen Production Process
from Biomass, the Higher Education Research Promotion and
the National Research University Project through Biofuels
Research Cluster-Khon Kaen University, Office of the Higher
Education Commission.
r e f e r e n c e s
[1] Hawkes FR, Hussy I, Kyazze G, Dinsdale R, Hawkes DL.Continuous dark fermentative hydrogen production bymesophilic microflora: principles and progress. Int JHydrogen Energy 2007;32:172e84.
[2] Das D, Veziroglu TN. Hydrogen production by biologicalprocesses: a survey of literature. Int J Hydrogen Energy 2001;26:13e28.
[3] Temudo MF, Poldermans R, Kleerebezem R, vanLoosdrecht MCM. Glycerol fermentation by open mixedcultures: a chemostat study. Biotechnol Bioeng 2008;100(6):1088e98.
[4] da Silva GP, Mack M, Contiero J. Glycerol: a promising andabundant carbon source for industrial microbiology.Biotechnol Advan 2009;27:30e9.
[5] Sreela-or C, Plangklang P, Imai T, Reungsang A. Co-digestionof food waste and sludge for hydrogen production byanaerobic mixed cultures: statistical key factorsoptimization. Int J Hydrogen Energy 2011;36:14227e37.
[6] Lafitte-Trouque S, Forster CF. Dual anaerobic co-digestion ofsewage sludge and confectionery waste. Bioresour Technol2000;71:77e82.
[7] Kim SH, Han SK, Shin HS. Feasibility of biohydrogenproduction by anaerobic co-digestion of food waste andsewage sludge. Int J Hydrogen Energy 2004;29:1607e16.
[8] Neves L, Oliveira R, Alves MM. Anaerobic co-digestion ofcoffee waste and sewage sludge. Waste Manage 2006;26:176e81.
[9] Del Borghi A, Converti A, Palazzi E, Del Borghi M. Hydrolysisand thermophilic anaerobic digestion of sewage sludge andorganic fraction of municipal solid waste. Bioprocess Eng1999;20:553e60.
[10] Einola JK, Luostarinen SA, Salminen EA, Rintala JA. Screeningfor an optimal combination ofmunicipal and industrialwastesand sludges for anaerobic co-digestion. In: Proceedings of the9th world congress, anaerobic digestion 2001:anaerobicconversion for sustainability, 1; 2011. p. 357e62.
[11] Davidsson A, Lavstedt C, la Cour Jansen J, Gruvberger C,Aspegren H. Co-digestion of grease trap sludge and sewagesludge. Waste Manage 2008;28:986e92.
[12] Wang J, Wan W. Factors influencing fermentative hydrogenproduction: a review. Int J Hydrogen Energy 2009;34:799e811.
[13] Antonopoulou G, Gavala HN, Ioannis VS, Gerasimos L. Effectof substrate concentration on fermentative hydrogenproduction from sweet sorghum extract. Int J HydrogenEnergy 2011;36:4843e51.
[14] Lin CY, Lay CH. A nutrient formulation for fermentativehydrogen production using anaerobic sewage sludgemicroflora. Int J Hydrogen Energy 2005;30:285e92.
[15] Lay JJ. Modeling and optimization of anaerobic digestedsludge converting starch to hydrogen. Biotechnol Bioeng2002;68:269e78.
[16] Owen WF, Stuckey DC, Healy Jr JB, Young LY, McCarty PL.Bioassay for monitoring biochemical methane potential andanaerobic toxicity. Water Res 1979;13:485e93.
[17] Saraphirom P, Reungsang A. Optimization of biohydrogenproduction from sweet sorghum syrup using statisticalmethods. Int J Hydrogen Energy 2010;35(24):13435e44.
[18] Zheng XJ, Yu HQ. Inhibitory effects of butyrate on biologicalhydrogen production with mixed anaerobic cultures.J Environ Manage 2005;74:66e70.
[19] Onodera H, Miyahara T, Noike T. Infuence of ammoniaconcentration on hydrogen transformation of sucrose.Asian Waterqual ‘99 the 7th IAWQ Asia-Pacific RegionalConference, Taipei, Taiwan, Conference Preprint, vol. 2, 1999.p.1139e44.
[20] Selembo PA, Perez JM, Lloyd WA, Logan BE. Enhancedhydrogen and 1,3-propanediol production from glycerol byfermentation using mixed cultures. Biotechol Bioeng 2009;104(6):1098e105.
[21] AOAC. Official method of analysis of AOAC international/William Herwitz. 17th ed. Gaithersburg, Maryland: AOACInternational; 2000.
[22] APHA. Standard methods for examination of water andwastewater. 19th ed. Washington, DC, USA: American PublicHealth Association; 1998. p.1220.
[23] Adrianus van H, Jeroen van der L. Handbook biological wastewater treatment: measurement of organic material.Netherlands: Leidschendam; 2007. pp. 8e10.
[24] Pattra S, Sangyoka S, Boonmee M, Reungsang A. Bio-hydrogen production from the fermentation of sugarcane
i n t e rn a t i o n a l j o u r n a l o f h y d r o g e n en e r g y 3 7 ( 2 0 1 2 ) 1 3 7 8 9e1 3 7 9 613796
bagasse hydrolysate by Clostridium butyricum. Int J HydrogenEnergy 2008;33:5256e65.
[25] Seifert K, Waligorska M, Wojtowski M, Laniecki M. Hydrogengeneration from glycerol in batch fermentation process. Int JHydrogen Energy 2009;34:3671e8.
[26] Ito T, Nakashimada Y, Senba K, Matsui T, Nishio N. Hydrogenand ethanol production from glycerol-containing wastedischarged after biodiesel manufacturing process. J BiosciBioeng 2005;100(3):260e5.
[27] Jitrwung R, Yargeau V. Optimization of media compositionfor the production of biohydrogen from waste glycerol. Int JHydrogen Energy 2011;36:9602e11.
[28] Lay CH. Effects of nutrients on anaerobic hydrogenproduction. Master Degree Thesis, Feng Chia University,Taiwan; 2002.
[29] Angelidaki I, Sanders W. Assessment of the anaerobicbiodegradability of macropollutants. Rev Environ Sci Bio/Technology 2004;3:117e29.
[30] Sreela-or C, Imai T, Plangklang P, Reungsang A. Optimizationof key factors affecting hydrogen production from foodwaste by anaerobic mixed cultures. Int J Hydrogen Energy2011;36:14120e33.
[31] Liu F, Fang B. Optimization of biohydrogen production frombiodiesel wastes by Klebsiella pneumoniae. Biotechnol J 2007;2:374e80.
[32] Ngo TA, Sim SJ. Dark fermentation of hydrogen from wasteglycerol using hyperthermophilic eubacterium Thermotoganeapolitana. Environ Prog Sustainable Energy; 2011.doi:10.1002/ep.
[33] Kumar N, Das D. Continuous hydrogen production byimmobilized Enterobacter cloacae IIT-BT 08 usinglignocellulosic material as solid matrices. Enzym MicrobiolTechnol 2001;29:280e7.
[34] Biebl H, Menzel AP, Zeng W, Deckwer D. Microbialproduction of 1,3-propanediol. Appl Microbiol Biotechnol1999;52:289e97.