biohydrogen production from specified risk materials co-digested with cattle manure
TRANSCRIPT
i n t e r n a t i o n a l j o u r n a l o f h y d r o g e n e n e r g y 3 5 ( 2 0 1 0 ) 1 0 9 9 – 1 1 0 5
Avai lab le a t www.sc iencedi rec t .com
j ourna l homepage : www.e lsev ier . com/ loca te /he
Biohydrogen production from specified risk materialsco-digested with cattle manure
Brandon H. Gilroyed a,b, Chunli Li a, Xiying Hao a, Angus Chu b, Tim A. McAllister a,*a Agriculture and Agri-Food Canada, Lethbridge Research Centre, P.O. Box 3000, Lethbridge, Alberta T1J 4B1, Canadab Department of Civil Engineering, Schulich School of Engineering, University of Calgary, Calgary, Alberta T2N 1N4, Canada
a r t i c l e i n f o
Article history:
Received 15 September 2009
Received in revised form
18 November 2009
Accepted 19 November 2009
Available online 6 December 2009
Keywords:
SRM
Hydrogen
Anaerobic digestion
Fermentation
* Corresponding author. Tel.: þ1 403 381 515E-mail address: [email protected]
0360-3199/$ – see front matter Crown Copyrigdoi:10.1016/j.ijhydene.2009.11.072
a b s t r a c t
Biohydrogen production from the anaerobic digestion of specified risk materials (SRM) co-
digestedwith cattle manure wasassessedin a 3� 5 factorial design.Totalorganic loading rates
(OLR) of 10, 20, and 40 g L�1 volatile solids (VS) were tested using manure:SRM (wt/wt) mixtures
of 100:0 (control), 90:10, 80:20, 60:40, and 50:50 using five 2 L continuously stirred biodigesters
operating at 55 �C.Gas sampleswere taken daily todetermine hydrogenproduction, andslurry
samples were analyzed daily for volatile fatty acid (VFA) concentration, total ammonia
nitrogen (TAN), and VS degradation. Hydrogen production (mL g�1 VS fed) varied quadratically
according to OLR (P< 0.01), with maximum production at OLR20, while production decreased
linearly (P< 0.0001) asSRMconcentration increased. Reducedhydrogenproduction associated
with SRM inclusion at>10% VS may be attributed to a rapid increase in TAN (r¼�0.55) or other
inhibitors such as long chain fatty acids. Reduced hydrogen production (P< 0.01) at OLR40
versus OLR20 may be related to increased rate of VFA accumulation and final VFA concen-
tration (P< 0.001), as well as inhibition due to hydrogen accumulation (P< 0.001). Biohydrogen
production from SRMco-digestedwith cattlemanure may not befeasible onanindustrialscale
due to reduced hydrogen production with increasing levels of SRM.
Crown Copyright ª 2009 Published by Elsevier Ltd on behalf of Professor T. Nejat Veziroglu.
All rights reserved.
1. Introduction In order to collect hydrogen as an end product of fermen-
Hydrogen, which is a clean and renewable fuel with high
energy density (122 kJ g�1), has the potential to become a green
source of energy in the future if renewable production levels
can be increased in tandem with the development of efficient
storage technology. Hydrogen can be produced biologically
through the anaerobic digestion (AD) of organic waste, coupling
energy production with waste treatment in a similar fashion to
methane producing AD systems [1]. In contrast to methane
production via AD, which results principally in the conversion
of biodegradable substrates to CH4 and CO2, hydrogen is an
intermediate product of acidogenesis and acetogenesis in the
anaerobic fermentation pathway.
0; fax: þ1 403 352 4526.(T.A. McAllister).ht ª 2009 Published by Else
tation, consumption of hydrogen by methanogenic bacteria
must be prevented [2]. This can be accomplished by reducing
the fermentation pH to �6.0 [1], increasing dilution rates or
shortening retention time [3]. Treatment of the inoculum with
heat can also be used to inactivate methanogenic bacteria
within the overall bacterial community [4]. Removal of meth-
anogenic bacteria from the AD system alters the overall efficacy
of degradation, resulting in elevated concentrations of volatile
fatty acids (VFA) which in turn inhibit continued substrate
degradation [5]. As such, removal of chemical oxygen demand,
which is used as an indicator of the efficiency of biodegrada-
tion, is typically less than 20% in fermentative biohydrogen
systems [6]. The conversion of substrate to VFA under hydrogen
vier Ltd on behalf of Professor T. Nejat Veziroglu. All rights reserved.

i n t e r n a t i o n a l j o u r n a l o f h y d r o g e n e n e r g y 3 5 ( 2 0 1 0 ) 1 0 9 9 – 1 1 0 51100
producing conditions has been adapted for use in two-stage AD
systems, in which acid production occurs during the first step
and subsequent methanogenesis takes place in a separate
reactor in the second step [7]. Depending on the substrate, two-
stage processes enable a higher conversion of biomass to
biogas than single stage digestion, making the process more
efficient and economical [8].
The microbial community present during the production of
hydrogen differs from that present during methane produc-
tion, particularly if fermentation is occurring under conditions
of low pH or if the inoculum is heat-treated [9]. This may result
in altered degradation efficiency and could influence the
characteristics of the effluent generated during AD. The effi-
cacy of pathogen inactivation during AD is typically consid-
ered to be based on a time–temperature relationship [10].
However, the efficacy of pathogen inactivation during AD
under hydrogen producing conditions has not been well
studied [11].
Specified risk materials (SRM) are a waste byproduct of the
agricultural slaughter industry, consisting of tissues which
are deemed most likely to contain prions. Prions are the
infectious protein particles (e.g., PrPBSE, PrPSc, PrPCWD)
thought to cause transmissible spongiform encephalopathies
such as bovine spongiform encephalopathy in cattle, scrapie
in sheep, and chronic wasting disease in cervids, respec-
tively. Bovine SRM include the brain, spinal cord, dorsal
ganglia, distal ileum, eyes, tongue, and tonsils of slaughtered
cattle �30 months of age, and the distal ileum of cattle <30
months of age. These tissues are collected and disposed of in
an effort to prevent the infective agent from entering the
food chain [12]. Cattle with BSE have been identified in
Canada, the United States, Europe, and Japan, the disease
believed to have arisen mainly from consumption of meat
and bone meal (MBM) contaminated with PrPBSE. To prevent
future outbreaks of BSE in Canada, a feed ban was instituted
in 1997 that prohibits the feeding of ruminant MBM to cattle.
This ban was enhanced in 2003 to restrict the feeding of SRM
to all livestock, as well as to exclude SRM as a fertilizer.
Consequently, the z250,000 tonnes of SRM produced annu-
ally in Canada has become an economic liability for the beef
industry as much of it is currently rendered and landfilled,
a practice that is environmentally questionable [13,14]. As
a result, alternative methods of SRM disposal which will be
both economically sound and environmentally responsible
are being investigated. We have previously investigated the
biodigestion of SRM as a means of methane production [15],
as well as the composting of SRM and the value of the
finished compost as a fertilizer [16,17].
The purpose of this study was to evaluate the hydrogen
production potential of SRM when co-digested with cattle
manure at different ratios and with different organic loading
rates (OLR) during AD.
2. Materials and methods
2.1. Materials
A 5� 3 factorial experiment evaluating the hydrogen produc-
tion potential of five ratios (wt:wt dry organic matter) of
manure:SRM (100:0, 90:10, 80:20, 60:40, 50:50) at three different
organic loading rates (OLR, 10, 20, 40 g volatile solids L�1) was
performed using five 2-L bench scale batch fermenters (Mini-
fors, Infors AG, Switzerland). Each of the 15 treatment types
was repeated in quadruplicate, for a total of 60 individual runs
(12 batches using 5 fermenters). Digesters were mixed
continuously at 600 rpm and maintained at 55 �C for a total of 4
days for each replicate.
Specified risk materials were obtained from a slaughter-
house and homogenized using a Waring blender. The homog-
enate was divided into aliquots (250 mL) which were frozen at
�21 �C until subsequent use. A subsample was evaluated for
volatile solid (VS) content according to standard methods [18].
Fresh cattle manure was collected from the concrete pad of
a feedlot to exclude bedding material prior to each batch run.
Manure was evaluated for VS content, and stored at 4 �C until
use (<72 h). Immediately prior to fermentation, cattle manure
was added to an aluminum tray and placed in an oven set to
90 �C for 3 h in order to inactivate methanogens as described by
Oh et al. [19]. Aliquots of manure, SRM, and distilled water were
combined and mixed in a Waring blender to produce 1.6 L of
slurry with the desired manure:SRM ratios and OLR prior to
addition to the fermenters. Helium was used to flush the
headspace of each fermenter prior to sealing. Slurry samples
were taken daily, analyzed for pH, and then frozen at�21 �C for
subsequent analysis.
2.2. Analyses
Total gas production was monitored daily using a water
displacement apparatus. Gas samples were taken daily and
stored in evacuated 6.8 mL Exetainers� (Labco Limited, UK)
until analyzed by gas chromatography (GC). The concentra-
tions of H2, N2, CO2, and CH4 were determined using a 2-
channel GC (Varian 4900 micro GC, Varian Inc., Palo Alto, CA)
equipped with a thermal conductivity detector and
a 2 m� 2 mm (inside diameter) stainless steel column packed
with Porapak N (80–100 mesh). Injector and column tempera-
tures were kept at 110 �C and 40 �C, respectively, for H2, and N2
analysis on Channel A, and 110 �C and 60 �C, respectively, for
CH4 and CO2 analysis on Channel B. Channel A used argon as
a carrier gas and helium was the carrier gas for Channel B, with
the carrier gasses for both channels maintained at a static
pressure of 150 kPa.
Slurry aliquots were analyzed for VS according to standard
methods [18]. Samples for VFA analysis were centrifuged at
13,000 g for 10 min, followed by acidification of the superna-
tant (1000 mL) with 25% m-HPO3 (200 mL). Samples were allowed
to stand for 30 min and then centrifuged again at 13,000 g for
10 min. A 1000 mL sample was used for VFA determination
using crotonic acid as an internal standard. VFA (acetate,
propionate, butyrate, isobutyrate, valerate, isovalerate, and
caproate) were analyzed using a Varian 3800 GC (Varian Inc.,
Palo Alto, CA) equipped with a flame ionization detector at
250 �C and a fused-silica capillary column (25 m� 0.32 mm
WCOT FFAP-CB). The oven temperature program was 80 �C for
5 min, ramp 20 �C min�1 to 225 �C for 8 min. The injector was
held at 280 �C and helium was used as the carrier gas with
a flow rate of 5 mL min�1. Total VFA concentration reported
was the sum of the concentrations of those VFA analyzed.

i n t e r n a t i o n a l j o u r n a l o f h y d r o g e n e n e r g y 3 5 ( 2 0 1 0 ) 1 0 9 9 – 1 1 0 5 1101
Slurry samples for NH4þ analysis were first centrifuged (10 min
at 13,000 g), and the supernatant was diluted either 50 or 100
times in deionized water to a final volume of 5 mL. Concen-
tration of NH4þ was determined colorimetrically at 650 nm
using an Auto Analyzer 3 (Branþ Luebbe, Germany).
Statistical analyses were performed using the general
linear models module of StatSoft Statistica version 8.0.
3. Results and discussion
3.1. Hydrogen concentration and production
Hydrogen concentration (%) in produced biogas decreased
linearly with both OLR (P< 0.001) and manure:SRM (P< 0.01)
over time (Fig. 1), with no interaction between the two (P> 0.05).
No methane was detected from the biogas in this study, which
suggests that the heat treatment employed had effectively
inactivated methanogens. In all treatments, maximum
hydrogen concentrations (H2max) were observed after 1 d, after
which point the concentration decreased (Fig. 1a and b).
Differences in hydrogen concentration among OLR treatments
were evident at 1 (P< 0.01) and 2 d (P< 0.001), but not for
Time (d)
0 1 2 3 4 5
H2 C
once
ntra
tion
(%)
0
10
20
30
40
50
OLR10OLR20OLR40
a
Time (d)
0 1 2 3 4 5
H2 C
once
ntra
tion
(%)
0
10
20
30
40
50
100:0 90:10 80:20 60:40 50:50
b
Fig. 1 – Variations in hydrogen concentration (% of total
biogas) over time in response to OLR (g LL1 VS fed) (a) and
manure:SRM (b). Values are means with standard error bars.
subsequent time intervals (P> 0.05). Hydrogen concentration
decreased most rapidly for OLR40 (slope¼�11.2) followed by
OLR20 (slope¼�8.9) and OLR10 (slope¼�5.7), respectively
(Fig. 1a). Based on manure:SRM, hydrogen concentration
decreased most rapidly for 90:10 (slope¼�10.4) followed by
100:0 (slope¼�8.9), 60:40 (slope¼�8.4), 80:20 (slope¼�8.3),
and 50:50 (slope¼�7.0) (Fig. 1b).
Maximum hydrogen concentration (%, denoted H2max)
showed 2-factor interactions between OLR and manure:SRM
(P< 0.001) (Table 1). H2max increased both linearly and
quadratically (P< 0.001) with increasing OLR. Conversely,
a linear decrease in H2max (P< 0.001) was observed as SRM
concentration increased. The greatest H2max (49.9%) was ach-
ieved with the 100:0 treatment at OLR40. The 60:40 treatment at
OLR10 had the lowest H2max (27.7%).
The total volume of hydrogen produced increased with
increasing OLR for all treatments tested (data not shown).
However, hydrogen production (mL H2 g�1 VS fed) was influ-
enced by both OLR and manure:SRM, with no interaction
between these two variables observed (Table 1). Hydrogen
production from the perspective of OLR was quadratic
(P< 0.001) with the greatest production found at OLR20. Inclu-
sion of SRM resulted in a linear (P< 0.001) decrease in hydrogen
production, although the difference in production between
100:0 and 90:10 was not significant (P> 0.05). At OLR10, differ-
ences in hydrogen production between manure:SRM treat-
ments were not significant (P> 0.05). However, differences
between manure:SRM treatments were significant at OLR20
(P< 0.01) and OLR40 (P< 0.001), with maximum hydrogen
production obtained when manure:SRM was 90:10 at both
OLR20 (33.1 mL g�1 VS fed) and OLR40 (27.3 mL g�1 VS fed)
(Table 1).
3.2. VS degradation
The percentage of VS degraded was dependent on OLR, dis-
playing a quadratic effect (P< 0.01) with maximum degra-
dation (41%) observed for the 90:10 treatment at OLR10
(Table 1).
3.3. VFA production
Total VFA production (Table 1) was dependent upon OLR
(P< 0.001) and manure:SRM (P< 0.01), with no interactions
between the two main effects (P> 0.05). Total VFA production
increased linearly (P< 0.001) with increasing OLR and
decreased linearly with the inclusion of SRM as substrate
(P< 0.01). The accumulation of VFA over time varied signifi-
cantly from the perspective of OLR (P< 0.001), with the rate of
increase greatest at OLR40 (slope¼ 6.2) and relatively less at
OLR20 (slope¼ 3.6) and OLR10 (slope¼ 1.4) (Fig. 2a). Variations
in total VFA accumulation over time were not different
(P> 0.05) among manure:SRM treatments (Fig. 2b). The overall
increase in total VFA as a percentage of the initial concen-
tration was not affected (P> 0.05) by OLR or manure:SRM.
Acetic acid was the predominant VFA present at 0 h for all
treatments, but declined after 1 d of AD (Fig. 2c). At 1 d, butyric
acid level increased for all treatments (Fig. 2d), followed by
a stabilization of the ratio of acetic acid to butyric acid (Fig. 2c
and d).

Ta
ble
1–
Hy
dro
gen
pro
du
ctio
na
nd
effl
uen
tch
ara
cteri
stic
sin
resp
on
seto
org
an
iclo
ad
ing
rate
an
dm
an
ure
:SR
M.
Va
lues
are
rep
lica
tea
vera
ges
(n[
4)±
sta
nd
ard
err
or.
OLR
(gV
SL�
1)
Ma
nu
re:S
RM
H2
pro
du
ctio
n(m
Lg�
1V
S)
Fed
)H
2m
ax
(%)
VS
degr
ad
ati
on
(%)
To
tal
VFA
(mM
)in
itia
lT
ota
lV
FA
(mM
)fi
na
lT
AN
(mg
L�
1)
init
ial
TA
N(m
gL�
1)
fin
al
pH
init
ial
pH
fin
al
10
100:0
24.0�
5.4
28.2�
1.2
37.6�
6.0
6.2�
1.1
11.5�
0.8
10.7�
0.7
39.0�
2.0
7.3�
0.2
6.0�
0.1
90:1
021.4�
6.6
37.2�
3.8
41.4�
5.2
5.0�
0.9
11.3�
0.6
11.3�
0.7
41.5�
5.7
7.4�
0.2
5.8�
0.1
80:2
011.7�
2.3
31.5�
1.6
38.6�
6.9
4.4�
0.8
10.2�
0.7
11.1�
0.7
58.0�
6.6
7.4�
0.1
6.1�
0.1
60:4
010.8�
1.3
27.7�
0.9
39.4�
3.6
3.3�
0.9
9.6�
0.6
11.0�
0.5
66.3�
5.8
7.3�
0.1
6.1�
0.1
50:5
015.3�
2.7
34.4�
0.6
32.6�
6.6
3.4�
0.9
10.3�
0.6
9.8�
0.5
71.9�
7.4
7.3�
0.1
6.0�
0.1
20
100:0
29.5�
2.3
48.3�
0.8
22.4�
0.3
10.1�
1.6
27.6�
4.2
25.9�
1.5
91.8�
6.2
7.1�
0.1
5.9�
0.1
90:1
033.1�
5.1
37.3�
2.0
27.3�
2.0
8.0�
1.0
25.5�
3.4
23.8�
2.4
95.3�
6.7
7.1�
0.1
5.9�
0.1
80:2
019.6�
2.1
44.3�
1.3
30.0�
2.0
8.0�
1.5
22.6�
2.7
22.7�
3.8
94.8�
4.0
7.0�
0.1
6.0�
0.1
60:4
017.9�
3.7
35.5�
2.0
32.2�
2.6
6.0�
1.0
21.1�
2.7
20.9�
1.5
128.1�
6.2
7.0�
0.1
6.0�
0.1
50:5
014.0�
1.3
39.9�
1.9
29.7�
1.8
5.4�
0.5
18.9�
1.9
18.3�
1.4
111.4�
11.7
7.0�
0.1
6.0�
0.1
40
100:0
19.9�
1.6
49.9�
1.0
29.7�
3.6
15.0�
2.0
47.2�
2.5
60.2�
6.6
240.4�
20.9
7.1�
0.2
6.3�
0.1
90:1
027.3�
1.7
46.2�
1.2
33.8�
4.6
17.4�
3.5
40.0�
1.1
64.4�
5.8
230.4�
19.0
7.3�
0.2
6.2�
0.1
80:2
019.4�
0.6
48.7�
0.8
32.6�
2.6
13.3�
1.5
40.2�
2.1
50.8�
4.3
237.4�
13.2
7.1�
0.1
6.1�
0.1
60:4
015.8�
0.2
44.8�
1.9
31.8�
3.6
11.4�
1.9
37.9�
2.5
39.2�
2.0
278.6�
22.7
6.9�
0.2
6.1�
0.1
50:5
010.3�
1.1
39.4�
3.4
27.5�
2.5
9.2�
1.3
34.6�
2.3
35.5�
1.6
295.6�
19.5
7.0�
0.2
6.2�
0.1
i n t e r n a t i o n a l j o u r n a l o f h y d r o g e n e n e r g y 3 5 ( 2 0 1 0 ) 1 0 9 9 – 1 1 0 51102
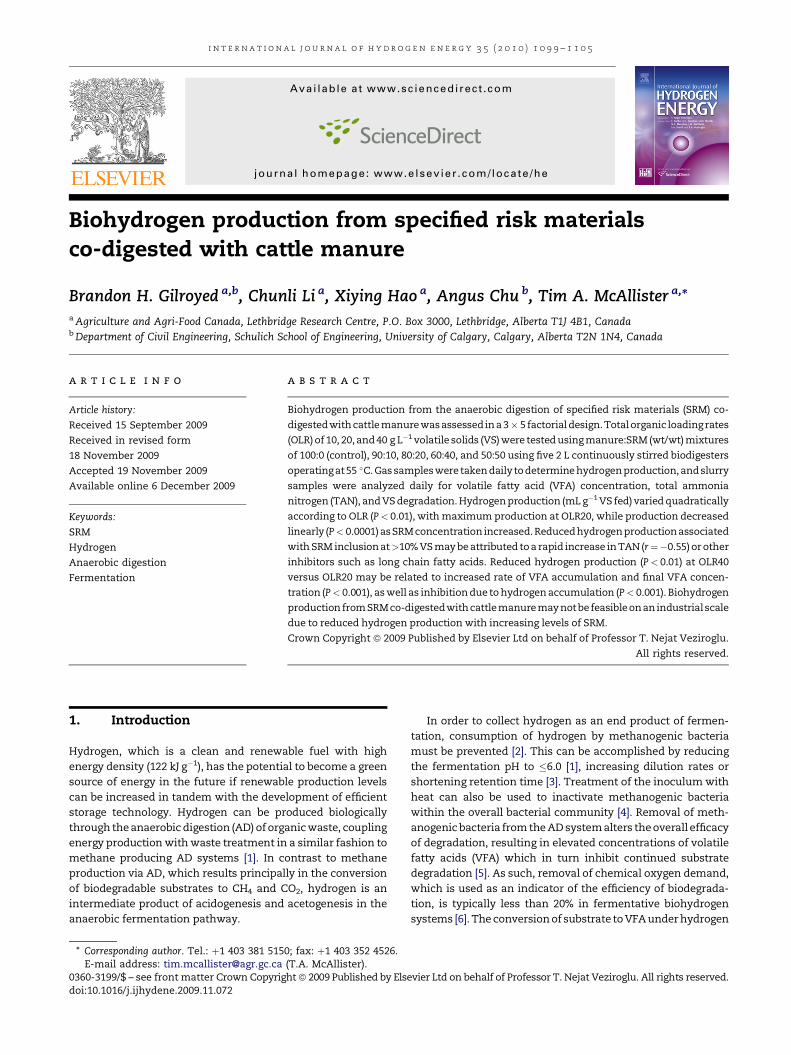
3.4. Total ammonia nitrogen production
Variation in TAN production was dependent upon OLR
(P< 0.001) and manure:SRM (P< 0.001), with no interaction
(P> 0.05) observed (Fig. 3a,b). TAN concentration increased
with increasing OLR, displaying a linear (P< 0.001) and
quadratic (P< 0.05) relationship. TAN concentration increased
linearly (P< 0.001) with increasing inclusion of SRM as
substrate. The overall increase in TAN concentration as
a percentage of the initial concentration was dependent on
manure:SRM (P< 0.001), linearly increasing with SRM concen-
tration, but was not dependent on OLR (P> 0.05).
3.5. Hydrogen production potential of SRM
The greatest hydrogen production (mL g�1 VS fed) was observed
for the 100:0 and 90:10 treatments, with increasing concentra-
tions of SRM resulting in reduced production (Table 1). It is
possible that inclusion of SRM reduced the diversity and
number of bacteria that were introduced into the biodigesters.
Lower microbial density could reduce the degradation of
substrate, and thus the amount of hydrogen produced.
However, our data show that there was no significant differ-
ence in VS degradation based on manure:SRM (Table 1). This
suggests that the microbial communities in each treatment
were capable of degrading VS to a similar extent despite
possible differences in the density and diversity of microbes
present in the initial inocula. This could be a function of the
degradability of the substrate, given that protein – and lipid-
rich SRM is more readily degradable than is cellulosic manure
[15]. This inherent dissimilarity could mask any potential
differences in overall degradation as a result of differences in
composition or microbial density. The fact that manure:SRM
did not influence VFA accumulation also suggests that
microbial populations had similar capacities to degrade the
substrates provided (Fig. 2b).
Free NH3 at concentrations exceeding 80 mg L�1 is known
to be toxic to the members of the microbial community
involved in methane production during AD, whereas NH4þ is
not inhibitory until concentrations exceed 1500 mg L�1 [20].
The effect of NH3 on hydrogen production via AD has been less
well studied. Zhu et al. [21] found that NH4þ concentrations of
170 mg L�1 did not inhibit hydrogen production. In contrast,
Wang et al. [22] showed that hydrogen production was
reduced when initial NH4þ concentrations exceeded
100 mg L�1. Salerno et al. [23] reported that total hydrogen
production was not inhibited by even higher (10 g L�1)
concentrations of ammonia, but that the lag time for
hydrogen production was substantially increased. Because
NH3 is produced during the deamination of amino acids, and
given the protein-rich nature of SRM [24], the observed
increase in TAN concentration based on the level of SRM
inclusion was anticipated and agrees with our previous find-
ings [15]. Given the acidic conditions present in this study
(Table 1) and ammonia’s pKa of 9.25, >99% of the ammonia
produced during AD would have been present in the ionized
form [25], indicating that inhibitory levels of free NH3, as
described above, were not reached. However, a negative
correlation (r¼�.55; P< 0.05) was observed between the rate
of hydrogen production (mL g�1 VS fed) and the increase in

Time (d)
0 1 2 3 4 5
Tota
l VFA
Con
cent
ratio
n (m
M)
0
10
20
30
40
50
OLR10 OLR20 OLR40
a
Time (d)
0 1 2 3 4 5
Tota
l VFA
Con
cent
ratio
n (m
M)
0
5
10
15
20
25
30
35
100:0 90:10 80:20 60:40 50:50
b
Time (d)
0 1 2 3 4 5
Acet
ic A
cid
(% T
otal
VFA
)
50
60
70
80
90
100
100:0 90:10 80:20 60:40 50:50
c
Time (d)
0 1 2 3 4 5
Buty
ric A
cid
(% T
otal
VFA
)
0
10
20
30
40
50
100:0 90:10 80:20 60:40 50:50
d
Fig. 2 – Total VFA (mM) accumulation over time in response to OLR (g LL1 VS fed) (a) and manure:SRM (b). Total VFA
concentration was initially composed almost entirely of acetic acid (c), but butyric acid levels rapidly increased in the first
24 h, then stabilized (d). Values are means with standard error bars.
i n t e r n a t i o n a l j o u r n a l o f h y d r o g e n e n e r g y 3 5 ( 2 0 1 0 ) 1 0 9 9 – 1 1 0 5 1103
TAN within the biodigesters. This suggests that the rapid
increase in TAN may have altered the microbial community in
some manner that was nonetheless inhibitory to hydrogen
production. Others have shown that an adequate period of
acclimation to increasing ammonia levels is necessary to
optimize hydrogen production [23], although the ammonia
concentrations observed in our study would still be consid-
ered to be relatively low. It is also possible that the negative
correlation between hydrogen production and TAN increase is
not due to a causative relationship. Rather, it may reflect an
inhibition attributable to a related metabolic process. For
example, as the lipid fraction of SRM was hydrolyzed, it is
possible that long chain fatty acids (LCFA) were released that
inhibited hydrogen production [26,27].
In the present study, hydrogen production was expected to
rank OLR40>OLR20>OLR10 as a result of the increasing
concentration of the substrate and inoculum with increasing
OLR. However, the hydrogen production of OLR40 was less
than that of OLR20, suggesting that other factors must have
contributed to the lower than expected production from
OLR40. VS degradation was actually lower for OLR20 than
OLR40, which suggests that the disparity in hydrogen
production was not a result of increased VS degradation in
OLR20. Rather, product (VFA) accumulation during degrada-
tion may have been responsible for the reduced hydrogen
production at OLR40. Total VFA concentration increased with
OLR, and the rate of increase was more rapid for OLR40 than
other treatments. Hydrogen production is a byproduct of
acidogenesis and the degradation of VFA to acetate, but the
thermodynamics of hydrogen-generating reactions are
unfavourable except under conditions of product (i.e., acetate
and hydrogen) removal [28]. Typically, methanogenic bacteria
fulfill this role by consuming acetate and hydrogen while
producing methane. However, in the absence of methano-
genic bacteria, as was the case in this study, an accumulation
of hydrogen and VFA can occur, causing inhibition of the
anaerobic degradation process [29]. The rapid increase and
higher concentration of total VFA likely accounts for the lower
hydrogen production observed with OLR40 as compared to
OLR10 and OLR20 treatments.
Further evidence of enhanced inhibition occurring at OLR40
is provided by the data obtained for H2max, which indicate that
the greatest hydrogen concentrations were observed for OLR40
(Fig. 3a). Given that high hydrogen concentrations are
Time (d)
0 1 2 3 4 5
TAN
(mg
L-1)
0
50
100
150
200
250
300
OLR10 OLR20 OLR40
a
Time (d)
0 1 2 3 4 5
TAN
(mg
L-1)
0
20
40
60
80
100
120
140
160
180
200
100:0 90:10 80:20 60:40 50:50
b
Fig. 3 – Changes in total ammonia nitrogen concentration
over time in response to OLR (g LL1 VS fed) (a) and
manure:SRM (b). Values are means with standard error bars.
i n t e r n a t i o n a l j o u r n a l o f h y d r o g e n e n e r g y 3 5 ( 2 0 1 0 ) 1 0 9 9 – 1 1 0 51104
inhibitory to further hydrogen production [30], the OLR40
treatment would be expected to be the most inhibited based on
H2max values. This is supported by the fact that after H2max was
reached, the rate of decrease in hydrogen concentration was
greatest for OLR40 (Fig. 3). Of the treatments examined, OLR10
also exhibited the lowest H2max and rate of decline in hydrogen
concentration, suggesting that hydrogen accumulation did not
inhibit hydrogen production. The level of substrate dilution
plays a key role in determining hydrogen production from
anaerobic systems [29]. The optimal OLR for hydrogen
production lies between 10 g VS L�1 and 40 g VS L�1, with
20 g VS L�1 demonstrating the greatest production in the
conditions tested here. This agrees with the findings of Argun
et al. [29], who found that the optimal substrate concentration
using powdered wheat starch was 20 g L�1.
Our findings suggest that SRM may not be a good candidate
for biohydrogen production using thermophilic AD, and
conversely, AD under hydrogen-producing conditions may not
be an ideal candidate for SRM treatment and disposal. Given
the reduced hydrogen production obtained at SRM levels
exceeding 10% of the substrate, industrial scale applications
may be unfeasible unless large quantities of manure are
available for co-digestion with SRM. It is possible that
enhanced hydrogen production from SRM could be achieved
using a continuous flow system in which acclimation of the
microbial community to both the substrate and end-product
accumulation (i.e., VFA, NH4þ) could occur. However, if LCFA
inhibition was responsible for reduced hydrogen production,
acclimation would not be expected to occur and hydrogen
production would remain poor [26]. Our previous findings
regarding production of methane from SRM co-digested with
manure indicated that biogas was enhanced more by the
inclusion of SRM at 37 �C than 55 �C [15]. It is possible that
mesophilic biohydrogen production would produce greater
yields than were observed in this study. However, we have
observed previously that hydrogen production was greater
under thermophilic conditions in AD that contained only heat-
treated manure [5]. Future studies could look at optimizing AD
temperature for biohydrogen production, or assessing the
feasibility of employing a two-stage system for SRM treatment
if hydrogen is a desired product of SRM treatment and
disposal.
4. Conclusions
The results of this study indicate that under thermophilic
conditions, including SRM as substrate at concentrations
>10% of total VS during manure-based AD reduced hydrogen
production. Product accumulation (i.e., VFA, NH4þ, LCFA) may
be responsible for the reduced hydrogen production associ-
ated with greater concentrations of SRM. SRM treatment via
AD may be more suitable to single stage methanogenic
digestion or to a two-stage hydrogen–methane process to
maximize total biogas yield.
Acknowledgements
Funding for this project was provided by the Specified Risk
Material Program of Agriculture and Agri-Food Canada, and the
Program of Energy Research and Development through Natural
Resources Canada and Agriculture and Agri-Food Canada. The
authors thank B. Hill and W. Smart for their technical
assistance.
r e f e r e n c e s
[1] Wang J, Wan W. Factors influencing fermentative hydrogenproduction: a review. Int J Hydrogen Energy 2009;34:799–811.
[2] Sparling R, Risbey D, PoggiVaraldo HM. Hydrogen productionfrom inhibited anaerobic composters. Int J Hydrogen Energy1997;22(6):563–6.
[3] Chen CC, Lin CY, Chang JS. Kinetics of hydrogen productionwith continuous anaerobic cultures utilizing sucrose as thelimiting substrate. Appl Microbiol Biotechnol 2001;57(1–2):56–64.
[4] Wang JL, Wan W. Comparison of different pretreatmentmethods for enriching hydrogen-producing bacteria fromdigested sludge. Int J Hydrogen Energy 2008;33(12):2934–41.
[5] Gilroyed BH, Chang C, Chu A, Hao X. Effect of temperature onanaerobic fermentative hydrogen gas production fromfeedlot cattle manure using mixed microflora. Int J HydrogenEnergy 2008;33(16):4301–8.
i n t e r n a t i o n a l j o u r n a l o f h y d r o g e n e n e r g y 3 5 ( 2 0 1 0 ) 1 0 9 9 – 1 1 0 5 1105
[6] Antonopoulou G, Gavala HN, Skiadas IV, Angelopoulos K,Lyberatos G. Biofuels generation from sweet sorghum:fermentative hydrogen production and anaerobic digestionof the remaining biomass. Bioresour Technol 2008;99(1):110–9.
[7] Pohland FG, Ghosh S. Developments in anaerobicstabilization of organic wastes – the two-phase concept.Environ Lett 1971;1(4):255–66.
[8] Beccari M, Majone M, Torrisi L. Two-reactor system withpartial phase separation for anaerobic treatment of olive oilmill effluents. Water Sci Technol 1998;38(4–5):53–60.
[9] Demirel B, Yenigun O. Two-phase anaerobic digestionprocesses: a review. J Chem Technol Biotechnol 2002;77(7):743–55.
[10] EPA. Control of pathogens and vector attractions in sewagesludge (EPA/625/R-92/013). 1992.
[11] Puchajda B, Oleszkiewicz J. Extended acid digestion forinactivation of fecal coliforms. Water Environ Res 2006;78(12):2389–96.
[12] Canadian Food Inspection Agency. Disposing of SRM, http://www.inspection.gc.ca/english/anima/heasan/disemala/bseesb/enhren/art/wasdece.shtml; 2009 [accessed December2, 2009].
[13] Ayalon O, Avnimelech Y, Shechter M. Solid waste treatmentas a high-priority and low-cost alternative for greenhousegas mitigation. Environ Manage 2001;27(5):697–704.
[14] Ma X, Benson CH, McKenzie D, Aiken JM, Pedersen JA.Adsorption of pathogenic prion protein to quartz sand.Environ Sci Technol 2007;41(7):2324–30.
[15] Gilroyed BH, Reuter T, Chu A, Hao X, Xu W, McAllister TA.Anaerobic digestion of specified risk materials co-digestedwith cattle manure for biogas production. Bioresour Technol:under review.
[16] Xu W, Reuter T, Inglis GD, Larney FJ, Alexander TW, Guan J,et al. A biosecure composting system for disposal of cattlecarcasses and manure following infectious disease outbreak.J Environ Qual 2009;38(2):437–50.
[17] Hao X, Stanford K, McAllister TA, Larney FJ, Xu SW.Greenhouse gas emissions and final compost propertiesfrom co-composting bovine specified risk material andmortalities with manure. Nutr Cycl Agroecosyst 2009;83(3):289–99.
[18] Standard methods for the evaluation of water andwastewater. 20th ed. Washington, DC: American PublicHealth Association; 1998.
[19] Oh SE, Van Ginkel S, Logan BE. The relative effectiveness ofpH control and heat treatment for enhancing biohydrogengas production. Environ Sci Technol 2003;37(22):5186–90.
[20] Sakar S, Yetilmezsoy K, Kocak E. Anaerobic digestiontechnology in poultry and livestock waste treatment –a literature review. Waste Manage Res 2009;27(1):3–18.
[21] Zhu HG, Wakayama T, Asada Y, Miyake J. Hydrogenproduction by four cultures with participation byanoxygenic phototrophic bacterium and anaerobicbacterium in the presence of NH4
þ. Int J Hydrogen Energy2001;26(11):1149–54.
[22] Wang B, Wan W, Wang J. Effect of ammonia concentrationon fermentative hydrogen production by mixed cultures.Bioresour Technol 2009;100(3):1211–3.
[23] Salerno MB, Park W, Zuo Y, Logan BE. Inhibition ofbiohydrogen production by ammonia. Water Res 2006;40(6):1167–72.
[24] Kolb E, Buchner A, Dittrich H, Siebert P, Vallentin G. Thecontent of DNA, RNA and protein as well as the fresh weight–DNA-ratio, the protein–DNA-ratio and the RNA–DNA-ratio intissues of male calves, of bulls, of short scrotum bulls and ofoxen during the growth period. J Vet Med A 1992;39(10):777–91.
[25] Emerson K, Russo RC, Lund RC, Thurson RV. Aqueousammonia equilibrium calculations: effects of pH andtemperature. J Fisheries Res Board Canada 1975;32:2379–83.
[26] Angelidaki I, Ahring BK. Effects of free long-chain fatty-acidson thermophilic anaerobic-digestion. Appl MicrobiolBiotechnol 1992;37(6):808–12.
[27] Masse L, Masse DI, Kennedy KJ, Chou SP. Neutral fathydrolysis and long-chain fatty acid oxidation duringanaerobic digestion of slaughterhouse wastewater.Biotechnol Bioeng 2002;79(1):43–52.
[28] Gottschalk G. Bacterial metabolism. 2nd ed. New York:Springer-Verlag; 1986.
[29] Argun H, Kargi F, Kapdan IK, Oztekin R. Batch darkfermentation of powdered wheat starch to hydrogen gas:effects of the initial substrate and biomass concentrations.Int J Hydrogen Energy 2008;33(21):6109–15.
[30] Karlsson A, Vallin L, Ejlertsson J. Effects of temperature,hydraulic retention time and hydrogen extraction rate onhydrogen production from the fermentation of food industryresidues and manure. Int J Hydrogen Energy 2008;33(3):953–62.