biofuels: unlocking the potential & opportunities for ... · biofuels: unlocking the potential...
TRANSCRIPT
1
Biofuels: Unlocking the Potential & Opportunities
for Catalysis
Modern Methods in Heterogeneous Catalysis Research Seminar SeriesFritz-Haber-InstitutBerlin, GermanyOctober 17, 2008 © 2008 UOP LLC. All rights reserved.
Simon R. BareAdvanced Characterization
UOP LLC
Simon R. BareAdvanced Characterization
UOP LLC

2
UOP LLC
• Leading supplier and licensor of process technology, catalysts, adsorbents, process plants, and technical services to the petroleum refining, petrochemical, and gas processing industries
• UOP technology furnishes 60% of the world’s gasoline, 85% of the world’s biodegradable detergents, and 60% of the world’s para-xylene
• Strong relationships with leading refining and petrochemical customers worldwide
• UOP’s innovations enabled lead removal from gasoline, biodegradable detergents, and the first commercial catalytic converter for automobiles
Biofuels: Next in a Series of Sustainable Solutions
2003 US National Medal of Technology Recipient

3
• Potential impact of biofuels- Energy supply
• Biofuels issues- Sustainability
Financial EnvironmentalSocial
• Biofuels potential- Technologies: Current and Future- Road-map to success
Agenda

4
Biofuels: A Quickly Changing Landscape
• All biofuels are good• More, faster• No criteria to
measure impact of adopting biofuels
• Availability of “inexpensive” bio feedstocks
• Government mandates and incentives favor ethanol and biodiesel
• Not all biofuels are good• Measured biofuel
adoption• Utilization of LCA
analysis to “qualify”: link to GHG, energy, sustainability
• Bio feedstocks tracking energy prices
• Government mandates and incentives increasingly technology neutral
• Emphasis on “real”biofuels
2007• Emphasis on life
cycle analysis as a way of measuring “sustainability”
• Ensure technology is feedstock flexible
• Focus on 2nd
generation technologies
• Create partnerships between bio-feedstock suppliers and fuel producers
Increasing Awareness of Impact
2008 UOP Position
UOP 5019G-04

5
• Global energy demand is expected to grow at CAGR 2.1%.
- Primary Energy diversity will become increasingly important over this period with coal, natural gas & renewables playing bigger roles.
• Fossil fuels are expected to supply 83% of energy and 95% of liquid transportation needs
• Biofuels are expected to grow at 8-12%/year to > 3 million BPD
- Main driver is to address climate change.
Source: IEA, 2006 UOP 5054-04
Biofuels: only 5% of Global Transport PoolBut at 3 million BPD, not an InsignificantVolume
Macromarket Summary: 2007-2017

6
Ethanol Production from Sugars
300
Mill
ion
BTU
/acr
e
0
35.0
17.5
52.5600
700
Gal
lons
per
acr
e
100
200
500
400
0 Barley Wheat Corn SugarBeet
SugarCane
Source: Fulton et. al
Biodiesel Production from Oils700
* Energy content basis
Mill
ion
BTU
/acr
e
14
28
42
0
56
70
Gal
lons
per
acr
e
100
200
500
400
300
0
Source: Fulton et. al
Soybean Caster bean
Sunflowerseed
Rape-seed
Jatropha Palm
60084
20% Substitution Equivalentto the Land Mass of
~Germany, Austria, Poland and Czech Republic!!
Targetsgion Current Futurezil 25% Ethanol in
gasoline2.0% of diesel by
2008
5.0% of diesel by 2011
8.0% by 2020
10%* by 2020
E5, B5 by 2012
36 B gal by 2022(~20% of transport
pool)
2.0% of gasoline & diesel by 2010
5.75%* of gasoline & diesel by 2010
India 5.0% Ethanol in gasoline
15.2 B gal 2012
ReBra
China
Europe
USA
Biofuel Targets

7
Global Government Mandates
• 36 billion gallons biofuels , ~2.5M BPD by 2022 (20% of pool!)
• Corn based ethanol, capped at 15 billion gal• Emphasis on transition to 2nd generation
cellulosics• Requires demonstration of LCA based GHG
savings relative to baseline petroleum fuels
Volume and Type of Renewable FuelRequired by the RFS
35
40
30
25
20
15
10
5
02006 2008 2010 2012 2014 2016 2018 2020 2022
ConventionalBiofuels
CellulosicAdvanced Biofuels
Biodiesel
USA: Energy Independence & Security Act (2007)
Europe: Renewable Energy & Fuel Quality Directives
20% of EU Primary Energy Demand from Renewable Sources by 2020 − Transport Fuels: 10% Renewable Content
by energy content− GHG Emissions: Fuel producers reduce
10% by 2020 relative to 2010 levels− Sustainability targets being put in place
Countries with B2-B10 and E5-E10 mandates include Canada, Colombia, Peru, Argentina, Thailand, China*, India*. Brazil is E25. *Emphasis: non-food
Global
Increasingly Focused on Sustainabilityand Second Generation Feedstocks

8
Food supply: small impact on the fuel market, yet large impact on food supply
Land and water: competition for land and water resources that are already in high demand
Environmental: loss of biodiversity, soil erosion, nutrient leaching, soil and water pollution and deforestation
Critical Issues
Second Generation Development Requiredto Ameliorate these Risks

9
MB
PD
0
10
20
Global
30
40
50US
02
4
6
8
10
Current Potential
Liquid Transport FuelsGasolineDieselCellulosic Waste
1214
MB
PD
Liquid Transport FuelsGasolineDieselCellulosic Waste
Current PotentialSource: Purvin & Gertz /Eric Larsen: Energy for Sustainable Development, 2000
Oils Productivity
142842
0
5670
Gal
lons
per
acr
e
100200
500400300
0
Source: Fulton et. al
Soybean Caster bean
Sun-flowerseed
Rape-seed
Jatropha Palm
Mill
ion
BTU
/acr
e
• Cellulosic waste could make a significant contribution to liquid transportation pool.
• Algal Oils could enable oils route to biodiesel, Green Diesel and Green Jet.
Increases Availability, Reduces Feedstock CostTechnology Breakthroughs Required
Enablers for a SustainableBiomass Infrastructure
0
500
1000
1500
2000
2500
3000
3500
Gal
lons
per
acr
e
Soyb
ean
Caster
bea
nSu
nflow
er se
edRap
e see
dJa
troph
a
Palm
Alga
e

10
UOP Renewables Vision
Oxygenated Biofuels
BiodieselEthanol
Hydrocarbon Biofuels
JetDiesel Gasoline
• Building on UOP technology and expertise• Produce real fuels instead of fuel additives/blends• Leverage existing refining/ transportation infrastructure to lower
capital costs, minimize value chain disruptions, and reduce investment risk.
• Focus on path toward second generation feedstocks & chemicals
FirstGeneration
Natural oils from vegetables and greases
Inedible Oils: Camelina, Jatropha
Lignocellulosic biomass,algal oils
Second Generation

11
BiofuelsSustainability
SustainabilitySustainability
UncompromisedProduct QualityUncompromisedProduct Quality
Life CyclesLife Cycles
EmissionsEmissions
Vehicle FleetVehicle Fleet
TechnologyTechnology
LignocellulosicLignocellulosicCostCost
Net EnergyProduction ≤Consumption
Net EnergyProduction ≤Consumption
EfficiencyEfficiency
Supply ChainSupply Chain
AlgalAlgal
Energy ContentEnergy Content
DistributedDistributed
FeedstockAvailabilityFeedstockAvailabilityWorld TradeWorld Trade
StandardsStandards
Reduction inClimate Active
CO2 Equivalents
Reduction inClimate Active
CO2 Equivalents
Renewable Fuels: Unlocking the Potential

12
Jatropha Plant (Jatropha curcas L)
• Bush or small plant with irregular branches, 1-7 m height.
• Grows well in porous & infertile (marginal) soil• Grows at rainfall of 30-238 cm/yr; Optimum rainfall 62.5
cm/yr• Grows wild or grown as fence.• Grows well in lowland up to 1000 m above sea level• Required average temperature is 20-28°C• Life 25-30 years.

13
Advantages of Jatropha as Biofuel and Biomass Feedstock
• Seed has high oil content (30 - 50 %) • Oil is not edible → does not interfere with edible oil
supply• Can be grown and developed in dry and marginal lands • Easy to grow and widely adaptable
14
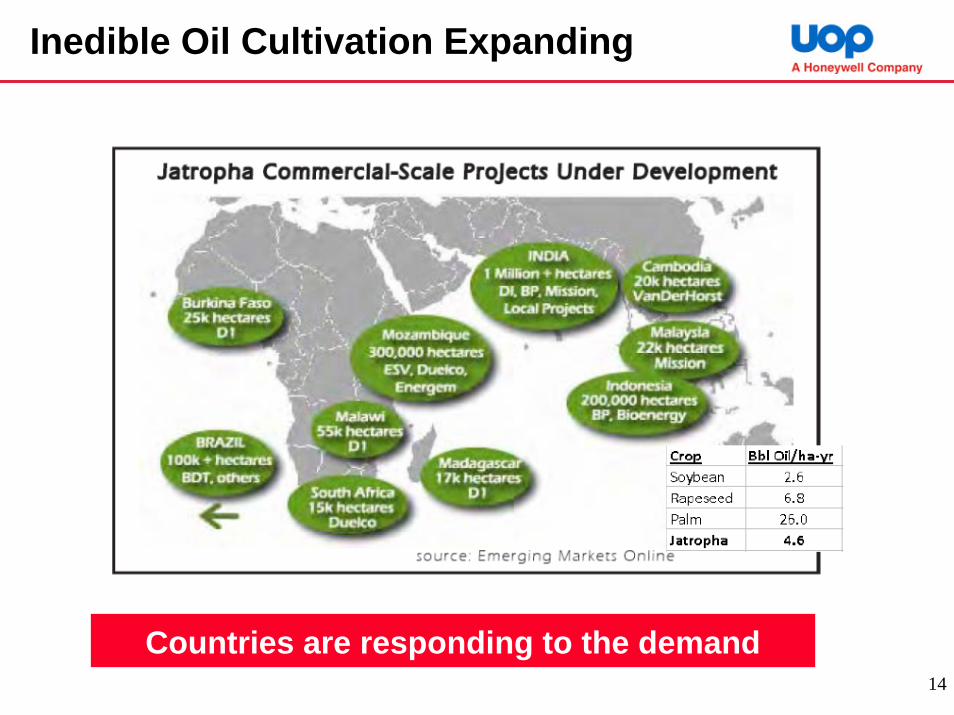
Inedible Oil Cultivation Expanding
Countries are responding to the demand

15
Feed Process Product
Green OlefinsVegetable Oil Green GasolineCatalytic
Cracking
H2 Green DieselVegetable Oil
Green Chemicals
LignocellulosicWaste
Green FuelsUpgrading
H2 Green JetVegetable Oil
UOP Biomass Processing Routes
Refining
EcofiningTM

16
Feed Process Product
Green OlefinsVegetable Oil Green GasolineCatalytic
Cracking
H2 Green DieselVegetable Oil
Green Chemicals
LignocellulosicWaste
Green FuelsUpgrading
H2 Green JetVegetable Oil
UOP Biomass Processing Routes
Refining
EcofiningTM

17
Vegetable Oils/Greases
• Boiling point and number carbon atoms hydrocarbons in vegetable oils fall in the diesel range.
60 400 500 650 1000 1300Boiling Point, °F
Gasoline Diesel No. 2 Lubricating Oils Asphalt
Jet
300
Heavy Fuel Oils
6 8 10 15 20 43 71Number of Carbon Atoms
Gases
Crude Oil
Soybean OilCoconut Oil

18
Composition of Oils and GreasesComposition of Oils and Greases(10(10--12% Oxygen, Olefins, Trace Sulfur) 12% Oxygen, Olefins, Trace Sulfur)
Fatty Free AcidsFatty Free Acids
MW = 200MW = 200--300300C
CH3
OH
O
CH2
CH
CH2
O
O
O
C
C
C
O
O
O
CH3
CH3
CH3
MW = 700MW = 700--900900
• The major component of fats/vegetable oil is triglycerides.• Triglyceride is glycerol with a long-chain fatty acid on each of
the OH groups.• Length of the alkyl groups is 12-18 carbon atoms.
TriglyceridesTriglycerides

19
Biodiesel
• Biodiesel is produced by the reaction of the triglyceride with methanol in the presence of NaOHto produce FAME – fatty acid methyl ester in a process called transesterification.
+ CH3OH
Transesterification
Ester + alcohol → different ester + different alcohol
triglyceride glycerol FAME
CH3CH3
CH2
CH
CH2
O
O
O
C
C
C
O
O
O
CH3
CH3
CH3

20
Green DieselGreen Diesel
OilBioOil Deoxygenation/ Isomerization Green Diesel
CH3HO
O H2
CO2
H2O +
+ H3C CH3
H3C CH3
HC
O
O
O
O
O
O
CH3
CH2+CH3
CH3H2O
CO2 H3C
H3C H3C CH3
CH3H3C
+
H3C CH3
+
CH3CH3
CH3H3CCH3 H3C
CH3
H3C CH3CH3CH3
DeoxygenationIsomerizationCatalystCatalyst
CatalystCatalyst
*Double bonds not shown for simplicity
21
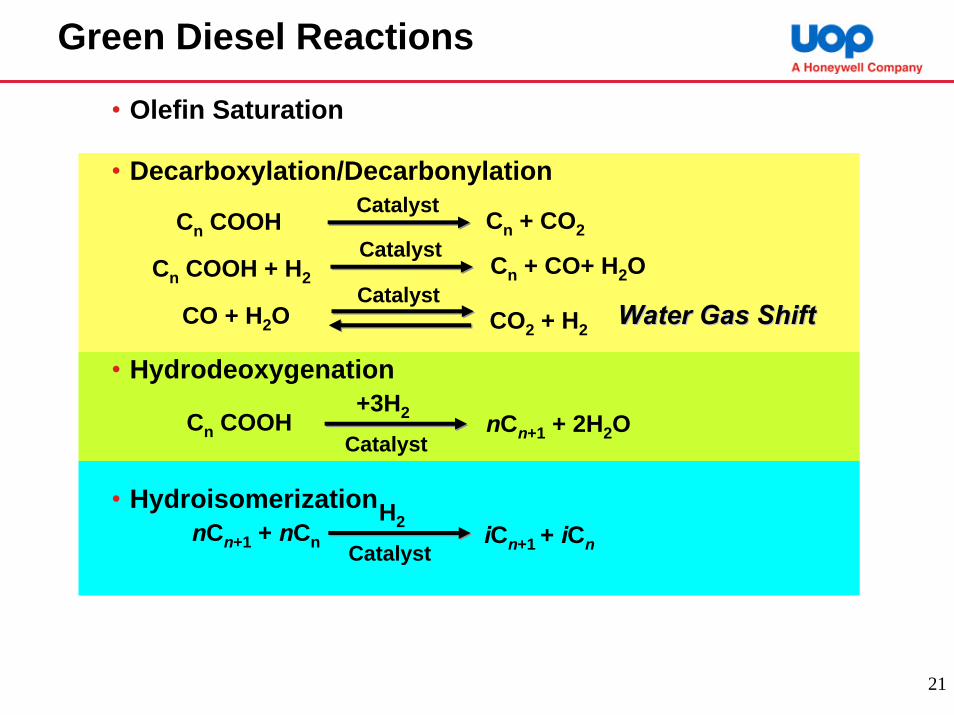
Green Diesel Reactions
Cn COOHCatalyst
Cn + CO2
Cn COOH + H2 Cn + CO+ H2OCatalyst
CO + H2O CO2 + H2
CatalystWater Gas ShiftWater Gas Shift
nCn+1 + 2H2OCn COOH+3H2
Catalyst
nCn+1 + nCn iCn+1 + iCn
H2
Catalyst
• Olefin Saturation
• Decarboxylation/Decarbonylation
• Hydrodeoxygenation
• Hydroisomerization

22
Veg Oil/ Grease
+ Glycerol
Biodiesel (FAME) Green Diesel
+ Propane
HydrogenMethanol
Petroleum ULSD
Biodiesel (FAME) Green Diesel
Oxygen Content, % 00.84<1043-540
Lubricity Baseline Good BaselineBaseline
11 0Specific Gravity 0.88 0.78
Cetane 50-65 70-90
Stability Poor Baseline
Sulfur content, ppm <1 <1Heating Value MJ/kg 38Cloud Point, °C -5 to +15 -30 to -10
44
UOP/ENI EcofiningTM Process to Produce Green DieselFirst Unit Start-up: 2010
Green Diesel vs. Biodiesel (FAME)

Engines OEM Experience with FAME
High FAME Concentrations Result in Many Undesirable Problems with Existing Engines
Biodiesel – Main Issues & Challenges to the Motor Industry
• Stability issues - Deposits• Material compatibility, Corrosion–
Elastomers & polymers• Cold temperature operability – Filter
plugging• Lubricant dilution – Impacts engine
cleanliness & degrades lubricant• Exhaust after-treatment systems
– Long term impact not known
Impact of a Higher Biodiesel Content in the Engine Oil
Negative impact on tribological systemExcessive stress on additive packageDeposit formationCatalyzer damage
Polymer Deposits(Source Bosch)
Fouled Injection Nozzles(Source Bosch)
Gum Formation on Fuel Pump Filter
(Source Toyota)
Plugged Filter(Source AURI)

24
Ecofining Process Chemistry Details
ReactorSystem
Water
CO2
Propane & Light Ends
Green Diesel Product
Make-up Hydrogen
Separator
Feed
Acid Gas Removal
Green Naphthaor Jet
Ecofining Feed Testing Program – Soy, Rapeseed, Palm, Jatropha, Algal, Tallow, …
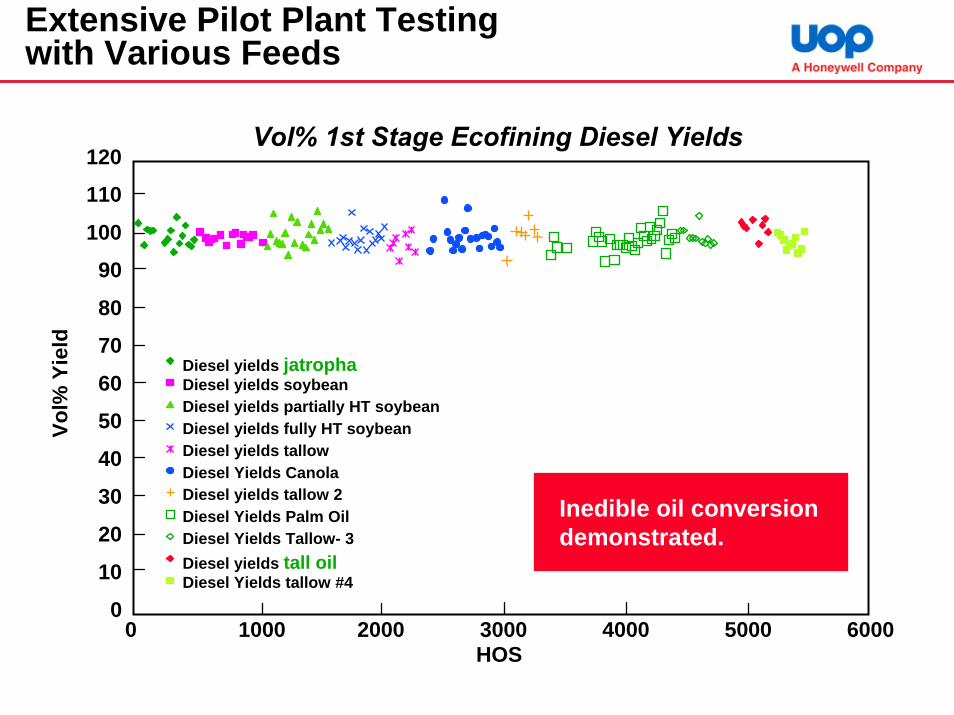
Vol% 1st Stage Ecofining Diesel Yields
0
10
20
30
40
50
60
70
80
90
100
110
120
0 1000 2000 3000 4000 5000 6000HOS
Vol%
Yie
ld
Diesel yields jatrophaDiesel yields soybeanDiesel yields partially HT soybeanDiesel yields fully HT soybeanDiesel yields tallowDiesel Yields CanolaDiesel yields tallow 2Diesel Yields Palm OilDiesel Yields Tallow- 3Diesel yields tall oilDiesel Yields tallow #4
Extensive Pilot Plant Testing with Various Feeds
Inedible oil conversion demonstrated.

26
Method to determine and compare the environmental impact of alternative products or processes from cradle to grave
- Scope: from extraction (cultivation) through combustion (in transportation use)
- Functional Unit: 1 kg of each fuelAssumption: Each fuel performs the same in transportation use
- Primary Focus: fossil energy consumption and emission of green house gases (GHG)
- Other impact categories are included
Life Cycle Assessment

27
Scope of WTW* LCA
*well-to-wheels or well-to-wings

28
00.10.20.30.40.50.60.70.80.9
11.11.21.31.41.5
Petroleum Diesel Biodiesel Green Diesel-A
Fossil Energy Nuclear Energy Biomass Energy
Tota
l Ene
rgy
per U
nit o
f D
iese
l Ene
rgy
1.26
0.33 0.29
1.01 1.03
1.281.38 1.34
Life Cycle Analysis:Total Energy Comparison
Petroleum Fuels Production is Most Energy Efficient
Shonnard, DOE Methodology, SimaPro

29
Climate Active CO2 Production
Green Diesel has the smallest CO2 footprint
0
0.01
0.02
0.03
0.04
0.05
0.06
0.07
0.08
0.09
PetroleumDiesel
Biodiesel GreenDiesel-A
GreenDiesel-B
Kg
CO
2/ M
J
Green Diesel A Green Diesel A -- Refinery HRefinery H 22 SupplySupply
Green Diesel B Green Diesel B ––H2 from light byH2 from light by --productsproducts
0
0.01
0.02
0.03
0.04
0.05
0.06
0.07
0.08
0.09
PetroleumDiesel
Biodiesel GreenDiesel-A
GreenDiesel-B
Kg
CO
2/ M
J
Green Diesel-A – refinery H2 supply
Green Diesel-B – H2 from light by-products

30
Fossil Savings (GJ / ton biofuel)Methodology
Biodiesel Green DieselDOE 74CONCAWE 55 73PNAS 72 73
GHG Savings (tons CO 2equ. / ton biofuel)
Biodiesel Green DieselDOE 73 84CONCAWE 37 57PNAS 43 47
% Fossil Savings (relative to petroleum diesel)
BiodieselDOE 77CONCAWE PNAS
% GHG Savings (relative to petroleum diesel)
BiodieselDOECONCAWEPNAS
Methodology Selection is Critical
Environmental Impact

31
UOP Biomass Processing RoutesFeed Process Product
Triglyceride Green GasolineCatalyticCatalyticCrackingCracking
H2 Green DieselVegetable Oil
EcofiningEcofiningTMTM
Biodiesel
Glycerol
BiodieselBiodieselBiodieselMethanol
Vegetable OilBiodieselBiodiesel
Lignocellulosic Waste
Green FuelsUpgradingUpgrading
H2 Green JetVegetable Oil
RefiningRefiningRefining
Green Chemicals
Propylene Glycol

32
Biodiesel Math

33
Biodiesel Math, cont.
• 1 billion gallons of biodiesel would result in 770 million lbs glycerol- US glycerol market = 320 million lbs- World glycerol market = 800 million lbs
• Need new options for glycerol use• New direct uses• Glycerol as platform to other chemicals
- 770 million lbs of glycerol could produce 540 million lbs of propylene glycol (PG market 3.5 billion lbs)

34
Products from Glycerol
Dehydration
Hydrogenolysis

35
UOP Glycerol to PG ProcessGlycerol
+ H2OOHOH
OH
PG
OHOH
EG
OHOH
+H2 / cat
+ CH3OHConversion: 93%
Selectivity: 93% (mole %)
• Jointly developed with Pacific Northwest National Lab• High conversion of Glycerol• High selectivity to PG
- 90+ mol% selectivity to PG• Demonstrated ability to process commercial glycerol feed
- Distillation of crude glycerin is not required - Methanol & water-tolerant catalyst- Feed is aqueous solution of 40-60 wt% glycerol

36
Catalyst On-stream Performance
Excellent Activity and Selectivity
80.0
82.0
84.0
86.0
88.0
90.0
92.0
94.0
96.0
0 500 1000 1500 2000 2500 3000 3500 4000 4500
Hours on Stream
Gly
cero
l Con
vers
ion
and
PG C
Mol
Sel
ectiv
ity, %
Propylene Glycol SelectivityGlycerol Conversion

37
Hydrogenolysis Catalyst for PG Process
• Re-containing multi-metallic catalyst- Ni, Pd, Ru, Co, Ag, Au, Rh, Pt, Ir, Os and Cu
• Supports include C, ZrO2 and TiO2 (rutile)• Catalyst prepared via incipient wetness technique• Metal precursor salts prepared in single solution
- Metal salt solution volume = support liquid pore volume• Reduction at 210-350°C
US 6841085

38
Processes in Liquid Water(feed 40-60% solution)
• “Hot water is nasty stuff”

39
Crush Strength

40
Support Options Limited to….
• “Hot water is nasty stuff”

41
Hydrogenation Comparison

42
The Metals….
• Conversions of Ni-Re catalyst >> Ni-only or Re-only: Interaction between Ni and Re.
0
0.1
0.2
0.3
0.4
0.5
0.6
0.7
0 1 2 3 4 5
Sample Time (hr)
Con
vers
ion
5% Ni/C3% Re/C
5%Re/5%Ni/C

43
Glycerol to PG Summary
• Potential outlet for the glycerol produced in biodeisel process.
• Robust catalyst system developed- High selectivity and activity
- Catalyst stable to process conditions
• Economically competitive to the petroleum based process

44
Feed Process Product
Green OlefinsVegetable Oil Green GasolineCatalytic
Cracking
H2 Green DieselVegetable Oil
Green Chemicals
LignocellulosicWaste
Green FuelsUpgrading
H2 Green JetVegetable Oil
UOP Biomass Processing Routes
Refining
EcofiningTM

45
Biofuel Sources to Jet Fuel
Transesterification
Alcohol tofuel
Deoxygenation
FinalProcessingTo Jet Fuel
Fermentation
FischerTropsch
Pyrolysis
Gasification
Sugars Starches
Lignocellulosicbiomass
ParaffinSyngas
Fats Oils
Alcohol Paraffin
Paraffin
FAME

46
Ecofining
OilOil IsomerizationIsomerization
Production of Jet Fuel
New BioNew Bio--Oil to JPOil to JP--8 Process Based 8 Process Based on Existing UOP Technologyon Existing UOP Technology
DeoxygenationDeoxygenation Green DieselGreen Diesel
OilOil Selective Cracking/Selective Cracking/IsomerizationIsomerizationDeoxygenationDeoxygenation Green JetGreen Jet
Selective cracking: Process and catalyst development to maximize economic production of
higher yields of jet-range paraffins
UOP 4934F-06

47
UOP/ENI EcofiningTM
Oil
New Bio-Oil to Jet Process Based on Ecofining
Integrated Biofuels Production
BioOil Deoxygenation/ Isomerization Green Diesel
Oil Deoxygenation/ Selective Cracking/Isomerization Green JetBioOil
Production of Jet Fuel
Distribution Statement "A" (Approved for Public Release, Distribution Unlimited)

48
Producing jet-range fuel from deoxygenated natural oils and fats
60 400 500 650 1000 1300Boiling Point, DegF
Gasoline Diesel No. 2 Lubricating Oils Asphalt
Jet
300
Heavy Fuel Oils
1 6 8 10 15 20 43 71Number of Carbon Atoms
5 18 75 4,000 366,000 >1000 TrillionNumber of Paraffin Isomers
Gases
Crude Oil
Deoxygenated Soybean OilDeoxygenated Soybean Oil
Deoxygenated Coconut OilDeoxygenated Coconut Oil
to JPto JP--88
5-10 11 12 13 14 15 16 17 18 19+Coconut Oil 15 49 18 8 11 0Soybean Oil 0 0 0 11 88 0Deoxygenated Coconut oil 15 19 29 7 11 3 5 4 6 0Deoxygenated Soybean oil 0 0 0 0 0 4 7 35 53 0
Carbon Chain Length

49
Lab Scale
Preparation
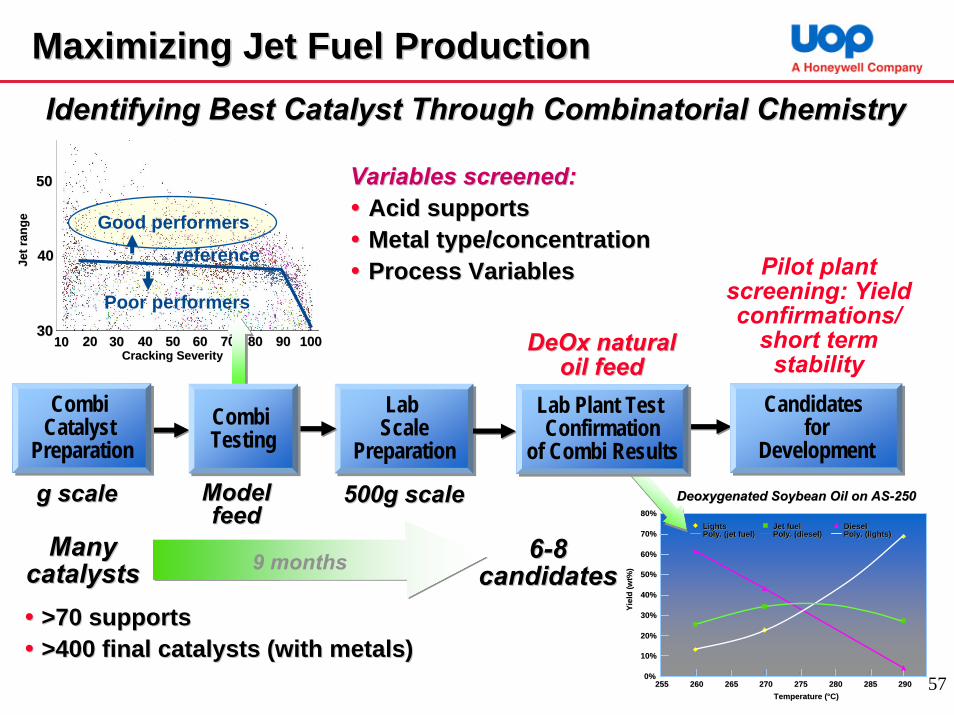
Maximizing Jet Fuel ProductionMaximizing Jet Fuel Production
Variables screened:Variables screened:Acid supportsAcid supportsMetal type/concentrationMetal type/concentrationProcess VariablesProcess Variables
g scaleg scale 500g scale500g scaleModelModelfeedfeed
DeOx natural DeOx natural oil feedoil feed
Pilot plant screening: Yield confirmations/
short term stability
Many Many catalystscatalysts
66--8 8 candidatescandidates
Jet r
ange
Jet r
ange
Cracking SeverityCracking Severity
>70 supports>70 supports>400 final catalysts (with metals)>400 final catalysts (with metals)
Deoxygenated Soybean Oil on ASDeoxygenated Soybean Oil on AS--250250
0%0%
10%10%
20%20%
30%30%
40%40%
50%50%
60%60%
70%70%
80%80%
255255 260260 265265 270270 275275 280280 285285 290290Temperature (Temperature (°°C)C)
Yiel
d (w
t%)
Yiel
d (w
t%)
LightsLights Jet fuelJet fuel DieselDieselPoly. (jet fuel)Poly. (jet fuel) Poly. (diesel)Poly. (diesel) Poly. (lights)Poly. (lights)
Identifying Best Catalyst Through Combinatorial ChemistryIdentifying Best Catalyst Through Combinatorial Chemistry
9 months
Combi Catalyst
Preparation
Candidates for
Development
Lab Plant Test Confirmation
of Combi Results
5050
4040
30301010 2020 3030 4040 5050 6060 7070 8080 9090 100100
reference
Poor performers
Good performers
Combi Testing

50
Combinatorial Chemistry
• Vision: Utilize combinatorial tools and methods to reduce cycle time for new product invention andcommercialization.
• Implication: Invent and implement combinatorial tools and methods that effectively link combi scale to pilot and commercial scales- Sample preparation is representative- Screening tests are predictive
Combi Micro Pilot Demo Commercial
ScalablePredictive

51
Combi Tools – Overview
SynthesisSynthesis
Ion Ion ExchangeExchange
HeatHeatTreatmentTreatment
CatalystCatalystImpregnationImpregnation
EvaluationEvaluation
Standard Standard SupportSupport RoboticsRobotics
CharacterizationCharacterization
Rx TestingRx Testing
RegenerationRegeneration
52
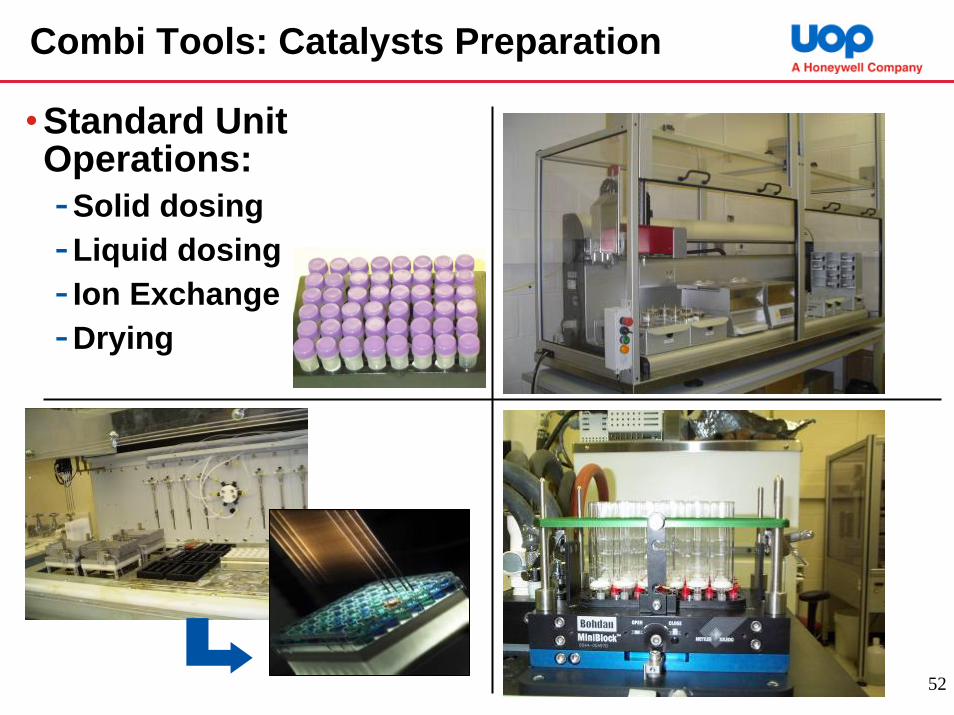
Combi Tools: Catalysts Preparation
• Standard Unit Operations:-Solid dosing-Liquid dosing- Ion Exchange-Drying

53
Combi Tools: Heat Treatment
Flow 1
Flow 2
Flow 3
Flow 4
Flow 5
Flow 6
Multi-Flow
Multi-Temperature
Multi-Tem
perature
ReduceRegenerate
OxichlorinateSteam
Calcine
Liquid addition
Controlled atmosphere with gas blending
48 Heaters

54
Combi Tools: Catalysts Testing
Catalyst
Thermocouple
Realistic ConditionsSuccessful Miniaturization
Independent Control of VariablesTemperatureFlowReactant CompositionPressure
ModularVariety of Reactor TypesInlet/Outlet ManifoldVersatile Analytical
Parallel Test Design, Set-up, ControlAutomated On-line Monitoring

55
Combi Tools: Catalysts Testing, cont
Capability Atm Rx High-P RxVapor Phase, Plug Flow Yes Yes48-Rx In-Situ Temp. Measurement Yes Yes48 Independent Gas Flows Yes Yes48 Independent Liquid Flows - YesIn-Situ Liquid Vaporization - Yes6 Independent Pressures - Yes
Pressure 1
Pressure 2
Pressure 3
Pressure 4
Pressure 5
Pressure 6
Multi-PressureMulti-Flow
Multi-Flow

56
Combi Tools – Informatics
• Combi Data- Lots of it- Wide diversity- Trusted quality
DATA
• Informatics Tools- For every task- Manage info flow- Expandable
• Integrated Workflow- Multiple users- Multiple unit ops- Exercised daily
Leads
Logos are trademarks and/or service marks of the respective companies.
57
Lab Scale
Preparation
Maximizing Jet Fuel Production Maximizing Jet Fuel Production
Variables screened:Variables screened:Acid supportsAcid supportsMetal type/concentrationMetal type/concentrationProcess VariablesProcess Variables
g scaleg scale 500g scale500g scaleModelModelfeedfeed
DeOx natural DeOx natural oil feedoil feed
Pilot plant screening: Yield confirmations/
short term stability
Many Many catalystscatalysts
66--8 8 candidatescandidates
Jet r
ange
Jet r
ange
Cracking SeverityCracking Severity
>70 supports>70 supports>400 final catalysts (with metals)>400 final catalysts (with metals)
Deoxygenated Soybean Oil on ASDeoxygenated Soybean Oil on AS--250250
0%0%
10%10%
20%20%
30%30%
40%40%
50%50%
60%60%
70%70%
80%80%
255255 260260 265265 270270 275275 280280 285285 290290Temperature (Temperature (°°C)C)
Yiel
d (w
t%)
Yiel
d (w
t%)
LightsLights Jet fuelJet fuel DieselDieselPoly. (jet fuel)Poly. (jet fuel) Poly. (diesel)Poly. (diesel) Poly. (lights)Poly. (lights)
Identifying Best Catalyst Through Combinatorial ChemistryIdentifying Best Catalyst Through Combinatorial Chemistry
9 months
Combi Catalyst
Preparation
Candidates for
Development
Lab Plant Test Confirmation
of Combi Results
5050
4040
30301010 2020 3030 4040 5050 6060 7070 8080 9090 100100
reference
Poor performers
Good performers
Combi Testing
58
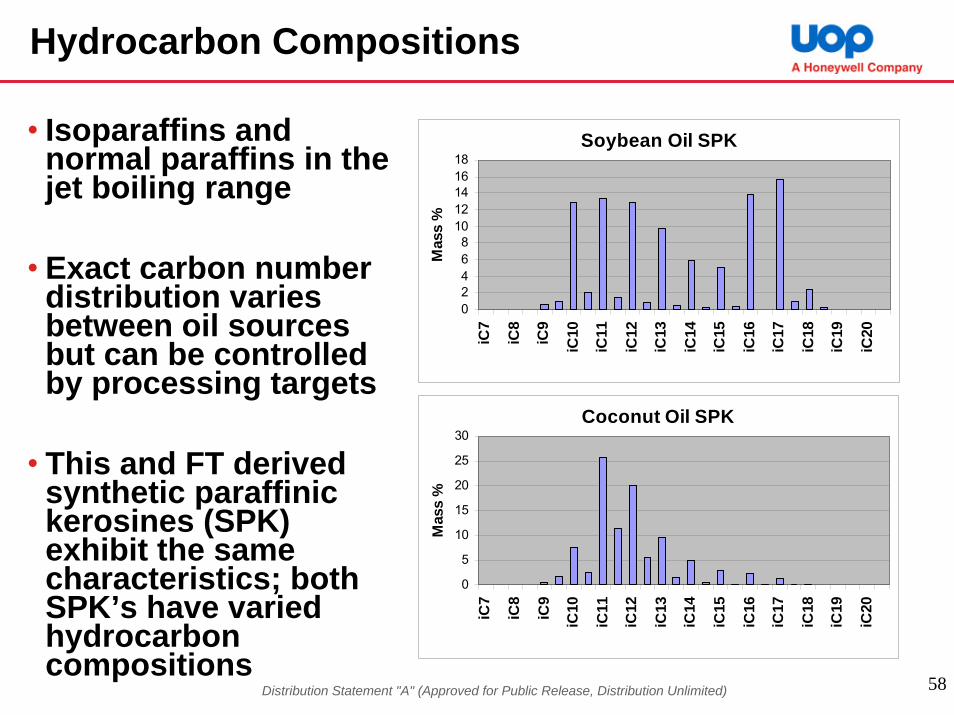
Hydrocarbon Compositions
• Isoparaffins and normal paraffins in the jet boiling range
• Exact carbon number distribution varies between oil sources but can be controlled by processing targets
• This and FT derived synthetic paraffinic kerosines (SPK) exhibit the same characteristics; both SPK’s have varied hydrocarbon compositions
Soybean Oil SPK
02468
1012141618
iC7
iC8
iC9
iC10
iC11
iC12
iC13
iC14
iC15
iC16
iC17
iC18
iC19
iC20
Mas
s %
Coconut Oil SPK
0
5
10
15
20
25
30
iC7
iC8
iC9
iC10
iC11
iC12
iC13
iC14
iC15
iC16
iC17
iC18
iC19
iC20
Mas
s %
Distribution Statement "A" (Approved for Public Release, Distribution Unlimited)

59
Meeting JP-8 Specifications: Aromatics to Meet Density Specs
OilOil Selective Cracking/Selective Cracking/IsomerizationIsomerizationDeoxygenationDeoxygenation
Green JetGreen Jet--range range
ParaffinsParaffins
Renewable Renewable JPJP--88
Aromatics(<25%)
AromaticsAromatics(<25%)(<25%)
Sources of Aromatics• Refinery sources
- Aromatics complexes- Platforming

60
Properties of UOP’s Bio-Based JP-8
Distribution Statement "A" (Approved for Public Release, Distribution Unlimited)
43.243.243.743.243.243.5D 4529, D 3338, or D 480942.8minNet heat of combustion, MJ/kg
Combustion
-51-55-59-62-50-69−47 Jet A-1
D 5972, D 7153, D 7154, or D 2386 −40 Jet AmaxFreezing point, °C
Fluidity
804783781780779778D 1298 or D 4052775 to 840Density at 15°C, kg/m3514856565448D 56 or D 382838minFlash point, °C
287.6308292.2302.3273.2340maxFinal boiling point, temp266.4284.6238286231.2report90% recovered, temp195.2210.8190.8200.8180.6report50% recovered, temp158.8166.2162162.4156.2185max10% recovered, temp
Distillation temperature, °C
D 28872. Simulated Distillation0.80.60.60.70.80.41.5maxDistillation loss, %1.31.41.41.41.41.11.5maxDistillation residue, %62747449925140minT90-T10, °C26222811231415minT50-T10, °C265267282262279241300maxFinal boiling point, temp244248262226268219report90% recovered, temp (T90)208196216188199182report50% recovered, temp (T50)182174188177176168205max10% recovered, temp (T10)
Distillation temp, °C:D 861. Physical Distillation
Volatility3.2D 63798.4min
19.620.521.214.9D 637926.5max2. Aromatics, vol %D 13198min
18.822.222.215.124.3D 131925max1. Aromatics, vol %D 32420.1maxAcidity, total mg KOH/g
Petroleum JP-8Canola
Soybean/Py OilCoconutSoybeanJatropha
Composition of JP-8 FuelASTM Test
MethodJet A or Jet A-1Property

61
Increases Availability, Reduces Feedstock CostTechnology Breakthroughs Required
MB
PD
0
10
20
Global
30
40
50US
02
4
6
8
10
Current Potential
Liquid Transport FuelsGasolineDieselCellulosic Waste
1214
MB
PD
Liquid Transport FuelsGasolineDieselCellulosic Waste
Current PotentialSource: Purvin & Gertz /Eric Larsen: Energy for Sustainable Development, 2000
Oils Productivity
142842
0
5670
Gal
lons
per
acr
e
100200
500400300
0
Source: Fulton et. al
Soybean Caster bean
Sun-flowerseed
Rape-seed
Jatropha Palm
Mill
ion
BTU
/acr
e
• Cellulosic waste could make a significant contribution to liquid transportation pool.
• Algal Oils could enable oils route to biodiesel, Green Diesel and Green Jet.
≈
3500
≈
Algae
455
Enablers for a SustainableBiomass Infrastructure

62
• Biomass Composition: Cellulose – 6 Carbon Sugars
O O
O
O
O
O
OH
OHHO
HO
HO OH
OO
O
HO OH
O
O
CO2HH3CO OHHOH2C
O
O
OH
Hemicellulose - 5, 6 Carbon Sugars
Cellulosic Background
• Lignin Commercial Sources:Major by-product from paper & pulp industry
- 175 million tons worldwide→ 31 aromatic complexes worldwide
Co-product of bioethanol productionfrom biomass
- wood, forestry waste, sawdust, straw, - corn stover, bagasse.
Cellulose40-50%
Hemicellulose15-30%
Lignin16-33%Others
1-10%
Cellulose – 6 Carbon Sugars
O O
O
O
O
O
OH
OHHO
HO
HO OH
OO
O
HO OH
O
O
CO2HH3CO OHHOH2C
O
O
OH
Hemicellulose - 5, 6 Carbon Sugars
Schematic Structure of Lignin
Lignin Lignin IndulinIndulin ATAT-- 2/3 2/3 Carbon in Aromatic RingCarbon in Aromatic Ring
Perfect Structure for AromaticsPerfect Structure for Aromatics

63
Conversion of lignin to high value oxygenates and BTX aromatics
Lignin-to-Chemicals?
Lignin Conversion Studies:- Extensively studied in the past. It’s possible but very difficult!
• Easy to form char and gases upon heating. • Low liquid yield via fast pyrolysis.
Hemicellulose - 5, 6 Carbon SugarsHemicellulose - 5, 6 Carbon SugarsHemicellulose - 5, 6 Carbon Sugars
Selectively breakingC-O BondsC-C Bonds
Maintain Aromatic Ring
PhenolDerivatives
BTXR
X
OH
X
OH
Catalyst

64
Comparison of Feedstock Composition and Structure
• Vegetable oil
• Asphaltene
• Lignin
C
1 1.77 0.23
1 1.1 0.01
1 0.32 0.33
Feedstock Type H H2O
Lignin is very poor in hydrogen
CH2
CH
CH2
O
O
O
C
C
C
O
O
O
CH3
CH3
CH3

65
Type of Functional Groups in Lignin
Alicyclic group
Ketone group
Aldehyde group
Secondary alcohol group
Primary alcohol group
Alkene group
Phenolic hydroxyl group
Methoxyl group
Phenyl / Aryl group
OH
• Rich chemistry: Opportunities for making different chemicalsChallenges for processing chemistry

66
Lignin Base Catalyzed De-polymerization (BCD) RouteUniversity of Utah &Sandia National Lab
Advantages: - High liquid yield- Final product has high octane (>101 octane)- Could be used as feed for aromatics complex
(US 2003/0100807 A1,US 2003/0115792 A1)
67
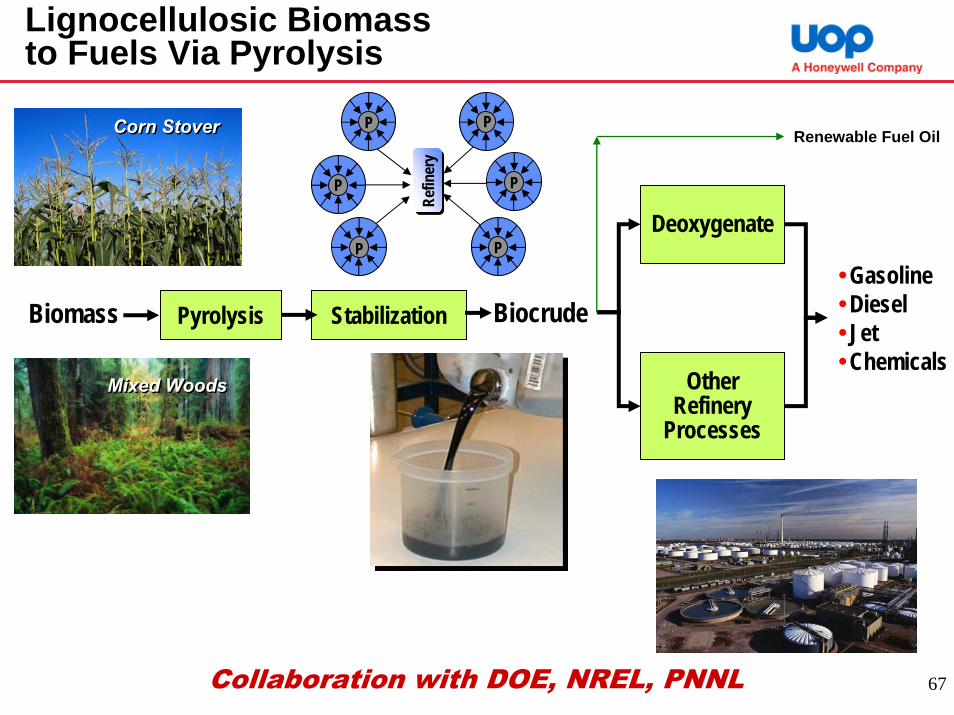
StabilizationPyrolysisBiomass
Mixed WoodsMixed Woods
Corn StoverCorn Stover
Deoxygenate
GasolineDieselJetChemicals
Other Refinery
Processes
Biocrude
Refin
ery
P P
P P
P P
Collaboration with DOE, NREL, PNNL
Lignocellulosic Biomass to Fuels Via Pyrolysis
Renewable Fuel Oil

68
Typical Fast Pyrolysis Process
Biomass
Char
Heat for Drying
Heat for Pyrolysis
Gas
Gas RecycleFluidizingGas
PyrolysisOil
H2O= 5%
H2O= 15-40%
From “Fast Pyrolysis of Biomass: A Handbook.” A.V. Bridgwater et al.
H2O= 10-40%
Reactor
Cyclone
Grind
Dry Cooland
Collect

Biorenewable Feeds: Composition
CrudeTypical Resid Soyoil
Yellow Grease
PyrolysisOil
% C 83-86 84.9 77.6 76.4 56.2
%H 11-14 10.6 11.7 11.6 6.6%S 0-4 (1.8avg) 4.2 .0006 .04 -
%N 0-1 (.1avg) .3 .0011 .03 .3%O - - 10.4 12.1 36.9
H/C 1.8-1.9 1.5 1.8 1.8 1.4Density .86(avg) 1.05 .92 .89 1.23TAN <1 <1 2 30 78ppm alkali metals
60 6 100 100 100
Heating value kJ/kg
41,800 40,700 37,200 37,200 15,200

70
Biofuel(from mixed
wood)Conventional
(from petroleum)Min Max Gasoline
TypicalULS Diesel
TypicalParaffin, wt% 5 10
Iso-Paraffin, wt%
17 2510-60
Limited by cold flow
Nil
10-80
35 maxLimited by emissions
Nil
44
Olefin, wt% 0.6 0.9 4
Naphthene, wt%
40 55 7
Aromatic, wt% 10 35 38
Oxygenate, wt%
0.1 0.8 Nil
Deoxygenated Product Properties
Hydrocarbon product rich in cyclic hydrocarbons:product can produce gasoline, jet fuel, diesel,
and chemicals

71
Deoxygenated Pyrolysis Oil to Jet Fuel
Boiling Point Distribution
0.00.0
2.02.0
4.04.0
6.06.0
8.08.0
10.010.0
00 5050 100100 150150 200200 250250 300300 350350 400400 450450 500500 550550 600600Temperature, Temperature, °°CC
wt%
in 1
0w
t% in
10 °°
Del
ta T
Del
ta T
Mixed Wood Derived (Cond. 1)Mixed Wood Derived (Cond. 2)Corn Stover Derived (Cond. 1)Corn Stover Derived (Cond. 2)
Range of jet range hydrocarbons: 45 – 65% depending on feed source and process conditions

72
Meeting JP-8 Specifications: Aromatics to Meet Density Specs
OilOil Selective Cracking/Selective Cracking/IsomerizationIsomerizationDeoxygenationDeoxygenation
Green JetGreen Jet--range range
ParaffinsParaffins
Renewable Renewable JPJP--88
Aromatics(<25%)
AromaticsAromatics(<25%)(<25%)
Sources of Aromatics• Renewable sources
- Deoxygenated pyrolysis oil

73
2nd Generation Renewable Jet Fuel from Oils and Biomass
Green Jet-range Paraffins
Green Green JetJet--range range ParaffinsParaffins
Selective Cracking/
Isomerization
Selective Selective Cracking/Cracking/
IsomerizationIsomerization
Natural Oils and
Fats
Natural Natural Oils and Oils and
FatsFatsDeoxygenationDeoxygenationDeoxygenation
Renewable Renewable Jet FuelJet Fuel
Solid Biomass
Solid Solid BiomassBiomass
Catalytic Stabilization/
Deoxygenation
Catalytic Catalytic Stabilization/Stabilization/
DeoxygenationDeoxygenationPyrolysisPyrolysisPyrolysis
Jet Range Cyclic
Hydrocarbons
Jet Range Jet Range Cyclic Cyclic
HydrocarbonsHydrocarbons
UOP 4934F-16

74
Increases Availability, Reduces Feedstock CostTechnology Breakthroughs Required
MB
PD
0
10
20
Global
30
40
50US
02
4
6
8
10
Current Potential
Liquid Transport FuelsGasolineDieselCellulosic Waste
1214
MB
PD
Liquid Transport FuelsGasolineDieselCellulosic Waste
Current PotentialSource: Purvin & Gertz /Eric Larsen: Energy for Sustainable Development, 2000
Oils Productivity
142842
0
5670
Gal
lons
per
acr
e
100200
500400300
0
Source: Fulton et. al
Soybean Caster bean
Sun-flowerseed
Rape-seed
Jatropha Palm
Mill
ion
BTU
/acr
e
• Cellulosic waste could make a significant contribution to liquid transportation pool.
• Algal Oils could enable oils route to biodiesel, Green Diesel and Green Jet.
≈
3500
≈
Algae
455
Enablers for a SustainableBiomass Infrastructure

75
2nd Generation Renewable Fuels from Algae
Source: Q. Hu,
• High cellular oil content (~50% of dry weight) • High photosynthetic efficiency (10~20%)• Excellent CO2 capture and sequestration capability• Water requirement: less than 1/40 of land plants and thrive in saline/brackish/waste water
• Land requirement: desert and arid lands
UOP 4934F-18

76
An Integrated Algal Biorefinery
Water
Ecofining™Ecofining™
ProductionField
ProductionField
Processing/Extraction
Processing/Extraction
Algae, Water
H2O,Salts
AlgalOils
(GreenCrude)
Nutrients
AlgalSolids
PetroleumRefinery
PetroleumRefinery
Green DieselGreen Jet
Ag ProductsChemicalsBiofuels
CO2 input approx. 150,000 MT/yr Brackish water input approx. 20000 acre-ft/yr1000 acres non-arable land735,000 SCFD Hydrogen
INPUTS350bpd – Green Crude 110 MT/day – SolidsMinimum 330 bpd – Green Diesel or other biofuelsRemaining products defined by refinery configurationPower output defined by system economics
OUTPUTS
Power
Green Gasoline Green Olefins
IndustrialCO2 SourceIndustrial
CO2 Source
H2
CO2
Lights, Naphtha
ProcessingProcessing

77
Advantages of Algal Feedstocks
• No competition with food or agriculture• Highest productivity per acre• Environmentally friendly
- Grow on low quality land- Grow in brackish/saline water- Capture CO2- Recycle nutrients
• High-quality products (fuel and feed)
• Meet key requirements for economic and environmental sustainability- Compliant with existing infrastructure- Compatible with existing ground and air fleets- Sufficient domestic growth potential to meet demand- Fully renewable and compliant with GHG reduction targets
0
1000
2000
3000
4000
Canola Soy
Palm
Jatro
phaAlgae
Annual Oil Production (Gallons/Acre)
Algae-based fuels are the only biofuels meeting all criteria

78
pending
<0.1%
47
1.7
499
11.0
1.8
pending
Algae Oil #2
2
16 ppm
3
<1
482
11.0
0.31
0.9169
Algae Oil #1
2
2
3
2
500
11.2
1.2
.915Palm Oil
<.1
11
<1
<1
150
11.3
.04
.92
Soybean Oil
Chloride,ppm
Nitrogen
Sulfur,ppm
Metals (Na+Ca+K+Mg+Al),ppm
Water,ppm
% oxygen
TAN
DensityProperty
pending
<0.1%
47
1.7
499
11.0
1.8
pending
Algae Oil #2
2
16 ppm
3
<1
482
11.0
0.31
0.9169
Algae Oil #1
2
2
3
2
500
11.2
1.2
.915Palm Oil
<.1
11
<1
<1
150
11.3
.04
.92
Soybean Oil
Chloride,ppm
Nitrogen
Sulfur,ppm
Metals (Na+Ca+K+Mg+Al),ppm
Water,ppm
% oxygen
TAN
DensityProperty
• 3 samples of varying quality analyzed• Processing:
- Deoxygenationfollowed by
- Isomerization and/or- Cracking
• 100% DeOxygenation achieved• Substantially similar composition to
deoxygenated natural oils• Comparable DeOxy yields to palm• Readily isomerizable to Green Diesel
1.948.40.5
39.80.34.4
<0.13.3
<0.11.3
Algal Oil #1 Product (Mass %)
5.729.82.330.02.112.81.712.31.12.1
Algal Oil #2 Product
(Mass %)
2.154.72.229.21.06.60.13.2
<0.10.9
Typical Product
(mass %)
C18 isoC17 n
>C18
C18 n
C17 isoC16 nC16 isoC15 nC15 iso<C15
Component
1.948.40.5
39.80.34.4
<0.13.3
<0.11.3
Algal Oil #1 Product (Mass %)
5.729.82.330.02.112.81.712.31.12.1
Algal Oil #2 Product
(Mass %)
2.154.72.229.21.06.60.13.2
<0.10.9
Typical Product
(mass %)
C18 isoC17 n
>C18
C18 n
C17 isoC16 nC16 isoC15 nC15 iso<C15
Component
Raw Aglal Samples
Deoxygenated Samples
Algal Oil

79
Algal Oil #2: Deoxygenated & Isomerized - Properties
Density =0.756 g/mLFreeze Point = -56.7oC
JP-8 SPK quality specs metUOP 5054-21
313B2_R19 Jet Fraction Composition
1 2 3 4 5 6 7 8 9 10 11 12 13 14 15 16 17 18 19 20 21 22 23 24 250
2
4
6
8
10
12
14
16
18
20
Carbon Number
Perc
enta
ge
NormalIsomer

80
2nd Generation bio-feedstocks

81
BiofuelsSustainability
UncompromisedProduct QualityUncompromisedProduct Quality
Life CyclesLife Cycles
EmissionsEmissions
Vehicle FleetVehicle Fleet
TechnologyTechnology
LignocellulosicLignocellulosicCostCost
Net EnergyProduction ≤Consumption
Net EnergyProduction ≤Consumption
EfficiencyEfficiency
Supply ChainSupply Chain
AlgalAlgal
Energy ContentEnergy Content
DistributedDistributed
FeedstockAvailabilityFeedstockAvailabilityWorld TradeWorld Trade
StandardsStandards
Reduction inClimate Active
CO2 Equivalents
Reduction inClimate Active
CO2 Equivalents
SustainabilitySustainability
Uses Sustainable Feedstock Source
Established Technology
Supply Chain Issues Addressed
Minimizes Infrastructure Investment
Fleet Compatibility
Cost Neutral or Profitable Within The Fuel Pool
Allows Bio-component Substitution
Sustainability Scorecard
XX
XX
Renewable Fuels: Unlocking the Potential

82
• Renewables are going to make up an increasing share of the future fuels pool- Multitude of bioprocessing approaches possible- Fungible biofuels are here
• First generation biofuels, though raw material limited, are an important first step to creating a biofuels infrastructure.
• Second generation feedstocks, cellulosic waste and algal oils, have the potential to make significant contributions.
• Important to promote 1) R&D&E investment, and2) technology neutral and performance based standards and directives to avoidstandardization on old technology.
Achieving Sustainability

83
Catalyst Development
• There are many, many opportunities for catalyst discovery and development.
• In most cases catalysts have not been optimized.• Reaction mechanisms not known – e.g. how to
control lignin depolymerization.• Deoxygenation vs. debarboxylation – how to
selectively control these?• How to increase yield of pyrolysis oil?

84
Acknowledgements• Cargill
- Bruce Resnick- Michael Kennedy
• ENI- Franco Baldiraghi- Giovanni Faraci- Carlo Perego- Maria Luigina Sabatino
• MTU- David Shonnard
• NREL - Stefan Czernik- Richard Bain- David Hsu
• PNNL - Doug Elliott - Don Stevens
• Sandia- Ron Pate- Warren Cox- Peter Kobos- William Fogleman
• South West Research Institute- George Wilson
• Honeywell / UOP - Jennifer Abrahamian- Bruce Acord- Zak Alzein- Amar Anumakonda- Mark Bambacht- Emmanuel Behraz- Roy Bertola- Alak Bhattacharyya- Andrea Bozzano- Tim Brandvold- Michelle Cohn- Peter Coughlin- Mark Davis- Graham Ellis- Falaah Falih- Jack Ferber- Dan Gordon- Chris Gosling- Frank Haran- Laurel Harmon- Joe Head- Jefford Humes - Brenna Huovie- Robert Jerosky- Aaron Johnson- Mark Kaiser- Tom Kalnes- Larry Kast - Andrew Kenning- Joseph Kocal
• Honeywell / UOP- Peter Kokayeff- Mark Krawczyk- Karl Lange- Mike Laporta- Steve Lupton- Ross MacHattie- Terry Marker- Rich Marinangeli- Mike McCall- George Mickelson- Prabhakar Nair- Jeff Noga- Vic Patton- John Petri- Hung Pham- Adriaan Sachtler- Matt Schmidt- Stuart Simpson- Joyce Skrocki- John Stenger- Margo Steward- Greg Stewart- Sebastien Tixier- Mike Towner- Tim Vink- Joel Walenga- Randy Williams- Ben Wilson- Jim Woodger- Ed Yarbrough- Randy Zea
DOE, Project DE-FG36-05GO15085 Paul GrabowskiDARPA, Project W911NF-07-C-0049 Dr. Douglas Kirkpatrick