biofuels semester project third presentation
TRANSCRIPT

Dal Pastro Filippo 1035010
Marsullo Matteo 1035499
Strada Marco 1039963
Zandarin Simone 1041186

Outline of the project Substitute 10% of Italian petrol by mean of non-
fossil energyBiodiesel
Preliminary Analysis
Thermoeconomic Analysis
LCA Analysis
Electric Car
Preliminary Analysis
LCA Analysis
2

Outline of the presentation Bases for comparison
Environment
Energy
Economy
Final comparison between biodiesel-diesel cars, electric cars and traditional ones kgCO2/kmP
kgCO2eq/kmP
kgWater/kmP
TJPrimary Energy/kmP
€Fuel Costs/kmP
Note: P stands for Person
3

No Substitution: Biodiesel Proposed solution: Blend Diesel-
Biodiesel (to cover 10% of fuels consumption)
Why Biodiesel?
European Directive 2009/28/CE
No engines substitution
Established technology (I generation)
Future perspective (III generation)
Substitute 10% of Italian
petrol by mean of
non-fossil energy
Biodiesel
Preliminary Analysis
Thermoeconomic Analysis
LCA Analysis
4

Preliminary Analysis Biodiesel Quantity of fuel to cover 7,06E+10
Km/year
diesel 3,29E+06 t_diesel/year
biodiesel 3,85E+06 t_BD/year
→ 3,85E+06 t_BD/year
Land occupied
100% rapeseed 3429723,188 ha
100% sunflower 4151770,175 ha
80% rap - 20% sun 3574132,586 ha
Land currently occupied in Italy
Italian surface 3,00E+07 ha
Italian agricultural land 1,78E+07 ha
of which used (SAU) 1,27E+07 ha
Italian agricultural land to produce biodiesel → 20,08%
Mixture Calculation t/year
New diesel quantity 2,03E+07
New biodiesel quantity 5,09E+06
Mixture (%) 20,05
Substitute 10% of Italian
petrol by mean of
non-fossil energy
Biodiesel
Preliminary Analysis
Thermoeconomic Analysis
LCA Analysis
Sources: - aci.it - Sofo - Università degli Studi della Basilicata - Enea - Ministero dello Sviluppo economico - Dispense – corso Energetica Applicata 5

LCA Biodiesel – 1° Phase
Substitute 10% of Italian
petrol by mean of
non-fossil energy
Biodiesel
Preliminary Analysis
Thermoeconomic Analysis
LCA Analysis
Functional unit : kgBD
System boundaries:
Technological => rapeseed oil biodiesel, 200000 t/year,
B20 blend, Ballestra production plant
Geographical => Italy
Temporal => nowadays – 2020,
10 years plant life, no end of life
Data category : secondary Sources: - Desmet-Ballestra brochure - Progetto di ricerca – Ing. Secco – UNIPD - Carraretto et al. – Energy (2004) - UNIPD - Vlysidis et al. – Energy (2011) - Cherubini et al. – Resources, Conservation and Recycling (2009) 6

LCA Biodiesel – 2° Phase
Substitute 10% of Italian
petrol by mean of
non-fossil energy
Biodiesel
Preliminary Analysis
Thermoeconomic Analysis
LCA Analysis
Agricultural Phase
Oil Extraction Phase
Biodiesel Production Phase
Transportation
Engine
WaterSeedsFuel
Fertilizer
HexaneSteam
MethanolCaustic Solution
Fuel Steel
SeedsCrop
Meal and SkinsStack Gas
GumsWaste Water
GlycerolHydrochloric Acid
Emissions
Emissions
7

LCA Biodiesel – 3° Phase Input Output
Seeds 0.0049 kg/kgBD Biodiesel 1 kg/kgBD
Rapeseed oil 1.025 kg/kgBD Glycerol 0.1026 kg/kgBD
Methanol 0.141 kg/kgBD Meal 1.639 kg/kgBD
Water 4319.65 kg/kgBD Waste 2.461 kg/kgBD
Primary Energy 22.82 MJ/kgBD CO2 0.895 kg/kgBD
Agricultural phase 12%
Oil extraction phase 12%
Biodiesel production
phase 5%
Transportation 2%
Engine 69%
-500
-400
-300
-200
-100
0
100
200
300
400
500
600
Substitute 10% of Italian
petrol by mean of
non-fossil energy
Biodiesel
Preliminary Analysis
Thermoeconomic Analysis
LCA Analysis
8

LCA Biodiesel – 4° Phase
Substitute 10% of Italian
petrol by mean of
non-fossil energy
Biodiesel
Preliminary Analysis
Thermoeconomic Analysis
LCA Analysis
Emissions assigned only to principal product (biodiesel)
Water consumption is entirely due to agricultural phase
Waste water comes from oil extraction and BD production (chemical phases)
Wastes comes from oil extraction : non-oil part of biomass
Cars already exist : water, primary energy and raw materials not included
Oil extraction phase is the main source of emissions (excluding engine) : it is suggested to perform an analysis to evaluate if an optimization is possible
9

Thermoeconomic Analysis Biodiesel Allows to assign to each stream an
economic value
Exergy is the physical parameter used to perform the analysis
What is Exergy?
Physical parameter that permits to evaluate the quality of different forms of energy
Maximum work obtainable from a particular form of energy, using environment as a reference state
Thermoeconomic analysis consists of:
Thermodynamic analysis
Economic analysis
Exergoeconomic indicators
Substitute 10% of Italian
petrol by mean of
non-fossil energy
Biodiesel
Preliminary Analysis
Thermoeconomic Analysis
LCA Analysis
Sources: - Zhang et al. – Bioresource Technology (2003) - Coronado et al. – Renewable and Sustainable Energy Reviews (2013) - Apostolakou – Fuel Processing Technology (2009)
10

Thermoeconomic Analysis Biodiesel
Exergoeconomic Factors [-]
Mixer 2 0.002945
Mixer 1 0.004359
Reactor 0.01252
Pump 3 0.01349
Separator N 0.02773
Separator P 0.0473
Wash 0.08677
Heat Exch 2 0.08971
Neutralization 0.1067
Heat Exch 1 0.1161
Pump 4 0.1622
Pump 2 0.2441
Pump 1 0.2627
Distillation 0.9209 Pump 3 : methanol recycle
!
11

Thermoeconomic Analysis Biodiesel
Exergoeconomic Factors [-]
Mixer 2 0.002945
Mixer 1 0.004359
Reactor 0.01252
Pump 3 0.01349
Separator N 0.02773
Separator P 0.0473
Wash 0.08677
Heat Exch 2 0.08971
Neutralization 0.1067
Heat Exch 1 0.1161
Pump 4 0.1622
Pump 2 0.2441
Pump 1 0.2627
Distillation 0.9209 Separator N : H2O+methanol, biodiesel, oil
Separator P : H2O+methanol, glycerol
!
!
12

Thermoeconomic Analysis Biodiesel
Exergoeconomic Factors [-]
Mixer 2 0.002945
Mixer 1 0.004359
Reactor 0.01252
Pump 3 0.01349
Separator N 0.02773
Separator P 0.0473
Wash 0.08677
Heat Exch 2 0.08971
Neutralization 0.1067
Heat Exch 1 0.1161
Pump 4 0.1622
Pump 2 0.2441
Pump 1 0.2627
Distillation 0.9209 Distillation : methanol recirculation
€
13

Substitution: Electric Car Proposed solution: substitute
traditional car whit Electric Car (to cover 10% of fuels consumption)
Why Electric Car? Electric power plants are more efficient
than combustion engines
Stack gases treatment systems are more efficient in electric power plants than in ICE cars
Italian drivers covers less than 30 km per day
14

Preliminary Analysis Electric Car
Cars to be substituted 24.53 %
Time of substitution
(25% new registration per year are electric) 18.21 years
Surplus of electric energy to be produced 4.84*1010 MJ/year
T = total fuel energy consumption (100%)
Substitute 10% of Italian
petrol by mean of
non-fossil energy
Electric Car
Preliminary Analysis
LCA Analysis
Sources: - aci.it - Enea – Quaderno Trasporti (2011) - Tegon – Tesi (2010) - UNIPD
15

LCA Electric Car – 1° Phase
Substitute 10% of Italian
petrol by mean of
non-fossil energy
Electric Car
Preliminary Analysis
LCA Analysis
Functional unit : kmP
System boundaries :
Technological => Italian electric fleet, grid, existing electric cars
Geographical => Italy
Temporal => Nowadays-2020, 15 years car life, no end of life analysis
Data Category : Secondary
Sources: - aci.it - Enea – Quaderno Trasporti (2011) - GEMIS database - Hongrui et al. – Energy Policy (2012)
16
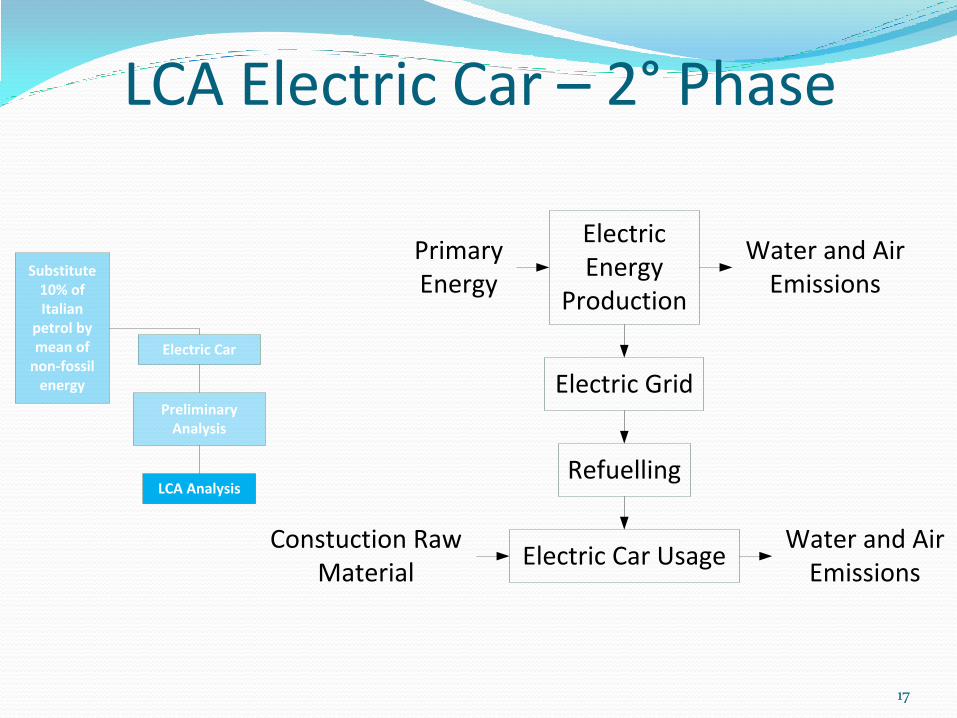
LCA Electric Car – 2° Phase
Substitute 10% of Italian
petrol by mean of
non-fossil energy
Electric Car
Preliminary Analysis
LCA Analysis
Primary Energy
Electric Energy
Production
Water and Air Emissions
Electric Grid
Constuction Raw Material
Electric Car Usage
Refuelling
Water and Air Emissions
17

LCA Electric Car – 3° Phase
Substitute 10% of Italian
petrol by mean of
non-fossil energy
Electric Car
Preliminary Analysis
LCA Analysis
0.0E+00
2.0E-04
4.0E-04
6.0E-04
8.0E-04
1.0E-03
1.2E-03
1.4E-03
Impact categories • C2 Stratospheric ozone depletion
• C7 Non-renewable resources consumption
• C1 Greenhouse
• C3 Acidification
• C6 Toxicity
18

LCA Electric Car – 3° Phase
Substitute 10% of Italian
petrol by mean of
non-fossil energy
Electric Car
Preliminary Analysis
LCA Analysis
GWP Indexes CO2 => 1 gCO2eq
CH4 => 21 gCO2eq
N2O => 310 gCO2eq
0.0E+00
1.0E-06
2.0E-06
3.0E-06
4.0E-06
5.0E-06
6.0E-06
7.0E-06
R134a => 1300 gCO2eq
PFM => 6500 gC02eq
PFE => 9200 gCO2eq
19

LCA Electric Car – 4° Phase
Substitute 10% of Italian
petrol by mean of
non-fossil energy
Electric Car
Preliminary Analysis
LCA Analysis
GEMIS fixes refuelling efficiency to 100%
Utilization phase considers emissions only coming from car construction phase
Long term observation : coal electric production is the most relevant from an environmental point of view (CO2 emissions) even though it covers only 12% of total energy production, it is suggested to improve renewable energy supply
20

Final Comparison Electric Car B20 Blend Car Traditional Car Unit
CO2 1.24*10-1 1.56*10-1 1.87*10-1 kg/kmP
CO2eq 1.41*10-1 1.65*10-1 1.97*10-1 kg/kmP
Water 4.54 3.79*101 2.69 kg/kmP
Primary Energy 2.50*10-6 2.37*10-6 2.73*10-6 TJ/kmP
Fuel Costs 2.55*10-3 8.16*10-2 9.14*10-2 €/kmP
Most suitable solution: Electric Car
Lowest CO2 emissions
Lowest Fuel Costs
21

Final Comparison Environmental comparison :
ICE utilization (even with B20) involves a pollution localized in urban centers
Stack gases treatment systems are more efficient in electric power plants than in ICE cars
B20 production has the most relevant water consumption
Economical comparison : Fuel costs for B20 were calculated without considering taxes
on the whole biodiesel production
Costs do not include electric car sell prices, currently too high to promote a large scale diffusion
Energy comparison : Energy consumption is similar for each technology
considered 22

THANK YOU FOR THE ATTENTION
GRAZIE PER L’ATTENZIONE
23