biodiversity and succession of microbial community in a multi-habitat membrane bioreactor
TRANSCRIPT
Accepted Manuscript
Biodiversity and Succession of Microbial Community in a Multi-habitat Mem-brane Bioreactor
Bing Tang, Zi Zhang, Xuan Chen, Liying Bin, Shaosong Huang, Fenglian Fu,Huiwen Yang, Cuiqun Chen
PII: S0960-8524(14)00666-XDOI: http://dx.doi.org/10.1016/j.biortech.2014.05.007Reference: BITE 13415
To appear in: Bioresource Technology
Received Date: 18 February 2014Revised Date: 26 April 2014Accepted Date: 2 May 2014
Please cite this article as: Tang, B., Zhang, Z., Chen, X., Bin, L., Huang, S., Fu, F., Yang, H., Chen, C., Biodiversityand Succession of Microbial Community in a Multi-habitat Membrane Bioreactor, Bioresource Technology (2014),doi: http://dx.doi.org/10.1016/j.biortech.2014.05.007
This is a PDF file of an unedited manuscript that has been accepted for publication. As a service to our customerswe are providing this early version of the manuscript. The manuscript will undergo copyediting, typesetting, andreview of the resulting proof before it is published in its final form. Please note that during the production processerrors may be discovered which could affect the content, and all legal disclaimers that apply to the journal pertain.

Essential Title Page Information
Biodiversity and Succession of Microbial Community in a Multi-
habitat Membrane Bioreactor
Bing Tang a, *
, Zi Zhang a, Xuan Chen
a, Liying Bin
a, Shaosong Huang
a, Fenglian Fu
a,
Huiwen Yang a, Cuiqun Chen
a
a School of Environmental Science and Engineering, Guangdong University of Technology,
Guangzhou, 510006, P. R. China
* Corresponding author. Tel. : +86 20 39322295; Fax: +86 20 38457257
E-mail address: [email protected] (B. Tang)
1
Abstract: The present study focused on establishing a multi-habitat membrane bioreactor,
as well as exploring its biodiversity and succession of microbial communities. In a long-
term operational period (100 days), the dissolved oxygen level of a local zone within the
bioreactor decreased consistently from the original oxic state to the final anaerobic state,
which led to a continuous succession of the microbial community in the bioreactor. The
results revealed that the biodiversity of the microbial community in different zones
simultaneously increased, with a similar microbial composition in their final successional
stage. The results also indicated that the dominant species during the whole operation were
distributed among 6 major phyla. At the initial operational stages, the dominant species in
the anoxic-anaerobic and the oxic zones exhibited distinguished difference, whereas at the
final operational stage, both zones presented nearly the same dominant microbial species
and a rather similar structure in their microbial communities.
Keywords: Multi-habitat; Membrane bioreactor; Microbial community; Biodiversity;
Succession;
1. Introduction
In wastewater treatment plants (WWTPs) or other bioreactors, sufficient and stable
biomass is a vital factor, which is largely responsible for the quality of the effluent. The
biomass in bioreactors contains many microorganisms, generally forming explicit microbial
communities, and their composition and structure in geographically distributed bioreactors
are highly consistent (Xia et al., 2010). In this regard, a bioreactor (or a WWTP) can be
regarded as an artificial microbial ecosystem, through which mass and energy may be
transferred from the primary to the last trophic level. In terms of microbial ecosystem, a
common viewpoint that has been widely accepted is that if the biodiversity of an ecosystem
2
is higher, then greater stability will be achieved (Enger & Smith, 2012), and thus, effective
and rapid transfer of mass and energy in the system will be accomplished (Ye et al., 2012).
The biodiversity of an ecosystem is closely related to the habitats of the organisms, which
totally depend on the environmental conditions. Therefore, multi-environmental conditions
are favorable for increasing the biodiversity of an ecosystem, which can further improve the
stability of an ecosystem to resist external disturbance. Development of multi-
environmental conditions in artificial ecosystems, such as a WWTP or bioreactors for
treating wastewater, is of primary importance for guaranteeing high quality of effluents
when treating complex pollutants.
The membrane bioreactor (MBR) has been a hotspot in the field of wastewater
treatment and water reuse over the past decade, due to its advantages of combining the cost-
effectiveness of a conventional activated sludge (CAS) process and separation efficiency of
membrane filtration. Previous investigations have confirmed that the advantages of an
MBR for purifying both domestic and industrial wastewater are very obvious in several
aspects, including less excess sludge production, relatively small space requirement,
reduced footprint, and superior effluent quality (Mutamim et al., 2013; Kraume & Drews,
2010; Le-Clech, 2010). The predominant merit of an MBR is the total retention of the
microorganisms by the membrane module, which enables separation of sludge retention
time (SRT) from hydraulic retention time (HRT), making it possible to operate the
bioreactor with very high biomass. This advantage is especially beneficial to the survival
and growth of the microorganisms with long generation cycles, which can greatly improve
the biodiversity of a bioreactor.
3
For optimizing the performance of an MBR, researchers have tried to configure a
combined MBR system to create more complex microbial communities for the convenience
of treating hard-biodegraded pollutants (Qiu et al., 2013; Xia et al., 2012; Yang et al., 2012).
The most frequently used configuration is the arrangement of sequential or alternating
anoxic–oxic (A/O) zone in the reactor (Fernandes et al., 2013; Fu et al., 2009; Mcllroy et al.,
2011). Miura et al. (2007) revealed the relationship between community stability and
reactor performance by comparing a pilot-scale conventional MBR with a hybrid MBR
combined with pre-coagulation/sedimentation process, and found that the configurations of
a system heavily influenced the bacterial community. The A/O-MBR system built by Tan
& Ng (2008) was a bi-chamber pre-denitrification submerged MBR separated by a baffle
plate, the mixed liquor was pumped to circulate between the anoxic and the oxic zones for
achieving nitrification-denitrification of the N-containing substances. The alternate A/O
condition in space was the essential requirement for total N removal, and suitable mixed
liquor recycle ratio and aeration rate were the two controlling factors. On the other hand, Fu
et al. (2009) established a modified A/O-MBR without any circulation, in which
phosphorus (P)-accumulating organisms accumulated, leading to the simultaneous removal
of C, N and P. Li et al. (2010) developed a lab-scale MBR, with an anoxic and an oxic zone
in a single reactor by mounting an air diffuser in the middle of a vertical device. The mixed
liquor was pumped from the oxic to the anoxic zone by a recycle pump. The special
configuration of the reactor and the accumulated biomass within it ultimately led to the
formation of a vertical oxygen gradient, which was responsible for the realization of
nitrification-denitrification.
4
Currently, a consensus has been reached in terms of the relationship between the
microbial community structure and its function; i.e., the microbial community composition
is very important with respect to the way in which the ecosystem functions (Fuhrman,
2009), and also, it is an important factor affecting the operational properties of an MBR
(Teksoy Başaran et al., 2012). In an aqueous environment, the concentration of DO is
generally a limiting factor determining the state of the environment, namely, oxic, anoxic,
or anaerobic environment. The value of dissolved oxygen (DO) entirely determines the
survival state and activity of different species of microorganisms by influencing their
habitats. Such a principle has been widely employed in the traditional bio-techniques, such
as an A/O or anaerobic–anoxic–oxic (A2/O) process, for treating organic pollutants and
nutrients (N and P). Numerous engineering experiences and related scientific investigations
have confirmed that only the complex microbial communities (or microbial ecosystem),
and not the single species of microorganism, can realize the effective degradation of
complex organic pollutants or transformation of N- and P-containing compounds (Han et
al., 2012; Wagner & Loy, 2002). Such a fact greatly emphasizes the importance of
establishing a multi-environment in a single MBR for maintaining a diversified and
complex microbial ecosystem.
It must be noted that all the above-mentioned studies on MBRs had mainly focused on
creating diversified operational conditions by forming alternating aerobic or anaerobic
conditions in a time sequence or space distribution, and that most of them had actually
configured relatively independent aerobic and anaerobic chambers, and recycled the
biomass between them with an external circulating pump. From an ecological viewpoint,
multi-habitat is a pivotal guarantee for the biodiversity of an ecosystem. Such a perspective
5
can be logically transferred for the optimization of the performance of an MBR; in other
words, the formation of a multi-habitat in a single MBR may bring about a novel effect on
the biodiversity and succession of the microbial community. Thus, in the present study, we
proposed that a multi-habitat may be formed in a single MBR by internal circulation and
accumulated biomass. To evaluate the hypothesis, a lab-scale MBR with internal
circulation was designed and set up, whose microbial communities at different zones and
stages were analyzed by using modern molecular biological technique to understand its
biodiversity and successional characteristics.
2. Materials and Methods
2.1 Experimental configuration
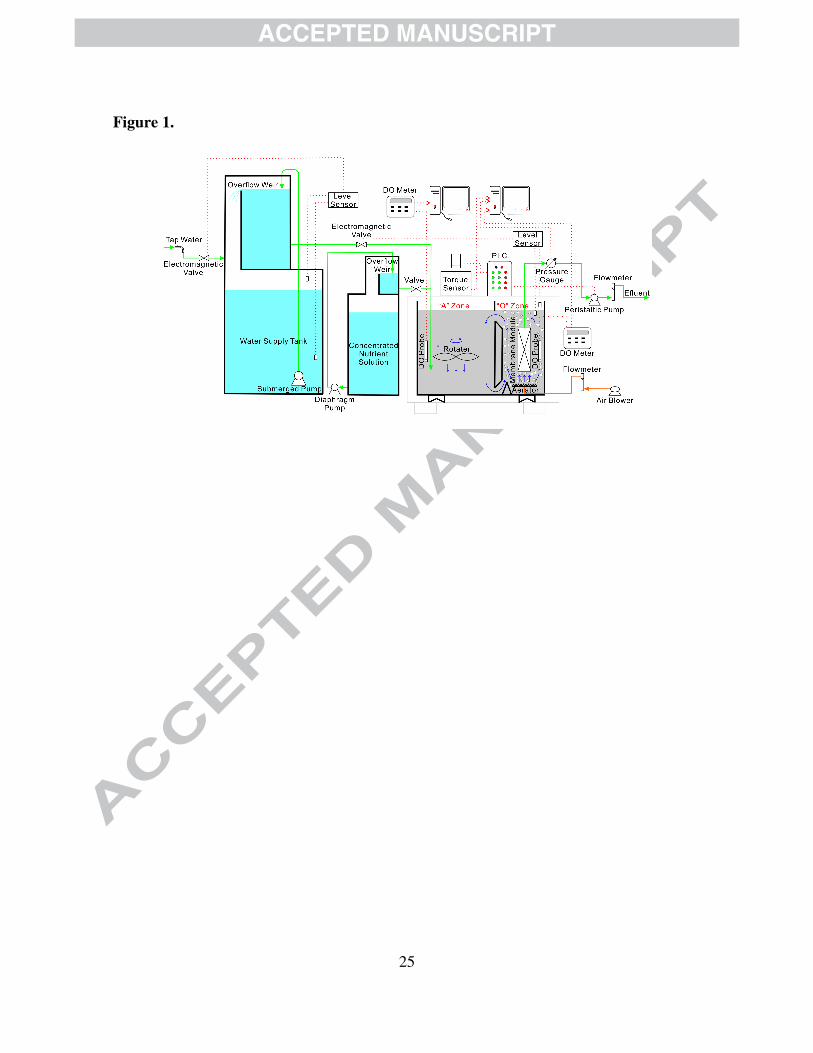
An MBR with an effective working volume of 36 L was established by configuring
two half chambers – one chamber, with about one-third of the total working volume, served
as the oxic (“O”) zone and the other acted as the anoxic-anaerobic (“A”) zone. In the “O”
zone, an air diffuser was fixed below the membrane module (hydrophilic PVDF hollow
membrane with a pore size of 0.22 µm and surface area of 0.5 m2) to blow air bubbles for
providing DO and push the mixed liquor upward. In the middle of the “A” zone, a rotator,
connected to a torque sensor, was mounted to provide a mixing condition and drive the
mixed liquor downward. A baffle plate with deflector was set vertically between the “O”
and “A” zones. With the upward and downward flow on two sides and the guidance of the
deflector, an internal hydraulic circulation was formed to impel circulating of the mixed
liquor between the “O” and “A” zones without the need for an external circulating pump.
With the stream guidance of the deflector and under a suitable hydrodynamic condition, an
6
internal circulation for recycling the biomass inside the bioreactor could be steadily
sustained. The complete retention of the microorganisms by the membrane module
accelerated the accumulation of biomass, and increasingly improved oxygen consumption
in the half chamber without aeration, thus creating a multi-habitat in the bioreactor, which
led to diversified and successional microbial communities. The schematic diagram of the
MBR is shown in Fig. 1. The multi-habitat MBR with internal circulation was operated for
100 days, the activated sludge in the bioreactor was sampled at different time interval to
analyze the microbial composition. The daily concentration of MLSS was determined by
averaging the values obtained for both “O” and “A” zones at the same time every day. The
DO concentrations in both “O” and “A” zones were automatically and simultaneously
measured by the DO probes every 10 s, and the daily DO concentration of each zone was
the average value of the corresponding DO concentrations measured on the same day
(0:00–24:00).
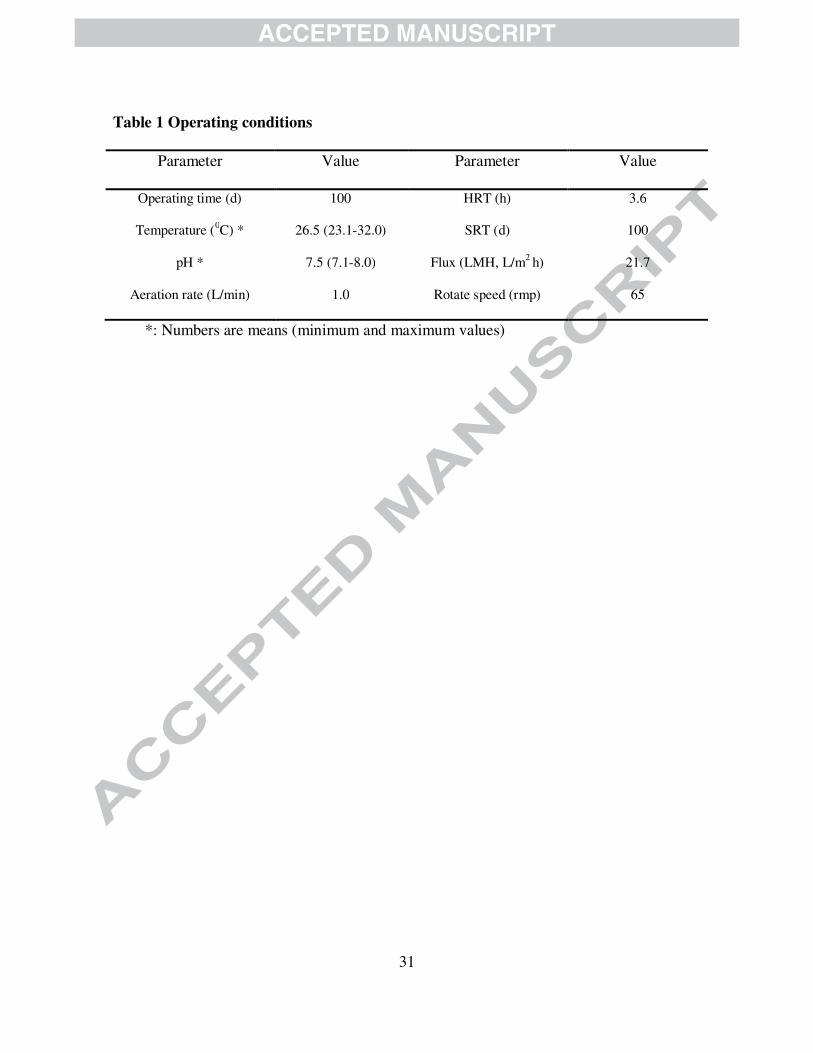
2.2 Operating conditions
About 36 L activated sludge, obtained directly from the aeration tank of a local
WWTP (Lijiao municipal wastewater treatment plant, located in Haizhu district,
Guangzhou, China), was put into the used bioreactor as inoculated sludge. The inoculation
concentration was controlled at about 4000 mg/L MLSS as the concentration in the original
aeration tank. The influent was synthetic wastewater obtained by mixing tap water with
concentrated nutrient solution. The concentrated nutrient solution, with the ratio of COD: N:
P at 100: 5: 1, was prepared by dissolving chemically pure glucose (375 mg/L, 562.5 mg/L,
750 mg/L), urea (42.3 mg/L, 63.4 mg/L, 84.6 mg/L) and KH2PO4 (17.6 mg/L, 26.3 mg/L,
35.1 mg/L) in tap water; other nutrients included: 160 mg/L of NaHCO3, 132 mg/L of

7
MgSO4, 12 mg/L of MnSO4⋅H2O, 8 mg/L of CaCl2, and 0.6 mg/L of FeSO4⋅7H2O. The
influent concentrations of COD were controlled at 400 mg/L from 1st to 46
th day, 600 mg/L
from 47th
to 66th day, and 800 mg/L from 67
th to 100
th day, respectively. Under a steady
flow and with a relatively constant quality, the influent from two high water tanks with an
overflow weir was injected into the bioreactor from the bottom of the “A” zone, and a
peristaltic pump connected to the membrane module was used to pump out the effluents
(controlled by a time-relay, 8 min filtration and 2 min pause). To evaluate the influence of
biomass proliferation on the bioreactor performance, no sludge was discharged, except
sampling for analysis during the operating period. The water level in the bioreactor, the
water level in the supply tank, and the water flow from the water supply tank were
automatically controlled by a programmable logic controller, and the operational conditions
are summarized in Table 1.
2.3 Analytical Methods
CODCr, NH4+-N, NO2
−-N, NO3
−-N, TP, TN and MLSS were all measured according to
the standard methods (APHA et al., 2005). The values of DO were automatically measured
and stored every 10 s in a computer by using two DO detectors (JPSJ-605F, INESA, China)
installed in the “O” and “A” zones, respectively. The values of pH were measured by a pH
meter (pH2-S, INESA, China).
2.4 Microbial community Analysis
To analyze the structure and evaluate the succession of the microbial community in
the bioreactor during the operational period, mixed liquor samples were taken
simultaneously from the same position of the “O” and “A” zones after operating for 1, 10,

8
30, 50, 70, and 90 days, respectively. The samples obtained on the first day were the
inoculated sludge, which represented the original community in the bioreactor, and were
labeled as “S.” Other samples represented the microbial community of different
successional stages, which were marked as stage-1, stage-2, stage-3, stage-4, and stage-5,
respectively, and were labeled with the corresponding number; e.g., the samples taken from
the “O” and “A” zones on the 10th day represented the stage-1 microbial community, which
were labeled as “O1” and “A1,” respectively, and so forth. The samples collected from
different zones at various stages were analyzed by PCR-DGGE, and the dominant species
identified on the DGGE bands were chosen for sequence analysis with 16 S rDNA clone
libraries.
2.5 DNA extraction and PCR amplification
DNA was extracted using an E.Z.N.A.TM
Soil DNA Kit (Omega, Bio-Tek, Norcross,
GA, USA) according to the manufacturer’s instructions. For DGGE analysis, 16 S rRNA
gene fragments were amplified from the extracted total DNA obtained from the samples
with 2×PCR MasterMix (Genebase, China) by using the primer set 357f-GC (5´-GC-clamp-
CCTACGGGAGGCAGCAG-3´) and 518r (5´-ATTACCGCGGCTGCTGG-3´). A 40-bp
GC-clamp (CGCCCGCCGCGCGC-GGCGGGCGGGGCGGGGGCACGGGGGG) was
attached to the 5´-end of the forward primer (357f-GC). PCR amplification was performed
in a 50-µL reaction mixture containing 25 µL of 2×PCR MasterMix, 2 µL of each primer
(10 µM), and 1 µL of the template DNA. PCR was carried out in a thermocycler (PTC-100,
Bio-Rad, USA) under the following conditions: initial denaturation at 94°C for 5 min,
followed by 30 cycles of denaturation at 94°C for 30 s, primer annealing at 56°C for 30 s,

9
and primer extension at 72°C for 1 min. A final extension step was carried out at 72°C for
10 min prior to cooling at 10°C. The PCR products were electrophoresed on a 1.2%
(wt./vol.) agarose gel.
2.6 DGGE analysis
The PCR-amplified DNA fragments were separated on polyacrylamide gels (8%,
37.5:1 acrylamide-bisacrylamide) in 0.5×TAE buffer (20 mM Tris-acetate, 10 mM sodium
acetate, and 0.5 mM Na2EDTA; pH 7.4) using a denaturing gradient ranging from 35 to
60% (100% denaturant contained 7 M urea and 40% (v/v) formamide), as described by
Miura et al. (2007). Using 100 ng of the PCR products, DGGE was performed with a
DCodeTM
Universal Mutation Detection System (Bio-Rad, Hercules, CA, USA).
Electrophoresis was initially carried out at 60°C for 20 min at 100 V, and then, for 12.5 h at
80 V. Subsequently, the gel was soaked for 15 min in SYBR Green I (1:10000, Probe,
China), and then visualized with a gel imaging system (UVP, Upland, CA, USA).
2.7 Cloning and sequencing
The targeted bands chosen for sequence analysis were carefully excised from the
DGGE gel with a sterile scalpel. For each selected band, only the middle portion of the
band was excised. Then, the slices were placed in 1.5 mL of sterilized screw-cap
polypropylene tubes, and 40 µL of TE buffer was added to it. The DNA was allowed to
passively diffuse into water at 4°C overnight (Liu et al., 2007). Then, 3 µL of the eluate
was used as template DNA for PCR carried out with the primers and conditions described
earlier (see Section 2.5) for all sludge samples. The PCR products were purified with a
SanPrep Column PCR Product Purification Kit (Sangon, Biotech Co., Ltd., Shanghai,
China), and 5 µL of each PCR product was subjected to agarose gel electrophoresis to

10
check product recovery and estimate product concentration. Furthermore, 5 µL of each
reaction mixture were also subjected to DGGE analysis to confirm the melting behavior of
the recovered band. The remaining PCR products (40 µL) were subjected to sequence
analysis (Sangon Biotech Co., Ltd., Shanghai, China). For nucleotide sequence analysis,
the bands on the DGGE gel were excised, amplified, cloned, and sequenced for identifying
the dominant species. Each unknown sequence was submitted to the Basic Alignment
Search Tool (BLAST) search and verified by comparing with the known sequences in the
National Center for Biotechnology Information (NCBI) database. The phylogenetic tree
based on the 16 S rDNA nucleotide sequences was generated by using MEGA4.1 software
(Kumar et al., 2008).
2.8 Calculation of similarity and diversity indexes
To understand and evaluate the structure and succession of the microbial community
in the “O” and “A” zones of the bioreactor, characteristic parameters such as similarity and
diversity indexes were calculated from the DGGE band profiles. To evaluate the structural
similarity between the microbial communities at different stages, Dice index (Cs) of
similarity, as defined by Eq. (1), was used to quantify the pair-wise community similarity,
as described by LaPara et al. (2002).
)(2
yx
cs SS
SC
+= (1)
where Cs is the Dice index, Sx and Sy are the total numbers of DGGE bands in lane x and
lane y, respectively. Sc is the number of common bands between lane x and lane y. The
values of Cs ranged from 0 to 1, representing no common band and totally identical band
patterns, respectively.
11
The biodiversity of the microbial community (species richness) in the bioreactor at
different stages was quantitatively determined by the Shannon-Wiener diversity index (H´)
(Eichner et al., 1999), as defined by Eq. (2):
)log('N
nN
nH ii ⋅−= ∑ (2)
where H ´ is the Shannon-Wiener diversity index, ni is the number of a detected
microorganism (i) to the total communities, N is the total number of microbial species in
the samples.
2.9 Analysis of the successional route of the community
Nonmetric multidimensional scaling (NMDS) analysis is a commonly used tool to
compare the similarity and dissimilarity between two complex systems. By plotting the
NMDS analysis results in time series, a visualized description of the succession of an
ecosystem with the increasing operation time could be obtained. The presence and absence
of DGGE bands in the “A” and “O” zones at the same stage were used to generate a binary
data set. By using this approach, a distance matrix could be obtained to construct a NMDS
map, in which the dotted point represents the community structure of the zone at a given
stage of the bioreactor. The distance between two points indicates the similarity of the
communities, and the connecting lines between the points of the same zone, i.e., “A” or
“O” zone, can be used to visualize the successional route of the community in the
bioreactor.

12
3 Results and discussion
3.1 Biomass Proliferation and formation of multi-habitat in the bioreactor
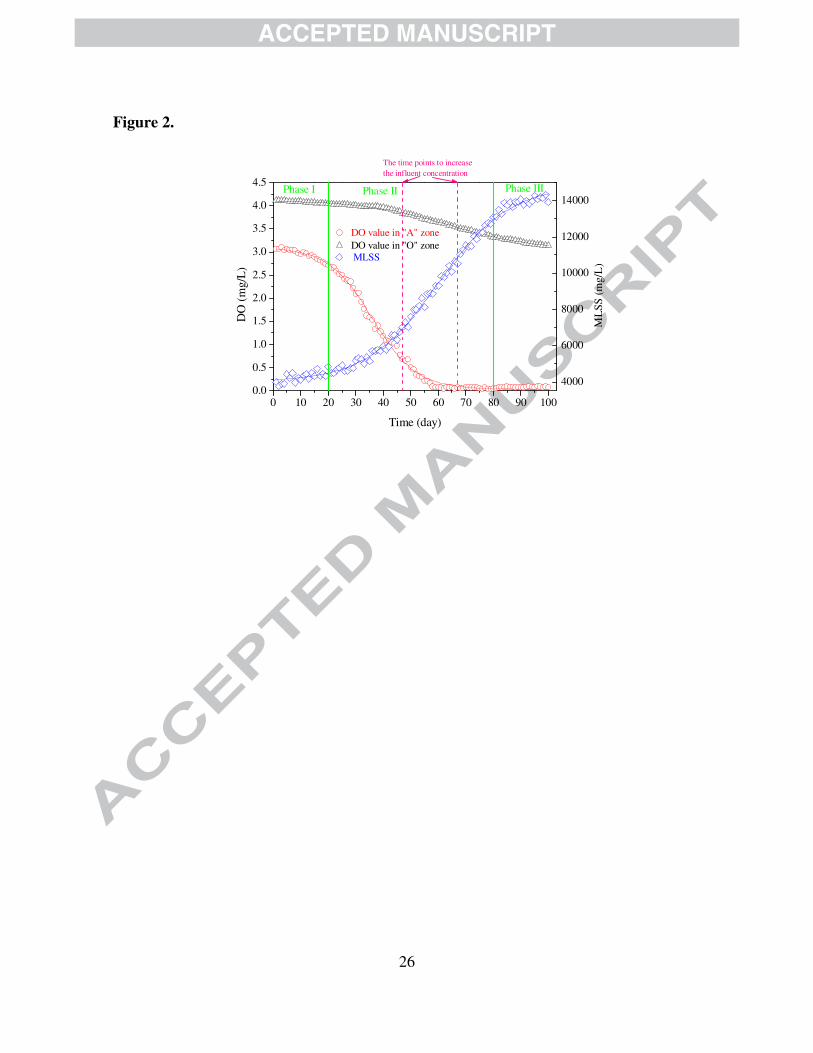
According to the presented methods, the concentration of MLSS in the bioreactor and
the DO values in both the “A” and “O” zones were measured every day. The results of
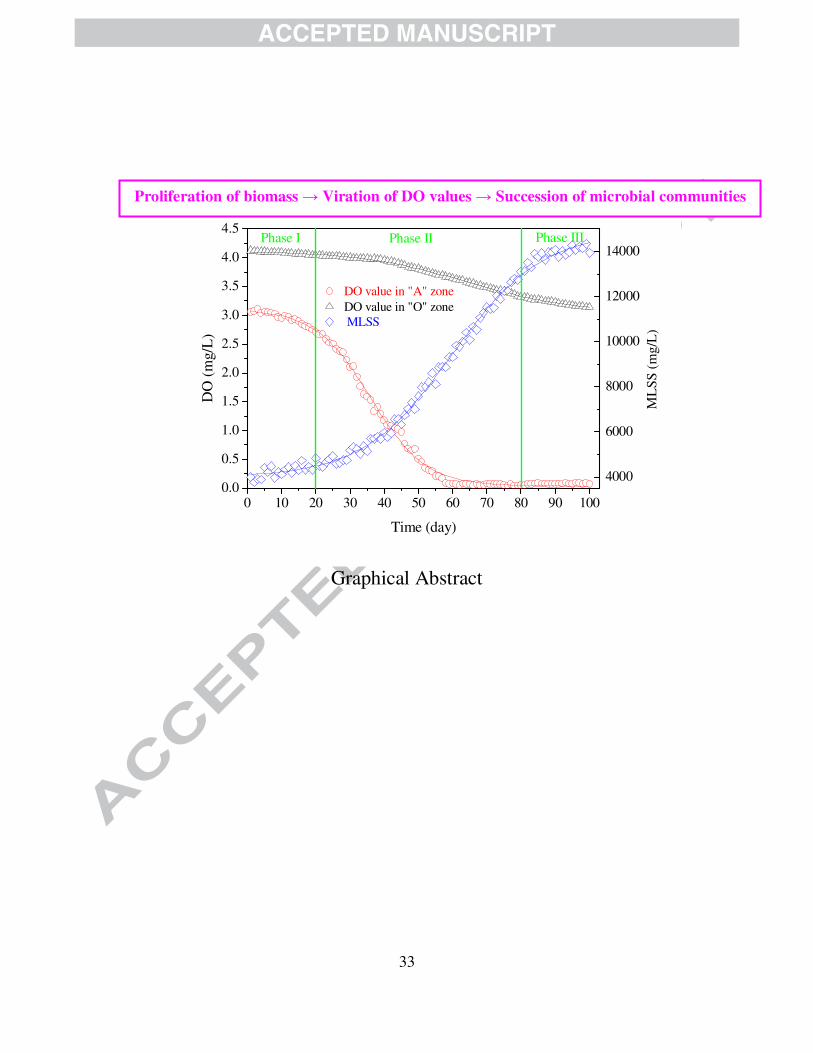
biomass proliferation and variation in DO level are shown in Fig. 2.
With complete biomass retention by the membrane module, the biomass gradually
proliferated with time. As shown in Fig. 2, the whole operational period could be
approximately divided into three phases according to the increasing rate of biomass
proliferation. The first phase was from the first day to the 20th day; in this period, the
biomass concentration increased very slowly, indicating that the microorganisms were
adapting to the new environment and that the bioreactor was in the start-up stage with the
differences in the DO level between the “O” and “A” zones ranging from 1.06 to 1.33 mg/L.
The second phase was from the 21st to 80
th day; in this period, the biomass proliferated very
quickly, which led to the obvious decline in the DO values in the “A” zone and increased
difference in the DO level between the “A” and “O” zones. Furthermore, after operating for
more than 50 days, the DO value in the “A” zone decreased to less than 0.2 mg/L. From the
81st day, the third phase commenced, during which the growth of the biomass slowed down,
with more than 13000 mg/L MLSS in the bioreactor, and the DO values in the “O” zone
still remained above 3.1 mg/L. These experimental results demonstrated that the established
bioreactor, with complete retention of the sludge by the membrane module, could
accumulate a considerably higher concentration of biomass than a CAS bioreactor. Large
quantity of DO was consumed in the “A” zone of the bioreactor, which disrupted the
balance between aeration and oxygen consumption in this zone, thus creating a multi-
13
habitat in a single bioreactor. Due to its diversified habitat, this bioreactor was called the
multi-habitat membrane (MHMBR).
3.2 General performance of the MHMBR
For evaluating the general performance of the MHMBR, several conventional water
quality indices, including CODCr, NH4+-N, TN, and TP, were chosen as evaluation
parameters, and their removal efficiency was calculated by considering the difference in the
corresponding index at the inlet and outlet of the bioreactor. The results of the average
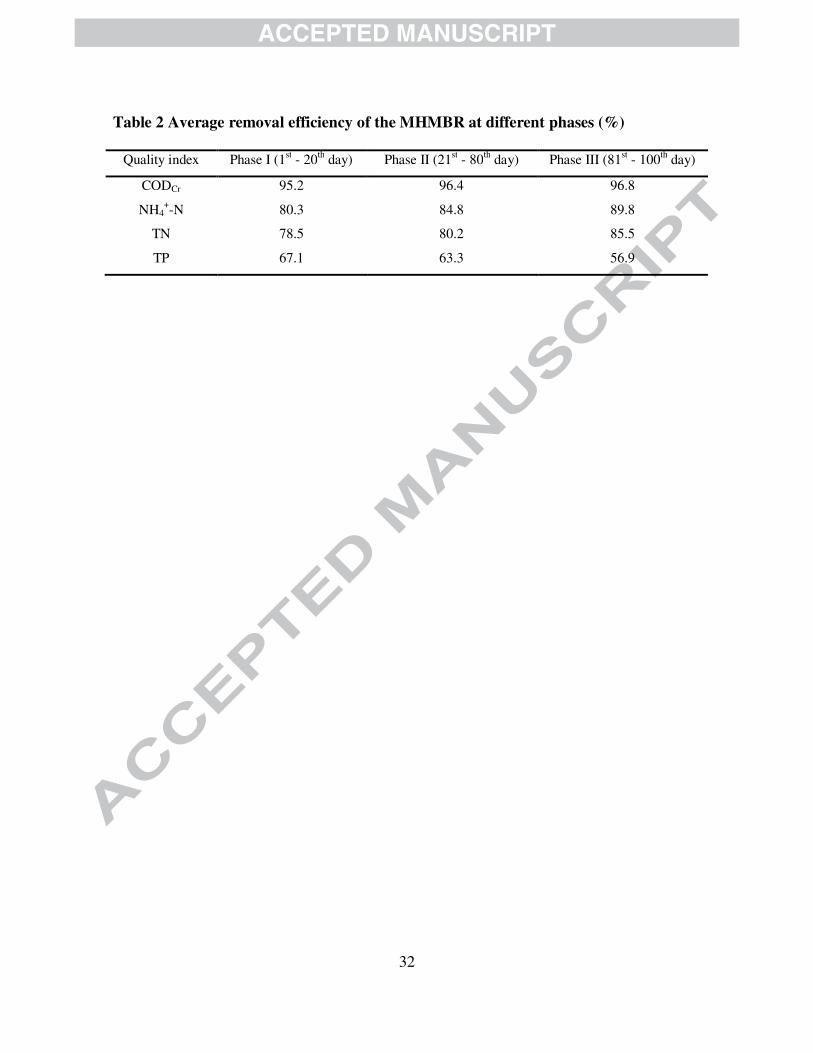
removal efficiency of the MHMBR are summarized in Table 2 according to the respective
operational phases.
The removal efficiency of each quality index was its arithmetic average value of the
corresponding operational phase determined based on the daily measurement. The COD
removal was quite steady, with the average removal efficiency over 95% in all the phases.
The removal of NH4+-N and TN presented the same tendency of increase with the extension
of operation time, exhibiting an enhanced effect on removing N-containing pollutants. For
there was no excess sludge discharged during the whole operational period, the P-
containing substances gradually accumulated in the MHMBR, and in the last operational
phase, more and more TP was released in the “A” zone, which obviously lowered the TP
removal efficiency.
3.3 Similarity and its evolution of the microbial communities in the bioreactor
The performance of the MHMBR clearly indicated that a multi-habitat was formed
inside the experimental bioreactor, which was developed primarily because of the
imbalance between the aeration and oxygen consumption caused by the proliferation of
biomass. For further understanding of the similarity and its evolution of the microbial

14
communities in different zones and at various stages of the bioreactor, DGGE method was
used first to detect the species in both “O” and “A” zones, then, the similarity index
between the two inhibits defined by Eq. (1), was quantitatively calculated, with its results
processed by a software (Quantity One 4.6.2, Bio-Rad, USA) to obtain a visual description
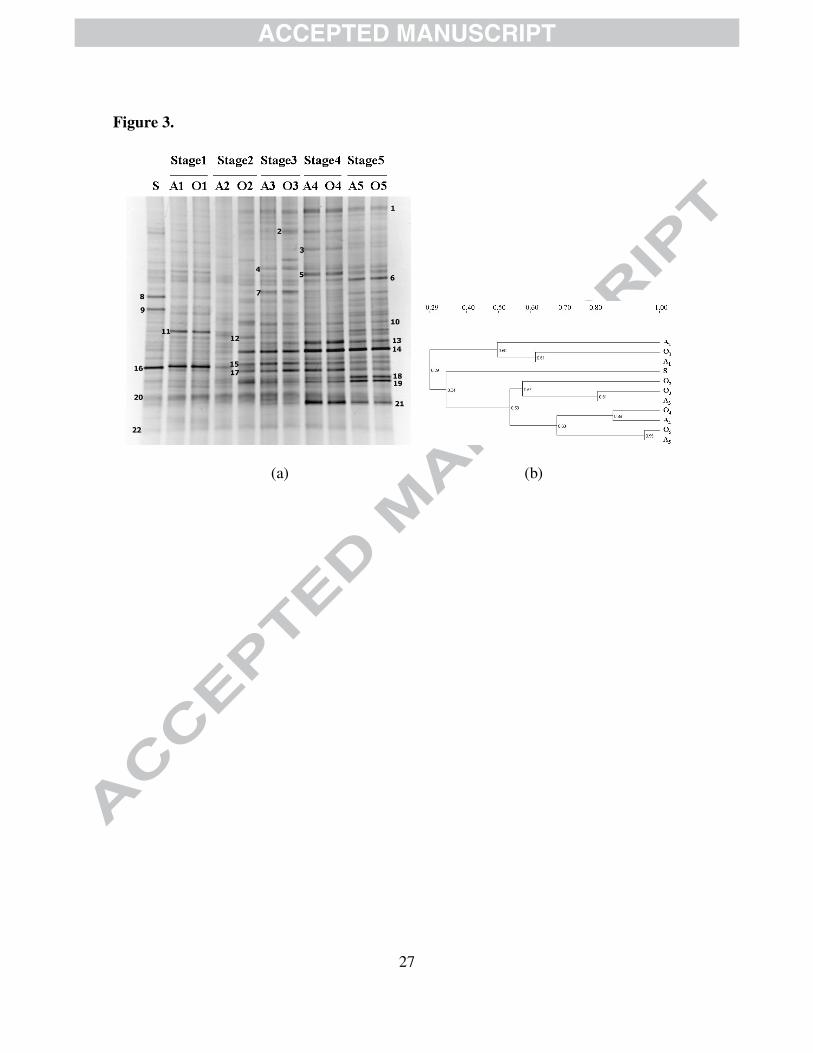
of the similarity in the microbial communities. All of the results are shown in Fig. 3.
Fig. 3(a) shows the DGGE fingerprint patterns, in which each band stands for a
microorganism species, and higher gray level denotes greater richness of the corresponding
species. Fig. 3(b) shows the quantitative calculation result in the microbial communities of
the bioreactor. The similarity index was only 0.29–0.34 in the microbial communities
between the inoculated sludge and other operating stages in the MHMBR, which indicated
that the microbial community in the inoculated sludge (S) was very different from that of
the other sludge samples. The inoculated sludge was obtained from a local WWTP, whose
operational conditions were quite different from those of the lab-scale bioreactor; thus, the
microbial community in the reactor markedly changed after 10 days of operation. At stage-
1, the difference in the DO values between the “A” and “O” zones was only about 1.0 mg/L,
which indicated that the “A” and “O” zones were still in a similar aerobic state, thus
resulting in moderate similarity (0.61) in their community structures. After 30 days of
operation of the bioreactor, i.e., stage-2, the DO value decreased to less than 1.0 mg/L in
the “A” zone, whereas it was still more than 3.5 mg/L in the “O” zone. As a result, at this
stage, the microbial communities in the two zones showed a marked difference. However,
at stage-2, the microbial communities in the “A” zone exhibited a moderate similarity (0.5)
with those observed at stage-1 in both “A” and “O” zones, which implied certain continuity
in the community structure among them. At stage-3, after operation of the bioreactor for 50
15
days, the DO values declined to less than 0.20 mg/L in the “A” zone. A higher value (0.81)
of the similarity index at this stage indicated the same tendency of the variation in the
microbial communities between “A” and “O” zones. After stage-3, the similarity index
increased from 0.86 (stage-4) to 0.95 (stage-5), which further confirmed the approaching
trend of the microbial communities between “A” and “O” zones with the increasing
operation time.
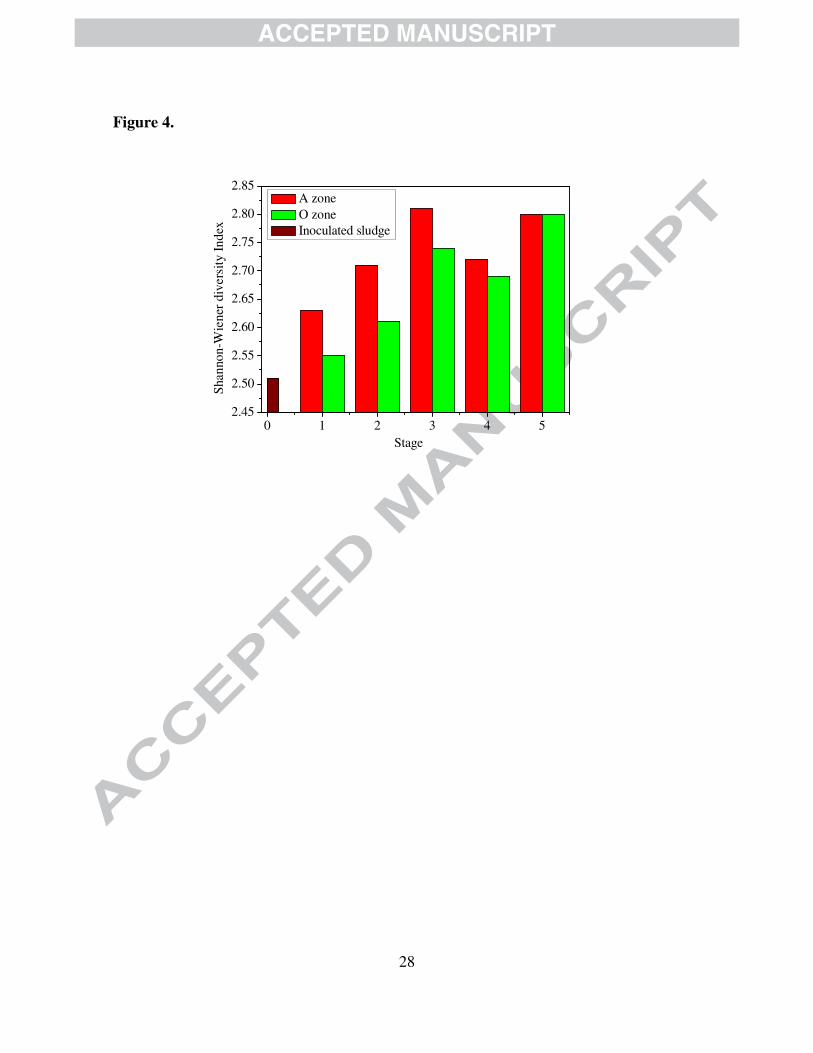
3.4 Diversity analysis
The difference in the microbial communities in the “A” and “O” zones at various
stages showed obvious variation. For quantitative evaluation of the biodiversity in different
zones and at various stages of the bioreactor, Shannon-Wiener diversity index (H´) was
used. All the indices (H´) were calculated using Eq. (2) based on the number and relative
intensity of the bands on the gel strip, and the results are shown in Fig. 4.
From the primary community (inoculated sludge) to the last stage (stage-5), the
microbial community diversity in different zones of the bioreactor generally presented an
increasing tendency. At the initial three stages, the values of H´ in the “A” zone increased
relatively faster than those in the “O” zone. At stage-4, H´ slightly decreased in both “A”
and “O” zones, when compared with stage-3, the values in “A” and “O” zones were
gradually closer to each other. At stage-5, the biodiversity in both “A” and “O” zones was
exactly the same and was higher than that observed at stage-4, which indicated that the
microorganisms got totally adapted to the alternate anaerobic–aerobic conditions and
formed a mature and diversified community.
16
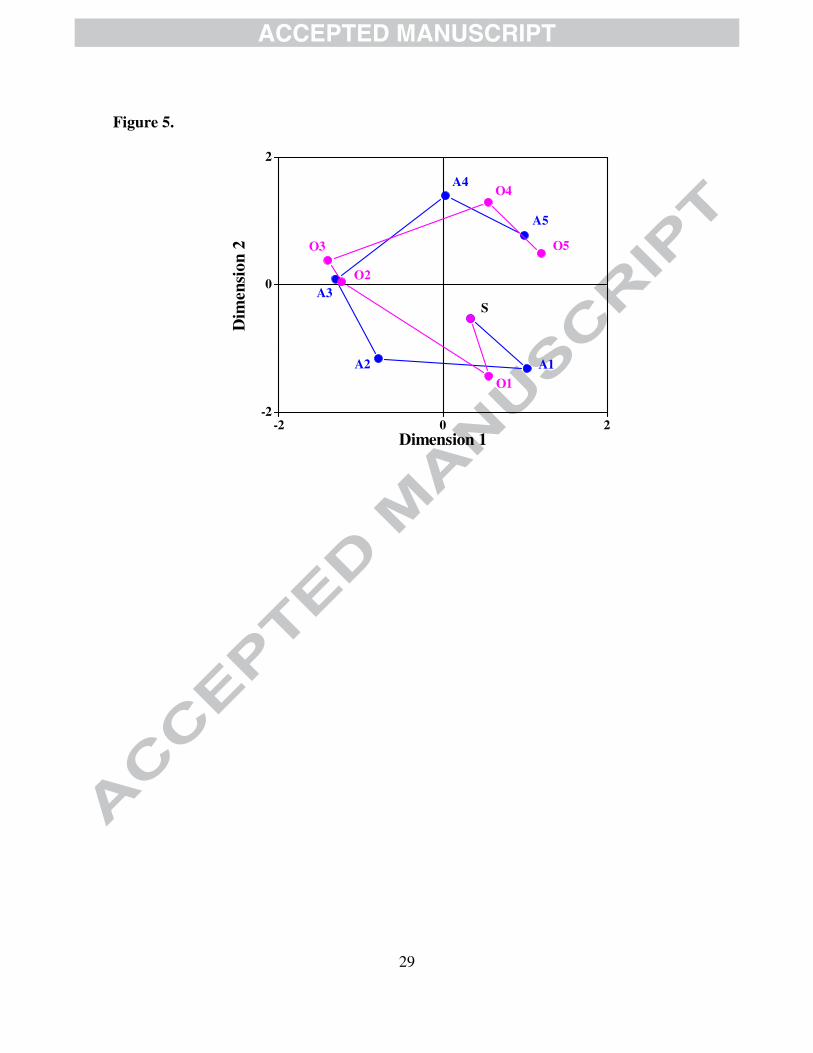
3.5 Succession of the microbial community
As the proliferation of biomass, the dominant species in both “A” and “O” zones were
gradually changed, which led to the succession of the corresponding microbial community.
For the purpose of visualizing the succession of the microbial communities in both “A” and
“O” zones, a NMDS analysis was used here with the results shown in Fig. 5.
In the experimental bioreactor, a continuous succession of the microbial community
occurred from the primary community to stage-5. The inoculated sludge (S) represented the
original community, and its structure was the same in both “A” and “O” zones. After
operating for 10 days (stage-1), the microbial communities in the “A” and “O” zones
presented an obvious variation, and were different from those of the inoculated sludge,
indicating that succession started with the growth of the biomass. At stage-2, the value of a
key limiting factor (DO) reached its turning point in the “A” zone, i.e., the DO value
declined to less than 1.0 mg/L. The large variation in the DO value in the “A” zone had a
great influence on the succession of the microbial community, leading to an obvious
difference in the structure between the “A” and “O” zones. From stage-3 to stage-5, the
biomass in the bioreactor continuously increased, resulting in a constant decrease in the DO
value to less than 0.1 mg/L in the “A” zone, which in turn, caused the microbial community
to reach a successional state in both “A” and “O” zones. Nevertheless, an interesting
phenomenon also occurred in these stages – the microbial communities in the “A” and “O”
zones gradually tended to exhibit a similar structure along with the successional process.
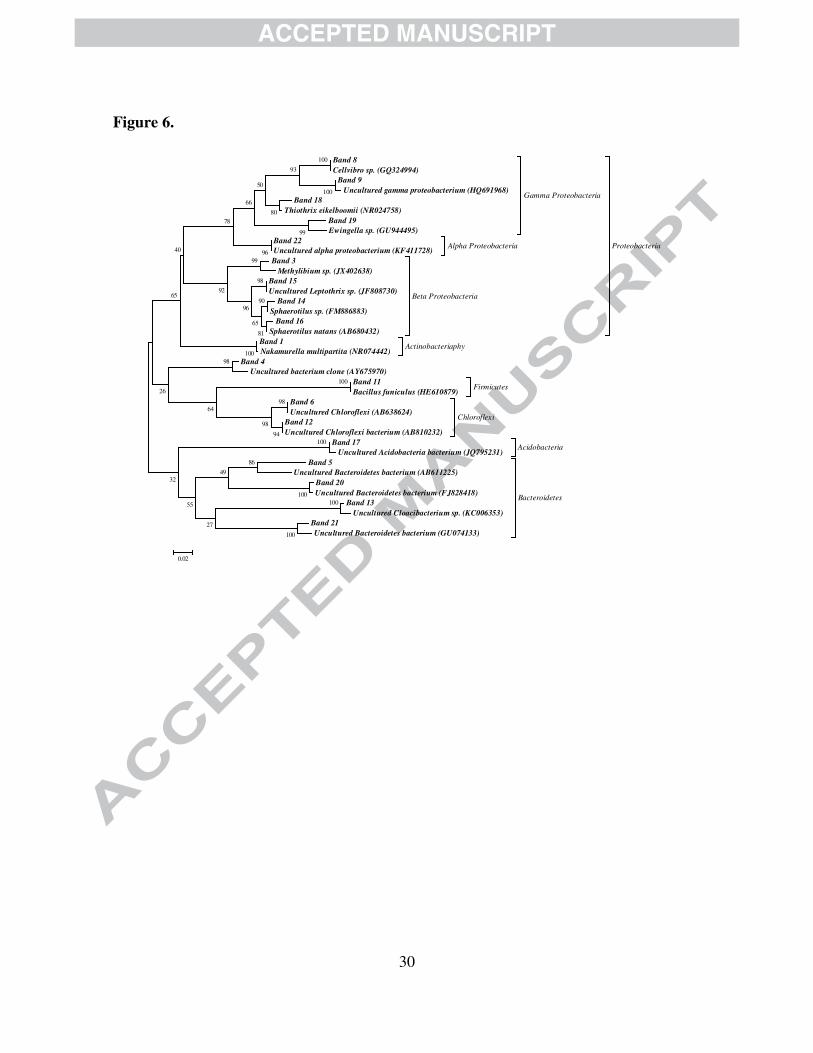
3.6 Cloning library
The established phylogenetic tree shown in Fig. 6 reveals the dominant species
observed in the MHMBR.

17
In this study, a total of 19 different bands of samples from different zones at different
stages were picked from the DGGE gels. The results showed that the dominant species
were distributed among 6 main phyla: Proteobacteria (nine species), Bacteroidetes (four
species), Chloroflexi (two species), Actinobacteria (one species), Firmicutes (one species),
and Acidobacteria (one species). In addition, an uncultured bacterial clone was also
detected among the 19 bands. Obviously, the predominant species was Proteobacteria,
which comprised Alpha-, Beta-, and Gammaproteobacteria, and a similar finding was also
reported by Wan et al. (2011).
The performance of a bioreactor is totally dependent on the dominant species and the
so-composed microbial community. As shown in Fig. 6, Proteobacteria was frequently
detected during the whole operational period. The sequence of band 22, which was detected
at all stages, was grouped into Alphaproteobacteria. Members of Alphaproteobacteria are
known for their ability to degrade chlorophenol and dichlorophenoxy acetic acid,
metabolize thiophene-2-carboxylate of phenanthrene- and S-containing substrates, and are
polycyclic aromatic and xenobiotic degraders (Rani et al., 2008). The sequences of bands 3,
14, 15, and 16 were grouped into Betaproteobacteria, and were related to Methylibium sp.,
Sphaerotilus sp., Leptothrix sp., and Sphaerotilus natans, respectively. Among them,
Methylibium sp. has been reported to play an important role in N compound removal (Iasur-
Kruh et al., 2010), this is also an important reason of achieving a high efficiency of
removing N compound in the presented bioreactor. Furthermore, Leptothrix sp. and
Sphaerotilus sp. are filamentous bacteria, whose appearance generally indicates the sludge
bulking phenomenon in a CAS system. However, in the present experiments, no obvious
sludge bulking phenomenon was observed, which demonstrated the capability of a
18
MHMBR to control sludge bulking. Wagner & Loy (2002), Xia et al. (2012) and Yan et al.
(2009) reported that Betaproteobacteria represented the most abundant group in activated
sludge, and Snaidr et al. (1997) found that Betaproteobacteria was the main group in the
aeration basin of a municipal sewage plant; thus, these findings suggest the importance of
this group in wastewater treatment. In the present study, the sequences of bands 8, 9, 18,
and 19 showed high similarity to Cellvibrio sp., uncultured Gammaproteobacterium,
Thiothrix eikelboomii, and Ewingella sp., respectively, all of which belong to
Gammaproteobacteria and are known for their degradation properties. Cellvibrio sp. is an
aerobic bacterium, and was only detected in the inoculated sludge and became weak or
invisible at other stages. T. eikelboomii has been reported to play a role in the
biodegradation of S-containing compounds. Nakamurella multipartite, corresponding to the
sequence of band 1, belongs to Actinobacteria, and was detected from stage-3 to stage-5.
Actinobacteria are well known for their secondary metabolite product – actinomycin. The
sequence of band 11 was grouped into Firmicutes and affiliated to Bacillus funiculus. B.
funiculus is a strict or facultative aerobic bacterium, and was only detected at stage-1,
which was consistent with the fact that during the start-up of the operation, the DO
concentration in both “A” and “O” zones still remained at a higher level. The sequences of
bands 6 and 12 belonged to Chloroflexi. Strains of Chloroflexi are obligate or facultative
photosynthetic filamentous bacteria, and most of them can not only survive under anaerobic
conditions, but also under aerobic conditions. The sequence of band 17 was affiliated to
uncultured Acidobacterium. Acidobacteria is generally considered to dominate the
phosphate-removing sludge population (Jeon et al., 2003), and its ability of phosphate
removal is also confirmed by the experimental results. In addition, the sequences of bands
19
5, 13, 20, and 21, which were detected in the late stage of operation, belonged to
Bacteroidetes. Among them, band 13 showed high similarity to uncultured Cloacibacterium
sp. Rani et al. (2008) reported that Bacteroidetes mainly degrades polycyclic aromatic
hydrocarbons and refractory biomacromolecules. Some strains of Bacteroidetes have also
been observed in other wastewater treatment bioreactors (Qiu et al., 2013; Wan et al.,
2011). These results and related analyses confirmed that the multi-habitat formed in the
bioreactor provided suitable conditions for the survival of many useful species, suggesting
its prospective application in purifying refractory organic pollutants.
4 Conclusions
This study presented a lab-scale investigation of a MHMBR, which was developed
with internal circulation and accumulated biomass. The formed multi-habitat provided
suitable conditions for various microorganisms. The proliferation of biomass in the
MHMBR directly led to continuous successions with similar tendency in different zones
and at various stages. The results of PCR-DGGE and 16 S rDNA clone library confirmed
that the bioreactor comprised diverse microbial species, and that the dominant species
included bacteria that are very useful in wastewater treatment. These results implied that
MHMBR could be a high-efficiency bioreactor to remove N-containing substances and
complex organic pollutants.
Acknowledgements
This research is funded by the National Natural Science Foundation of China (No.
51178120). The authors also want to thank Prof. Chaohai Wei and Prof. Yuan Ren from
South China University of Technology for their kind help in technical support.
20
References
APHA, AWWA, WPCF. 2005. Standard Methods for the Examination of Water and
Wastewater, 21st ed. American Public Health Association, Washington, DC.
Eichner, C.A., Erb, R.W., Timmis, K.N., Wagner-Dobler, I. 1999. Thermal gradient gel
electrophoresis analysis of bioprotection from pollutant shocks in the activated
sludge microbial community. Appl. Environ. Microbiol. 65(1), 102-109.
Enger, E.D., Smith, B.F. 2012. Environmental Science: A study of Interrelationships 13th
ed. The McGraw-Hill Companies, Inc. New York.
Fernandes, H., Jungles, M.K., Hoffmann, H., Antonio, R.V., Costa, R.H. 2013. Full-scale
sequencing batch reactor (SBR) for domestic wastewater: performance and diversity
of microbial communities. Bioresour. Technol. 132, 262-268.
Fu, Z., Yang, F., An, Y., Xue, Y. 2009. Simultaneous nitrification and denitrification
coupled with phosphorus removal in an modified anoxic/oxic-membrane bioreactor
(A/O-MBR). Biochem. Eng. J. 43(2), 191-196.
Fuhrman, J.A. 2009. Microbial community structure and its functional implications. Nature
459(7244), 193-199.
Han, Y., Liu, J., Guo, X., Li, L. 2012. Micro-environment characteristics and microbial
communities in activated sludge flocs of different particle size. Bioresour. Technol.
124, 252-258.
Iasur-Kruh, L., Hadar, Y., Milstein, D., Gasith, A., Minz, D. 2010. Microbial population
and activity in wetland microcosms constructed for improving treated municipal
wastewater. Microb. Ecol. 59(4), 700-709.
21
Jeon, C.O., Lee, D.S., Park, J.M. 2003. Microbial communities in activated sludge
performing enhanced biological phosphorus removal in a sequencing batch reactor.
Water Res. 37(9), 2195-2205.
Kraume, M., Drews, A. 2010. Membrane Bioreactors in Waste Water Treatment - Status
and Trends. Chem. Eng. Technol. 33(8), 1251-1259.
Kumar, S., Nei, M., Dudley, J., Tamura, K. 2008. MEGA: a biologist-centric software for
evolutionary analysis of DNA and protein sequences. Briefings Bioinf. 9(4), 299-
306.
LaPara, T.M., Nakatsu, C.H., Pantea, L.M., Alleman, J.E. 2002. Stability of the bacterial
communities supported by a seven-stage biological process treating pharmaceutical
wastewater as revealed by PCR-DGGE. Water Res. 36, 638-646.
Le-Clech, P. 2010. Membrane bioreactors and their uses in wastewater treatments. Appl.
Microbiol. Biotechnol. 88(6), 1253-1260.
Li, J.F., Yang, F.L., Ohandja, D.G., Wong, F.S. 2010. Integration of nitrification and
denitrification by combining anoxic and aerobic conditions in a membrane
bioreactor. Water Sci. Technol. 62(11), 2590-2598.
Liu, X.C., Zhang, Y., Yang, M., Wang, Z.Y., Lv, W.Z. 2007. Analysis of bacterial
community structures in two sewage treatment plants with different sludge
properties and treatment performance by nested PCR-DGGE method. J. Environ.
Sci. 19(1), 60-66.
Mcllroy, S.J., Speirs, L.B.M., Tucci, J., Seviour, R.J. 2011. In Situ Profiling of Microbial
Communities in Full-Scale Aerobic Sequencing Batch Reactors Treating Winery
Waste in Australia. Environ. Sci. Technol. 45(20), 8794-8803.
22
Miura, Y., Hiraiwa, M.N., Ito, T., Itonaga, T., Watanabe, Y., Okabe, S. 2007. Bacterial
community structures in MBRs treating municipal wastewater: relationship between
community stability and reactor performance. Water Res. 41(3), 627-637.
Mutamim, N.S.A., Noor, Z.Z., Hassan, M.A.A., Yuniarto, A., Olsson, G. 2013. Membrane
bioreactor: Applications and limitations in treating high strength industrial
wastewater. Chem. Eng. J. 225, 109-119.
Qiu, G., Song, Y., Zeng, P., Duan, L., Xiao, S. 2013. Combination of upflow anaerobic
sludge blanket (UASB) and membrane bioreactor (MBR) for berberine reduction
from wastewater and the effects of berberine on bacterial community dynamics. J.
Hazard. Mater. 246-247, 34-43.
Rani, A., Porwal, S., Sharma, R., Kapley, A., Purohit, H.J., Kalia, V.C. 2008. Assessment
of microbial diversity in effluent treatment plants by culture dependent and culture
independent approaches. Bioresour. Technol. 99(15), 7098-7107.
Snaidr, J., Amann, R., Huber, I., Ludwig, W., Schleifer, K.-H. 1997. Phylogenetic analysis
and in situ identification of bacteria in activated sludge. Appl. Environ. Microbiol.
63(7), 2884-2896.
Tan, T.W., Ng, H.Y. 2008. Influence of mixed liquor recycle ratio and dissolved oxygen on
performance of pre-denitrification submerged membrane bioreactors. Water Res.
42(4-5), 1122-1132.
Teksoy Başaran, S., Aysel, M., Kurt, H., Ergal, İ., Kumru, M., Akarsubaşı, A., Sözen, S.,
Orhon, D. 2012. Removal of readily biodegradable substrate in super fast membrane
bioreactor. J. Membr. Sci. 423-424, 477-486.

23
Wagner, M., Loy, A. 2002. Bacterial community composition and function in sewage
treatment systems. Curr. Opin. Biotechnol. 13(3), 218-227.
Wan, C.Y., De Wever, H., Diels, L., Thoeye, C., Liang, J.B., Huang, L.N. 2011.
Biodiversity and population dynamics of microorganisms in a full-scale membrane
bioreactor for municipal wastewater treatment. Water Res. 45(3), 1129-1138.
Xia, S.Q., Duan, L., Song, Y., Li, J., Piceno, Y.M., Andersen, G.L., Alvarez-Cohen, L.,
Moreno-Andrade, I., Huang, C.-L., Hermanowicz, S.W. 2010. Bacterial community
structure in geographically distributed biological wastewater treatment reactors.
Environ. Sci. Technol. 44(19), 7391-7396.
Xia, S.Q., Jia, R.Y., Feng, F., Xie, K., Li, H.X., Jing, D.F., Xu, X.T. 2012. Effect of solids
retention time on antibiotics removal performance and microbial communities in an
A/O-MBR process. Bioresour. Technol. 106, 36-43.
Yan, S.T., Zheng, H., Li, A., Zhang, X., Xing, X.H., Chu, L.B., Ding, G., Sun, X.L., Jurcik,
B. 2009. Systematic analysis of biochemical performance and the microbial
community of an activated sludge process using ozone-treated sludge for sludge
reduction. Bioresour. Technol. 100(21), 5002-5009.
Yang, F., Wang, Y., Bick, A., Gilron, J., Brenner, A., Gillerman, L., Herzberg, M., Oron, G.
2012. Performance of different configurations of hybrid growth membrane
bioreactor (HG-MBR) for treatment of mixed wastewater. Desalination 284, 261-
268.
Ye, L., Zhang, T., Wang, T., Fang, Z. 2012. Microbial Structures, Functions, and Metabolic
Pathways in Wastewater Treatment Bioreactors Revealed Using High-Throughput
Sequencing. Environ. Sci. Technol. 46(24), 13244-13252.
24
Figure Captions
Figure 1. Schematic diagram of the experimental configuration.
Figure 2. Biomass proliferation and variation of DO in the bioreactor. (“A”: anoxic-
anaerobic zone; “O”: oxic zone).
Figure 3. Comparison of bacterial 16S rDNA gene community fingerprints in “A” and “O”
zones of the MHMBR. (a: DGGE fingerprint patterns; b. the corresponding dendrogram,
the scale bar indicates the percentage similarity at the nodes).
Figure 4. Biodiversity in the bioreactor at different zones and stages.
Figure 5. NMDS map showing the succession in the community structures at different
zones and stages.
Figure 6. Phylogenetic distance tree representing the affiliation of the 16 S rDNA clone
sequences retrieved from the samples at different zones and stages.
25
Figure 1.
26
Figure 2.
0 10 20 30 40 50 60 70 80 90 1000.0
0.5
1.0
1.5
2.0
2.5
3.0
3.5
4.0
4.5Phase IIIPhase IIPhase I
DO
(m
g/L
)
Time (day)
DO value in "A" zone
DO value in "O" zone
The time points to increase
the influent concentration
4000
6000
8000
10000
12000
14000
ML
SS
(m
g/L
)
MLSS
27
Figure 3.
(a) (b)
28
Figure 4.
0 1 2 3 4 52.45
2.50
2.55
2.60
2.65
2.70
2.75
2.80
2.85
Shan
no
n-W
ien
er d
ivers
ity I
nd
ex
Stage
A zone
O zone
Inoculated sludge
29
Figure 5.
-2 0 2-2
0
2
Dim
en
sio
n 2
Dimension 1
S
A1
O1
A2
O2
A3
O3
A4O4
A5
O5
30
Figure 6.
Band 8
Cellvibro sp. (GQ324994)
Band 9
Uncultured gamma proteobacterium (HQ691968)
Band 18
Thiothrix eikelboomii (NR024758)
Band 19
Ewingella sp. (GU944495)
Gamma Proteobacteria
Band 22
Uncultured alpha proteobacterium (KF411728)Alpha Proteobacteria
Band 3
Methylibium sp. (JX402638)
Band 15
Uncultured Leptothrix sp. (JF808730)
Band 14
Sphaerotilus sp. (FM886883)
Band 16
Sphaerotilus natans (AB680432)
Beta Proteobacteria
Proteobacteria
Band 1
Nakamurella multipartita (NR074442)Actinobacteriaphy
Band 4
Uncultured bacterium clone (AY675970)
Band 11
Bacillus funiculus (HE610879)Firmicutes
Band 6
Uncultured Chloroflexi (AB638624)
Band 12
Uncultured Chloroflexi bacterium (AB810232)
Chloroflexi
Band 17
Uncultured Acidobacteria bacterium (JQ795231)Acidobacteria
Band 5
Uncultured Bacteroidetes bacterium (AB611225)
Band 20
Uncultured Bacteroidetes bacterium (FJ828418)
Band 13
Uncultured Cloacibacterium sp. (KC006353)
Band 21
Uncultured Bacteroidetes bacterium (GU074133)
Bacteroidetes
100
100
100
100
100
100
100
100
99
99
98
98
98
94
98
90
81
65
96
93
92
86
80
64
49
27
55
32
26
65
40
50
66
78
96
0.02
31
Table 1 Operating conditions
Parameter Value Parameter Value
Operating time (d) 100 HRT (h) 3.6
Temperature (0C) * 26.5 (23.1-32.0) SRT (d) 100
pH * 7.5 (7.1-8.0) Flux (LMH, L/m2 h) 21.7
Aeration rate (L/min) 1.0 Rotate speed (rmp) 65
*: Numbers are means (minimum and maximum values)
32
Table 2 Average removal efficiency of the MHMBR at different phases (%)
Quality index Phase I (1st - 20
th day) Phase II (21
st - 80
th day) Phase III (81
st - 100
th day)
CODCr 95.2 96.4 96.8
NH4+-N 80.3 84.8 89.8
TN 78.5 80.2 85.5
TP 67.1 63.3 56.9
33
Graphical Abstract
0 10 20 30 40 50 60 70 80 90 1000.0
0.5
1.0
1.5
2.0
2.5
3.0
3.5
4.0
4.5Phase IIIPhase IIPhase I
D
O (
mg/L
)
Time (day)
DO value in "A" zone
DO value in "O" zone
4000
6000
8000
10000
12000
14000
ML
SS
(m
g/L
)
MLSS
Proliferation of biomass → Viration of DO values → Succession of microbial communities
34
� A combined membrane bioreactor without an external recycling pump was presented.
� A multi-habitat was successfully established in a single membrane bioreactor.
� The microbial community and its succession in the bioreactor were revealed.
� The biodiversity increased along with the succession of the microbial community.
� Dominant species during the operation were mainly distributed among 6 major phyla.