bilfinger se company presentation · 2017-11-23 · bilfinger at a glance bilfinger se | company...
TRANSCRIPT

December 2017
Bilfinger SE Company Presentation
Bilfinger SE

Overview
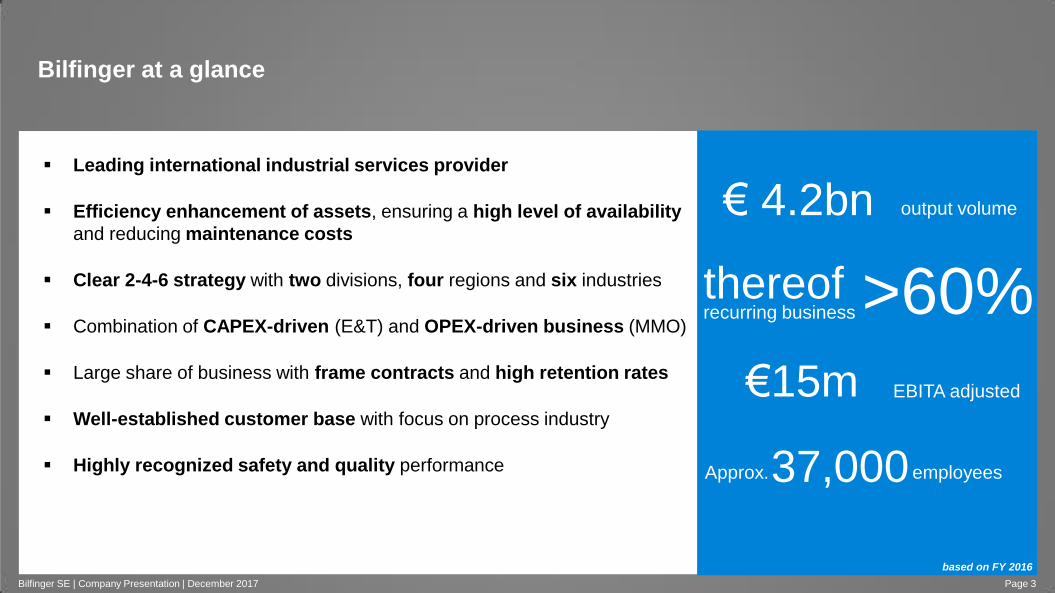
Bilfinger at a glance
Bilfinger SE | Company Presentation | December 2017 Page 3
€ 4.2bn output volume
EBITA adjusted
employees
recurring business thereof >60%
€15m
37,000 Approx.
Leading international industrial services provider
Efficiency enhancement of assets, ensuring a high level of availability
and reducing maintenance costs
Clear 2-4-6 strategy with two divisions, four regions and six industries
Combination of CAPEX-driven (E&T) and OPEX-driven business (MMO)
Large share of business with frame contracts and high retention rates
Well-established customer base with focus on process industry
Highly recognized safety and quality performance
based on FY 2016
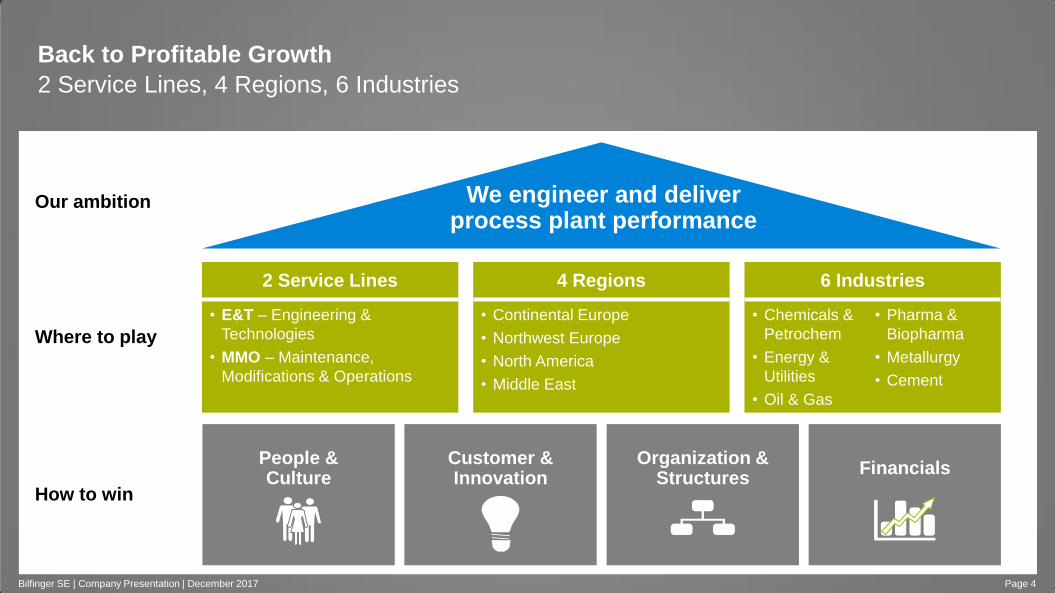
Back to Profitable Growth
2 Service Lines, 4 Regions, 6 Industries
Our ambition
• E&T – Engineering &
Technologies
• MMO – Maintenance,
Modifications & Operations
• Continental Europe
• Northwest Europe
• North America
• Middle East
• Chemicals &
Petrochem
• Energy &
Utilities
• Oil & Gas
• Pharma &
Biopharma
• Metallurgy
• Cement
2 Service Lines 4 Regions 6 Industries
People & Culture
Organization & Structures
Financials Customer & Innovation
Where to play
How to win
We engineer and deliver process plant performance
Page 4 Bilfinger SE | Company Presentation | December 2017
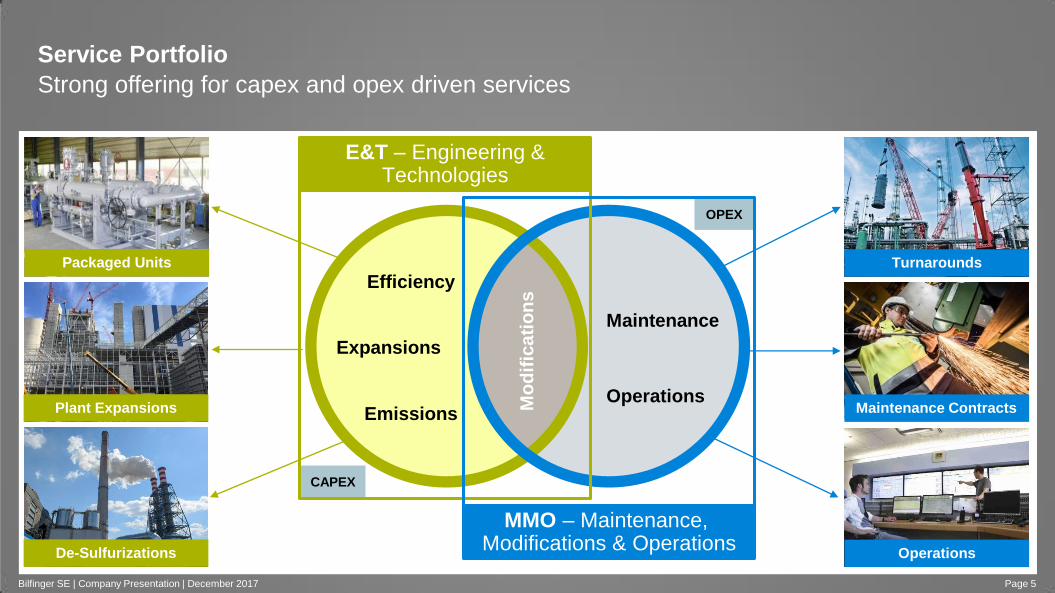
Service Portfolio
Strong offering for capex and opex driven services
Page 5
Operations
E&T – Engineering & Technologies
Maintenance
MMO – Maintenance, Modifications & Operations
Expansions
Efficiency
Emissions
Turnarounds
Maintenance Contracts
Operations
Packaged Units
Plant Expansions
De-Sulfurizations
Mo
dif
ica
tio
ns
Bilfinger SE | Company Presentation | December 2017
OPEX
CAPEX
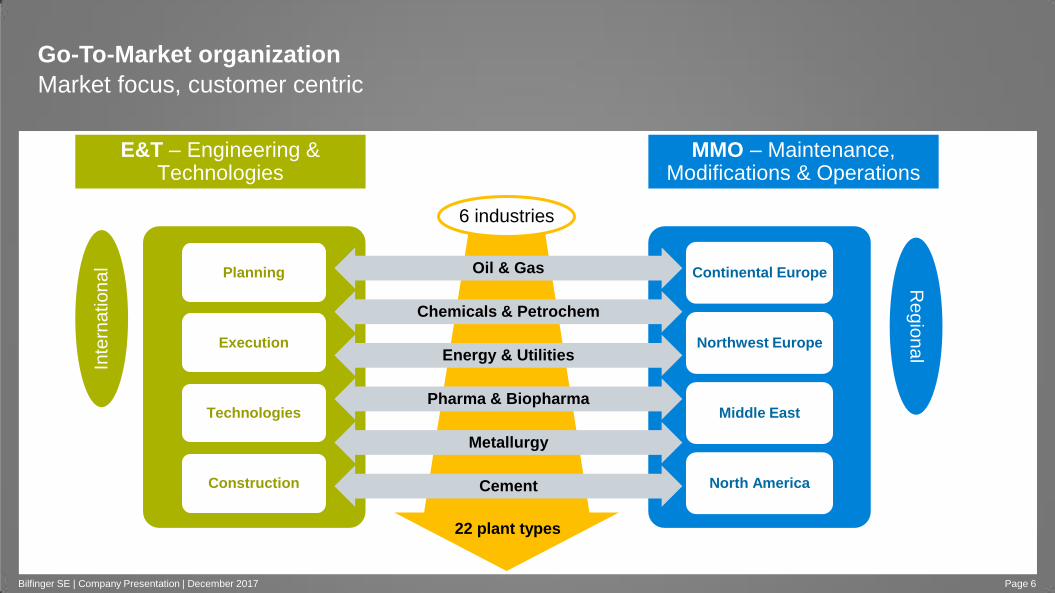
Go-To-Market organization
Market focus, customer centric
Page 6
MMO – Maintenance, Modifications & Operations
Re
gio
na
l E&T – Engineering &
Technologies
Inte
rnation
al
North America
Middle East
Northwest Europe
Continental Europe
Construction
Technologies
Execution
Planning Oil & Gas
Chemicals & Petrochem
Energy & Utilities
Pharma & Biopharma
Metallurgy
Cement
22 plant types
6 industries
Bilfinger SE | Company Presentation | December 2017
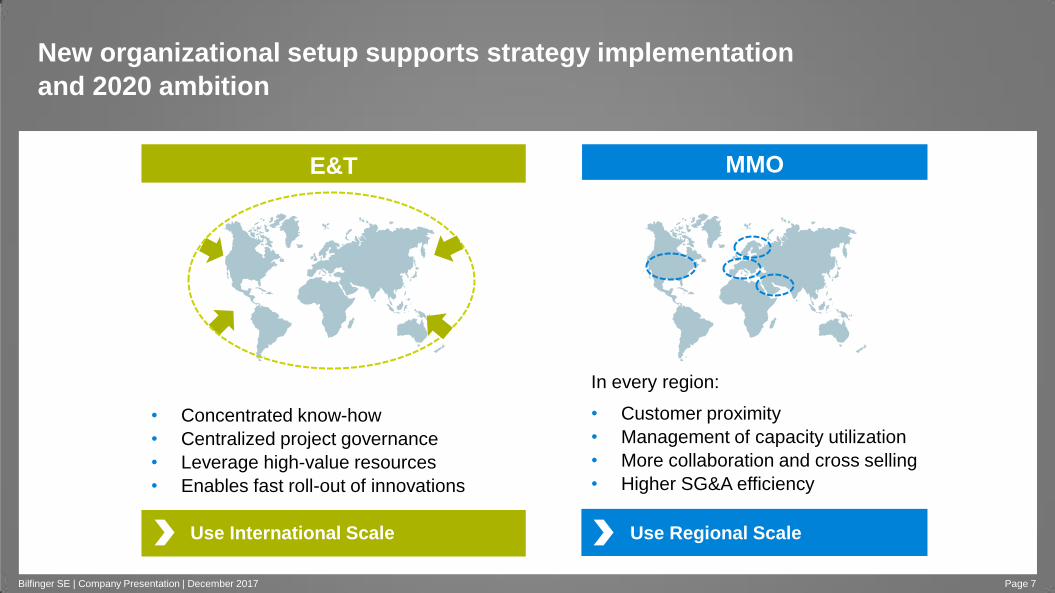
New organizational setup supports strategy implementation
and 2020 ambition
• Concentrated know-how
• Centralized project governance
• Leverage high-value resources
• Enables fast roll-out of innovations
In every region:
• Customer proximity
• Management of capacity utilization
• More collaboration and cross selling
• Higher SG&A efficiency
E&T MMO
Use International Scale Use Regional Scale
Bilfinger SE | Company Presentation | December 2017 Page 7

Raising the growth potential
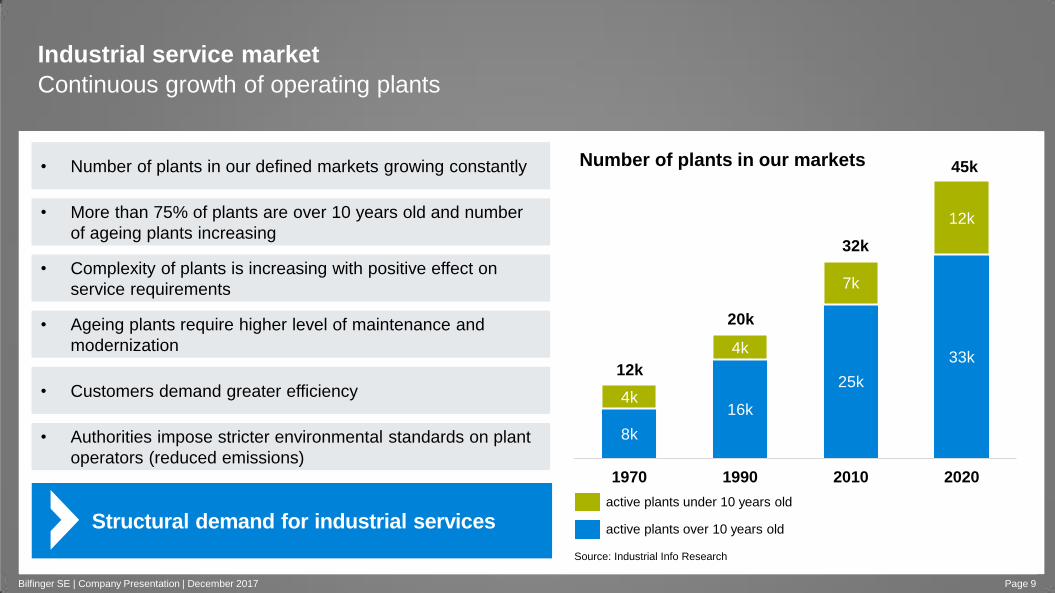
• Number of plants in our defined markets growing constantly
8k
16k
25k
33k
4k
4k
7k
12k
1970 1990 2010 2020
12k
20k
32k
45k
Industrial service market
Continuous growth of operating plants
Page 9
active plants under 10 years old
Source: Industrial Info Research
active plants over 10 years old
• More than 75% of plants are over 10 years old and number
of ageing plants increasing
• Complexity of plants is increasing with positive effect on
service requirements
• Ageing plants require higher level of maintenance and
modernization
• Authorities impose stricter environmental standards on plant
operators (reduced emissions)
• Customers demand greater efficiency
Structural demand for industrial services
Number of plants in our markets
Bilfinger SE | Company Presentation | December 2017
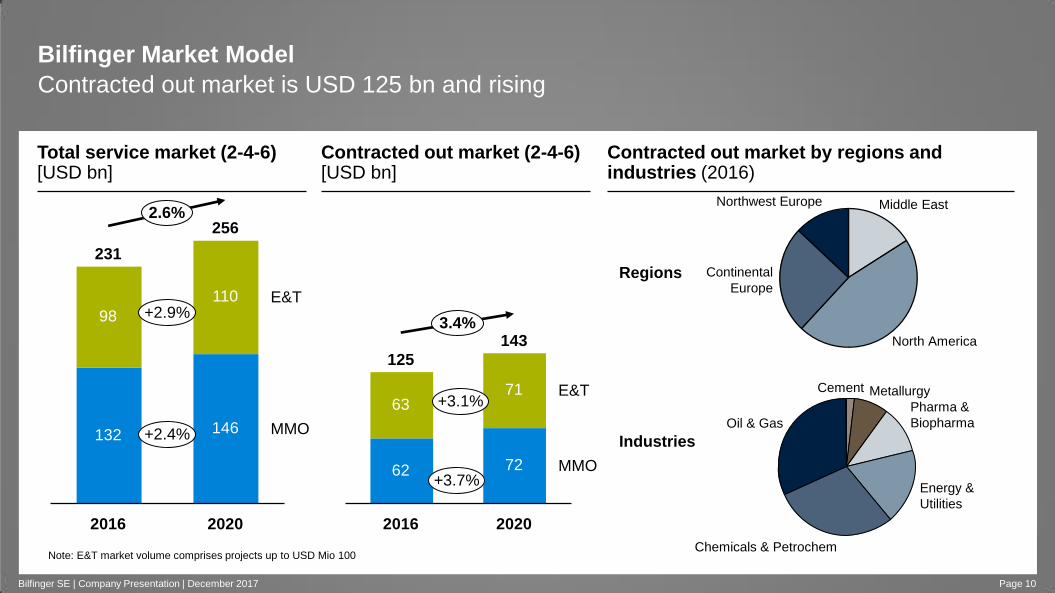
Bilfinger Market Model
Contracted out market is USD 125 bn and rising
Page 10
MMO
E&T
2020
256
146
110
2016
231
132
98
2.6%
MMO
E&T
2020
143
72
71
2016
125
62
63
3.4%
Note: E&T market volume comprises projects up to USD Mio 100
Regions
Industries
Northwest Europe
Continental
Europe
North America
Middle East
Chemicals & Petrochem
Oil & Gas
Cement Metallurgy
Energy &
Utilities
Pharma &
Biopharma
+3.1%
+3.7%
+2.9%
+2.4%
Total service market (2-4-6) [USD bn]
Contracted out market (2-4-6) [USD bn]
Contracted out market by regions and industries (2016)
Bilfinger SE | Company Presentation | December 2017
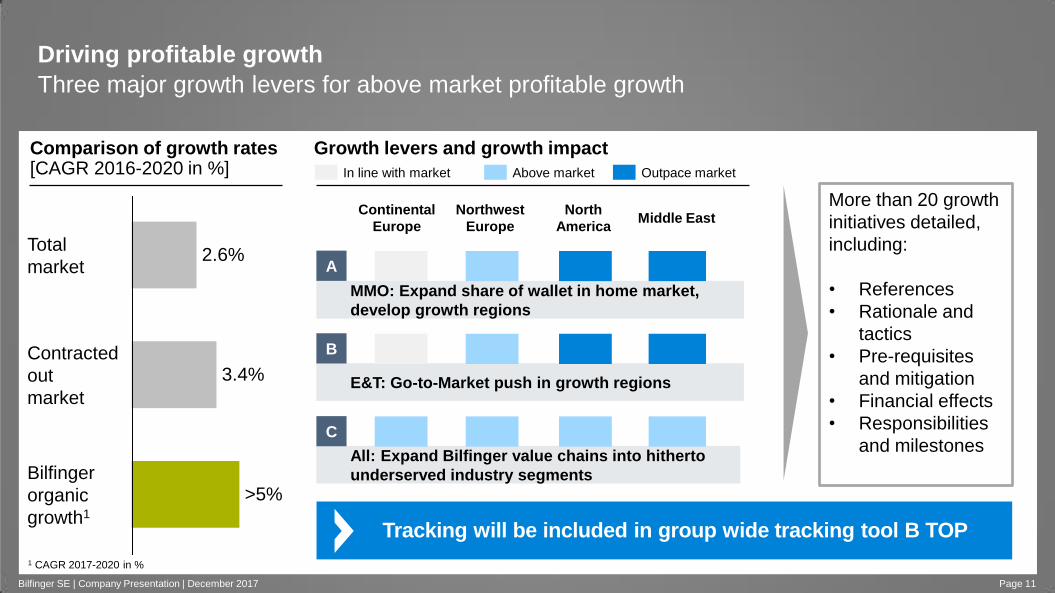
Driving profitable growth
Three major growth levers for above market profitable growth
Page 11 Bilfinger SE | Company Presentation | December 2017
Comparison of growth rates [CAGR 2016-2020 in %]
Bilfinger
organic
growth1
>5%
Contracted
out
market
3.4%
Total
market 2.6%
More than 20 growth
initiatives detailed,
including:
• References
• Rationale and
tactics
• Pre-requisites
and mitigation
• Financial effects
• Responsibilities
and milestones
Tracking will be included in group wide tracking tool B TOP
Growth levers and growth impact
MMO: Expand share of wallet in home market,
develop growth regions
E&T: Go-to-Market push in growth regions
All: Expand Bilfinger value chains into hitherto
underserved industry segments
A
B
C
Continental
Europe
Northwest
Europe
North
America Middle East
In line with market Above market Outpace market
1 CAGR 2017-2020 in %
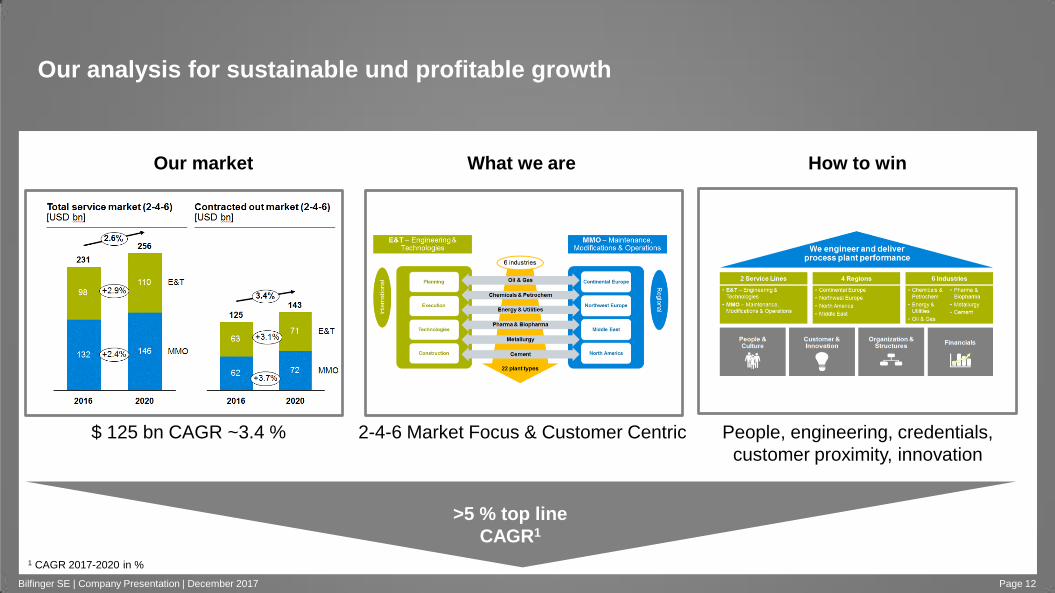
Our analysis for sustainable und profitable growth
Page 12 Bilfinger SE | Company Presentation | December 2017
Our market What we are How to win
>5 % top line
CAGR1
$ 125 bn CAGR ~3.4 % 2-4-6 Market Focus & Customer Centric People, engineering, credentials,
customer proximity, innovation
1 CAGR 2017-2020 in %

Improving our financial performance
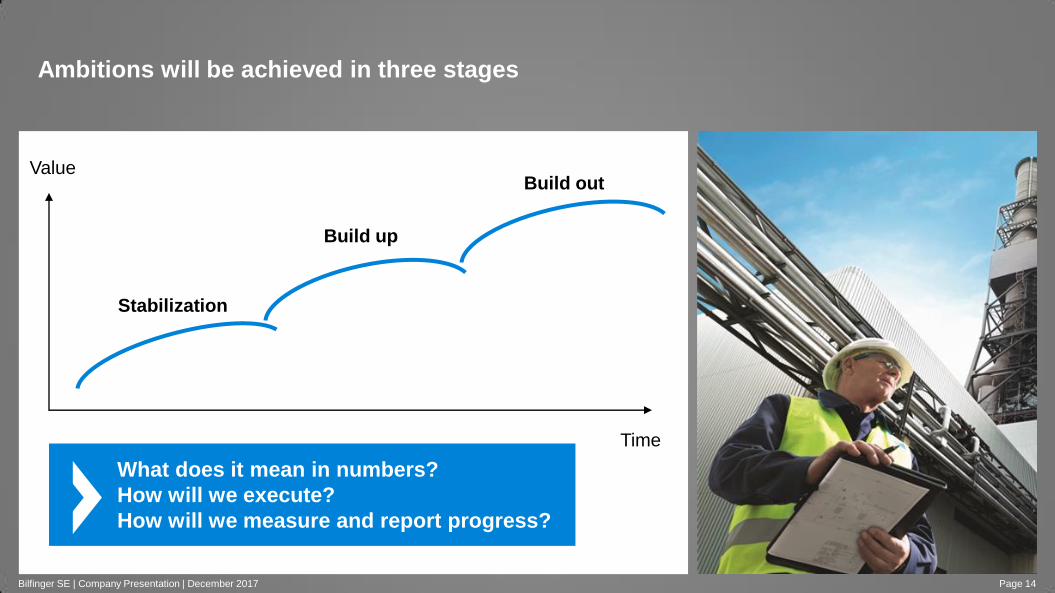
Ambitions will be achieved in three stages
Stabilization
Build up
Build out
What does it mean in numbers?
How will we execute?
How will we measure and report progress?
Time
Value
Bilfinger SE | Company Presentation | December 2017 Page 14
MMO EBITA
E&T
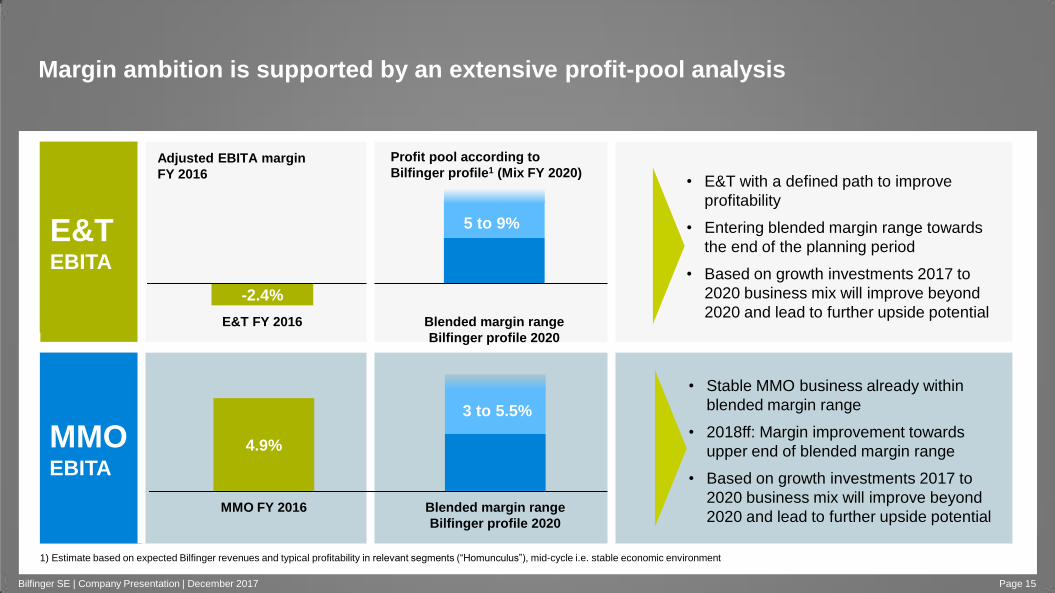
-2.4%
E&T FY 2016 Blended margin range
Bilfinger profile 2020
Profit pool according to
Bilfinger profile1 (Mix FY 2020)
1) Estimate based on expected Bilfinger revenues and typical profitability in relevant segments (“Homunculus”), mid-cycle i.e. stable economic environment
5 to 9%
Adjusted EBITA margin
FY 2016
Margin ambition is supported by an extensive profit-pool analysis
E&T EBITA
Bilfinger SE | Company Presentation | December 2017 Page 15
• E&T with a defined path to improve
profitability
• Entering blended margin range towards
the end of the planning period
• Based on growth investments 2017 to
2020 business mix will improve beyond
2020 and lead to further upside potential
• Stable MMO business already within
blended margin range
• 2018ff: Margin improvement towards
upper end of blended margin range
• Based on growth investments 2017 to
2020 business mix will improve beyond
2020 and lead to further upside potential MMO FY 2016 Blended margin range
Bilfinger profile 2020
4.9%
3 to 5.5%
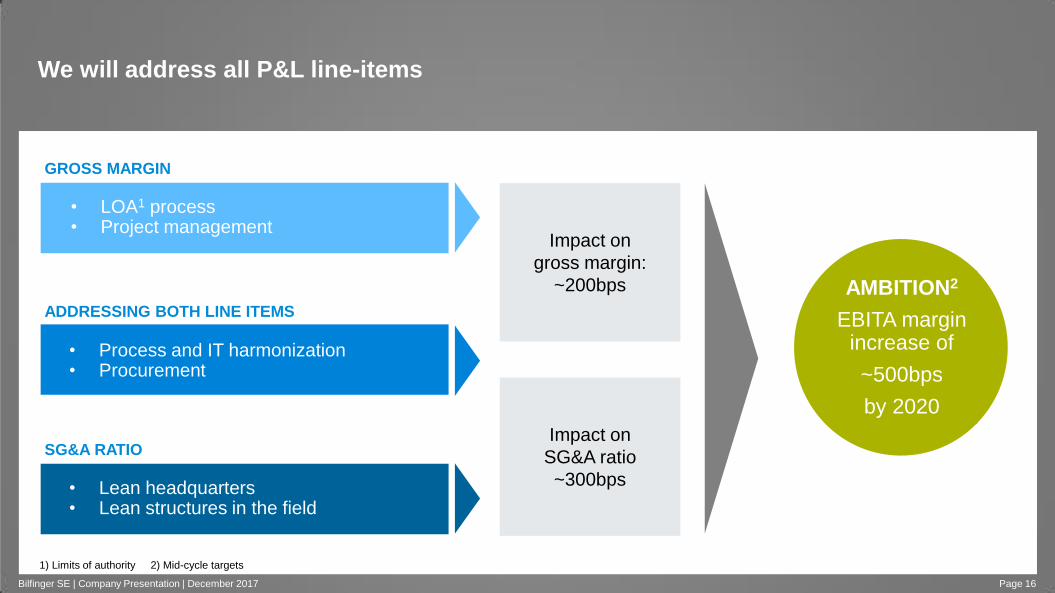
We will address all P&L line-items
Impact on
gross margin:
~200bps
Impact on
SG&A ratio
~300bps
AMBITION2
EBITA margin increase of
~500bps
by 2020
• LOA1 process • Project management
• Process and IT harmonization • Procurement
GROSS MARGIN
ADDRESSING BOTH LINE ITEMS
SG&A RATIO
• Lean headquarters • Lean structures in the field
1) Limits of authority 2) Mid-cycle targets
Bilfinger SE | Company Presentation | December 2017 Page 16

Current Trading and Guidance 2017
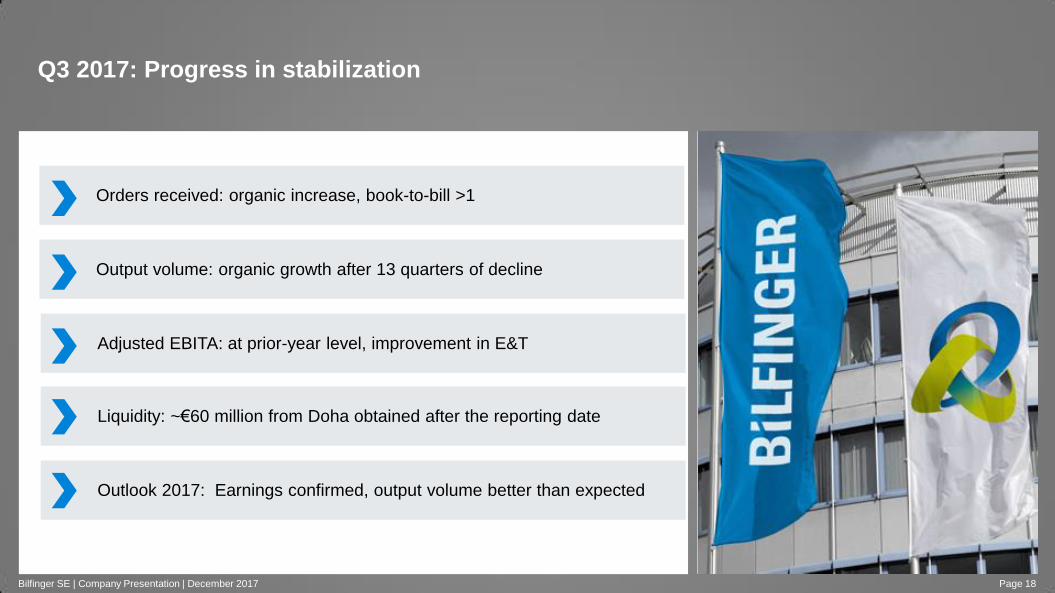
Q3 2017: Progress in stabilization
Bilfinger SE | Company Presentation | December 2017
Orders received: organic increase, book-to-bill >1
Adjusted EBITA: at prior-year level, improvement in E&T
Liquidity: ~€60 million from Doha obtained after the reporting date
Outlook 2017: Earnings confirmed, output volume better than expected
Output volume: organic growth after 13 quarters of decline
Page 18
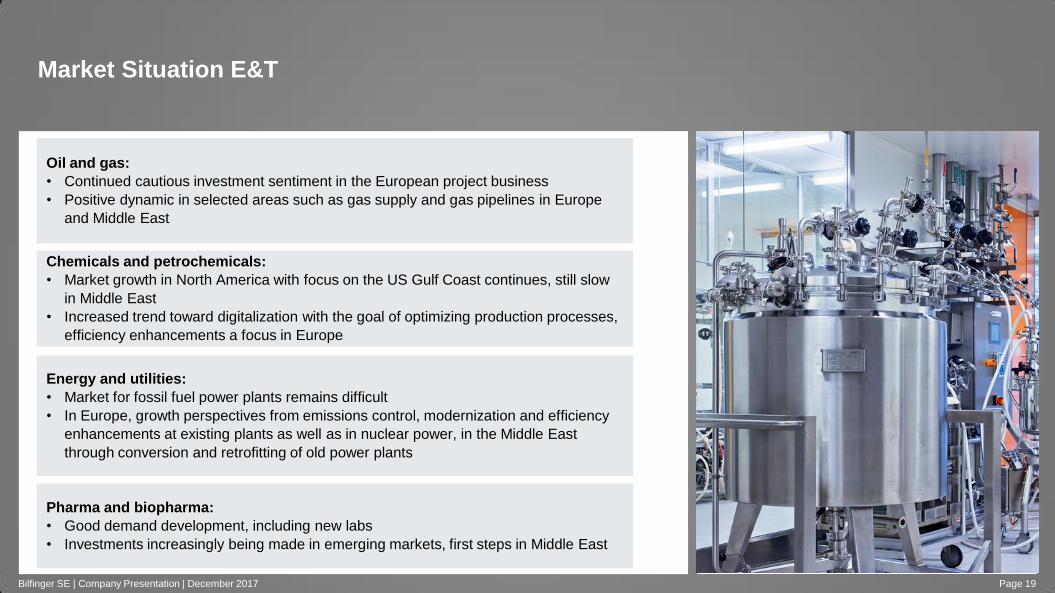
Market Situation E&T
Bilfinger SE | Company Presentation | December 2017 Page 19
Oil and gas:
• Continued cautious investment sentiment in the European project business
• Positive dynamic in selected areas such as gas supply and gas pipelines in Europe
and Middle East
Chemicals and petrochemicals:
• Market growth in North America with focus on the US Gulf Coast continues, still slow
in Middle East
• Increased trend toward digitalization with the goal of optimizing production processes,
efficiency enhancements a focus in Europe
Energy and utilities:
• Market for fossil fuel power plants remains difficult
• In Europe, growth perspectives from emissions control, modernization and efficiency
enhancements at existing plants as well as in nuclear power, in the Middle East
through conversion and retrofitting of old power plants
Pharma and biopharma:
• Good demand development, including new labs
• Investments increasingly being made in emerging markets, first steps in Middle East
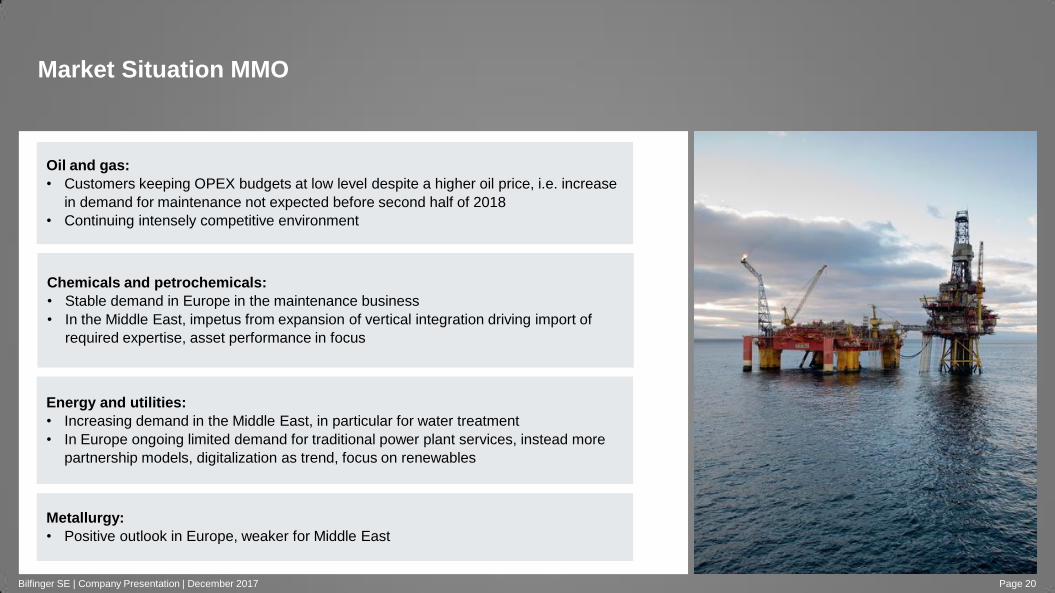
Market Situation MMO
Bilfinger SE | Company Presentation | December 2017 Page 20
Oil and gas:
• Customers keeping OPEX budgets at low level despite a higher oil price, i.e. increase
in demand for maintenance not expected before second half of 2018
• Continuing intensely competitive environment
Chemicals and petrochemicals:
• Stable demand in Europe in the maintenance business
• In the Middle East, impetus from expansion of vertical integration driving import of
required expertise, asset performance in focus
Energy and utilities:
• Increasing demand in the Middle East, in particular for water treatment
• In Europe ongoing limited demand for traditional power plant services, instead more
partnership models, digitalization as trend, focus on renewables
Metallurgy:
• Positive outlook in Europe, weaker for Middle East
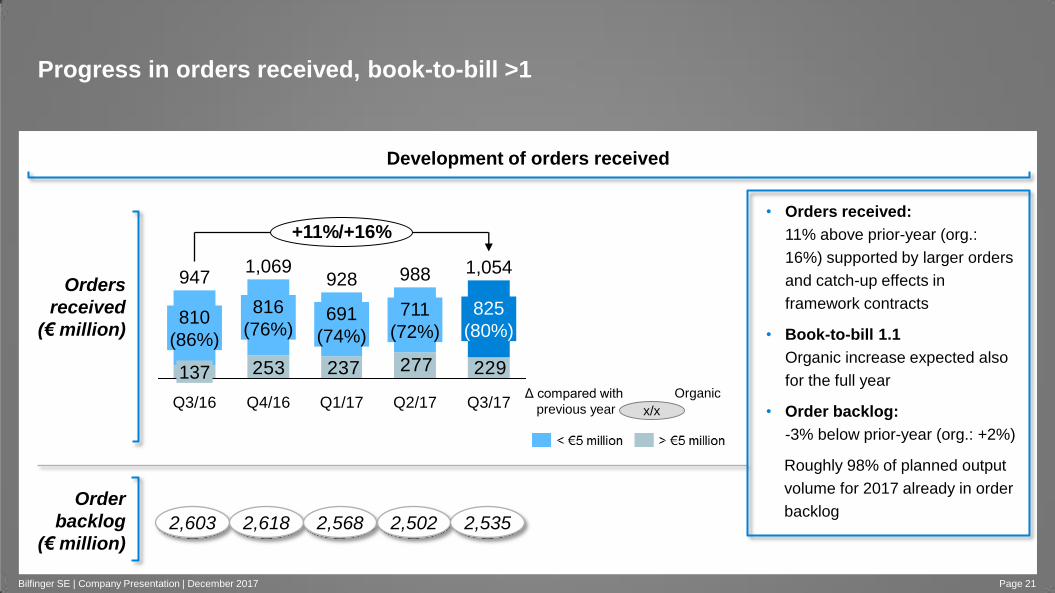
• Orders received:
11% above prior-year (org.:
16%) supported by larger orders
and catch-up effects in
framework contracts
• Book-to-bill 1.1
Organic increase expected also
for the full year
• Order backlog:
-3% below prior-year (org.: +2%)
Roughly 98% of planned output
volume for 2017 already in order
backlog
Progress in orders received, book-to-bill >1
Bilfinger SE | Company Presentation | December 2017
Orders
received
(€ million)
Order
backlog
(€ million)
Development of orders received
229277237253
+11%/+16%
Q3/17
988 928
691
(74%)
Q4/16
1,069
816
(76%)
Q3/16
947
137
810
(86%)
825
(80%)
Q2/17
711
(72%)
Q1/17
1,054
2,603 2,618 2,568 2,502 2,535
Page 21
x/x
Δ compared with
previous year
Organic
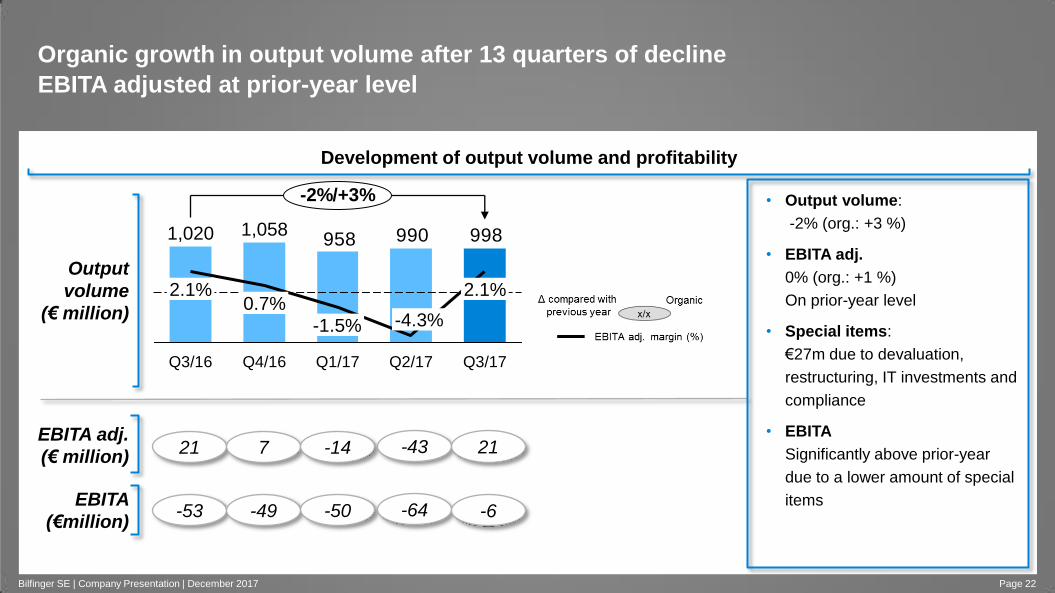
Organic growth in output volume after 13 quarters of decline
EBITA adjusted at prior-year level
Bilfinger SE | Company Presentation | December 2017 Page 22
EBITA adj.
(€ million)
Development of output volume and profitability
EBITA
(€million)
Output
volume
(€ million)
21
-53
7
-49
-14
-50
• Output volume:
-2% (org.: +3 %)
• EBITA adj.
0% (org.: +1 %)
On prior-year level
• Special items:
€27m due to devaluation,
restructuring, IT investments and
compliance
• EBITA
Significantly above prior-year
due to a lower amount of special
items
-43
-64
21
-6
998990958
-2%/+3%
Q3/17
2.1%
Q2/17
-4.3%
Q1/17
-1.5%
Q4/16
1,058
0.7%
Q3/16
1,020
2.1%
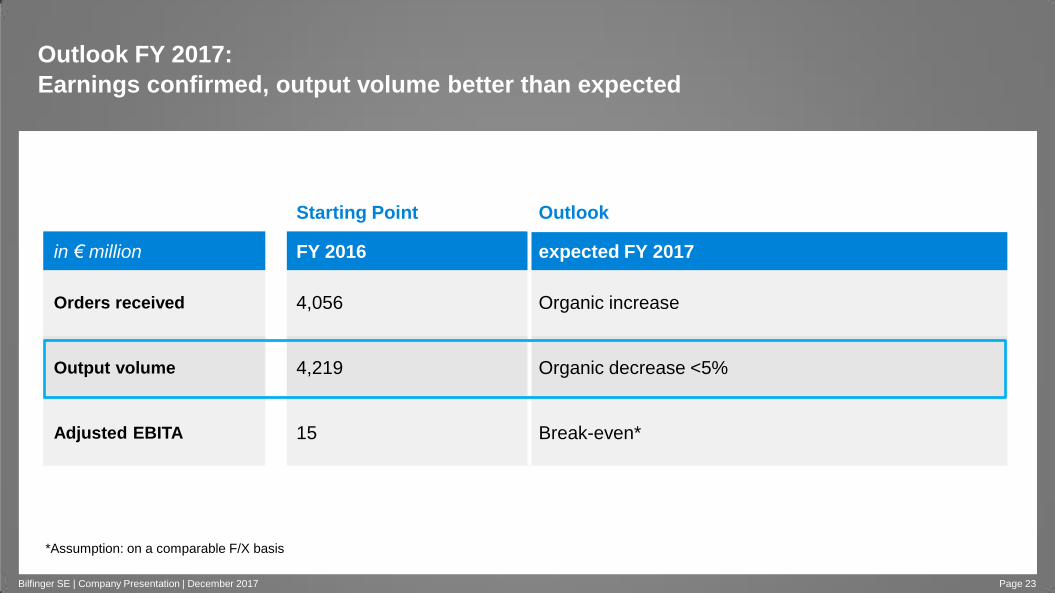
Outlook FY 2017:
Earnings confirmed, output volume better than expected
Bilfinger SE | Company Presentation | December 2017
Starting Point Outlook
in € million FY 2016 expected FY 2017
Orders received 4,056 Organic increase
Output volume 4,219 Organic decrease <5%
Adjusted EBITA 15 Break-even*
*Assumption: on a comparable F/X basis
Page 23

Targets 2020 and Wrap-up
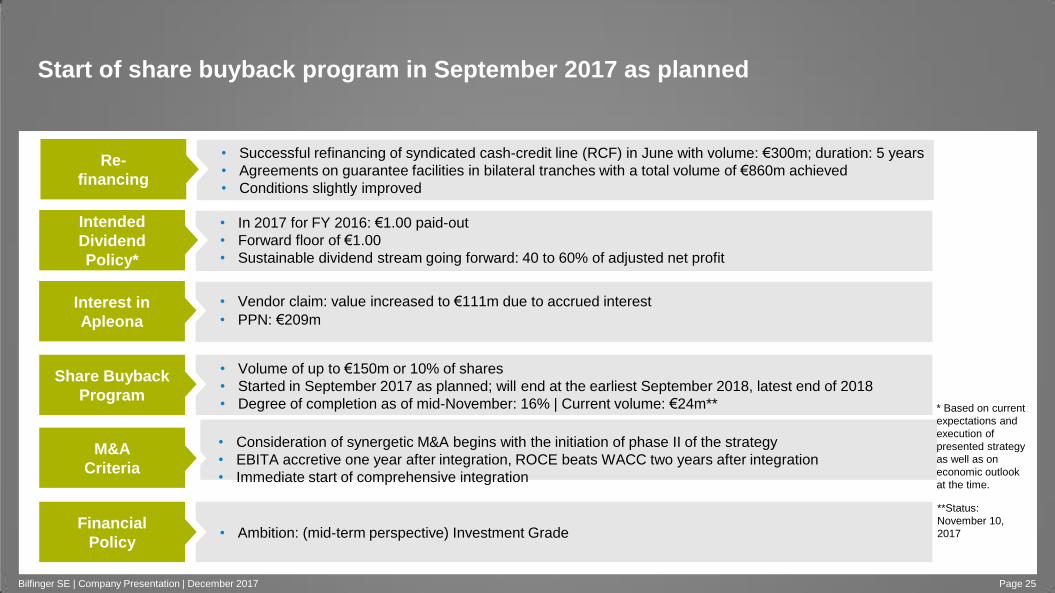
Start of share buyback program in September 2017 as planned
• Consideration of synergetic M&A begins with the initiation of phase II of the strategy
• EBITA accretive one year after integration, ROCE beats WACC two years after integration
• Immediate start of comprehensive integration
M&A
Criteria
• Volume of up to €150m or 10% of shares
• Started in September 2017 as planned; will end at the earliest September 2018, latest end of 2018
• Degree of completion as of mid-November: 16% | Current volume: €24m**
Share Buyback
Program
• In 2017 for FY 2016: €1.00 paid-out
• Forward floor of €1.00
• Sustainable dividend stream going forward: 40 to 60% of adjusted net profit
Intended
Dividend
Policy*
• Ambition: (mid-term perspective) Investment Grade Financial
Policy
* Based on current
expectations and
execution of
presented strategy
as well as on
economic outlook
at the time.
Bilfinger SE | Company Presentation | December 2017 Page 25
• Successful refinancing of syndicated cash-credit line (RCF) in June with volume: €300m; duration: 5 years
• Agreements on guarantee facilities in bilateral tranches with a total volume of €860m achieved
• Conditions slightly improved
Re-
financing
• Vendor claim: value increased to €111m due to accrued interest
• PPN: €209m Interest in
Apleona
**Status:
November 10,
2017
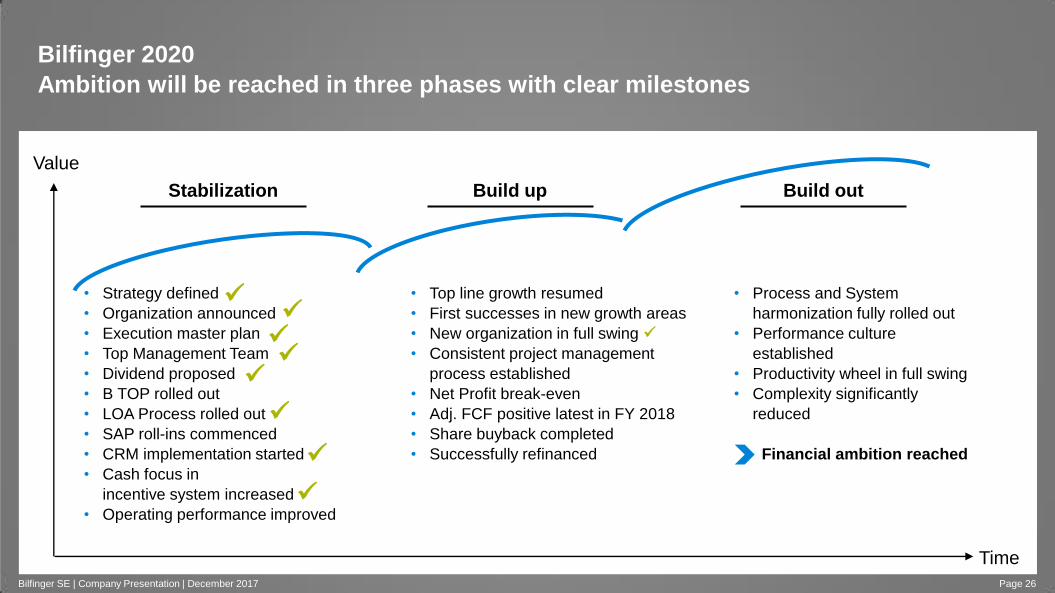
• Top line growth resumed
• First successes in new growth areas
• New organization in full swing
• Consistent project management
process established
• Net Profit break-even
• Adj. FCF positive latest in FY 2018
• Share buyback completed
• Successfully refinanced
• Process and System
harmonization fully rolled out
• Performance culture
established
• Productivity wheel in full swing
• Complexity significantly
reduced
Financial ambition reached
• Strategy defined
• Organization announced
• Execution master plan
• Top Management Team
• Dividend proposed
• B TOP rolled out
• LOA Process rolled out
• SAP roll-ins commenced
• CRM implementation started
• Cash focus in
incentive system increased
• Operating performance improved
Bilfinger 2020
Ambition will be reached in three phases with clear milestones
Time
Value
Stabilization Build up Build out
Bilfinger SE | Company Presentation | December 2017 Page 26
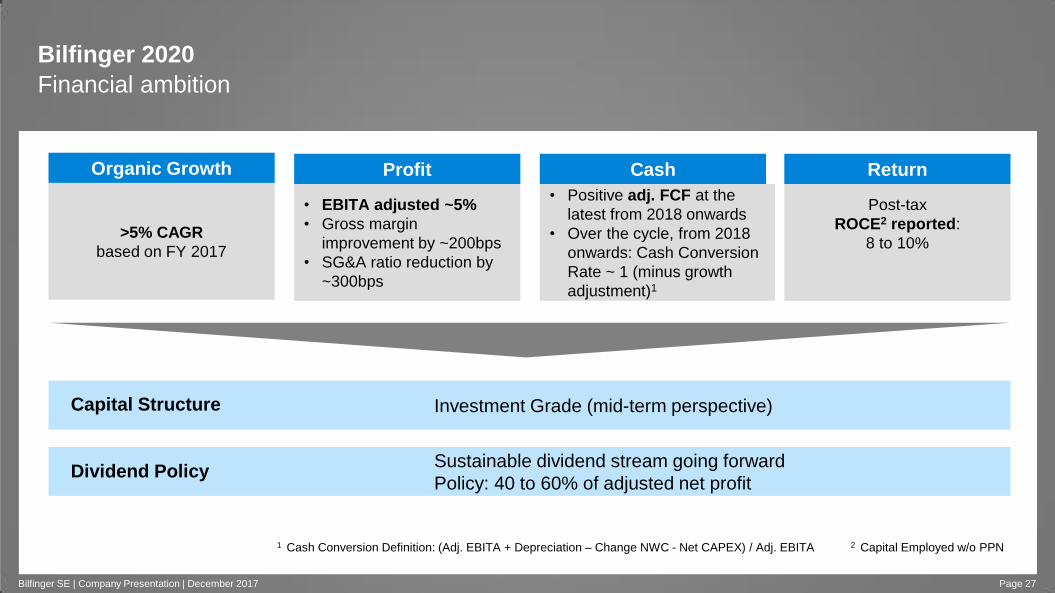
Bilfinger 2020
Financial ambition
Page 27
• Positive adj. FCF at the
latest from 2018 onwards
• Over the cycle, from 2018
onwards: Cash Conversion
Rate ~ 1 (minus growth
adjustment)1
>5% CAGR
based on FY 2017
Post-tax
ROCE2 reported:
8 to 10%
Investment Grade (mid-term perspective)
Sustainable dividend stream going forward
Policy: 40 to 60% of adjusted net profit
• EBITA adjusted ~5%
• Gross margin
improvement by ~200bps
• SG&A ratio reduction by
~300bps
2 Capital Employed w/o PPN
Organic Growth Profit Cash Return
Capital Structure
Dividend Policy
Bilfinger SE | Company Presentation | December 2017
1 Cash Conversion Definition: (Adj. EBITA + Depreciation – Change NWC - Net CAPEX) / Adj. EBITA
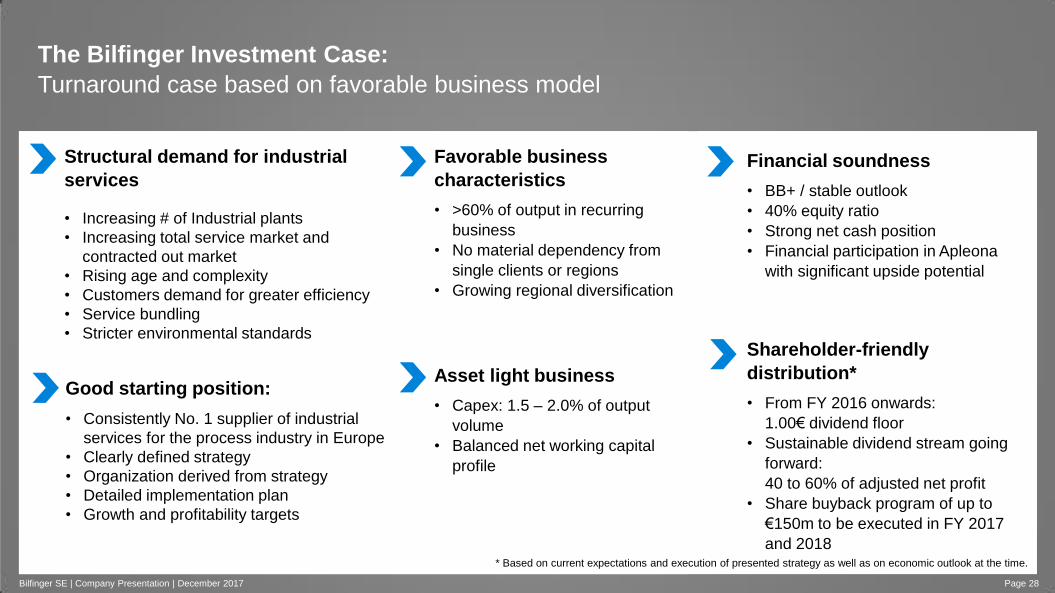
The Bilfinger Investment Case:
Turnaround case based on favorable business model
Bilfinger SE | Company Presentation | December 2017 Page 28
Structural demand for industrial
services
• Increasing # of Industrial plants
• Increasing total service market and
contracted out market
• Rising age and complexity
• Customers demand for greater efficiency
• Service bundling
• Stricter environmental standards
Financial soundness
• BB+ / stable outlook
• 40% equity ratio
• Strong net cash position
• Financial participation in Apleona
with significant upside potential
Favorable business
characteristics
• >60% of output in recurring
business
• No material dependency from
single clients or regions
• Growing regional diversification
Good starting position:
• Consistently No. 1 supplier of industrial
services for the process industry in Europe
• Clearly defined strategy
• Organization derived from strategy
• Detailed implementation plan
• Growth and profitability targets
Asset light business
• Capex: 1.5 – 2.0% of output
volume
• Balanced net working capital
profile
Shareholder-friendly
distribution*
• From FY 2016 onwards:
1.00€ dividend floor
• Sustainable dividend stream going
forward:
40 to 60% of adjusted net profit
• Share buyback program of up to
€150m to be executed in FY 2017
and 2018
* Based on current expectations and execution of presented strategy as well as on economic outlook at the time.

Appendix
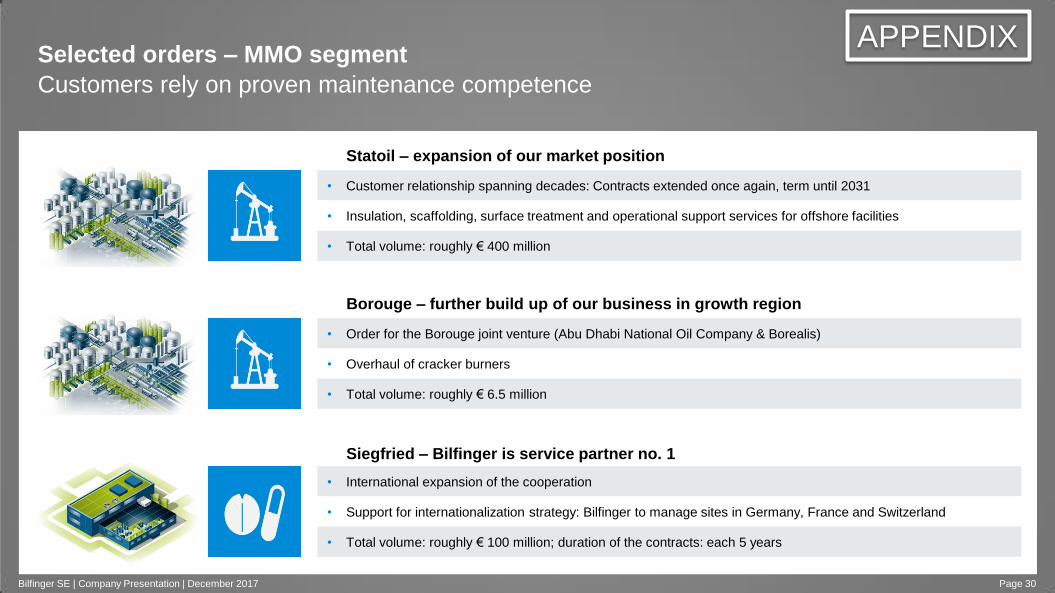
Selected orders – MMO segment
Customers rely on proven maintenance competence
Bilfinger SE | Company Presentation | December 2017 Page 30
Statoil – expansion of our market position
• Customer relationship spanning decades: Contracts extended once again, term until 2031
• Insulation, scaffolding, surface treatment and operational support services for offshore facilities
• Total volume: roughly € 400 million
Borouge – further build up of our business in growth region
• Order for the Borouge joint venture (Abu Dhabi National Oil Company & Borealis)
• Overhaul of cracker burners
• Total volume: roughly € 6.5 million
Siegfried – Bilfinger is service partner no. 1
• International expansion of the cooperation
• Support for internationalization strategy: Bilfinger to manage sites in Germany, France and Switzerland
• Total volume: roughly € 100 million; duration of the contracts: each 5 years
APPENDIX
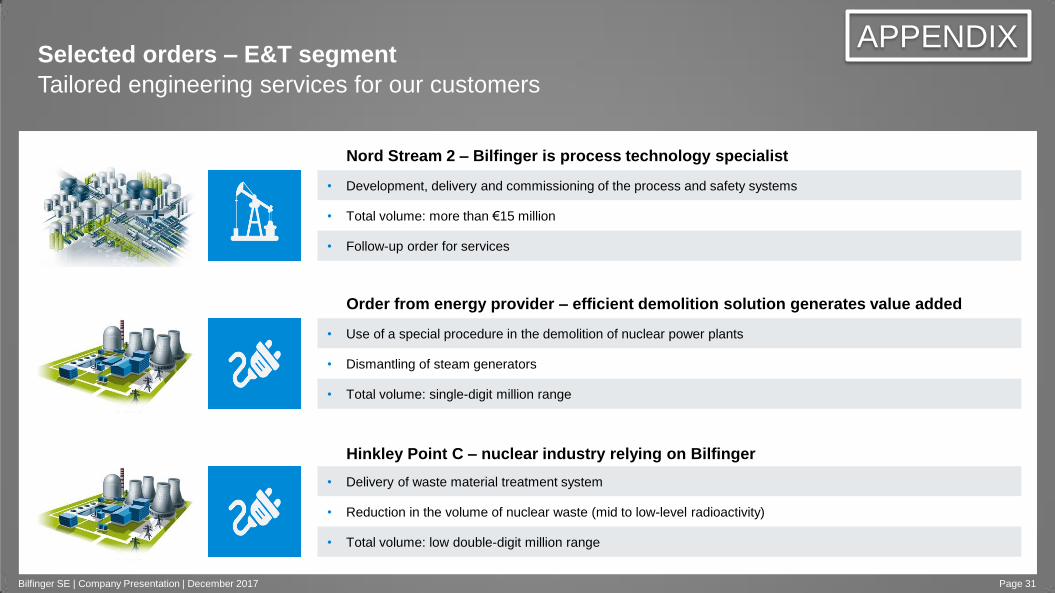
Selected orders – E&T segment
Tailored engineering services for our customers
Bilfinger SE | Company Presentation | December 2017 Page 31
Nord Stream 2 – Bilfinger is process technology specialist
• Development, delivery and commissioning of the process and safety systems
• Total volume: more than €15 million
• Follow-up order for services
Order from energy provider – efficient demolition solution generates value added
• Use of a special procedure in the demolition of nuclear power plants
• Dismantling of steam generators
• Total volume: single-digit million range
Hinkley Point C – nuclear industry relying on Bilfinger
• Delivery of waste material treatment system
• Reduction in the volume of nuclear waste (mid to low-level radioactivity)
• Total volume: low double-digit million range
APPENDIX
Nuclear Industry: Outstanding competences from Bilfinger
Market potentials throughout the entire lifecycle of a plant
Bilfinger SE | Company Presentation | December 2017 Page 32
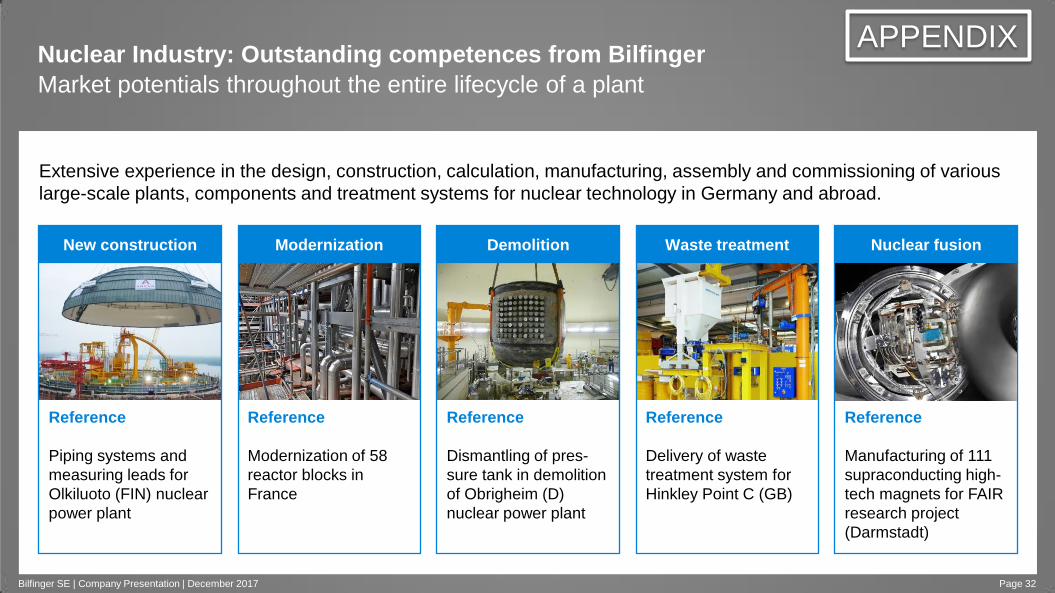
Extensive experience in the design, construction, calculation, manufacturing, assembly and commissioning of various
large-scale plants, components and treatment systems for nuclear technology in Germany and abroad.
Reference
Piping systems and
measuring leads for
Olkiluoto (FIN) nuclear
power plant
Reference
Modernization of 58
reactor blocks in
France
Reference
Dismantling of pres-
sure tank in demolition
of Obrigheim (D)
nuclear power plant
Reference
Delivery of waste
treatment system for
Hinkley Point C (GB)
Reference
Manufacturing of 111
supraconducting high-
tech magnets for FAIR
research project
(Darmstadt)
New construction Modernization Demolition Waste treatment Nuclear fusion
APPENDIX
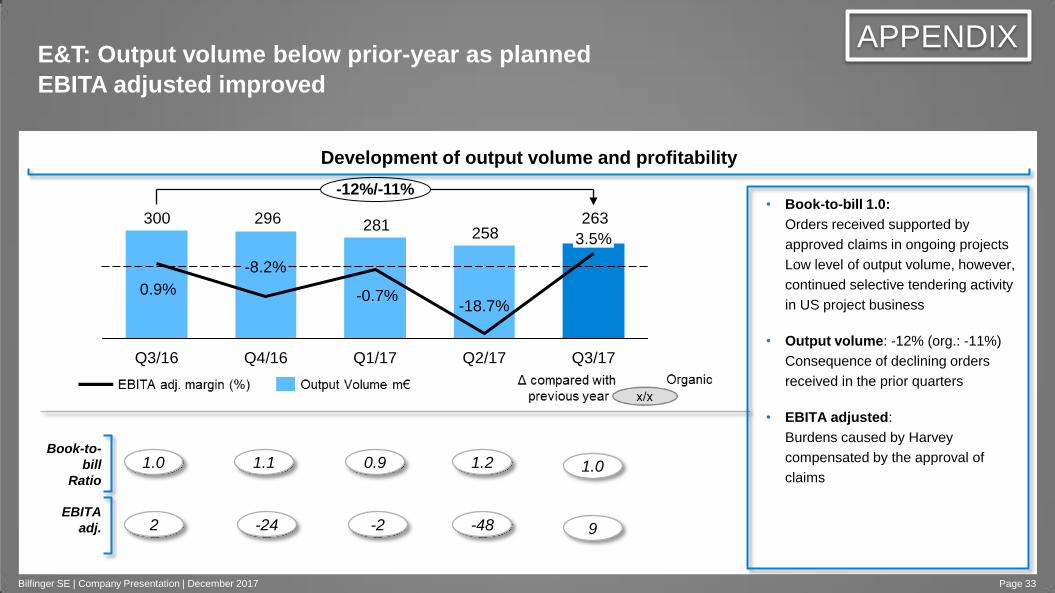
263258
281296300
-12%/-11%
Q3/17
3.5%
Q2/17
-18.7%
Q1/17
-0.7%
Q4/16
-8.2%
Q3/16
0.9%
E&T: Output volume below prior-year as planned
EBITA adjusted improved
Bilfinger SE | Company Presentation | December 2017 Page 33
Book-to-
bill
Ratio
1.0
EBITA
adj.
1.1 0.9
2 -24 -2
Development of output volume and profitability
• Book-to-bill 1.0:
Orders received supported by
approved claims in ongoing projects
Low level of output volume, however,
continued selective tendering activity
in US project business
• Output volume: -12% (org.: -11%)
Consequence of declining orders
received in the prior quarters
• EBITA adjusted:
Burdens caused by Harvey
compensated by the approval of
claims 1.2
-48
1.0
9
APPENDIX
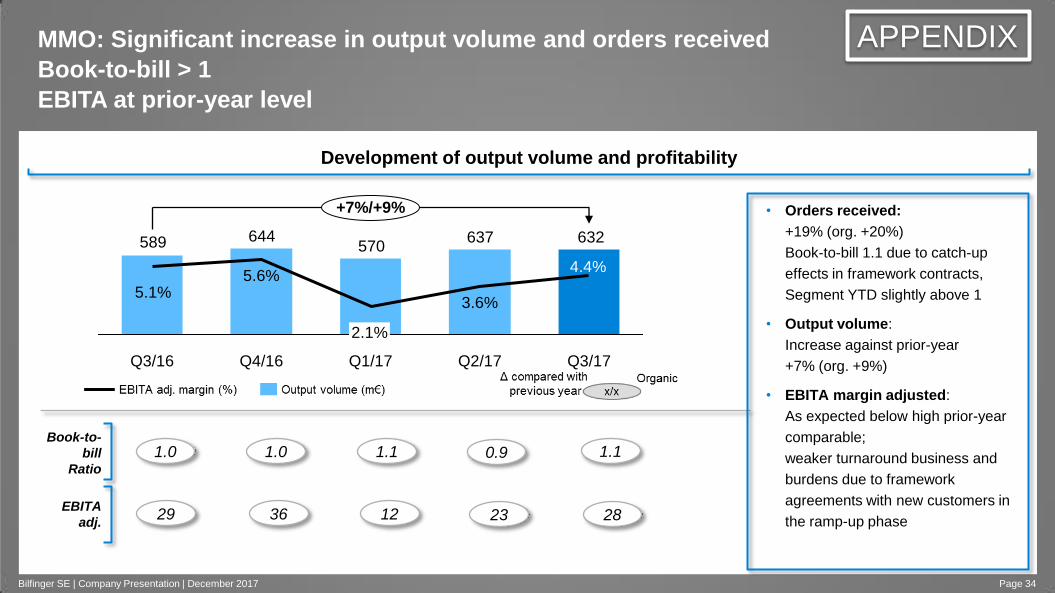
• Orders received:
+19% (org. +20%)
Book-to-bill 1.1 due to catch-up
effects in framework contracts,
Segment YTD slightly above 1
• Output volume:
Increase against prior-year
+7% (org. +9%)
• EBITA margin adjusted:
As expected below high prior-year
comparable;
weaker turnaround business and
burdens due to framework
agreements with new customers in
the ramp-up phase
MMO: Significant increase in output volume and orders received
Book-to-bill > 1
EBITA at prior-year level
Bilfinger SE | Company Presentation | December 2017 Page 34
Book-to-
bill
Ratio
1.0
EBITA
adj.
1.0 1.1
29 36 12
Development of output volume and profitability
0.9
23
1.1
28
632637570
644589
+7%/+9%
Q3/17
4.4%
Q2/17
3.6%
Q1/17
2.1%
Q4/16
5.6%
Q3/16
5.1%
APPENDIX
OOP: Eight entities already sold since the beginning of the year
One further unit in advanced sales negotiations
Bilfinger SE | Company Presentation | December 2017
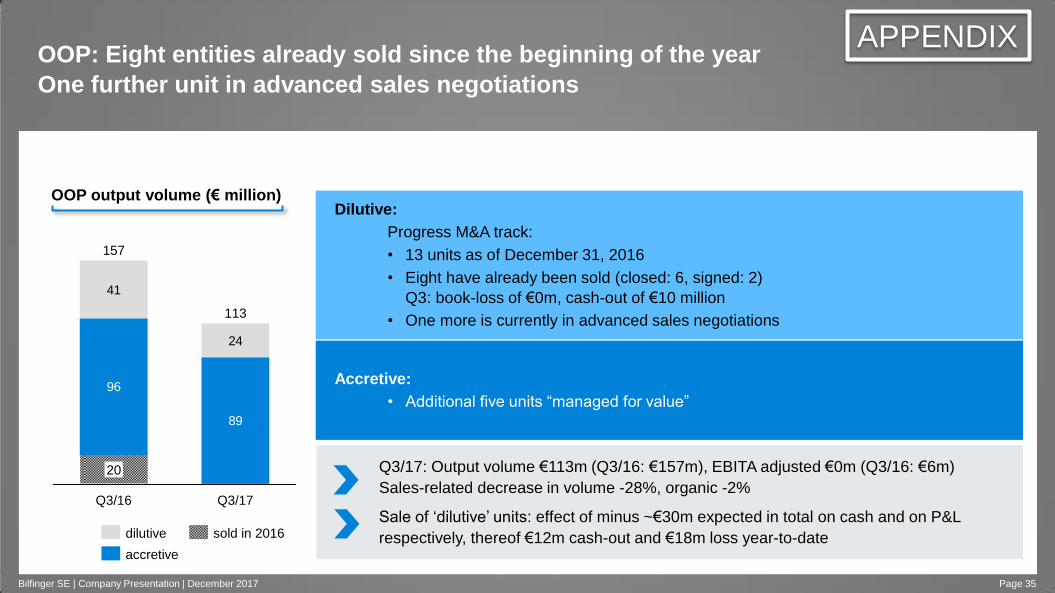
Dilutive:
Progress M&A track:
• 13 units as of December 31, 2016
• Eight have already been sold (closed: 6, signed: 2)
Q3: book-loss of €0m, cash-out of €10 million
• One more is currently in advanced sales negotiations
Accretive:
• Additional five units “managed for value” 96
89
24
41
20
157
Q3/17
113
Q3/16
OOP output volume (€ million)
sold in 2016
accretive
dilutive
Q3/17: Output volume €113m (Q3/16: €157m), EBITA adjusted €0m (Q3/16: €6m)
Sales-related decrease in volume -28%, organic -2%
Sale of ‘dilutive’ units: effect of minus ~€30m expected in total on cash and on P&L
respectively, thereof €12m cash-out and €18m loss year-to-date
Page 35
APPENDIX
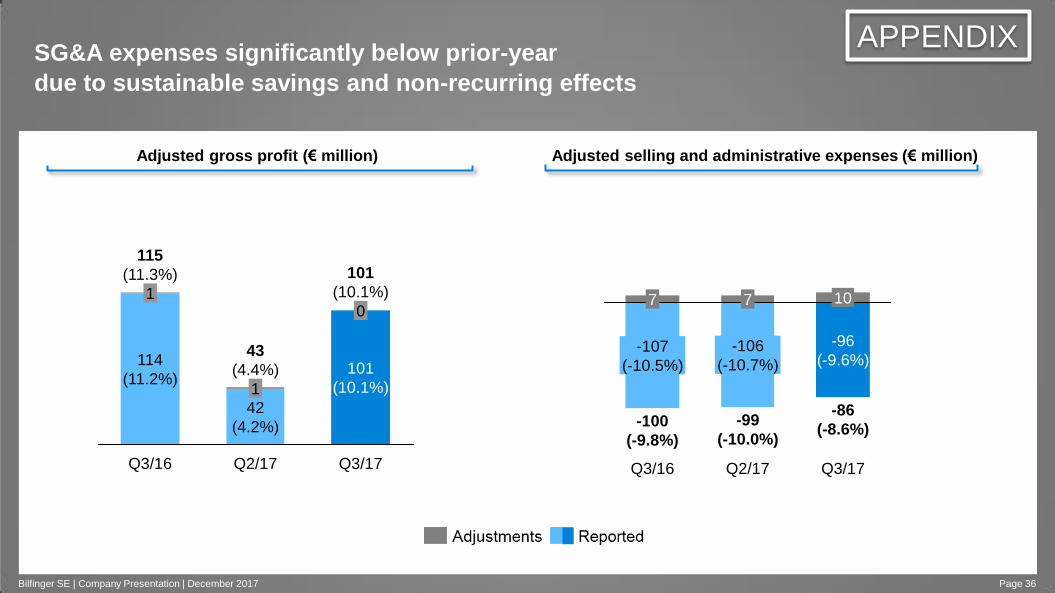
SG&A expenses significantly below prior-year
due to sustainable savings and non-recurring effects
Bilfinger SE | Company Presentation | December 2017
Q3/17
-107
(-10.5%)
-106
(-10.7%)
-96
(-9.6%)
7
-100
(-9.8%)
Q3/16
7
-99
(-10.0%)
Q2/17
10
-86
(-8.6%)
43
(4.4%)
1
Q3/16
115
(11.3%)
114
(11.2%)
1
42
(4.2%)
Q2/17
0
101
(10.1%)
101
(10.1%)
Q3/17
Page 36
Adjusted gross profit (€ million) Adjusted selling and administrative expenses (€ million)
APPENDIX
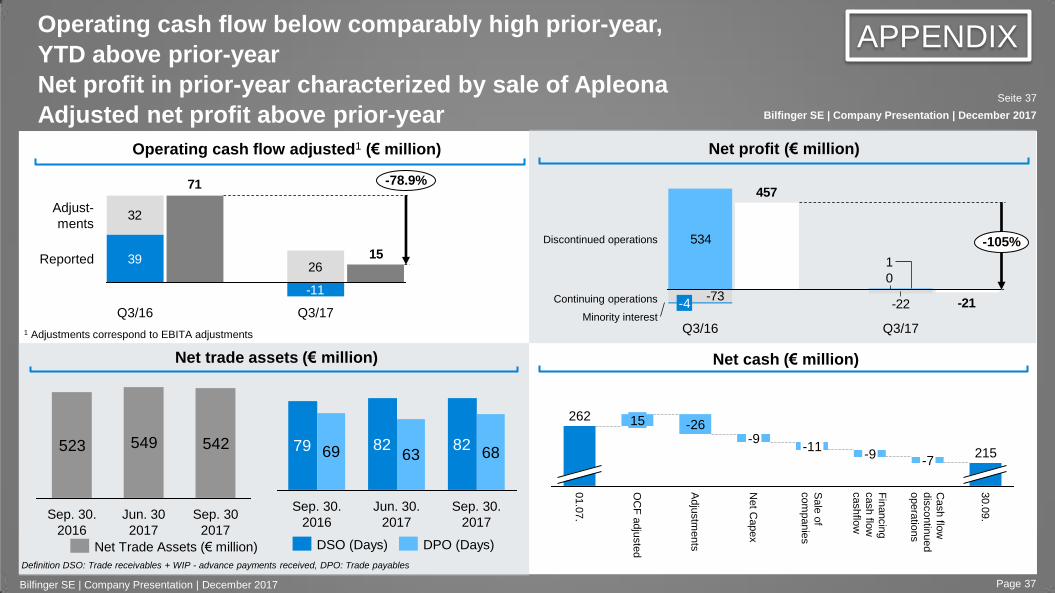
Operating cash flow below comparably high prior-year,
YTD above prior-year
Net profit in prior-year characterized by sale of Apleona
Adjusted net profit above prior-year
Operating cash flow adjusted1 (€ million)
79 82 8269 63 68
Sep. 30.
2017
Jun. 30.
2017
Sep. 30.
2016
DSO (Days) DPO (Days)
523 549 542
Sep. 30
2017
Jun. 30
2017
Sep. 30.
2016
Net Trade Assets (€ million)
-22-73
-21
457
0
1
534Discontinued operations
Q3/17
Continuing operations
-105%
Minority interest Q3/16
-4
1 Adjustments correspond to EBITA adjustments
Fin
ancin
g
cash flo
w
cashflo
w
-9
Sale
of
com
panie
s
Cash flo
w
dis
contin
ued
opera
tions
-7 215
30.0
9.
Adju
stm
ents
-26 O
CF
adju
ste
d
01.0
7.
15 262
Net C
apex
-9 -11
15
71
-11
3926
32
Q3/16 Q3/17
-78.9%
Adjust-
ments
Reported
Net profit (€ million)
Net cash (€ million) Net trade assets (€ million)
Definition DSO: Trade receivables + WIP - advance payments received, DPO: Trade payables
Page 37
APPENDIX
Bilfinger SE | Company Presentation | December 2017
Seite 37
Bilfinger SE | Company Presentation | December 2017
Disclaimer
This presentation has been produced for support of oral information purposes only and contains forward-
looking statements which involve risks and uncertainties. Forward-looking statements are statements that are
not historical facts, including statements about our beliefs and expectations. Such statements made within this
document are based on plans, estimates and projections as they are currently available to Bilfinger SE.
Forward-looking statements are therefore valid only as of the date they are made, and we undertake no
obligation to update publicly any of them in light of new information or future events. Apart from this, a number
of important factors could therefore cause actual results to differ materially from those contained in any forward-
looking statement. Such factors include the conditions in worldwide financial markets as well as the factors that
derive from any change in worldwide economic development.
This document does not constitute any form of offer or invitation to subscribe for or purchase any securities. In
addition, the shares of Bilfinger SE have not been registered under United States Securities Law and may not
be offered, sold or delivered within the United States or to U.S. persons absent registration under or an
applicable exemption from the registration requirements of the United States Securities Law.
Bilfinger SE | Company Presentation | December 2017 Page 38