bilfinger 2020 – back to profitable growth · tom blades (ceo), dr. klaus patzak (cfo), michael...
TRANSCRIPT

Tom Blades (CEO), Dr. Klaus Patzak (CFO), Michael Ber nhardt (CHRO)
February 14, 2017
Bilfinger 2020 – Back to Profitable Growth
Bilfinger SE | Capital Markets Day

Preliminary figures FY 2016

FY 2016: HighlightsSound performance in challenging environment
Bilfinger SE | Capital Markets Day | February 14, 2017 page 3
Orders received: decline in FY; Q4 above prior-year period with book-to-bill at 1
Adjusted EBITA: swing to positive €15 million after loss in prior year (€-23 million); margin improvement despite substantial decline in output volume; restructuring taking hold
Net profit : capital gain from sale of Building and Facility results in a significant increase to €271 million
Cash flow from operating activities: Operating Cash flow significant below extraordinary high prior year; net liquidity rises significantly due to proceeds from the sale
Balance sheet: stronger with substantially higher equity ratio
Dividend proposal 1): €1 per share
Outlook 2017: further improvement of earnings at lower output volume
1) subject to a corresponding resolution by the competent boards

Q4 2016: Current market situation in customer groups
Bilfinger SE | Capital Markets Day | February 14, 2017
Chemical & Petrochemical• Stable demand for maintenance services in European markets• In the US slight revival of investing activities in Chemicals; signs of recovery in project business
Energy & Utilities • Demand in project business remains low
• Volume of services requested declining especially in Germany due to insufficient capacity utilization and profitability of power plants
• Stable demand in services business in Middle East and South Africa
page 4
Pharma & Biopharma
• Good demand for projects in biotech pharma, however generally limited willingness of customers to invest
Oil & Gas• Maintenance budgets in UK and Scandinavia at a low level, however trough seems to be reached • Project business in the US shows first signs for possible recovery in mid-term future

Q4 2016: Segment development in line with expectations
Bilfinger SE | Capital Markets Day | February 14, 2017 page 5
Industrial
Orders received slightly above prior-year quarter, book-to-bill exceeds 1
Significantly lower output volume; EBITA margin (4.4 percent) above prior-year figure (3.6 percent)
Restructuring taking hold, cost base decreasing
Power
Orders received in Q4 at prior-year level, however FY well below prior year, as expected. In view of the competition and price pressure, highly-selective approach in the German and international project business
Output volume continues to decline significantly as planned; also low capacity utilization in some units impacted EBITA

�
Output volume EBITA adjusted
in € million 2016 expected 2016 2016 expected 2016
Industrial about 3,100 3,197 at prior-year level 120
Power about 1,000 967 significant improvement
over prior-year level-30
Consolidation / Others 55 at prior-year level -75
Group about 4,100 4,219 significant improvement
over prior-year level15
Expectations for FY 2016 on Group targets fully met
Bilfinger SE | Capital Markets Day | February 14, 2017 page 6
�
�
� �
�
�

Orders received in Q4 above prior-year level despit e lower share of „large“ orders
Bilfinger SE | Capital Markets Day | February 14, 2017
Development Orders Received
• Orders Received Q4 : 6% above Q4/15 (13% organic)
• Book-to-bill in Q4 at 1
• Order Backlog Q4 : below prior year quarter due to Power
• Lower share of large orders in Q4
Orders received
(m€)
Order backlog
(m€)
page 7
2,902 2,849 2,677 2,603 2,6182,618 2,902
253284320
691(68%)
1,011
Q4/15Act
810(80%)
203
Q1/16Act
742(72%)
1,013
816(76%)
1,026
810(86%)
Q2/16Act
Q3/16Act
137
947
+6%/ +13%
Q4/16Act
1,069
4,301 4,056
FY/15Act
-6%/ -1%
FY/16Act

As expected, double-digit decline in output volume in Q4 also due to tough comparable
Bilfinger SE | Capital Markets Day | February 14, 2017 page 8
EBITAadj.
(m€)
EBITA(m€)
Development Output Volume and Profitability
• Output volume Q4 : -19% (org. -15 %), as expected both segments with a decrease
• EBITA adjusted in Q4 below prior year and strong Q3, but positive in the full year
• EBITA in Q4 : Special items in the amount of € 56 Mio
1,0581,0201,0971,0441,313
0
-19%/ -15%
Q4/16Act
0.7%
Q3/16Act
2.1%
Q2/16Act
0.2%
Q1/16Act
-1.4%
Q4/15Act
1.7%
-16%/ -12%
FY/16Act
4,219
0.4%
FY/15Act
5,003
-0.5%
2122 -15 2
-53-64-32 -54
7
-49
15
-221
-23
-157

• Orders received: With € 885m +4% (org. +10%) against prior-year quarter
• Book-to-bill >=1 in the fourth consecutive quarter
• Significantly lower output volume
• Adjusted EBITA margin (4.4 percent) above prior-year figure (3.6 percent)
• Restructuring taking hold, cost base decreasing
1.00.9 1.0 1.0
788 761 814
Q4/16Q3/16
5.1%
Q2/16
834
3.7%
Q1/16
1.8%
Q4/15
942
3.6% 4.4%
-14%/-9%
Output volume (m€)EBITA adj. Margin (%)
39
Industrial:Orders received slightly above prior-year quarter, book-to-bill exceeds 1
Bilfinger SE | Capital Markets Day | February 14, 2017
34 14 31
Book-to-Bill
EBITAadj.
page 9
x/xY-o-Y growth
Organic growth
1.1
36

0.60.5 0.9 0.7
356
247 258218
Q4/16
1.5%
-39%/-34%
Q3/16
-5.5%
Q2/16
-0.4%
Q1/16
243-4.1%
Q4/15
-2.7%
EBITA adj. Margin (%) Output Volume (m€)
Book-to-Bill
-1EBITA
adj.
Power:Selective order intake in challenging markets
Bilfinger SE | Capital Markets Day | February 14, 2017
6 -7 -11
• Orders received in Q4 at prior-year level, however FY well below prior year, as expected.
• In view of the competition and price pressure, highly-selective approach in the German and international project business
• Output volume continued to declinesignificantly as planned
• Low capacity utilization in some units as well as weak project performance impacted EBITA adjusted
page 10
x/xY-o-Y growth
Organic growth
0.8
-12

Adjusted Gross Margin (m€) Adjusted SG&A (m€)
SG&A costs reduced significantly, but ratio still w ell above benchmark
Bilfinger SE | Capital Markets Day | February 14, 2017 page 11
17
431(8.6%)
FY 15Act
412(9.8%)
445(8.9%)
FY 16Act
395(9.4%)
14
Adjustments
Reported
22
-434(-10.3%)
-481(-11.4%)
47
FY 15Act
-507(-10.1%)
-529(-10.6%)
FY 16Act

67 7460 58
31.12.1631.12.15
Operating cash flow significantly below extraordina ry high prior year, also due to reversal effects
Bilfinger SE | Capital Markets Day | February 14, 2017
Net Profit (m€)Adjusted cash flow from operating activities (m€)
1) Adjustments according to EBITA adjusted
Net Liquidity (m€)
-591-279
271
-510
551
FY/16FY/16
271
-1
FY/15FY/15
-510
17 64
DPO (days)DSO (days)
31.12.16
500
31.12.15
516
Net Trade Assets (m€)
Trade Working Capital Development
page 12
2) Definition DSO: Receivables and WIP, DPO: Payables and prepayments received
1)
2) 2)
39
3254
-71.3%
Reported
Adjust-ments
Q4/16
22
Q4/15
188
149
134 39 153
-71
n.a.
FY/16
-224
FY/15
173
2
-153-58
31.12.16
510
Other
CF
disc. Op.
-136
Disposals
966
Net C
apex
-40
Adjustm
ents
OC
F adjusted
-71
31.12.15
Net Profit
Minorities
DiscontinuedOperations
ContinuedOperations

Strong foundations to build on

Starting positionExtensive analysis since mid-2016
page 14
Bilfinger 2020: Creating a strong basis for profita ble growth
Procedure
Structure
People
Products
• Deep analysis of the company, its markets and its customers• Evaluated our strengths, opportunities and challenges• Analysis based on decades-long industry experience of top management team
• Very fragmented, non-integrated sub-optimal structure• Silo mentality not reflective of market demands• Tremendous potential but unrealized opportunities
• Deep expertise, knowledge and best-in-class practices• Multiple restructuring phases led to brain-drain and loss of direction• Long-standing customer relationships
• Exceptional profile: consistently No. 1 supplier of industrial services for the process industry in Europe
• Demand for engineering and services is strong and getting stronger
Bilfinger SE | Capital Markets Day | February 14, 2017

Back to Profitable Growth2 Service Lines, 4 Regions, 6 Industries
Our ambition
• E&T – Engineering & Technologies
• MMO – Maintenance, Modifications & Operations
• Continental Europe
• Northwest Europe• North America
• Middle East
• Chemicals & Petrochem
• Energy & Utilities
• Oil & Gas
• Pharma & Biopharma
• Metallurgy
• Cement
2 Service Lines 4 Regions 6 Industries
People &Culture
Organization & Structures FinancialsCustomer &
Innovation
Where to play
How to win
We engineer and deliverprocess plant performance
page 15Bilfinger SE | Capital Markets Day | February 14, 2017

Raising the growth potential

• Number of plants in our defined markets growing constantly
8k
16k
25k
33k
4k
4k
7k
12k
1970 1990 2010 2020
12k
20k
32k
45k
Industrial service marketContinuous growth of operating plants
page 17
active plants under 10 years old
Source: Industrial Info Research
active plants over 10 years old
• More than 75% of plants are over 10 years old and number of ageing plants increasing
• Complexity of plants is increasing with positive effect on service requirements
• Ageing plants require higher level of maintenance and modernization
• Authorities impose stricter environmental standards on plant operators (reduced emissions)
• Customers demand greater efficiency
Structural demand for industrial services
Number of plants in our markets
Bilfinger SE | Capital Markets Day | February 14, 2017

Competitive Landscape (Selection)Unique value proposition for E&T and MMO business
Geo
grap
hic
scop
e
MMO
E&T
Bilfinger SE | Capital Markets Day | February 14, 2017 page 18

Bilfinger Market ModelContracted out market is USD 125 bn and rising
page 19
MMO
E&T
2020
256
146
110
2016
231
132
98
2.6%
MMO
E&T
2020
143
72
71
2016
125
62
63
3.4%
Note: E&T market volume comprises projects up to USD Mio 100
Regions
Industries
Northwest Europe
ContinentalEurope
North America
Middle East
Chemicals & Petrochem
Oil & Gas
Cement Metallurgy
Energy & Utilities
Pharma & Biopharma
+3.1%
+3.7%
+2.9%
+2.4%
Total service market (2-4-6)[USD bn]
Contracted out market (2-4-6)[USD bn]
Contracted out market by regions and industries (2016)
Bilfinger SE | Capital Markets Day | February 14, 2017

Bilfinger Market ModelDifferent market dynamics in different segments
page 20
Contracted out market / Bilfinger revenues –Growth per region [CAGR 2016-2020, nominal]
Contracted out market –Growth per industry [CAGR 2016-2020, nominal]
Cement 3.8%
Metallurgy 2.2%
Pharma & Biopharma
2.5%
Oil & Gas2 4.1%
Energy & Utilities
3.1%
Chemicals & Petrochem
3.5%~60%
~20%
~15%
~5%
~45%
~15%
~5%
~20%
~5%
<5%
Share of Bilfinger output
volume1
Share of Bilfinger output
volume1
Bilfinger SE | Capital Markets Day | February 14, 2017
ContinentalEurope 2.1%
Middle East 4.7%
North America 3.6%
Northwest Europe 3.6%
1 Sum of both MMO and E&T per region, based on FC2016, not considering Other Operations
Bilfinger growth
strength
2 w/o refineries, which are allocated to Chemicals & Petrochemicals

Delivering world class performance

Service PortfolioStrong offering for capex and opex driven services
page 22
Operations
E&T – Engineering & Technologies
Maintenance
MMO – Maintenance, Modifications & Operations
Expansions
Efficiency
Emissions
Turnarounds
Maintenance Contracts
Operations
Packaged Units
Plant Expansions
De-Sulfurizations
Mod
ifica
tions
Bilfinger SE | Capital Markets Day | February 14, 2017
OPEX
CAPEX

Go-To-Market organizationMarket focus, customer centric
page 23
MMO – Maintenance, Modifications & Operations
Regional
E&T – Engineering & Technologies
Inte
rnat
iona
l
North America
Middle East
Northwest Europe
Continental Europe
Construction
Technologies
Execution
Planning Oil & Gas
Chemicals & Petrochem
Energy & Utilities
Pharma & Biopharma
Metallurgy
Cement
22 plant types
6 industries
Bilfinger SE | Capital Markets Day | February 14, 2017

Innovation MMOWorld Class Maintenance
Bilfinger SE | Capital Markets Day | February 14, 2017 page 24
Differentiated Proposition
• Leading MMO provider in Europe
• Engineering credentials
• Full service provider
• Proprietary and unique Bilfinger Maintenance Concept
• International / regional footprint
• Health and Safety excellence
• People excellence

Innovation MMOBilfinger Maintenance Concept to deliver process plant performance
page 25
• BMC is a world class and proven concept to significantly improve maintenance performance
• Maintenance concepts are analysed and optimized along 16 standardized modules
• More than 30 tools help to increase HSEQ performance, increase Hands on Tool time and reduce maintenance overhead costs
• Over time, the share of proactive based maintenance is increased and therefore reactive maintenance can be reduced
• More than 400 projects to assess and improve maintenance in process industries have been successfully completed with BMC
Bilfinger SE | Capital Markets Day | February 14, 2017

Performance MMOBMC has reduced maintenance costs at Yara Glomfjord consistently
page 26
0
20
40
60
80
100
120
Year 0 Year 1 Year 2 Year 3 Year 4 Year 5 Year 6 Year 7 Year 8 Year 9
Maintenance cost (nominal amounts) and production development over 10 years
Maintenance costs and Production Volume (indexed)
100%108%
Maintenance - Direct Costs• Reactive• Scheduled / Periodic• Proactive Preemptive
Bilfinger SE | Capital Markets Day | February 14, 2017

DigitilizationSmart App, SPA Platform Integration and Planning Efficiency
Bilfinger SE | Capital Markets Day | February 14, 2017 page 27
From PRO-ACTIVE to PREDICTIVE
• Digitalization integral to MMO strategy
• Execution efficiency
• Planning efficiency
• Supporting asset integrity
• Seamless interface to customers
• HSE assurance

Security IntegrityDigitalization drives efficiency
Bilfinger SE | Capital Markets Day | February 14, 2017 page 28
HSE Assurance
FixedInstallation
MobileInstallation
• Site access control eliminates paper based protocols
• High throughput / time saving
• Electronic work flow reduces risk of errors
• Verification of competency and certifications
• HSE compliance
• Direct SAP connectivity

Asset IntegrityUp-to-date online plant documentation
Bilfinger SE | Capital Markets Day | February 14, 2017 page 29
Reverse engineering
An updated documentation set is created
using existing documentation and laser
scanning
Main output
Engineering database with digital plant model
• Updated P&ID
• Single source for all information
• Revision control documentation
• Data consistency
• Data integrity
• Data accessibility

Output is a complete 3D model source for isometrics, BOM, MTO, P&ID …
Asset IntegrityLaser scanning technology
page 30
On-site data capture. Millions of points of 3D data stored
Data processing
Pixel cloud converted to 3D model
Model intelligence
3D model imported and plant information is incorporated for each component
As-built 3D model
Laser Scanning
Bilfinger SE | Capital Markets Day | February 14, 2017

DigitilizationLaser Scanning
Bilfinger SE | Capital Markets Day | February 14, 2017 page 31

Health Safety EnvironmentKey differentiator
Bilfinger SE | Capital Markets Day | February 14, 2017 page 32
Differentiated Proposition
• Recognized HSE leader
• Bilfinger HSE: People, training, qualification and certification
• Our people can work safely in dangerous environments
• Strong track record in HSE performance
• Key benefit for our customers and a key competitive advantage for us

AccessDeliver customer needs
Bilfinger SE | Capital Markets Day | February 14, 2017 page 33

Bilfinger SE | Capital Markets Day | February 14, 2017 page 34
• “Normal anchoring” for scaffolding is not always possible with storage tanks
• Large, pyramid-shaped scaffolding with additional ballast weigh is required in certain cases
• Client sought stable scaffolding construction on an ethylene tank in a safer, quicker and more cost-effective way
• Bilfinger’s scaffolding with magnetic anchor points uses permanent magnets to attach a slim scaffolding construction to the steel tank wall
• Scaffolding construction tailored to the client using 3D infinite elements software to simulate forces on every magnetic anchor point and to simulate external influences like wind and weather
CHALLENGE SOLUTION
ScaffoldingInnovative magnetic anchoring

E&T at a glanceCovering entire life-cycle of process plants
Bilfinger SE | Capital Markets Day | February 14, 2017 page 35
Planning
Execution
Technologies
Construction
Modifications Expansions Efficiency Emissions

Process Plant PerformanceProcess critical units (packaged units and skids)
Bilfinger SE | Capital Markets Day | February 14, 2017 page 36
Credentials
• Almost 200 years of engineeringtradition and heritage
• Delivering „Performance“
• Efficiency
• Expansions
• Emissions
• Packaged units in each of our sixtargeted industries
Gas storage Piping
Containment LinerBioreactor
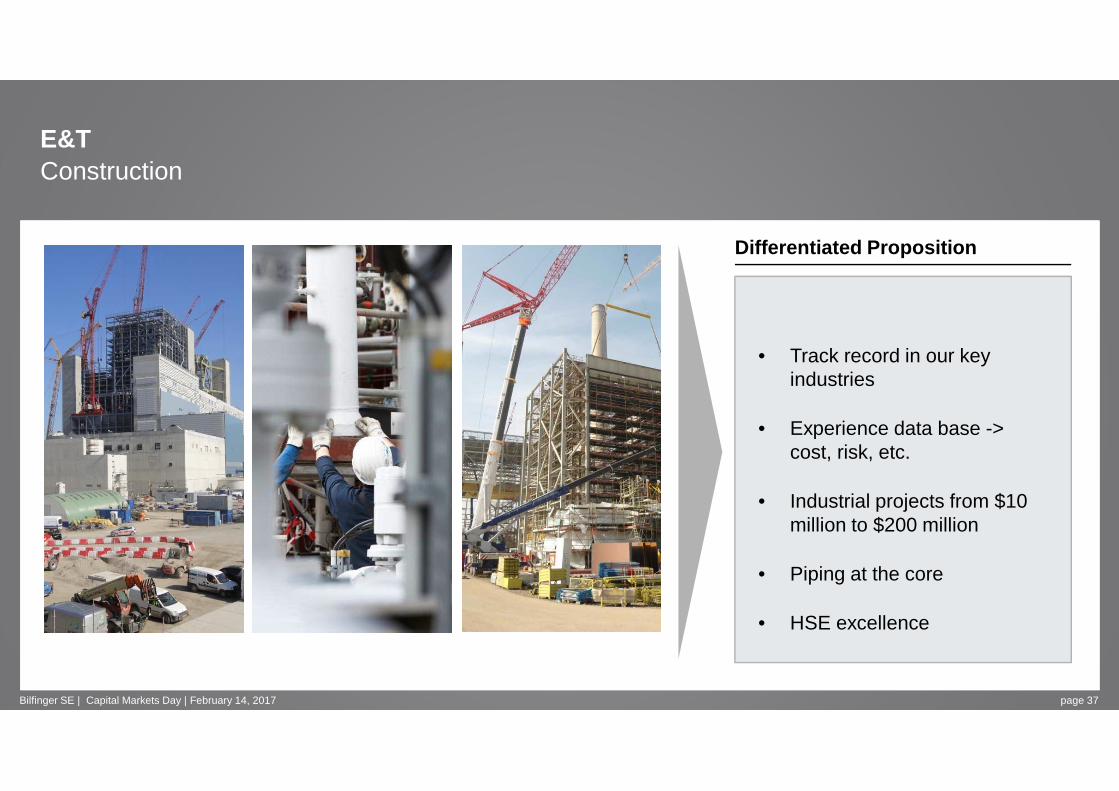
E&TConstruction
Bilfinger SE | Capital Markets Day | February 14, 2017 page 37
Differentiated Proposition
• Track record in our keyindustries
• Experience data base -> cost, risk, etc.
• Industrial projects from $10 million to $200 million
• Piping at the core
• HSE excellence

E&TEmissions & Environmental
Bilfinger SE | Capital Markets Day | February 14, 2017 page 38
Product portfolio
• Legislation driving emissions / environmental requirements andupgrades
• De-salination (forward osmosis)
• CO2 recovery unit
• Flue-gas de-sulfurization
• Marine de-sulfurization

Connecting the dots to deliver more

Strategic assessment of all entitiesValue add potential and strategic relevance
Bilfinger SE | Capital Markets Day | February 14, 2017 page 40
Targeted approach for structuring and integrating
• Services for multiple industries,e.g. refineries
• Engineering competences,e.g. gas processing
• Projects,e.g. chemical plants
• Fabrication, e.g. processing inlet / outlet or gas oil separation plants
Parts of the portfolio for OOPBilfinger ‘from yesterday to today’
• Other Operations are entities with lower degree of strategic fit to 2-4-6
• Profitable businesses with improvement potential are “managed for value”
• Some entities identified as dilutive are going to be fixed and soldOOP
E&T
MMO
Power with value add potential
PowerOil &Gas
EngineeringSolutions
Industrial Maintenance
& ISP

Driving profitable growthThree major growth levers for above market profitable growth
page 41Bilfinger SE | Capital Markets Day | February 14, 2017
Comparison of growth rates[CAGR 2016-2020 in %]
Bilfinger organicgrowth1
>5%
Contracted out market
3.4%
Total market
2.6%
More than 20 growth initiatives detailed, including:
• References• Rationale and
tactics• Pre-requisites
and mitigation• Financial effects• Responsibilities
and milestones
Tracking will be included in group wide tracking to ol B TOP
Growth levers and growth impact
MMO: Expand share of wallet in home market, develop growth regions
E&T: Go-to-Market push in growth regions
All: Expand Bilfinger value chains into hitherto underserved industry segments
A
B
C
Continental Europe
Northwest Europe
North America
Middle East
In line with market Above market Outpace market
1 CAGR 2017-2020 in %

Company Program „B TOP“Key initiative for Bilfinger
page 42Bilfinger SE | Capital Markets Day | February 14, 2017
Transforming Operational PerformanceInitial situation
• Past improvement programs successful but limited to SG&A
• Several local operational improvement measures but overall still potential for more performance
• New management team well experienced in comprehensive andcontinuous improvementprograms for high performance culture
• Setting clear andambitious targets
• Clear responsibilities
• Definingmeasures andtrackingimplementation
• Operationalize financial targets
• Benchmark keyimprovementlevers
• Profit transition
• Sticking toambitious targets
• Organic growth
• Operational excellence culture
+ +

Value Proposition ExampleOil & Gas onshore
page 43Bilfinger SE | Capital Markets Day | February 14, 2017
Oil treatmentNitrogengenerationDehydrationGas
compressionSeparation Water and gas treatment
Process steps served by BilfingerEngineered integrated solutions
Gas dehydration unit A&C site activities
Safety service activities
Heat recovery package unit
Regeneration package unit

Improving our financial performance

E&T and MMOBilfinger Revenue Model
page 45
E&T – Engineering & Technologies
MMO – Maintenance, Modifications & Operations
• Multi-year Service Duration: 3+2 years
- Unit rates
- Day rates
• Regular Modifications
• Periodic Turnarounds
• Project Based C. Duration: 3-18 months
− Lump-sum Turnkey Contract
− Time & Material Contract
• Packaged Units / Technology
Bilfinger SE | Capital Markets Day | February 14, 2017

Bilfinger 2020 Creating a world class company
page 46
Time
• Organic growth and possible selected bolt-on acquisitions
• Focus on core services, industries and regions
• Capitalizing our exceptional profile
• Manage risk• Offering our services
along all value chains• B TOP Excellence
• Organic growth and targeted acquisitions
• Increasing financial performance
Stabilization Build up Build outValue
• Self-help and connecting the dots
• Establishing 2-4-6 structure• Avoid risk• Consolidate best practice
from across the firm• Reduce SG&A• B TOP Implementation
Bilfinger SE | Capital Markets Day | February 14, 2017

People and culture

Key personnel Experienced international operational management team
page 48
Engineering & Technologies MMO – Region Continental Europe MMO – Region Northwest Europe
MMO – Region North America MMO – Region Middle East
Other Operations
Jean-Pierre PasquereauExecutive President38 years of industry experience
Jens BorgschulteFinancial Director26 years of industry experience
Michael LöffelmannExecutive President (from 04/17)16 years of industry experience
Duncan HallExecutive President25 years of industry experience
Clive KendalFinancial Director28 years of industry experience
Gerald PilottoExecutive President22 years of industry experience
Matti JäkelFinancial Director28 years of industry experience
Dr. Roland GärberExecutive President15 years of industry experience
Stefan HerschlerFinancial Director20 years of industry experience
Terrance IversExecutive President35 years of industry experience
Volker SembillFinancial Director10 years of industry experience
Niklas WiegandExecutive President13 years of industry experience
Bilfinger SE | Capital Markets Day | February 14, 2017

The Bilfinger WayMission statement enabling change
page 49
Common direction and a high commitment to the Bilfi nger Way
• Aligned Competencies : Our common strengths define “The Bilfinger Way” to success
• We make it work : The passion of all our employees is to increase our customers’ plant performance
• Our Values: The three Cs guide us in our tasks and give us a clear direction
• Integrity and safety: Our foundation and aspiration is to never compromise on integrity and safety
Bilfinger SE | Capital Markets Day | February 14, 2017

Our employeesKey differentiator
page 50
Significant investments in our people and in effici ent HR processes
High level of competence and technical expertise• 5,500 engineers• 25,000 skilled experts• Overall 37,000 employees
HR tools• Various best practices along all steps of the
employee lifecycle: on-boarding, appraisals and incentives
Bilfinger Academy• Tailored programs to secure standards and steady
improvement of leaders and staff• >40,000 e-learnings; >5,000 training days
• Talent Management Development, retention and succession planning
• Project HRculesStandardization and automation of HR processes
• Bilfinger Academy 2.0Expanding competenciesinternationally to blue- and white-collar workers
PrioritiesStatus quo
Bilfinger SE | Capital Markets Day | February 14, 2017

ComplianceTop priority
page 51Bilfinger SE | Capital Markets Day | February 14, 2017
Creating a world class compliance system
• One simple set of rules : New mission statement, new code of conduct, new group policies for the whole group
• Outstanding team : Highly experienced General Counsel & Chief Compliance Officer, Monitor and external advisors
• High investments : Spend of in high-double-digit-million-€-amount in previous as well as in coming years for implementation of effective compliance and integrity program as well as for conclusion of older cases
• Continuous improvement: Rollout of further state of the art compliance processes and regular review of effectiveness
• Strengthening culture of integrity: Prevent, detect, response as strong measures of our effective compliance program
Response
Prevent
Detect
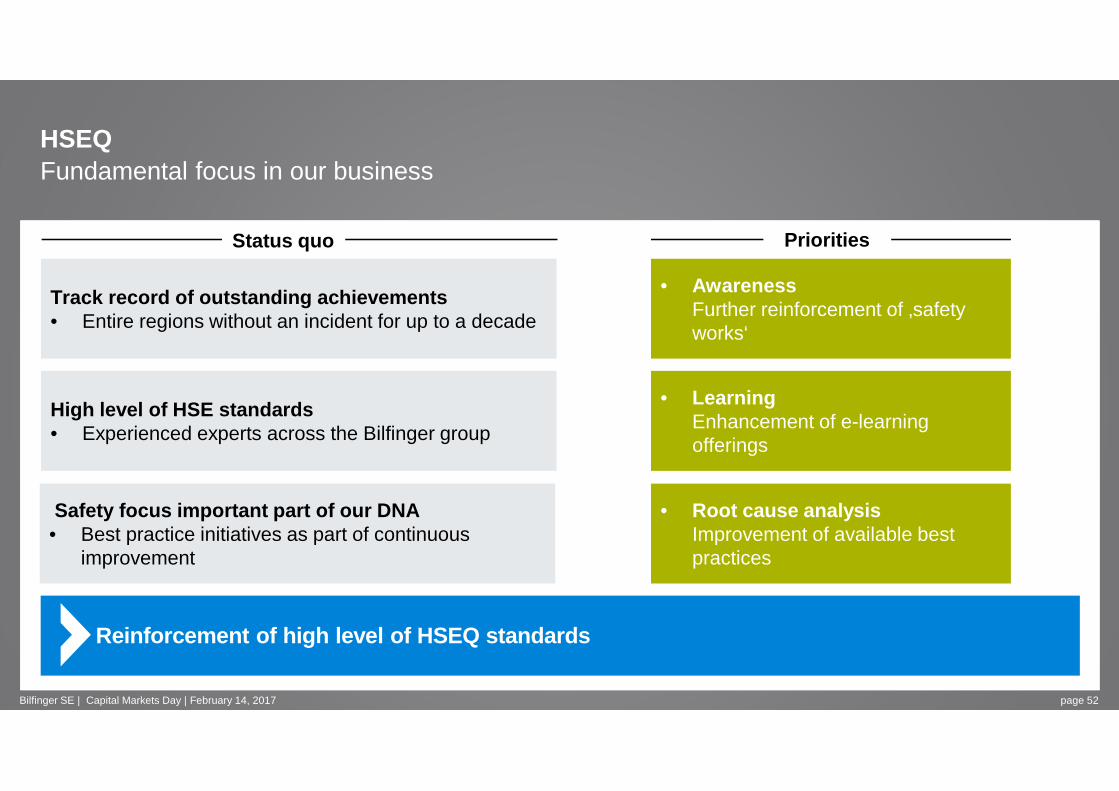
HSEQFundamental focus in our business
page 52
Reinforcement of high level of HSEQ standards
Track record of outstanding achievements• Entire regions without an incident for up to a decade
Safety focus important part of our DNA• Best practice initiatives as part of continuous
improvement
High level of HSE standards• Experienced experts across the Bilfinger group
• AwarenessFurther reinforcement of ‚safetyworks‘
• Root cause analysisImprovement of available best practices
PrioritiesStatus quo
• LearningEnhancement of e-learning offerings
Bilfinger SE | Capital Markets Day | February 14, 2017
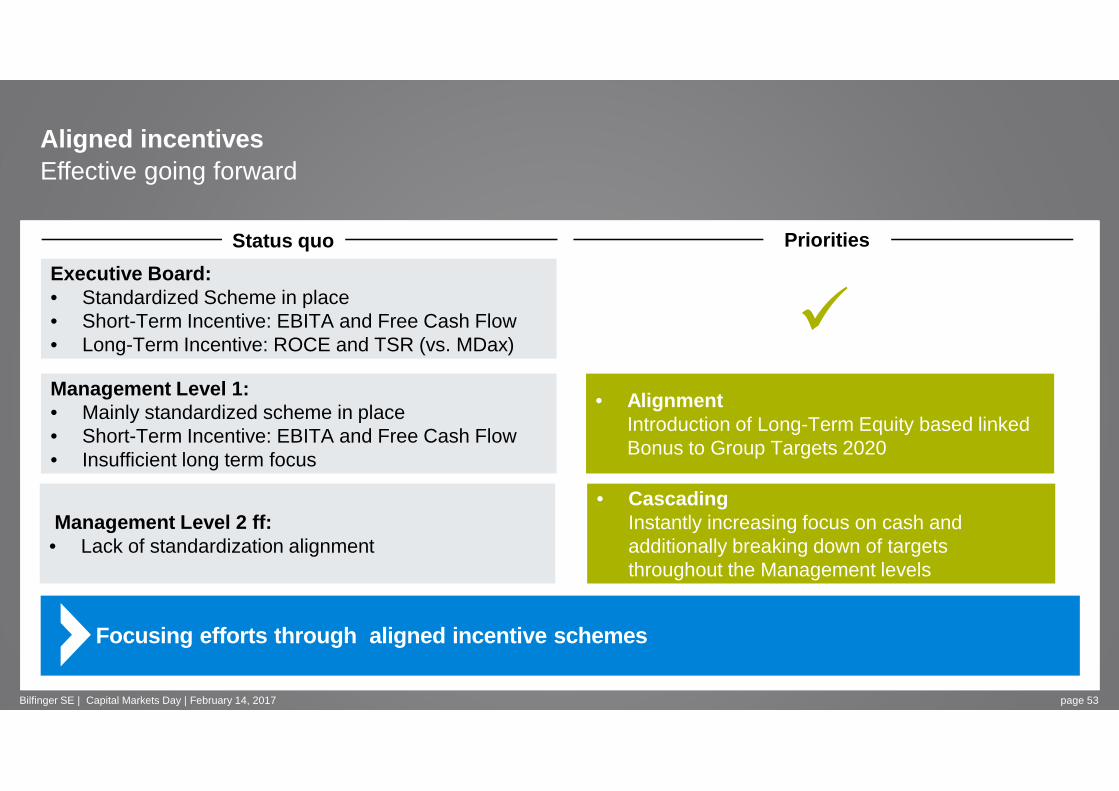
Aligned incentivesEffective going forward
page 53
Focusing efforts through aligned incentive schemes
Executive Board: • Standardized Scheme in place• Short-Term Incentive: EBITA and Free Cash Flow• Long-Term Incentive: ROCE and TSR (vs. MDax)
Management Level 2 ff:• Lack of standardization alignment
Management Level 1: • Mainly standardized scheme in place• Short-Term Incentive: EBITA and Free Cash Flow• Insufficient long term focus
• AlignmentIntroduction of Long-Term Equity based linkedBonus to Group Targets 2020
PrioritiesStatus quo
• CascadingInstantly increasing focus on cash and additionally breaking down of targetsthroughout the Management levels
�
Bilfinger SE | Capital Markets Day | February 14, 2017

Outlook Bilfinger 2020

Our analysis for sustainable und profitable growth
page 55Bilfinger SE | Capital Markets Day | February 14, 2017
Our market What we are How to win
>5 % top lineCAGR1
$ 125 bn CAGR ~3.4 % 2-4-6 Market Focus & Customer Centric People, engineering, credentials,customer proximity, innovation
1 CAGR 2017-2020 in %

Execution Plan

Ambitions will be achieved in three stages
Stabilization
Build up
Build out
What does it mean in numbers?How will we execute?How will we measure and report progress?
Time
Value
Bilfinger SE | Capital Markets Day | February 14, 2017 page 57

Ambition 2020*:
Organic CAGR** >5%
EBITA adj. margin ~5%
Root Cause and Lever Analysis
Market Model: Growth and Industry Profit Pool
Benchmarks / Peer Group comparison
Historical Performance
Own competences
Company ambition is derived from a comprehensive an alysis
* Mid-cycle targets ** Based on FY 2017
Bilfinger SE | Capital Markets Day | February 14, 2017 page 58

MMOEBITA
E&T-2.4%
E&T FY 2016 Blended margin rangeBilfinger profile 2020
Profit pool according to Bilfinger profile 1 (Mix FY 2020)
1) Estimate based on expected Bilfinger revenues and typical profitability in relevant segments (“Homunculus”), mid-cycle i.e. stable economic environment
5 to 9%
Adjusted EBITA margin FY 2016
Margin ambition is supported by an extensive profit -pool analysis
E&TEBITA
Bilfinger SE | Capital Markets Day | February 14, 2017 page 59
• E&T with a defined path to improve profitability
• Entering blended margin range towards the end of the planning period
• Based on growth investments 2017 to 2020 business mix will improve beyond 2020 and lead to further upside potential
• Stable MMO business already within blended margin range
• 2018ff: Margin improvement towards upper end of blended margin range
• Based on growth investments 2017 to 2020 business mix will improve beyond 2020 and lead to further upside potentialMMO FY 2016 Blended margin range
Bilfinger profile 2020
4.9%
3 to 5.5%

We will address all P&L line-items
Impact on gross margin:
~200bps
Impact on SG&A ratio~300bps
AMBITION 2
EBITA margin increase of
~500bps
by 2020
• LOA1 process• Project management
• Process and IT harmonization• Procurement
GROSS MARGIN
ADDRESSING BOTH LINE ITEMS
SG&A RATIO
• Lean headquarters• Lean structures in the field
1) Limits of authority 2) Mid-cycle targets
Bilfinger SE | Capital Markets Day | February 14, 2017 page 60

Overall ~100bps gross margin improvement from proje ct excellence measures by 2020
PROJECT MANAGEMENT
Improvement, standardization and enforcement of project management process
LOA PROCESSDefine limits of authority in relation to defined risk categories
Timeline: fully implemented 2018
Timeline: fully implemented 2017
Bilfinger SE | Capital Markets Day | February 14, 2017 page 61

Root cause analysis: mid-sized projects with most significant loss impact
Gro
ss p
rofit
Project size
Root cause analysis on projects over a period of se veral years
• Most projects >50m EUR were profitable
• Most significant impact from projects between 5 and 25m EUR project size
0
Bilfinger SE | Capital Markets Day | February 14, 2017 page 62

Root cause Analysis: Issues mainly originate in early stages, detection rather late
• Detection of deviation plan/actual rather late in the execution
• Very limited opportunity to counteract at high percentage of completion
• Need for clear understanding of project risk and own competences before bid is submitted
• Need for reliable early warning indicators
• Need for strengthened project planning and execution competence
-100%
-80%
-60%
-40%
-20%
0%
20%
40%
0% 20% 40% 60% 80% 100%
Percentage of Completion in %
Dev
iatio
n in
Gro
sspr
ofit
in %
Bilfinger SE | Capital Markets Day | February 14, 2017 page 63

Introduction of risk-sensitive LOA processes to avo id project losses
Status quo
• Authorization by Executive Board based on volume-thresholds only
• A number of projects with significant losses did not reach Executive Board approval level
Way forward
• Improved risk categorization, mandatory for all projects
• Risk-based Board authorization thresholds
• Approval templates differ according to risk class
• Every project which was approved by Board will be further monitored by Board � “Project Days” with Executive Board
Project volume thresholds per risk class
Risk category
€
Executive Board
Responsible Board Member
Divisional Management
Regional / legal entity level
Bilfinger SE | Capital Markets Day | February 14, 2017 page 64

Project Management Concept
• Group-wide introduction of consistent processes which are centrally developed and maintained
• Consolidation of key project data in a single data warehouse
• Determination of KPIs on earned value base
• Stage-Gate Reviews for tenders, short-term interval controlling based on standardized templates
• Continuous monitoring of improvement
Mandatory project management process, centrally monitored and enforced
Stage-gate process
StructuredData and KPI
collection
HRdevelopmentand training
Project manage-ment core processes
Continuous improvement process (CIP)
Bilfinger SE | Capital Markets Day | February 14, 2017 page 65

SG&A costs will be addressed both in headquarters a nd in the field
Bilfinger SE | Capital Markets Day | February 14, 2017 page 66
Lean headquartersRole of HQ and streamline costs
Reduction in number of legal entitiesLead company concept
Lean structure
Timeline: implementation already started, in full swing by 2020
Timeline: in full swing by 2020

Headquarters costs will be reduced to 1% of output volume
• Role of HQ: Strategic Controller , i.e. business related activities will move into divisions
• Current FTE ambition for 2018/2019 includes investment for improvement of internal control systems
• Transparent and clear cost ownership to be established
• Significant savings potential from lower consulting expenses
220
280315
2015 2016
-30%
Average FTE
HQ
Target 2018/2019
Ambition after full ICS
implementation and Process/IT harmonization
8089
HQ costs adj.*
…
~1% of output volume
Target 2020
20162015
* on a comparable base after re-allocation of Government Services to MMO
Bilfinger SE | Capital Markets Day | February 14, 2017 page 67

Reduction of organizational complexity will reduce SG&A costs and increase speed
~-40%
Non-operating
Legal Entities
Operating Legal
Entities
Ambition*Current
232
31.3.2016
279
• Currently, only in some countries (e.g. GER) enough critical mass for Shared Services
• Many small entities which can be served by lead company concept
• In the course of IT roll-out (ERP and HR) additional opportunities for shared services and outsourcing will arise
• Liquidations and mergers taking into account legal and tax-related aspects
• Significant reduction targeted• Limited direct cost savings, but significant reduction
of complexity which leads to higher efficiency
*Ambition: excludes potential acquisitions
160
Bilfinger SE | Capital Markets Day | February 14, 2017 page 68

Lead company concept for pragmatic regional bundlin g
Consolidation approach
• Non-transactional, LE- or business-specific functions will mainly be retained in local LE
• Selected activities may still be transferable to Lead Company – hence function-specific investigation required
• Non-transactional, not LE- or business-specific functions to be transferred to Lead Company
• Transactional , not Legal Entity (LE) –or business-specific functions to be transferred to Lead Company unless provided by shared service center
Functions
Transactional functions
Non-trans-actionalfunc-tions LE-/
business-specific
Not LE-/ business-specific
Finance :
• Finance function largely covered by lead companies
• Smaller associated companies with shared CFO
HR:
• Main HR work in lead companies
• Associated companies w/o head of HR, but with locally required HR activities
Comparable approach for IT, Purchasing, etc.
Impact on functions
Bilfinger SE | Capital Markets Day | February 14, 2017 page 69

Example North AmericaReduction of complexity combined with lead company concept
Bilfinger SE
Bilfinger Industrial Services N.A. Holding Inc.
Bilfinger Industrial Services Inc.
Bilfinger Salamis Inc. Bilfinger Westcon Inc.
FCHC Corporation(inaktiv )
Centennial Holding Corporation Inc.
(inaktiv )
FCC Corporation
Centennial Contractors
Enterprises Inc.
Bilfinger SE
BIS Holding
Bilfinger Industrial Services Inc.
Bilfinger Salamis Inc. Bilfinger Westcon Inc.Centennial Contractors
Enterprises Inc.
Current Structure: Target Structure:
Gross savings of ~30% of today’s cost base:
Optimizing SG&Acosts through improvement of processes and bundling of administration activities, while investing in sales-front offices in line with growth opportunities
• No bundling within the North American entities• Functions have been partially outsourced
(e.g. IT, Legal, Taxes)• 5 operating companies, 4 ERP-Systems incl.
various subsystems
• Harmonize ERP-systems• Reduce Management FTE’s through functional
bundling• Bundle Accounting, Payroll and IT in particular
(FTE-savings in this area around 30%)• Reduce consultant costs in Legal and Tax
while ensuring faster utilization of tax-loss-carry forwards
• Office bundling
Bilfinger SE | Capital Markets Day | February 14, 2017 page 70

Build-up of customer-facing SG&A only if growth potential is materializing
434
2020
SG&A costs
Current SG&A program
Build-up customer-facing sales activities
7.5% of outputvolume
>-100
FY 2016 adj.
• Build-up of additional costs depends on order development according to plan
• Measures defined to reach savings targets• Degree of implementation varies• Additional measure buffer will be built up to
increase probability • Monitoring concept will ensure transparency
and discipline
Structural improvements:
• Within “G&A”:• Reduction of
bureaucracy• Increase of
customer focus
• Within “S”:• From back-office to
front-office• From Europe to
growth markets• From established to
new industries
Bilfinger SE | Capital Markets Day | February 14, 2017 page 71

Process and IT harmonization as well as improvement s in sourcing are supporting the margin ambition
Bilfinger SE | Capital Markets Day | February 14, 2017 page 72
Process and IT Harmonization Bilfinger IT Strategy
Timeline: Wave-approach, in full swing by 2020
ProcurementInitiative
Bilfinger Purchasing Strategy
Timeline: Continuous improvement of contribution to earnings

ERP target for 2019 includes 5 systems, all SAP-bas ed
Harmonized and complexity reduced target ERP landsca pe based on 5 SAP systemsCurrent landscape22 ERP systems
There is additional potential to further integrate the ERP landscape to a single ERP beyond 2019
Input: delivery processes
Business Intelligence
Consolidatedtarget
SAP P14+system
SAP CSP
SAP systemsSAP systems
SAP systemsSAP systems
SAP systemsSAP systems7 SAP environments
…..….
SAP P09
SAP MC16 Navision environments
Ecaxt
9 Other environments
SAPDI3PSH-
project
Global harmonization of 6 key processes: • Purchase to Pay • Market to Order• Order to Cash• Hire to Retire• Investment to Disposal• Book to Report
Time
2018
1st migration wave
2020
3rd migration wave
2017
Design and build of global template
2019
2nd migration wave
Stabilization Build up Build outValue
Global single HR system
Global CRMSales Force
simplified
Profitoool
Bilfinger SE | Capital Markets Day | February 14, 2017 page 73

Significant investments in IT and process harmoniza tion leading to greater efficiency and transparency
Organizational structure & governance
Innovation partner
Benchmark IT costs
Business value
IT strategy
• Investment of ~€50 million mainly in FY 2017 and 2018
• Cost improvement program targeting run costs:
• Transformation into global IT organization in combination with lead company concept
• Preparation of Cloud solutions, e.g. for email and collaboration
• Reduction of number of servers (potentially outsourcing)
• Retirement of old ERP systems
• Ambition for 2020: IT costs within benchmark range: Today 2.2% of output volume � Ambition of 1.8%while supporting (internal and external) customer benefits and innovation
Bilfinger SE | Capital Markets Day | February 14, 2017 page 74

Procurement initiative will lead to higher producti vity
Status Quo
• In general low maturity level
• Global sourcing not established
• Many manual process steps
• Lack of data transparency
Ambition 2020
• High maturity level across regions and categories
• Savings linked to P/L• Digitalized procurement• Data driven sourcing
Mainly ServicesMaterial & ProductsSpend
overall~1.0
Directs
Indirects
Procurement spend break-down [in bn EUR]
~2.1Potential of >50 bps EBITA margin impact
Includes: IT & Telecoms, Fleet, Real Estate, etc.
ThereofImpacting “own” P&L
Bilfinger SE | Capital Markets Day | February 14, 2017 page 75

Stopping the cash drain is a key management priority
Status QuoFree cash flow development Root causes Measures
Overhead SG&A efficiency program �
Project losses Project management initiatives �
Working capital
Working capital management
2
-264
-111
136
20162015
Free cash flow adjusted
Free cash flow
Bilfinger SE | Capital Markets Day | February 14, 2017 page 76

Working capital management with focus on shortening the approval and billing process
DPODSO 12/31/2016
Measures:
• Reduction of WIP through process improvement
AdministrationOperationsSpeeding up billing
• Contract analysis, e.g. billing conditions (required documentation), flat-rate billing, payment terms
• Billing quality
Measures:
• Increased bundling leads to better negotiation position, e.g. payment terms
• Rejection Rate / quality in the control of invoices
Supported by increased cash focus in 2017 incentive system
58
74
Bilfinger SE | Capital Markets Day | February 14, 2017 page 77

Measures to reduce the time between service complet ion and customer acceptance offer significant self help pot ential
1 | Procurement 2 | Goods and Services 3 | Invoicing 4 | Receipt of Payment
Supplier / Subcontractor• Liability
Working Capital
[DPO] [DSO]
Internal Resources• Inventory• Work in Progress
Client• Receivables
CashCollection
WIP Receivables Overdue
• ~20% of DSOs*• Customer has to
accept service before billing process can be initiated
• ~65% of DSOs• Improvement of
payment terms rather difficult with blue chip customers
• ~15% of DSOs• Esp. regional
differencesFast and comprehensive documentation of rendered services to get customer acceptance earlier
*WIP minus prepayments receivedBilfinger SE | Capital Markets Day | February 14, 2017 page 78
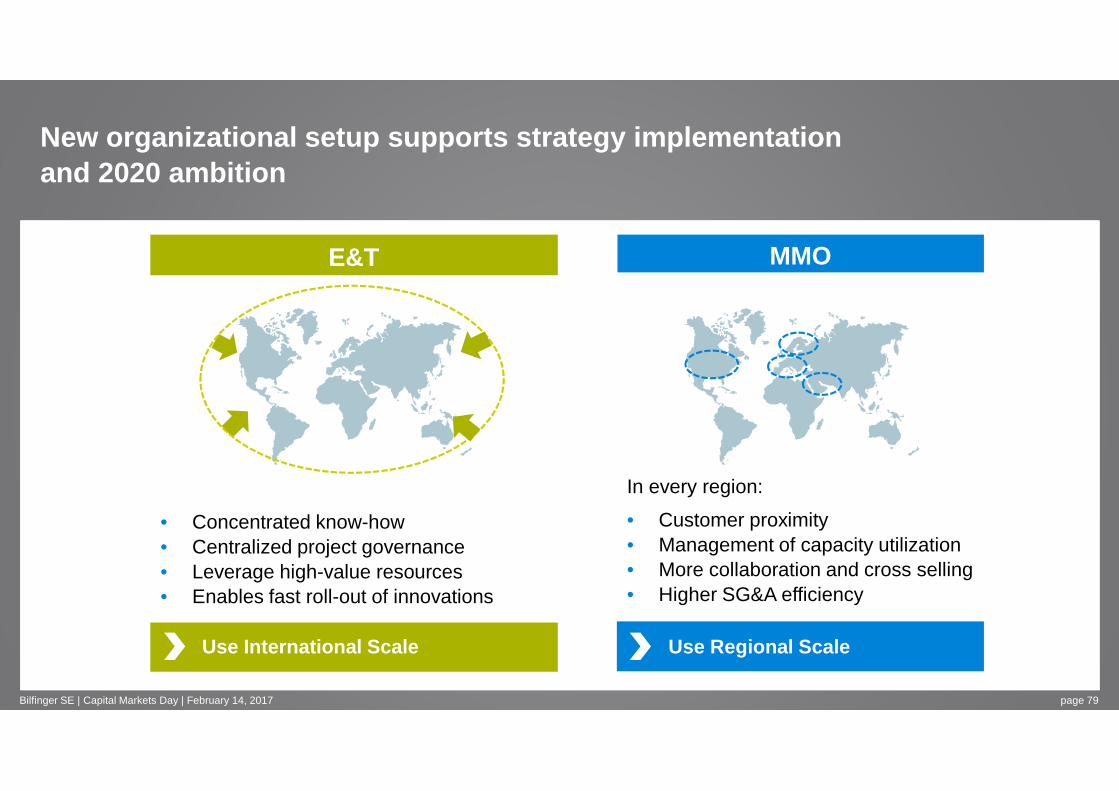
New organizational setup supports strategy implemen tation and 2020 ambition
• Concentrated know-how• Centralized project governance• Leverage high-value resources• Enables fast roll-out of innovations
In every region:
• Customer proximity• Management of capacity utilization• More collaboration and cross selling• Higher SG&A efficiency
E&T MMO
Use International Scale Use Regional Scale
Bilfinger SE | Capital Markets Day | February 14, 2017 page 79

How this translates into E&T segment performance
in € million FY 2016 Going forward
Orders received 1,219 2017: Stabilization of orders
Output volume 1,246
2017: Output volume decrease expectedCAGR 2018-2020 above Group averageImportant growth areas: North America
France, U.K. (Nuclear)New customers in Pharma & Bio-Pharma
Adj. EBITA-margin -2.4%2017: positive EBITA adjustedEntering blended margin range towards the end of the planning period
Organization Focus on implementation of new organization and on improvement in project management
Bilfinger SE | Capital Markets Day | February 14, 2017 page 80

How this translates into MMO segment performance
in € million FY 2016 Going forward
Orders received 2,422 2017: Positive trend in orders
Output volume 2,461
2017: Slight output volume decreaseCAGR 2018-2020 below Group averageImportant growth areas: North America (Chemicals & Petrochem.)
Middle East
Adj. EBITA-margin 4.9%2017: Decline in EBITA-margin2018ff: Margin improvement towards upper end of blended margin range
Organization Impact of new organization also a cost benefit
Bilfinger SE | Capital Markets Day | February 14, 2017 page 81

Other Operations includes accretive businesses with significant valueAiming for disposal in the longer run
• Dilutive business with 13 entities to be sold or liquidated within 18 months• 1 already sold• 3 entities currently with signed SPA and final closing shortly expected• Negative cash-effect and capital loss when selling (~30 million €)
• Five entities individually managed for value while selectively leveraging on Group resources and capabilities
• Profitable business with improvement potential • Clear exit strategy within next 5 years• Management will be incentivized on value created• Monthly reviews to track successful implementation of individual value
creation plans
109
148
615
386
consolidation
sold in 2016
-28
dilutive
2016 Output Volume
accretive
Bilfinger SE | Capital Markets Day | February 14, 2017 page 82

Will receive 49% of sales proceeds (after repayment of debt) at exit
Typical money multiple of owner would lead to a sig nificant value upside
Benefit from 49% of the value creation at Apleona
Vendor‘s Note: €100m, 10% interest p.a. upon maturity
Preferred participation note (PPN):
• No management involvement
• Certain information rights, some further rights
• Investment: €195m
• If value develops positively, P&L neutral appreciation
Bilfinger SE | Capital Markets Day | February 14, 2017 page 83

Additional efficiency measures needed to reach ambition 2 020 leading to slightly higher special items
50
145
80
6050
50
135Restructuring
and SG&A efficiency
IT investments
Compliance
Warranties related to sale of Building
and Facility
285
Future payout from
special items
2019ff2017 2018• Management keeps focus on all cash items
• This is supported by incentive system
90
5025
40
50
75
165
0Future P&L effect from
special items
2019ff2017 2018
In € million Dec. 31, 2016
Cash and cash equivalents 1,032
Financial debt -522
Net cash 510
Pension provisions -304
Expected cash-out disposals Approx. -30
Financial assets (Apleona, JBN) 320
Future cash-out special items Approx. -285
Intra-year working capital swing Approx. -100
Valuation net cash Approx. 100
Bilfinger SE | Capital Markets Day | February 14, 2017 page 84

Company program B TOP will ensure execution and drivethe implementation of a high performance culture
• clear responsibilities• monthly implementation tracking
• operationalize financial targets• benchmark key improvement levers
• stick to ambitious goals• cultural change+ +
High performance culture
Actual 2016
Productivity Measures
Price, Inflation
Target 2020
1st idea, savings targetdefinition
MD1 MD2 MD3 MD4 MD5
Measure Implementation Progress by Maturity Degree
Target Matrix
Net PL Target Net PL Target Net PL Target Net PL Target
Org Unit PL Responsible
steady state impact 2018[EUR]
steady state impact 2018[EUR]
[%] Fullfillment
steady state impact 2018[EUR]
Impact 2017[EUR]
[%] Fullfillment
steady state impact 2018[EUR]
Impact 2017[EUR]
[%] Fullfillment
steady state impact 2018[EUR]
Impact 2017[EUR]
[%] Fullfillment
Region 1 Name 1 0 0 0% 0 0% 0 0% 0 0%Region 2 Name 2 0 0 0% 0 0% 0 0% 0 0%Region 3 Name 3 0 0 0% 0 0% 0 0% 0 0%Region 4 Name 4 0 0 0% 0 0% 0 0% 0 0%Cross Name 5 0 0 0% 0 0% 0 0% 0 0%HQ Name 6 0 0 0% 0 0% 0 0% 0 0%TOTAL -
MD2-MD5TOTAL
MD2-MD5 MD2-MD5 MD2-MD5Measure Type A Measure Type B Measure Type C
SG&A
Wave 1
Profit Transition
Organic growthHigh value servicesOperational excellenceOPEX reduction
Closed Loop
define measures, track implementation
ensure P&L impact
�� �
�
�
�
implementationconcept, business plan
implementationstarted
actionscomplete Wave 2
Integrated approach forcontinuous improvement
set clear and ambitious targets
First (P&L-) effects andsteady state
Transforming Operational Performance
Bilfinger SE | Capital Markets Day | February 14, 2017 page 85

comprehensive transformation program for profitable growth through cultural change
Implementation of B TOP requires substantial initia l efforts but creates a sustainable productivity engine
FY 2017 FY 2018 FY 2019 FY 2020
Program rollout
IT tool implementation1)
Measure tracking
Training in the field
Conceptual work
productivity wheel in full swing[steady state]
review and optimize IT tool[ramp up]
B TOP
pre-tool tool-based
concept & IT tool[rollout]
100%
high performance cultureimplementation degree
high performance culture implementation effort
Bilfinger SE | Capital Markets Day | February 14, 2017 page 86

FY 2017 will be the year of stabilization
Starting Point Outlook 2)
in € million FY 2016 expected FY 2017
Orders received 4,056 Organic increase
Output volume 4,219 Mid-to-high single-digit organic decline
Adjusted EBITA / EBITA margin
15 / 0.4%Continued improvementMargin increase ~100bps
Dividend proposal 1) €0(paid for FY 2015)
€1.00(paid for FY 2016)
Bilfinger SE | Capital Markets Day | February 14, 2017 page 87
1) subject to a corresponding resolution by the competent boards 2) Assumption: on a comparable F/X basis

Intention to resume dividend payment and execute Sh are Buyback program while targeting investment grade mid- to lo ng-term
• Consideration of synergetic M&A begins with the initiation of phase II of the strategy• EBITA accretive one year after integration, ROCE beats WACC two years after integration• Immediate start of comprehensive integration
M&A Criteria
• Cancellation of current treasury shares (4%) minus shares to be retained for employee share programs• Executive Board will propose to the Supervisory Board to request shareholders approval for a new 10%
share buyback authorization• Executive Board intends to propose to the Supervisory Board a share buyback program of up to €150m
to be executed in FY 2017 and 2018
Intended Share
BuybackProgram*
• In 2017 for FY 2016: €1.00• Forward floor of €1.00• Sustainable dividend stream going forward: 40 to 60% of adjusted net profit
Intended DividendPolicy*
• Ambition: (mid-term perspective) Investment GradeFinancial
Policy
* Based on current expectations andexecution of presented strategy as well as on economic outlook at the time. Subject to necessary approvals by supervisory Board and AGM
Bilfinger SE | Capital Markets Day | February 14, 2017 page 88

• Top line growth resumed• First successes in new growth areas• New organization in full swing• Consistent project management
process established• Net Profit break-even • Adj. FCF positive latest in FY 2018• Share buyback completed• Successfully refinanced
• Process and System harmonization fully rolled out
• Performance culture established
• Productivity wheel in full swing• Complexity significantly
reduced
Financial ambition reached
• Strategy defined• Organization announced • Execution master plan • Top Management Team• Dividend proposed• B TOP rolled out• LOA Process rolled out• SAP roll-ins commenced • CRM implementation started• Cash focus in
incentive system increased• Operating performance improved
Ambition 2020 will be reached in three phases with clear milestones
Time
Value
Stabilization Build up Build out
Bilfinger SE | Capital Markets Day | February 14, 2017 page 89
��
��
�

Wrap-up

Bilfinger 2020Financial ambition
page 91
• Positive adj. FCF at the latest from 2018 onwards
• Over the cycle, from 2018 onwards: Cash Conversion Rate ~ 1 (minus growth adjustment)1
>5% CAGRbased on FY 2017
Post-tax ROCE2 reported :
8 to 10%
Investment Grade (mid-term perspective)
Sustainable dividend stream going forwardPolicy: 40 to 60% of adjusted net profit
• EBITA adjusted ~5%• Gross margin
improvement by ~200bps• SG&A ratio reduction by
~300bps
2 Capital Employed w/o PPN
Organic Growth Profit Cash Return
Capital Structure
Dividend Policy
Bilfinger SE | Capital Markets Day | February 14, 2017
1 Cash Conversion Definition: (Adj. EBITA + Depreciation –Change NWC - Net CAPEX) / Adj. EBITA

Bilfinger 2020Back to profitable growth
page 92Bilfinger SE | Capital Markets Day | February 14, 2017
We know what we are
• Bilfinger: Exceptional profile, deep expertise,long-standing customer relationships
• Market: Increasing demand, unrealized opportunities, many growth levers
• 2 Service Lines, 4 Regions, 6 Industries
• 3 Phases: Stabilization – Build up – Build out
• Bilfinger 2020: CAGR: >5 %EBITA (adjusted): ~5%
• Sustainable dividend stream going forward
We know what to do
We know where we are heading

Bilfinger SE | Capital Markets Day | February 14, 2017 page 93