big data to knowledge harnessing semiotic relationships of...
TRANSCRIPT
This is the preprint of an article accepted for publication in Journal of Information Science. Huang H. (in press 2017).
Big data to knowledge- harnessing semiotic relationships of data quality and skills in genome curation work. Journal
of Information Science.
Corresponding author:
Hong Huang, School of Information, University of South Florida, Tampa, Florida, 33620, USA.
E-mail: [email protected]
Big Data to Knowledge—Harnessing Semiotic Relationships
of Data Quality and Skills in Genome Curation Work
Hong Huang School of Information, University of South Florida, USA.
Abstract
This article aims to understand the views of genomics scientists with regard to the data quality assurances associated with semiotics
and Data-Information-Knowledge (DIK). The resulting communication of signs generated from genomic curation work, was found
within different semantic levels of DIK that correlate specific data quality dimensions with their respective skills. Syntactic DQ
dimensions were ranked the highest among all other semiotic data quality dimensions, which indicated that scientists spend great
efforts for handling data wrangling activities in genome curation work. Semantic and pragmatic related sign communications were
about meaningful interpretation, thus required additional adaptive and interpretative skills to deal with data quality issues. This
expanded concept of ‘curation’ as sign/semiotic was not previously explored from the practical to the theoretical perspectives. The
findings inform policy makers and practitioners to develop framework and cyberinfrastructure that facilitate the initiatives and
advocacies of ‘Big Data to Knowledge’ by funding agencies. The findings from this study can also help plan data quality assurance
policies and thus maximize the efficiency of genomic data management. Our results give strong support to the relevance of data
quality skills communication in relation to data quality assurance in genome curation activities.
Keywords
Semiotics; Data Quality; DIK hierarchy; Genome Curation
1. Introduction
As genome-level datasets increasingly accumulate, scientists are required to interpret and curate the genetic coding of
genome sequences comprehensively with the newly results generated, i.e., gene expression, translated proteins, and
environmental interactions, etc. The flow of information typically transfers from raw data (a collection of symbols
representative of genetic codes) to pre-interpreted information. The data curation process is involved with the
digitization and integration of disparate pieces of genomic data and with new attachments of information or knowledge
from literatures [1]. Semiotics is the study of signs and symbols, their interpretation and use [2,3]. Semiotics also is a
‘scientific attitude, a critical way of looking at the objects of other sciences’[4]. Semiotic analysis and/or sign practice
have been applied in other fields such as linguistics[5,6], communication[7], business[8,9], and genetics[10].
Similarly, genomic information is a special kind of communicable signs that can be used in communication to produce
and exchange biological or clinical meanings. The processes in genomic curation work may further benefit from the
analysis of sign communications.
Although advanced, yet affordable genome-sequencing techniques have revolutionized how genomic data and
information is managed, it requires effective means by which to process, interpret, and reuse the data. As genomic data
and the information produced from the curatorial process often generates diverse data forms with various meanings;
these varieties of curated data are likewise also occurred in different levels of semiotics and DIK hierarchy.
Genomic sequences and their genetic codes are stored as Deoxyribonucleic acid (DNA) or Ribonucleic acid (RNA)
sequences that form the basic building blocks of genetic coding [11]. The genome curation process, as shown in the
central-dogma theory, indicates that genetic data codes were copied, transcribed as RNA, and finally translated to
protein [12]. Genomic data handling in semiotic levels (i.e. empirics, syntactics, semantics, and pragmatics) can be
correlated to specific data quality (DQ) requirements. Each semiotic level then addresses specific data quality and
communication issues. However, when sorting out the patterns of massive genomic data in their respective semiotic
Huang 2
levels, it is further complicated as one attempts to ascertain how the data is transferred between semiotic levels during
the curation process (if it did so properly). Additionally, researchers will need to determine in which semiotic level
data quality skills will be represented in relation to data quality and the issues associated with them. Currently, there is
no such research being conducted to understand the relationships between data quality dimensions and skills, as well as
genomic data in relation to the semiotic levels that represent them. Therefore, this study attempts to understand the
relationships identified between data quality dimensions and skills at differing semiotic levels.
This study sought to understand how genomic scientists perceived the semiotic relationship between that of DQ
dimensions and their respective skills. Specifically, the study investigated the following two research questions:
RQ1: How do genomics scientists rank the DQ dimensions in different semiotic levels in genomic curation? This
question is explored through comparing survey rankings of DQ dimensions in different semiotic levels in genome
curation.
RQ2: How do genomics scientists correlate the semiotic related DQ dimensions with DQ skills in genomic
curation? This question is investigated by analysing the correlation of the survey rankings DQ of dimensions and DQ
skills in different semiotic levels in genome curation.
2. Literature review
This following part of the paper reviews the discussion and relationships of semiotics, data quality and knowledge
hierarchy, then proceeds to describe recent research about the data quality dimensions in different semiotic levels.
2.1. Semiotics, Data Quality, and Knowledge Hierarchy
Semiotics is the study of signs in social life and it has various applications in other fields, such as information science,
linguistics, communication, knowledge organization, as well as molecular biology [5,7,10,13-19]. A sign is referred as
‘something, with established social convention, standing for something else’, and it is possibly interpreted by a
‘possible interpreter’[7]. Signs and meanings only exist with a ‘codemaker’ and in a ‘codemaking process’ [10].
Likewise, genetic codes are ‘codemaker-dependent entities’ that require interpretation and annotation by scientists and
professional specialists [10].
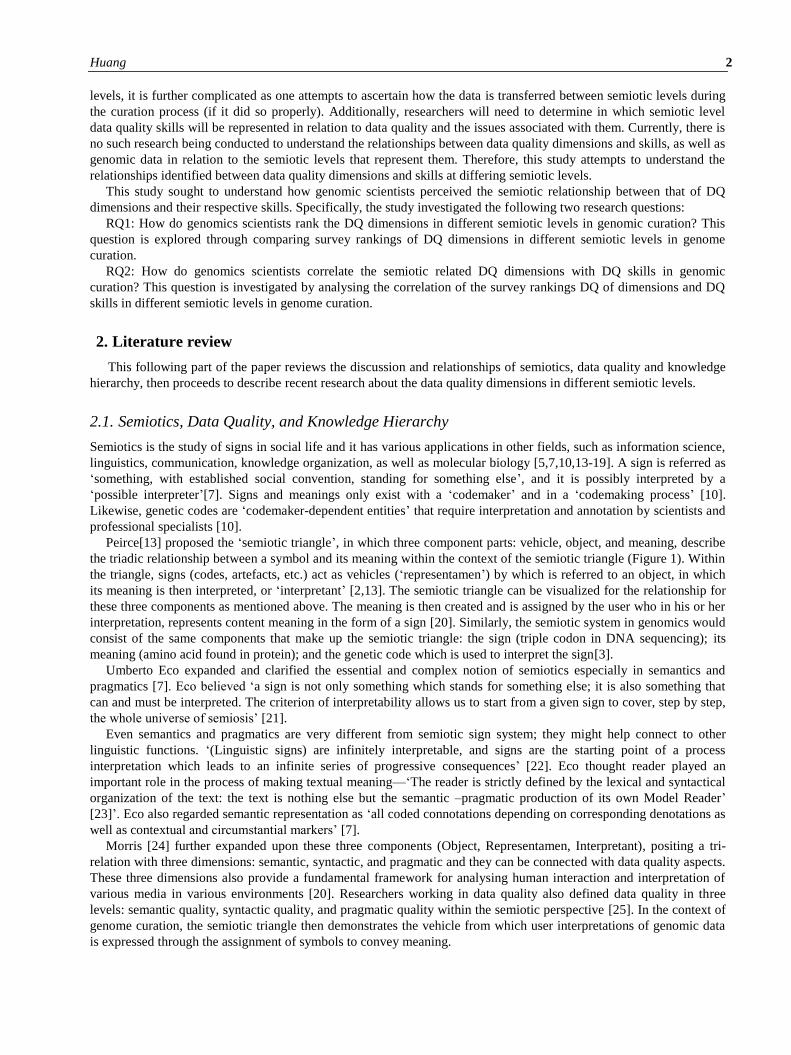
Peirce[13] proposed the ‘semiotic triangle’, in which three component parts: vehicle, object, and meaning, describe
the triadic relationship between a symbol and its meaning within the context of the semiotic triangle (Figure 1). Within
the triangle, signs (codes, artefacts, etc.) act as vehicles (‘representamen’) by which is referred to an object, in which
its meaning is then interpreted, or ‘interpretant’ [2,13]. The semiotic triangle can be visualized for the relationship for
these three components as mentioned above. The meaning is then created and is assigned by the user who in his or her
interpretation, represents content meaning in the form of a sign [20]. Similarly, the semiotic system in genomics would
consist of the same components that make up the semiotic triangle: the sign (triple codon in DNA sequencing); its
meaning (amino acid found in protein); and the genetic code which is used to interpret the sign[3].
Umberto Eco expanded and clarified the essential and complex notion of semiotics especially in semantics and
pragmatics [7]. Eco believed ‘a sign is not only something which stands for something else; it is also something that
can and must be interpreted. The criterion of interpretability allows us to start from a given sign to cover, step by step,
the whole universe of semiosis’ [21].
Even semantics and pragmatics are very different from semiotic sign system; they might help connect to other
linguistic functions. ‘(Linguistic signs) are infinitely interpretable, and signs are the starting point of a process
interpretation which leads to an infinite series of progressive consequences’ [22]. Eco thought reader played an
important role in the process of making textual meaning—‘The reader is strictly defined by the lexical and syntactical
organization of the text: the text is nothing else but the semantic –pragmatic production of its own Model Reader’
[23]’. Eco also regarded semantic representation as ‘all coded connotations depending on corresponding denotations as
well as contextual and circumstantial markers’ [7].
Morris [24] further expanded upon these three components (Object, Representamen, Interpretant), positing a tri-
relation with three dimensions: semantic, syntactic, and pragmatic and they can be connected with data quality aspects.
These three dimensions also provide a fundamental framework for analysing human interaction and interpretation of
various media in various environments [20]. Researchers working in data quality also defined data quality in three
levels: semantic quality, syntactic quality, and pragmatic quality within the semiotic perspective [25]. In the context of
genome curation, the semiotic triangle then demonstrates the vehicle from which user interpretations of genomic data
is expressed through the assignment of symbols to convey meaning.
Huang 3
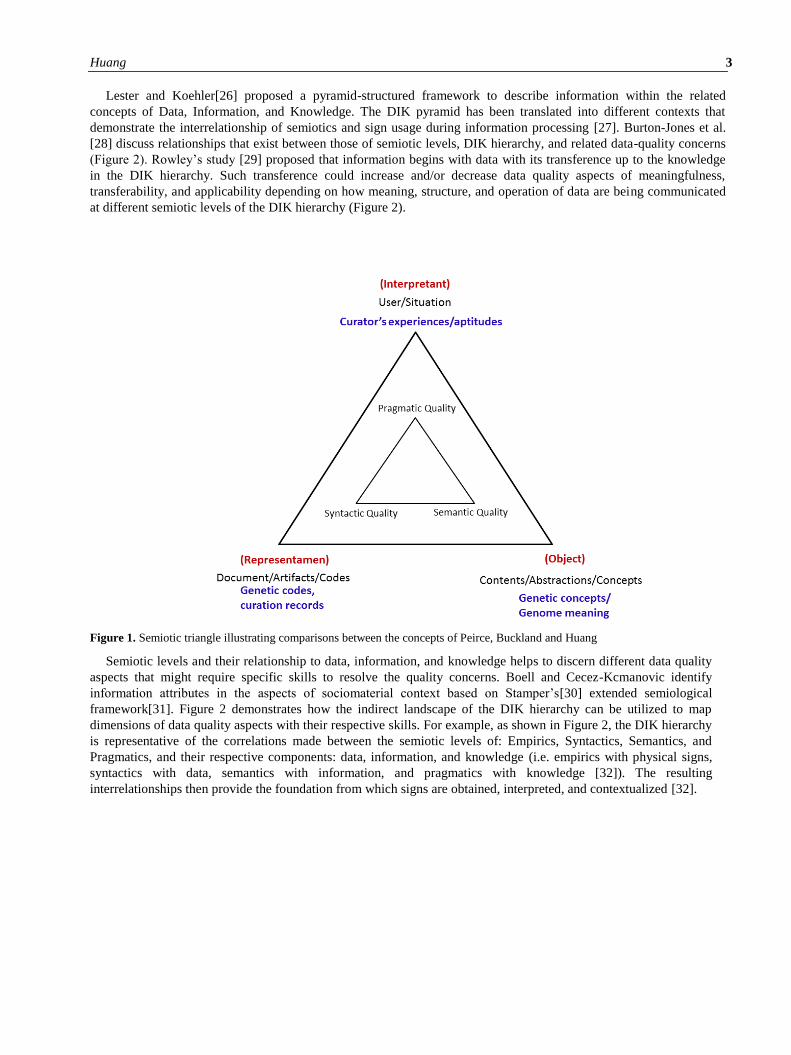
Lester and Koehler[26] proposed a pyramid-structured framework to describe information within the related
concepts of Data, Information, and Knowledge. The DIK pyramid has been translated into different contexts that
demonstrate the interrelationship of semiotics and sign usage during information processing [27]. Burton-Jones et al.
[28] discuss relationships that exist between those of semiotic levels, DIK hierarchy, and related data-quality concerns
(Figure 2). Rowley’s study [29] proposed that information begins with data with its transference up to the knowledge
in the DIK hierarchy. Such transference could increase and/or decrease data quality aspects of meaningfulness,
transferability, and applicability depending on how meaning, structure, and operation of data are being communicated
at different semiotic levels of the DIK hierarchy (Figure 2).
Figure 1. Semiotic triangle illustrating comparisons between the concepts of Peirce, Buckland and Huang
Semiotic levels and their relationship to data, information, and knowledge helps to discern different data quality
aspects that might require specific skills to resolve the quality concerns. Boell and Cecez-Kcmanovic identify
information attributes in the aspects of sociomaterial context based on Stamper’s[30] extended semiological
framework[31]. Figure 2 demonstrates how the indirect landscape of the DIK hierarchy can be utilized to map
dimensions of data quality aspects with their respective skills. For example, as shown in Figure 2, the DIK hierarchy
is representative of the correlations made between the semiotic levels of: Empirics, Syntactics, Semantics, and
Pragmatics, and their respective components: data, information, and knowledge (i.e. empirics with physical signs,
syntactics with data, semantics with information, and pragmatics with knowledge [32]). The resulting
interrelationships then provide the foundation from which signs are obtained, interpreted, and contextualized [32].
Huang 4
Figure 2. Semiotics levels and DIK hierarchy, adapted from Rowley and Burton-Jones.
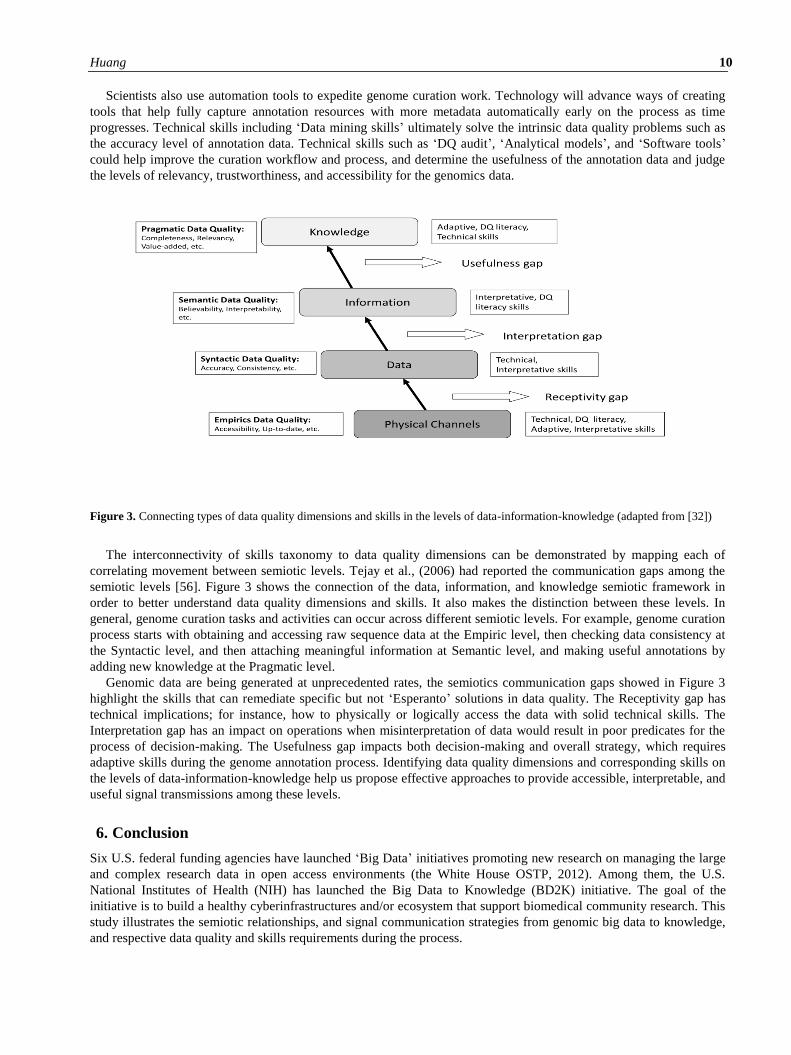
However, Tejay, Dhillon, and Chin [32] identified three communication gaps that occur during sign transference
within different semiotic levels in the DIK hierarchy. A Receptivity gap occurs between the empiric and syntactic
levels when signals are difficult to access through physical channels. An Interpretation gap shows between data and
information as a result of insufficient meaning of data. And a Usefulness gap takes place when information is
represented improperly within a particular context as knowledge [32]. Therefore, there might have different data
quality issues that required respective skills to reduce the existed gaps between each semiotic level.
2.2. Semiotics Levels and Data Quality Dimensions
With regard to data quality dimension improvement, Lindland, Sindre, and Solvberg [33] proposed a conceptual model
using semiotic levels to identify the means by which to achieve quality improvement goals. Burton-Jones et al.
(2005)[28] developed a set of metrics drawing upon semiotic theory for ontology auditing. Other studies employed the
use of data quality categories derived from semiotic levels. In one such study by Price and Shanks [34], using semiotic
theory with subjective and objective data quality views, applied integrity rules of conforming structural data or
metadata to classify data quality dimensions. Semantic DQ dimensions were grouped according to ‘external
correspondence of referent,’ and Pragmatic DQ dimensions were based on user perspective [34]. Whereas Tejay,
Dhillon, and Chin [32] used semiotic theory to analyse DQ dimensions by connecting the levels of the Information
Pyramid with the levels of DQ dimensions [26].
Data quality dimensions determine related aspects of accuracy and/or consistency [1,35]. The taxonomies of these
dimensions were found to exist within varying contextualized environments such as that of the information system
management [35], the online community [36], and genome curation[1]. As seen in Table 1, the literature list
demonstrates found relationships between semiotic taxonomies and their respective data quality dimensions. For
example, the Empirics level focuses on establishing means of communication and data access [32], while data quality
issues focus on different data types being generated and their risk of being transmitted erroneously. Data quality
dimensions operating at the Empirics level include accessibility, up-to-date, and security [32].
Syntactics, however, focus on forms and structures of data or more specifically, the physical form rather than its
content. Data quality dimensions operating at the Syntactics level include Accuracy [37], Completeness [38],
Consistency [39], Concise presentation, and Unbiased [40]. Data quality dimensions operating at Semantics level are
associated with information rather than data [34] since the Semantics level focuses on meaning; more specifically, the
interpretation of data that conveys meaning. Data quality dimensions operating at the Semantics level include
believability, interpretability, and understandability [28,32]. The same for credibility since it is regarded as an
associative characteristic of meaning and believability strives to capture this issue [41].
Huang 5
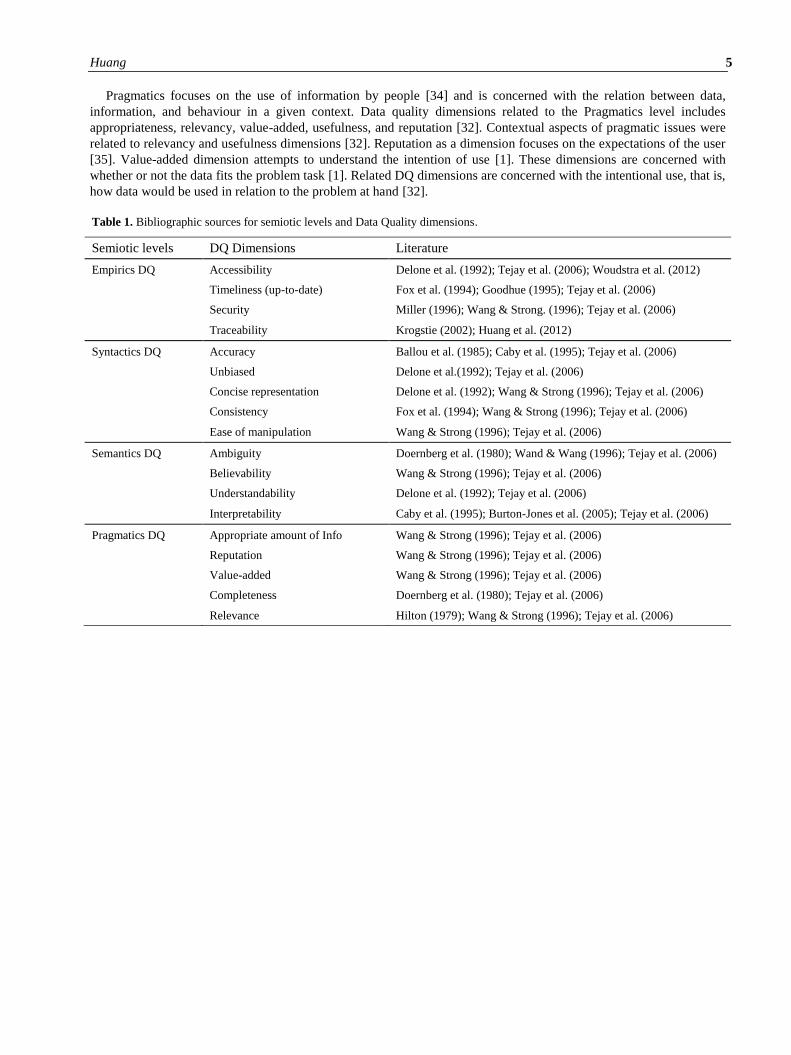
Pragmatics focuses on the use of information by people [34] and is concerned with the relation between data,
information, and behaviour in a given context. Data quality dimensions related to the Pragmatics level includes
appropriateness, relevancy, value-added, usefulness, and reputation [32]. Contextual aspects of pragmatic issues were
related to relevancy and usefulness dimensions [32]. Reputation as a dimension focuses on the expectations of the user
[35]. Value-added dimension attempts to understand the intention of use [1]. These dimensions are concerned with
whether or not the data fits the problem task [1]. Related DQ dimensions are concerned with the intentional use, that is,
how data would be used in relation to the problem at hand [32].
Table 1. Bibliographic sources for semiotic levels and Data Quality dimensions.
Semiotic levels DQ Dimensions Literature
Empirics DQ Accessibility Delone et al. (1992); Tejay et al. (2006); Woudstra et al. (2012)
Timeliness (up-to-date) Fox et al. (1994); Goodhue (1995); Tejay et al. (2006)
Security Miller (1996); Wang & Strong. (1996); Tejay et al. (2006)
Traceability Krogstie (2002); Huang et al. (2012)
Syntactics DQ Accuracy Ballou et al. (1985); Caby et al. (1995); Tejay et al. (2006)
Unbiased Delone et al.(1992); Tejay et al. (2006)
Concise representation Delone et al. (1992); Wang & Strong (1996); Tejay et al. (2006)
Consistency Fox et al. (1994); Wang & Strong (1996); Tejay et al. (2006)
Ease of manipulation Wang & Strong (1996); Tejay et al. (2006)
Semantics DQ Ambiguity Doernberg et al. (1980); Wand & Wang (1996); Tejay et al. (2006)
Believability Wang & Strong (1996); Tejay et al. (2006)
Understandability Delone et al. (1992); Tejay et al. (2006)
Interpretability Caby et al. (1995); Burton-Jones et al. (2005); Tejay et al. (2006)
Pragmatics DQ Appropriate amount of Info Wang & Strong (1996); Tejay et al. (2006)
Reputation Wang & Strong (1996); Tejay et al. (2006)
Value-added Wang & Strong (1996); Tejay et al. (2006)
Completeness Doernberg et al. (1980); Tejay et al. (2006)
Relevance Hilton (1979); Wang & Strong (1996); Tejay et al. (2006)
Huang 6
2.3. Semiotics, Data Quality Issues in Genome Curation
Semiotics is the study of signs and symbols and has traditionally been used to understand system analysis [14], and
data modelling [42]. Semiotics analysis has also been used in biological domains[43]. Data structure for genome
curation moves from locating gene regions in the sequences to attaching diverse literatures and interpretations of gene
networks and their interactions [44]. For example, according to the genetic coding rules [43], triplet codons on DNA
and mRNA that constitute a semiotic role in the specification of amino acids in proteins. Data curators will create
textual records with various textual expression and textual content following the coding of on genomic data. As such,
coding elements (signs) were identified and translated from genetic codes to functional annotation units, such as
images, text, and clips.
Genome curation is a process of information abstraction; it can be seen as a quite concrete progression from
codes to concepts to user experience. Curating the massive amount of genomic data is intricate, and it required
comprehensive user experiences to make meaningful curation in the level of data, information and knowledge. Data
and its associated software/infrastructure are regarded as integral parts of the research data management [45]. The
quality of these parts, and required skills should therefore be considered at the same time [46]. Data quality skills have
been surveyed in several studies, and can be literacy, adaptive, technical and interpretive related [47], dealing with
syntactics, semantic, and pragmatic relative data quality problems. Curation activities most often require specific data
quality skills to manage potential issues that arise within given semiotic levels during the curation process.
3. Method
Semiotics-based DQ dimensions were classified based on the bibliographic literature [32,34], shown in Figure 1, for
which the classification will be refined with the consideration of the taxonomy of data quality dimensions and skills in
genome curation [1]. Survey participants consisted of 149 genomics scientists who had published journal articles
related to genome annotation, curation methods, and research (number of emails reaching out: n=240 with a response
rate: 62%). Each participant was provided with two scenarios that utilized scenario-based task analysis [1,48-50]. Both
scenarios represented and conceptualized genome curation activities, providing the same set of written requirements
for genome curation that can be used to understand user perception. As designed, the survey provided participants with
two scenarios with similar genome curation tasks, but with different questions with regard to DQ dimensions and/or
skills.
The first scenario asked participants, using the Likert scale (1=least important -7= most important), to rate the top
five out of a total of 17 DQ dimensions. Similarly, the second scenario, again using the Likert scale, asked participants
to rate the top five out of a total of 17 DQ Skills. Within each of the four semiotic levels (Empiric, Syntactic, Semantic,
and Pragmatic), the resulting top five DQ dimensions were added of which under each semiotic level was then
summed, averaged and sorted. In order to identify the correlations that existed between DQ dimensions and DQ skills,
the Pearson Correlation was used to compute each DQ dimension and each DQ skill (see Appendix 1). The DQ
dimensions were grouped based on their semiotic types as empirics, syntactics, semantics, and pragmatics showed in
Table 1. The DQ skills were categorized as Technical, Interpretative, Adaptive, and DQ literacy skills reported in
previous study [1]. The correlations between the groupings of DQ dimensions and skills were determined based on
number of significant correlations between DQ dimensions and skills (see Appendix 1). Descriptive statistics, ranking
statistics, and correlation analysis were computed using the SPSS (version 12) program.
4. Findings
Based on the literature [1,32,34], seventeen DQ dimensions were grouped in each of the four semiotic levels (Empirics,
Syntactics, Semantics, and Pragmatics). Empirics type DQ dimensions focus on how to manage genomic data. Thus,
DQ dimensions are related to those items which determine accessibility and formatting of genomic data
(‘Accessibility’, and ‘Up-to-date’). However, it also indicates the need for both ‘Traceability’, and ‘Security’ of
genomic data and their respective genomic record versions (Table 1). Syntactic levels focus primarily on accuracy,
impartiality, or that of being ‘Unbiased’, and consistency in presentation, of data format or structure. Semantics levels
focus on the aspects of ‘Interpretability’, ‘Understandability’, ‘Believability,’ and ‘Ease of manipulation.’ However,
Pragmatic levels focuses on appropriateness of fit within a context of use, its relevancy, completeness, conciseness,
reputation, and whether or not it is value-added.
Huang 7
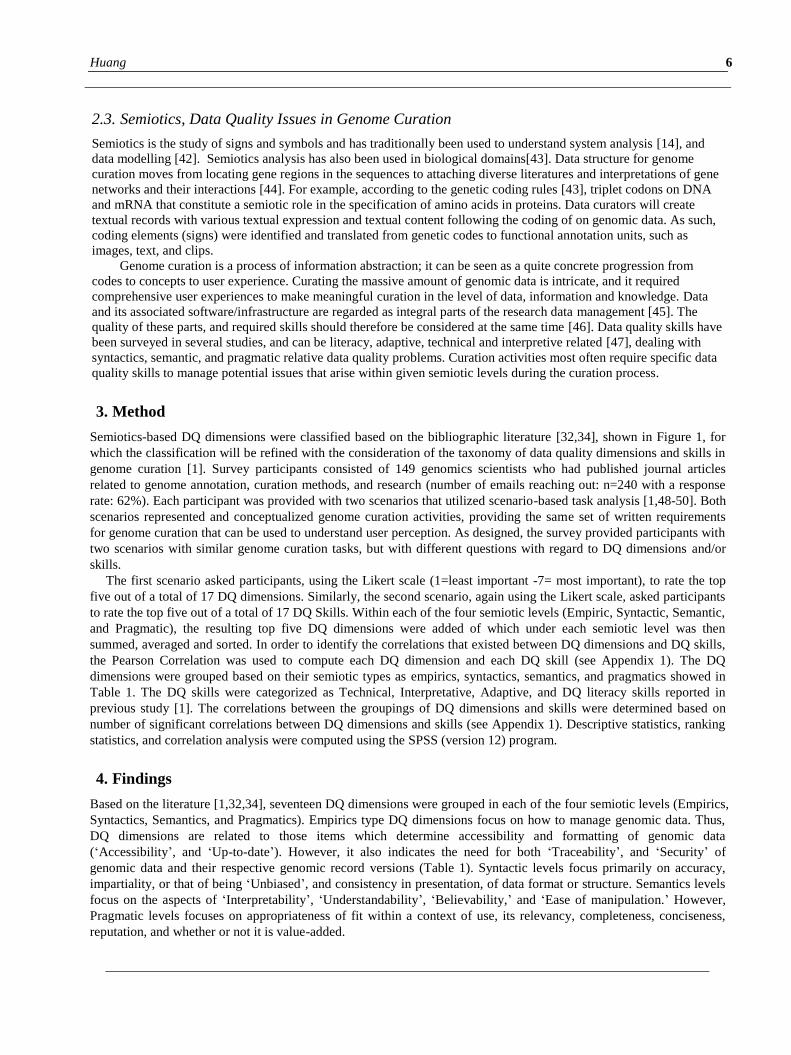
Table 2. Top 5 rankings of Semiotics related DQ dimensions.
Semiotics DQ Dimensions No. of top 5 rankings
Total Average no.
Syntactics Accuracy: Sequence records are correct and free of error 106 181 60.3
Consistent representation:Sequence records are presented in a
consistent format
42
Unbiased: Sequence records are unbiased and objective 33
Empirics Accessibility: Sequence records are easily and quickly retrievable
for access
97 195 48.8
Up-to-date: Sequence records are sufficiently up-to-date 50
Traceability: The derivation history of the sequence records is
documented and traceable
38
Security: Access to sequence records is restricted appropriately to
maintain their security
10
Semantics Believability: Sequence records are regarded as credible and
believable
55 159 39.8
Interpretability: Sequence records are in appropriate languages,
symbols, and units, and the definitions are clear for interpretation
37
Ease of manipulation: Sequence records are easy to manipulate and
make it easy to carry out various tasks
38
Understandability: Sequence records are easily understandable 29
Pragmatics Completeness: Annotated sequence records are not missing and are
fully annotated
70 165 27.5
Appropriate amount of info: The volume of the sequence records is
appropriate
43
Relevancy: Sequence records contain information relevant 15
Concise representation: Sequence records are concisely
represented
13
Value added: Sequence records contain additional annotations and
these annotations are beneficial and add value
13
Reputation: Sequence records are highly regarded and reputable in
terms of their source or content
11
Top five DQ dimensions for each group have the cell highlighted.
Table 2 shows that the top five rankings of the DQ dimensions are ‘Accuracy’ (n= 106) in Syntactics, ‘Accessibility’
(n= 97) in Empirics, ‘Completeness’ (n= 70) in Pragmatics, and ‘Believability’ (n= 55) in Semantics, as well as ‘Up-
to-date’ (n= 50) in Empirics. The ranking of the average top-five ranking for the sum in each semiotic level were
ranked from the highest to the lowest as the following: Syntactics, Empirics, Semantics, and Pragmatics.
The Pearson correlation was tested for each semiotic DQ dimension and skill. The analysis indicated that each DQ
dimension was statistically correlated with certain types of skills with the number ranged from four to seventeen. Only
one DQ dimension. ‘Unbiased,’ has all the DQ skills (shown in Table 3) significantly correlated (see Appendix 1).
‘Relevancy’, ‘Reputation’, and ‘Security’ also have correlations with almost all the DQ skills except for the skill of
‘DQ measurement’. ‘Accessibility’ has the lowest number of significant correlations with only four of out of
seventeen DQ skills (they belong to Interpretative and Literacy skills) that are significantly correlated. ‘Ease of
Manipulation’ had seven skills correlated but no Technical skills were significantly correlated. ‘Believability’ has eight
correlated DQ skills, but lacked any Adaptive skills save for ‘Organization policies’. ‘Consistent representation’ did
not correlate with any Technical skills except for ‘Statistical techniques’. Interestingly, the ‘Interpretability’ did not
have any significant correlation with technical related skills such as ‘Data mining skills’ and ‘Structure Query
Language’ (Appendix 1).
Huang 8
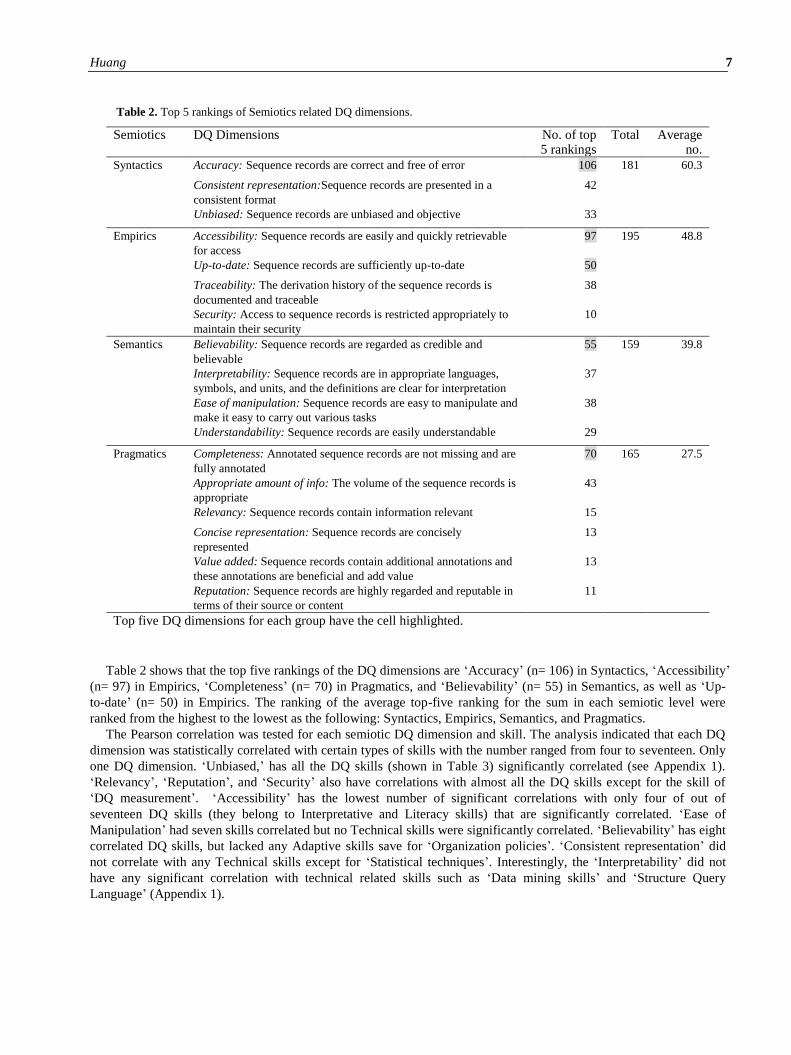
Table 3. List of DQ skills and categories adapted from [1].
DQ skill types DQ skills
Adaptive skills User requirement: Ability to translate subjective user requirements for data quality into objective
technical specification (such as use of Quality Function Deployment)
Data entry improvement: Skills and ability to analyze and improve the data entry process in order to
maintain data quality
Organization policy: Ability to establish and maintain organizational policies and rules for data quality
management
Change process: Ability to manage the change process/transitions resulting from the data quality
management project
Data quality cost/benefit: Skills and ability to conduct cost/benefit analysis of data quality management
Information overload: Understanding the information overload that managers often face and ability to
reduce information overload
Interpretative skills Data error detection: Ability to detect and correct errors in databases
Software tools: Experience and ability to use diverse commercially available data quality software
packages
DQ literacy skills DQ dimension: Quality dimensions are concepts/’virtues’ that define data quality. Data quality dimension
skills are the ability to define and describe diverse dimensions of data quality (such as relevancy,
believability, accessibility, ease of understanding)
DQ measurement: Data quality measurement is an operationalization of a data quality dimension. Data
quality measurement skills are the ability of assessing the variation along the dimension.
DQ implication: Understanding pervasiveness of data quality problems and their potential impacts
Technical skills DQ audit: Ability to conduct data quality auditing (formal review, examination, and verification of data
quality)
Statistical techniques: Ability to apply statistical techniques to manage and control data quality
Data mining skills: Data mining and knowledge discovery skills for analyzing data in a data warehouse
Data warehouse: Ability to integrate multiple databases into an integrated data warehouse
Analytical models: Ability to apply diverse analytic models (such as regression model and
multidimensional model) for data analysis
Structured Query Language (SQL): Skills and ability to apply SQL to estimate the accuracy of data
This study found several areas where DQ dimensions and their respective skills (Table 3) had no significant
correlations by survey participants, as demonstrated in Appendix 1. Among them, Literacy skills were found to not be
significantly correlated with certain data quality dimensions. ‘Concise representation’ is not related to any of DQ
literacy skills such as DQ dimension and DQ implication but all others are related. Similarly, ‘Up-to-date’ is not
related to any DQ literacy skills, and one adaptive skill: DQ cost and benefits. ‘Appropriate amount of information’ is
also not significantly related to any DQ literacy skills, and one adaptive skill: DQ cost and benefit, and one technical
skill: Data mining skill. As for ‘Value-added,’ all DQ literacy skills are not significantly correlated, either for ‘DQ cost
and benefit’ (Adaptive) or ‘Statistical techniques’ (Technical). As for ‘Accuracy’, DQ dimension and DQ implication
skills are not related, but ‘DQ measurement’ is related. Adaptive skills, such as ‘Change process’ and ‘DQ cost
benefits’, are not significantly related either. While ‘Structured Query Language’ and ‘Software tools’ are both are
Technical skills; neither have significant correlations with ‘Accuracy’.
Except for ‘DQ measurement’ (a kind of DQ literacy skill), ‘Data warehouse’ (one of technical skills), and Software
tools (one of the interpretive skills), ‘Completeness’ is related to all the remaining skills in four categories. As for
‘Understandability’, not statistical significantly correlated skills are primary technical related skills such as ‘Statistical
techniques’, ‘Data mining skills’, and ‘Structured Query Language’, as well as one adaptive skill: DQ cost and benefit.
Most of the not significantly correlated skills for ‘Traceability’ are technical: ‘DQ audit’, ‘Data mining’, ‘Analytical
models skills’, as well as Adaptive skills such as ‘DQ cost benefit’, ‘User requirement’, and ‘Data entry improvement’.
For each grouping level of semiotics related DQ dimensions and skills, the proportion of significant pairs of
correlation for DQ dimension and skill could be different. Relationships between DQ dimensions and skills groups can
be classified as ‘weak’, ‘general’, and ‘strong’ based on the proportion of significant pairs (Table 4). DQ literacy skills
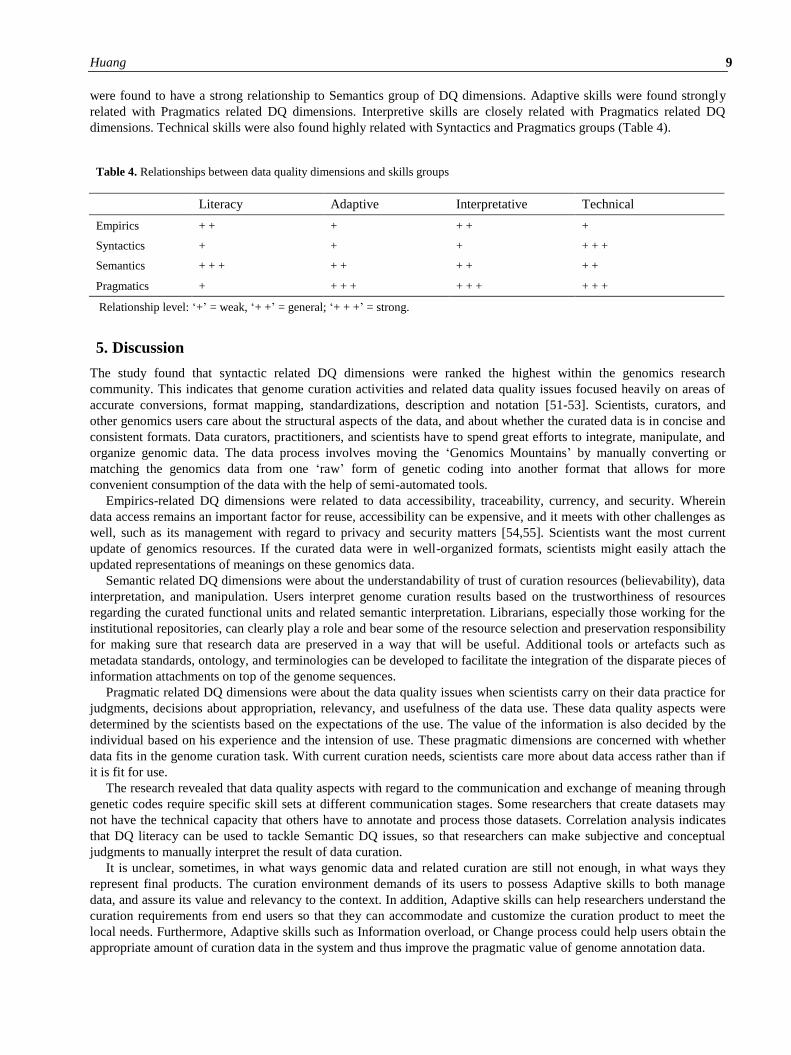
Huang 9
were found to have a strong relationship to Semantics group of DQ dimensions. Adaptive skills were found strongly
related with Pragmatics related DQ dimensions. Interpretive skills are closely related with Pragmatics related DQ
dimensions. Technical skills were also found highly related with Syntactics and Pragmatics groups (Table 4).
Table 4. Relationships between data quality dimensions and skills groups
Literacy Adaptive Interpretative Technical
Empirics + + + + + +
Syntactics + + + + + +
Semantics + + + + + + + + +
Pragmatics + + + + + + + + + +
Relationship level: ‘+’ = weak, ‘+ +’ = general; ‘+ + +’ = strong.
5. Discussion
The study found that syntactic related DQ dimensions were ranked the highest within the genomics research
community. This indicates that genome curation activities and related data quality issues focused heavily on areas of
accurate conversions, format mapping, standardizations, description and notation [51-53]. Scientists, curators, and
other genomics users care about the structural aspects of the data, and about whether the curated data is in concise and
consistent formats. Data curators, practitioners, and scientists have to spend great efforts to integrate, manipulate, and
organize genomic data. The data process involves moving the ‘Genomics Mountains’ by manually converting or
matching the genomics data from one ‘raw’ form of genetic coding into another format that allows for more
convenient consumption of the data with the help of semi-automated tools.
Empirics-related DQ dimensions were related to data accessibility, traceability, currency, and security. Wherein
data access remains an important factor for reuse, accessibility can be expensive, and it meets with other challenges as
well, such as its management with regard to privacy and security matters [54,55]. Scientists want the most current
update of genomics resources. If the curated data were in well-organized formats, scientists might easily attach the
updated representations of meanings on these genomics data.
Semantic related DQ dimensions were about the understandability of trust of curation resources (believability), data
interpretation, and manipulation. Users interpret genome curation results based on the trustworthiness of resources
regarding the curated functional units and related semantic interpretation. Librarians, especially those working for the
institutional repositories, can clearly play a role and bear some of the resource selection and preservation responsibility
for making sure that research data are preserved in a way that will be useful. Additional tools or artefacts such as
metadata standards, ontology, and terminologies can be developed to facilitate the integration of the disparate pieces of
information attachments on top of the genome sequences.
Pragmatic related DQ dimensions were about the data quality issues when scientists carry on their data practice for
judgments, decisions about appropriation, relevancy, and usefulness of the data use. These data quality aspects were
determined by the scientists based on the expectations of the use. The value of the information is also decided by the
individual based on his experience and the intension of use. These pragmatic dimensions are concerned with whether
data fits in the genome curation task. With current curation needs, scientists care more about data access rather than if
it is fit for use.
The research revealed that data quality aspects with regard to the communication and exchange of meaning through
genetic codes require specific skill sets at different communication stages. Some researchers that create datasets may
not have the technical capacity that others have to annotate and process those datasets. Correlation analysis indicates
that DQ literacy can be used to tackle Semantic DQ issues, so that researchers can make subjective and conceptual
judgments to manually interpret the result of data curation.
It is unclear, sometimes, in what ways genomic data and related curation are still not enough, in what ways they
represent final products. The curation environment demands of its users to possess Adaptive skills to both manage
data, and assure its value and relevancy to the context. In addition, Adaptive skills can help researchers understand the
curation requirements from end users so that they can accommodate and customize the curation product to meet the
local needs. Furthermore, Adaptive skills such as Information overload, or Change process could help users obtain the
appropriate amount of curation data in the system and thus improve the pragmatic value of genome annotation data.
Huang 10
Scientists also use automation tools to expedite genome curation work. Technology will advance ways of creating
tools that help fully capture annotation resources with more metadata automatically early on the process as time
progresses. Technical skills including ‘Data mining skills’ ultimately solve the intrinsic data quality problems such as
the accuracy level of annotation data. Technical skills such as ‘DQ audit’, ‘Analytical models’, and ‘Software tools’
could help improve the curation workflow and process, and determine the usefulness of the annotation data and judge
the levels of relevancy, trustworthiness, and accessibility for the genomics data.
Figure 3. Connecting types of data quality dimensions and skills in the levels of data-information-knowledge (adapted from [32])
The interconnectivity of skills taxonomy to data quality dimensions can be demonstrated by mapping each of
correlating movement between semiotic levels. Tejay et al., (2006) had reported the communication gaps among the
semiotic levels [56]. Figure 3 shows the connection of the data, information, and knowledge semiotic framework in
order to better understand data quality dimensions and skills. It also makes the distinction between these levels. In
general, genome curation tasks and activities can occur across different semiotic levels. For example, genome curation
process starts with obtaining and accessing raw sequence data at the Empiric level, then checking data consistency at
the Syntactic level, and then attaching meaningful information at Semantic level, and making useful annotations by
adding new knowledge at the Pragmatic level.
Genomic data are being generated at unprecedented rates, the semiotics communication gaps showed in Figure 3
highlight the skills that can remediate specific but not ‘Esperanto’ solutions in data quality. The Receptivity gap has
technical implications; for instance, how to physically or logically access the data with solid technical skills. The
Interpretation gap has an impact on operations when misinterpretation of data would result in poor predicates for the
process of decision-making. The Usefulness gap impacts both decision-making and overall strategy, which requires
adaptive skills during the genome annotation process. Identifying data quality dimensions and corresponding skills on
the levels of data-information-knowledge help us propose effective approaches to provide accessible, interpretable, and
useful signal transmissions among these levels.
6. Conclusion
Six U.S. federal funding agencies have launched ‘Big Data’ initiatives promoting new research on managing the large
and complex research data in open access environments (the White House OSTP, 2012). Among them, the U.S.
National Institutes of Health (NIH) has launched the Big Data to Knowledge (BD2K) initiative. The goal of the
initiative is to build a healthy cyberinfrastructures and/or ecosystem that support biomedical community research. This
study illustrates the semiotic relationships, and signal communication strategies from genomic big data to knowledge,
and respective data quality and skills requirements during the process.
Huang 11
The research formulated a semiotic related data quality model to identify the priority of data quality dimensions and
skills in different levels of semiotics and DIK hierarchy from the users’ perception (Figure 3). The research collected
empirical data for understanding community based opinions regarding the perception of priority settings of data quality
dimensions and skills in different semiotics levels when dealing data to knowledge.
Overall, scientists process enormous amounts of distributed data through many tools designed to aid knowledge
discovery, representation and manipulation. This study has some limitations. Rather than direct observation, the data in
this study was collected through survey method in hopes to better understand scientists’ opinion with regard to
required data quality skills and dimensions and try to correlate specific sets of data quality and skills in genome
curation. Future research can be conducted for additional validity of the semiotics relationships in data quality and
skills from the genomics scientists’ point of view.
Genomics research, although data-intensive, can help to identify and develop those tools and support mechanisms
such as policies, procedures, training modules, and strategies to serve the research community. Findings from this
study will facilitate further discussion and inform decision-making for genome curation processing and data
manipulations. On a practical level, results from this research could be used to develop flowcharts of information
processing from raw data to usable knowledge. It also helps develop curation policy and guidelines for practitioners by
aligning specific skill sets to improve data accuracy in curation. Such tailor-made tools would enable optimization of
quality assurance activities in genome data practice.
Furthermore, levels of semiotics serve as a theoretical basis to analyze data quality dimensions with their respective
skills during sign transmission. It provided a social and technological infrastructure that allows genomic community to
create the kind of environment that sustain, support and make genomic data useful. This helps community to create the
kind of environment that to build sustainable social infrastructure to support and make genomic data more useful. Data
curators can use specific data quality skills to solve data quality issues by reducing the semiotics gaps on the levels of
data-information-knowledge. This study found sign communications involved in genome curation activities, at the
current stage, primarily emphasize on data wrangling, while data curators themselves, work diligently for data
wrangling activities such as data cleaning, merging, and automatic standardization.
Funding
This research received no specific grant from any funding agency in the public, commercial or not-for-profit sectors.
References
[1] Huang H, Stvilia B, Jörgensen C and Bass HW. Prioritization of data quality dimensions and skills
requirements in genome annotation work. Journal of the American Society for Information Science and Technology.
2012; 63: 195-207.
[2] Mai J-E. Semiotics and indexing: an analysis of the subject indexing process. Journal of documentation.
2001; 57: 591-622.
[3] Turner BM. Defining an epigenetic code. Nature cell biology. 2007; 9: 2-6.
[4] Chatman SB and Eco U. A semiotic landscape: proceedings of the First Congress of the International
Association for Semiotic Studies, Milan, June 1974. Mouton De Gruyter, 1979.
[5] De Saussure F. Course in general linguistics (trans. Roy Harris). London: Duckworth: Columbia University
Press, [1916] 1983.
[6] Culler JD. The pursuit of signs: Semiotics, literature, deconstruction. Cornell University Press, 2002.
[7] Eco U. A theory of semiotics. Indiana University Press, 1976.
[8] Liu K. Semiotics in information systems engineering. Cambridge University Press, 2000.
[9] Liu K and Li W. Organisational semiotics for business informatics. Routledge, 2014.
[10] Barbieri M. The organic codes: The birth of semantic biology. Acona, Italy: peQuod. Reprinted 2002.
Cambridge: Cambridge University Press, 2001.
[11] Abel DL and Trevors JT. More than metaphor: Genomes are objective sign systems. Journal of BioSemiotics.
2006; 1: 253-67.
[12] Crick F. Central dogma of molecular biology. Nature. 1970; 227: 561-3.
[13] Peirce CS. Philosophical writings of Peirce. Courier Corporation, 1955.
[14] Stamper R, Liu K, Hafkamp M and Ades Y. Understanding the roles of signs and norms in organizations-a
semiotic approach to information systems design. Behaviour & Information Technology. 2000; 19: 15-27.
[15] Friedman A and Smiraglia RP. Nodes and arcs: concept map, semiotics, and knowledge organization. Journal
of documentation. 2013; 69: 27-48.
Huang 12
[16] Huang AW-C and Chuang T-R. Social tagging, online communication, and Peircean semiotics: a conceptual
framework. Journal of Information Science. 2009; 35: 340-57.
[17] Thiry-Cherques H. Intranets: A semiological analysis. Journal of Information Science. 2010; 36: 705-18.
[18] Raber D and Budd JM. Information as sign: semiotics and information science. Journal of documentation.
2003; 59: 507-22.
[19] Thellefsen T, Sørensen B and Thellefsen M. The information concept of Nicholas Belkin revisited–some
semeiotic comments. Journal of Documentation. 2014; 70: 74-92.
[20] Huang SC. A semiotic view of information: semiotics as a foundation of LIS research in information
behavior. Proceedings of the American Society for Information Science and Technology. 2006; 43: 1-17.
[21] Eco U. Semiotics and the Philosophy of Language. Indiana University Press, 1986.
[22] Eco U. The Theory of Signs and the Role of the Reader. The Bulletin of the Midwest Modern Language
Association. 1981; 14: 35-45.
[23] Eco U. The role of the reader: Explorations in the semiotics of texts. Indiana University Press, 1979.
[24] Morris CW. Foundations of the Theory of Signs. University of Chicago Press, 1938.
[25] Shanks GG and Darke P. Understanding Data Quality and Data Warehousing: A Semiotic Approach. IQ.
1998, p. 292-309.
[26] Lester J and Wllace C. Fundamentals of information studies: Understanding information and its environment.
Neal-Schuman Publishers, Inc., 2007.
[27] Liebenau J and Backhouse J. Understanding information: an introduction. Palgrave Macmillan, 1990.
[28] Burton-Jones A, Storey VC, Sugumaran V and Ahluwalia P. A semiotic metrics suite for assessing the quality
of ontologies. Data & Knowledge Engineering. 2005; 55: 84-102.
[29] Rowley JE. The wisdom hierarchy: representations of the DIKW hierarchy. Journal of information science.
2007.
[30] Stamper R. The semiotic framework for information systems research. Information systems research:
Contemporary approaches and emergent traditions. 1991: 515-28.
[31] Boell SK and Cecez-Kecmanovic D. Attributes of Information. Americas Conference on Information System.
Lima, Peru: AIS eLibrary, 2010.
[32] Tejay G, Dhillon G and Chin AG. Data quality dimensions for information systems security: A theoretical
exposition. Security Management, Integrity, and Internal Control in Information Systems. Springer, 2006, p. 21-39.
[33] Lindland OI, Sindre G and Solvberg A. Understanding quality in conceptual modeling. Software, IEEE. 1994;
11: 42-9.
[34] Price R and Shanks G. A semiotic information quality framework: development and comparative analysis.
Journal of Information Technology. 2005; 20: 88-102.
[35] Wang RY and Strong DM. Beyond accuracy: What data quality means to data consumers. Journal of
management information systems. 1996: 5-33.
[36] Stvilia B, Gasser L, Twidale MB and Smith LC. A framework for information quality assessment. Journal of
the American Society for Information Science and Technology. 2007; 58: 1720-33.
[37] Chin A and Becker S. Improving decision making using confidence scaling for enhanced data quality, AIS
Americas Conference, Indianapolis. AIS Americas Conference. Indianapolis1997.
[38] Caby E, Pautke R and Redman T. Strategies for improving data quality. Data Quality. 1995; 1: 4-12.
[39] Goodhue DL. Understanding user evaluations of information systems. Management science. 1995; 41: 1827-
44.
[40] DeLone WH and McLean ER. Information systems success: The quest for the dependent variable.
Information systems research. 1992; 3: 60-95.
[41] Wand Y and Wang RY. Anchoring data quality dimensions in ontological foundations. Communications of
the ACM. 1996; 39: 86-95.
[42] Krogstie J. A semiotic approach to quality in requirements specifications. Organizational Semiotics. Springer,
2002, p. 231-49.
[43] Witzany G. Biocommunication and natural genome editing. World journal of biological chemistry. 2010; 1:
348.
[44] Reed JL, Famili I, Thiele I and Palsson BO. Towards multidimensional genome annotation. Nature Reviews
Genetics. 2006; 7: 130-41.
[45] Lynch CA. Jim Gray's fourth paradigm and the construction of the scientific record. In: Hey T, Tansley S and
Tolle K, (eds.). The fourth paradigm: Data intensive scientific discovery. Redmond, WA: Microsoft Research, 2009, p.
177-83.
[46] Kahn BK, Strong DM and Wang RY. Information quality benchmarks: product and service performance.
Communications of the ACM. 2002; 45: 184-92.
[47] Chung WY, Fisher C and Wang RY. What skills matter in data quality? IQ. 2002, p. 331-41.
Huang 13
[48] Carroll JM. Scenario-based design. In: Helander M and Landauer TK, (eds.). Handbook of human-computer
interaction. 2nd ed. Amsterdam: North Holland1997, p. 383-406.
[49] Diaper D. Understanding task analysis for human-computer interaction. In: Diaper D and Stanton N, (eds.).
The handbook of task analysis for human-computer interaction. Mahwah, NJ: Erlbaum2004, p. 117-33.
[50] Go K and Carroll JM. Scenario-based task analysis. In: Diaper D and Stanton N, (eds.). The handbook of task
analysis for human-computer interaction. Mahwah, NJ: Hamilton Printing, 2004, p. 117-33.
[51] Barrett T, Troup DB, Wilhite SE, et al. NCBI GEO: mining tens of millions of expression profiles—database
and tools update. Nucleic acids research. 2007; 35: D760-D5.
[52] Huang H, Lu J, Hunter WB and Liang S. Using IBM Content Manager for genomic data annotation and
quality assurance tasks. IBM Journal of Research and Development. 2011; 55: 13: 1-: 8.
[53] Yang X, Ye Y, Wang G, Huang H, Yu D and Liang S. VeryGene: linking tissue-specific genes to diseases,
drugs, and beyond for knowledge discovery. Physiological genomics. 2011; 43: 457-60.
[54] Lunshof JE, Chadwick R, Vorhaus DB and Church GM. From genetic privacy to open consent. Nature
Reviews Genetics. 2008; 9: 406-11.
[55] Malin B, Karp D and Scheuermann RH. Technical and policy approaches to balancing patient privacy and
data sharing in clinical and translational research. Journal of investigative medicine: the official publication of the
American Federation for Clinical Research. 2010; 58: 11.
[56] Tejay G, Dhillon G and Chin AG. Data quality dimensions for information systems security: A
theoretical exposition. Security management, integrity, and internal control in Information
Systems. Springer, 2005, p. 21-39.
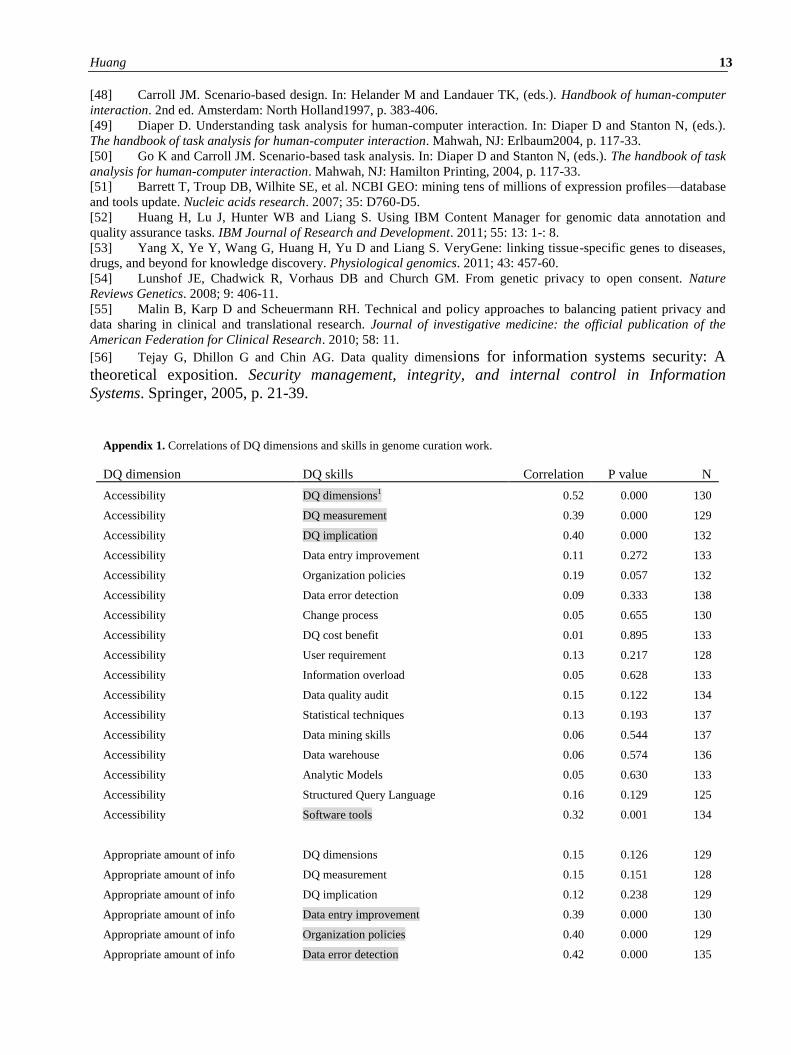
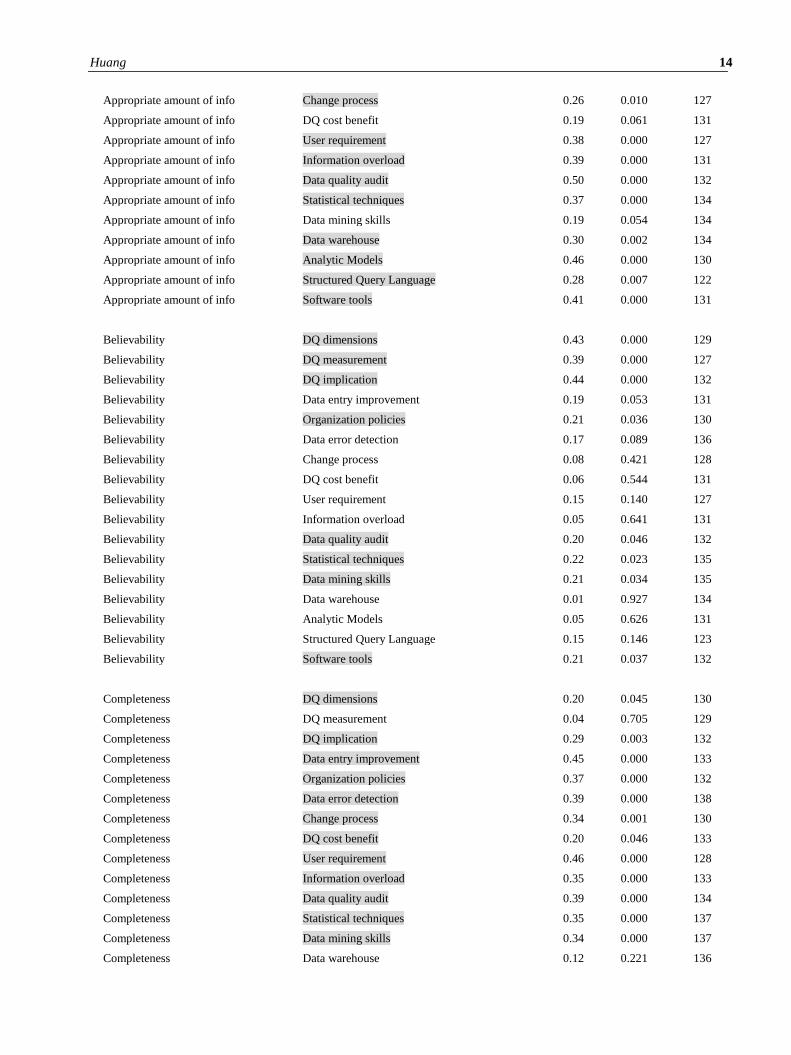
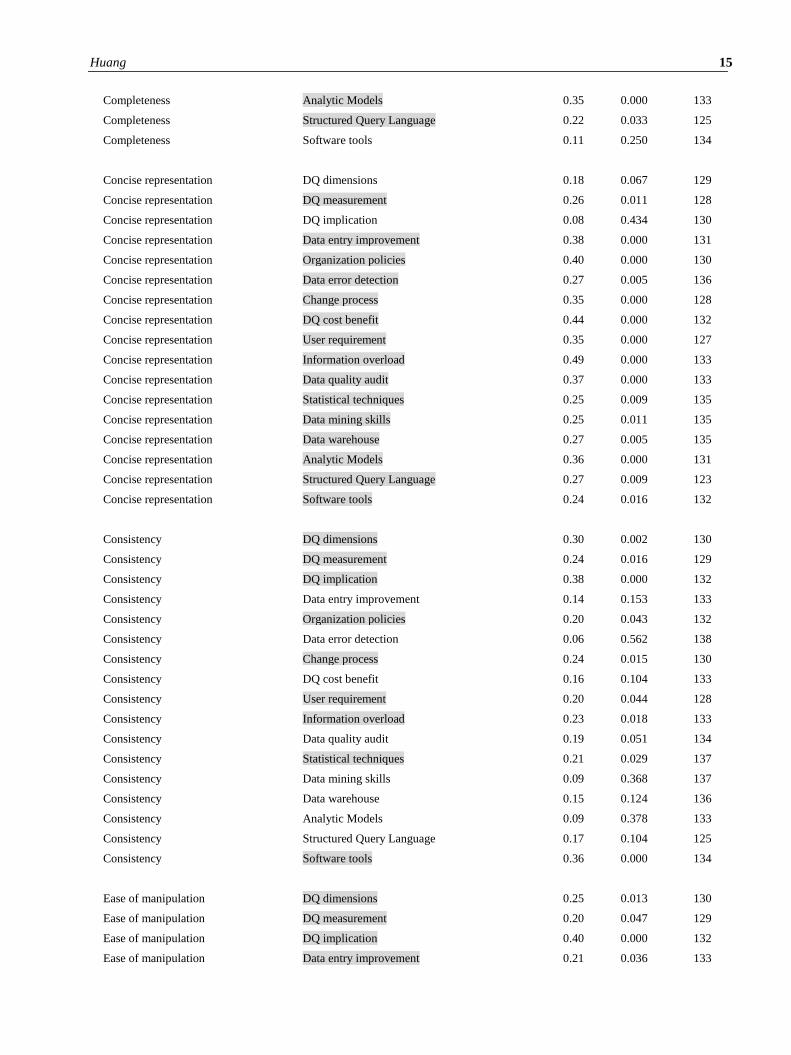
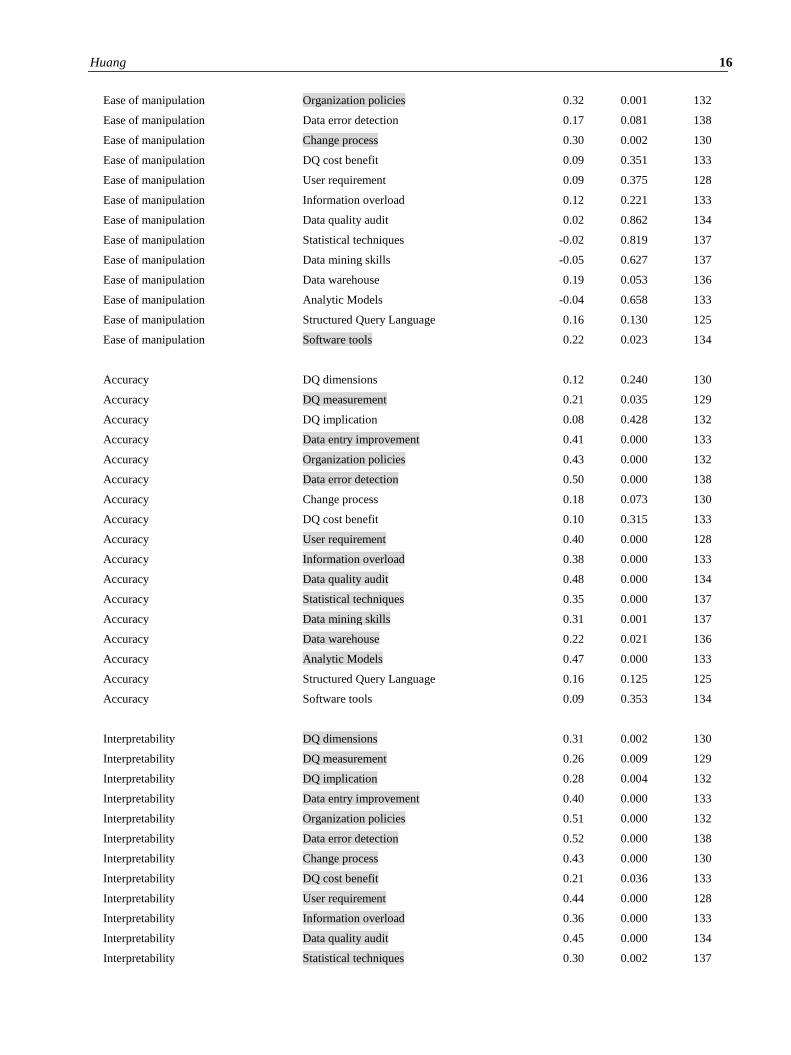
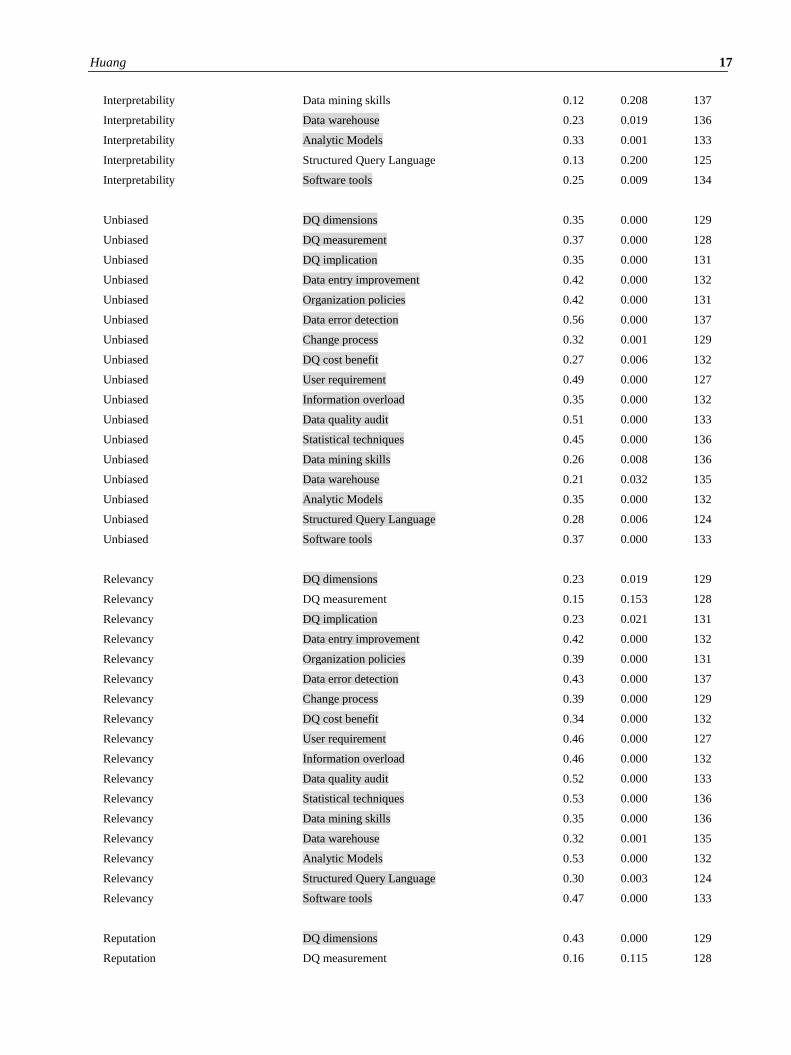
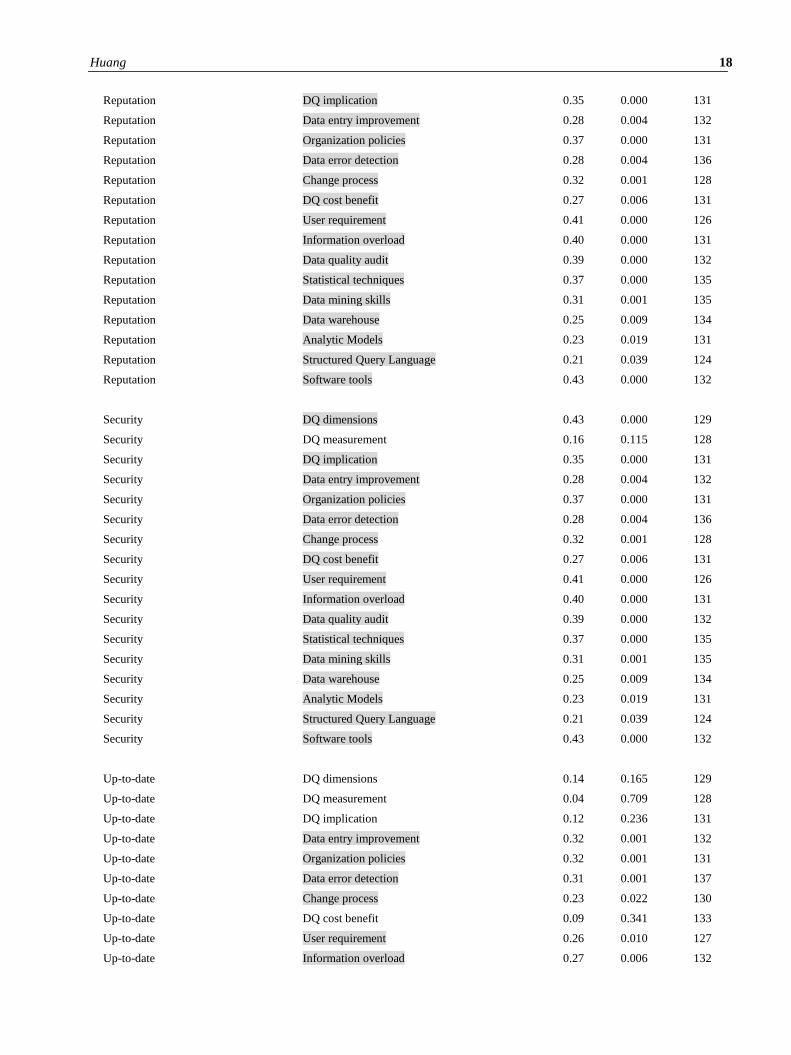
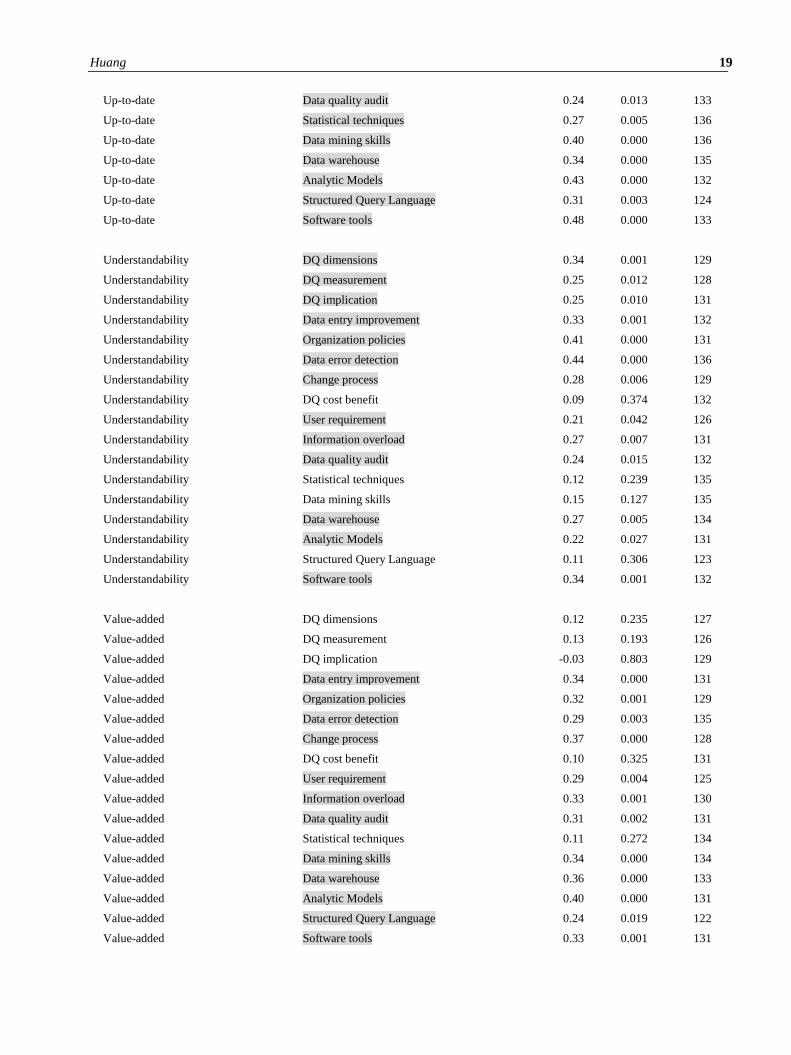
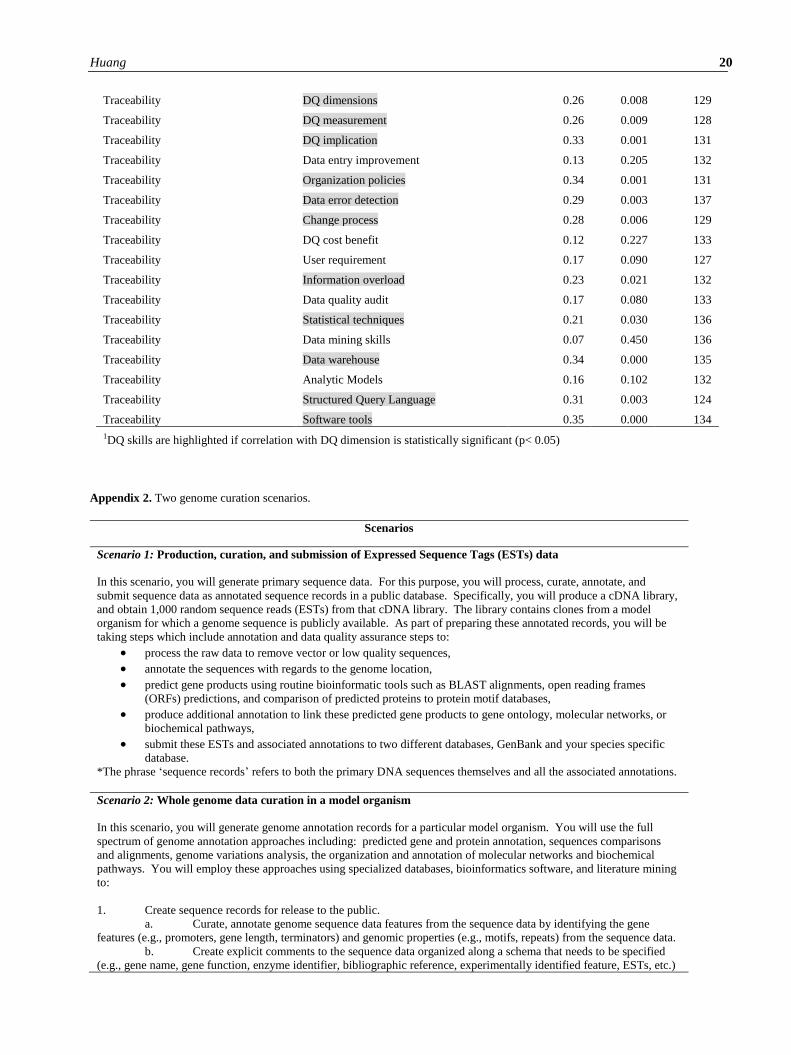
Appendix 1. Correlations of DQ dimensions and skills in genome curation work.
DQ dimension DQ skills Correlation P value N
Accessibility DQ dimensions1 0.52 0.000 130
Accessibility DQ measurement 0.39 0.000 129
Accessibility DQ implication 0.40 0.000 132
Accessibility Data entry improvement 0.11 0.272 133
Accessibility Organization policies 0.19 0.057 132
Accessibility Data error detection 0.09 0.333 138
Accessibility Change process 0.05 0.655 130
Accessibility DQ cost benefit 0.01 0.895 133
Accessibility User requirement 0.13 0.217 128
Accessibility Information overload 0.05 0.628 133
Accessibility Data quality audit 0.15 0.122 134
Accessibility Statistical techniques 0.13 0.193 137
Accessibility Data mining skills 0.06 0.544 137
Accessibility Data warehouse 0.06 0.574 136
Accessibility Analytic Models 0.05 0.630 133
Accessibility Structured Query Language 0.16 0.129 125
Accessibility Software tools 0.32 0.001 134
Appropriate amount of info DQ dimensions 0.15 0.126 129
Appropriate amount of info DQ measurement 0.15 0.151 128
Appropriate amount of info DQ implication 0.12 0.238 129
Appropriate amount of info Data entry improvement 0.39 0.000 130
Appropriate amount of info Organization policies 0.40 0.000 129
Appropriate amount of info Data error detection 0.42 0.000 135
Huang 14
Appropriate amount of info Change process 0.26 0.010 127
Appropriate amount of info DQ cost benefit 0.19 0.061 131
Appropriate amount of info User requirement 0.38 0.000 127
Appropriate amount of info Information overload 0.39 0.000 131
Appropriate amount of info Data quality audit 0.50 0.000 132
Appropriate amount of info Statistical techniques 0.37 0.000 134
Appropriate amount of info Data mining skills 0.19 0.054 134
Appropriate amount of info Data warehouse 0.30 0.002 134
Appropriate amount of info Analytic Models 0.46 0.000 130
Appropriate amount of info Structured Query Language 0.28 0.007 122
Appropriate amount of info Software tools 0.41 0.000 131
Believability DQ dimensions 0.43 0.000 129
Believability DQ measurement 0.39 0.000 127
Believability DQ implication 0.44 0.000 132
Believability Data entry improvement 0.19 0.053 131
Believability Organization policies 0.21 0.036 130
Believability Data error detection 0.17 0.089 136
Believability Change process 0.08 0.421 128
Believability DQ cost benefit 0.06 0.544 131
Believability User requirement 0.15 0.140 127
Believability Information overload 0.05 0.641 131
Believability Data quality audit 0.20 0.046 132
Believability Statistical techniques 0.22 0.023 135
Believability Data mining skills 0.21 0.034 135
Believability Data warehouse 0.01 0.927 134
Believability Analytic Models 0.05 0.626 131
Believability Structured Query Language 0.15 0.146 123
Believability Software tools 0.21 0.037 132
Completeness DQ dimensions 0.20 0.045 130
Completeness DQ measurement 0.04 0.705 129
Completeness DQ implication 0.29 0.003 132
Completeness Data entry improvement 0.45 0.000 133
Completeness Organization policies 0.37 0.000 132
Completeness Data error detection 0.39 0.000 138
Completeness Change process 0.34 0.001 130
Completeness DQ cost benefit 0.20 0.046 133
Completeness User requirement 0.46 0.000 128
Completeness Information overload 0.35 0.000 133
Completeness Data quality audit 0.39 0.000 134
Completeness Statistical techniques 0.35 0.000 137
Completeness Data mining skills 0.34 0.000 137
Completeness Data warehouse 0.12 0.221 136
Huang 15
Completeness Analytic Models 0.35 0.000 133
Completeness Structured Query Language 0.22 0.033 125
Completeness Software tools 0.11 0.250 134
Concise representation DQ dimensions 0.18 0.067 129
Concise representation DQ measurement 0.26 0.011 128
Concise representation DQ implication 0.08 0.434 130
Concise representation Data entry improvement 0.38 0.000 131
Concise representation Organization policies 0.40 0.000 130
Concise representation Data error detection 0.27 0.005 136
Concise representation Change process 0.35 0.000 128
Concise representation DQ cost benefit 0.44 0.000 132
Concise representation User requirement 0.35 0.000 127
Concise representation Information overload 0.49 0.000 133
Concise representation Data quality audit 0.37 0.000 133
Concise representation Statistical techniques 0.25 0.009 135
Concise representation Data mining skills 0.25 0.011 135
Concise representation Data warehouse 0.27 0.005 135
Concise representation Analytic Models 0.36 0.000 131
Concise representation Structured Query Language 0.27 0.009 123
Concise representation Software tools 0.24 0.016 132
Consistency DQ dimensions 0.30 0.002 130
Consistency DQ measurement 0.24 0.016 129
Consistency DQ implication 0.38 0.000 132
Consistency Data entry improvement 0.14 0.153 133
Consistency Organization policies 0.20 0.043 132
Consistency Data error detection 0.06 0.562 138
Consistency Change process 0.24 0.015 130
Consistency DQ cost benefit 0.16 0.104 133
Consistency User requirement 0.20 0.044 128
Consistency Information overload 0.23 0.018 133
Consistency Data quality audit 0.19 0.051 134
Consistency Statistical techniques 0.21 0.029 137
Consistency Data mining skills 0.09 0.368 137
Consistency Data warehouse 0.15 0.124 136
Consistency Analytic Models 0.09 0.378 133
Consistency Structured Query Language 0.17 0.104 125
Consistency Software tools 0.36 0.000 134
Ease of manipulation DQ dimensions 0.25 0.013 130
Ease of manipulation DQ measurement 0.20 0.047 129
Ease of manipulation DQ implication 0.40 0.000 132
Ease of manipulation Data entry improvement 0.21 0.036 133
Huang 16
Ease of manipulation Organization policies 0.32 0.001 132
Ease of manipulation Data error detection 0.17 0.081 138
Ease of manipulation Change process 0.30 0.002 130
Ease of manipulation DQ cost benefit 0.09 0.351 133
Ease of manipulation User requirement 0.09 0.375 128
Ease of manipulation Information overload 0.12 0.221 133
Ease of manipulation Data quality audit 0.02 0.862 134
Ease of manipulation Statistical techniques -0.02 0.819 137
Ease of manipulation Data mining skills -0.05 0.627 137
Ease of manipulation Data warehouse 0.19 0.053 136
Ease of manipulation Analytic Models -0.04 0.658 133
Ease of manipulation Structured Query Language 0.16 0.130 125
Ease of manipulation Software tools 0.22 0.023 134
Accuracy DQ dimensions 0.12 0.240 130
Accuracy DQ measurement 0.21 0.035 129
Accuracy DQ implication 0.08 0.428 132
Accuracy Data entry improvement 0.41 0.000 133
Accuracy Organization policies 0.43 0.000 132
Accuracy Data error detection 0.50 0.000 138
Accuracy Change process 0.18 0.073 130
Accuracy DQ cost benefit 0.10 0.315 133
Accuracy User requirement 0.40 0.000 128
Accuracy Information overload 0.38 0.000 133
Accuracy Data quality audit 0.48 0.000 134
Accuracy Statistical techniques 0.35 0.000 137
Accuracy Data mining skills 0.31 0.001 137
Accuracy Data warehouse 0.22 0.021 136
Accuracy Analytic Models 0.47 0.000 133
Accuracy Structured Query Language 0.16 0.125 125
Accuracy Software tools 0.09 0.353 134
Interpretability DQ dimensions 0.31 0.002 130
Interpretability DQ measurement 0.26 0.009 129
Interpretability DQ implication 0.28 0.004 132
Interpretability Data entry improvement 0.40 0.000 133
Interpretability Organization policies 0.51 0.000 132
Interpretability Data error detection 0.52 0.000 138
Interpretability Change process 0.43 0.000 130
Interpretability DQ cost benefit 0.21 0.036 133
Interpretability User requirement 0.44 0.000 128
Interpretability Information overload 0.36 0.000 133
Interpretability Data quality audit 0.45 0.000 134
Interpretability Statistical techniques 0.30 0.002 137
Huang 17
Interpretability Data mining skills 0.12 0.208 137
Interpretability Data warehouse 0.23 0.019 136
Interpretability Analytic Models 0.33 0.001 133
Interpretability Structured Query Language 0.13 0.200 125
Interpretability Software tools 0.25 0.009 134
Unbiased DQ dimensions 0.35 0.000 129
Unbiased DQ measurement 0.37 0.000 128
Unbiased DQ implication 0.35 0.000 131
Unbiased Data entry improvement 0.42 0.000 132
Unbiased Organization policies 0.42 0.000 131
Unbiased Data error detection 0.56 0.000 137
Unbiased Change process 0.32 0.001 129
Unbiased DQ cost benefit 0.27 0.006 132
Unbiased User requirement 0.49 0.000 127
Unbiased Information overload 0.35 0.000 132
Unbiased Data quality audit 0.51 0.000 133
Unbiased Statistical techniques 0.45 0.000 136
Unbiased Data mining skills 0.26 0.008 136
Unbiased Data warehouse 0.21 0.032 135
Unbiased Analytic Models 0.35 0.000 132
Unbiased Structured Query Language 0.28 0.006 124
Unbiased Software tools 0.37 0.000 133
Relevancy DQ dimensions 0.23 0.019 129
Relevancy DQ measurement 0.15 0.153 128
Relevancy DQ implication 0.23 0.021 131
Relevancy Data entry improvement 0.42 0.000 132
Relevancy Organization policies 0.39 0.000 131
Relevancy Data error detection 0.43 0.000 137
Relevancy Change process 0.39 0.000 129
Relevancy DQ cost benefit 0.34 0.000 132
Relevancy User requirement 0.46 0.000 127
Relevancy Information overload 0.46 0.000 132
Relevancy Data quality audit 0.52 0.000 133
Relevancy Statistical techniques 0.53 0.000 136
Relevancy Data mining skills 0.35 0.000 136
Relevancy Data warehouse 0.32 0.001 135
Relevancy Analytic Models 0.53 0.000 132
Relevancy Structured Query Language 0.30 0.003 124
Relevancy Software tools 0.47 0.000 133
Reputation DQ dimensions 0.43 0.000 129
Reputation DQ measurement 0.16 0.115 128
Huang 18
Reputation DQ implication 0.35 0.000 131
Reputation Data entry improvement 0.28 0.004 132
Reputation Organization policies 0.37 0.000 131
Reputation Data error detection 0.28 0.004 136
Reputation Change process 0.32 0.001 128
Reputation DQ cost benefit 0.27 0.006 131
Reputation User requirement 0.41 0.000 126
Reputation Information overload 0.40 0.000 131
Reputation Data quality audit 0.39 0.000 132
Reputation Statistical techniques 0.37 0.000 135
Reputation Data mining skills 0.31 0.001 135
Reputation Data warehouse 0.25 0.009 134
Reputation Analytic Models 0.23 0.019 131
Reputation Structured Query Language 0.21 0.039 124
Reputation Software tools 0.43 0.000 132
Security DQ dimensions 0.43 0.000 129
Security DQ measurement 0.16 0.115 128
Security DQ implication 0.35 0.000 131
Security Data entry improvement 0.28 0.004 132
Security Organization policies 0.37 0.000 131
Security Data error detection 0.28 0.004 136
Security Change process 0.32 0.001 128
Security DQ cost benefit 0.27 0.006 131
Security User requirement 0.41 0.000 126
Security Information overload 0.40 0.000 131
Security Data quality audit 0.39 0.000 132
Security Statistical techniques 0.37 0.000 135
Security Data mining skills 0.31 0.001 135
Security Data warehouse 0.25 0.009 134
Security Analytic Models 0.23 0.019 131
Security Structured Query Language 0.21 0.039 124
Security Software tools 0.43 0.000 132
Up-to-date DQ dimensions 0.14 0.165 129
Up-to-date DQ measurement 0.04 0.709 128
Up-to-date DQ implication 0.12 0.236 131
Up-to-date Data entry improvement 0.32 0.001 132
Up-to-date Organization policies 0.32 0.001 131
Up-to-date Data error detection 0.31 0.001 137
Up-to-date Change process 0.23 0.022 130
Up-to-date DQ cost benefit 0.09 0.341 133
Up-to-date User requirement 0.26 0.010 127
Up-to-date Information overload 0.27 0.006 132
Huang 19
Up-to-date Data quality audit 0.24 0.013 133
Up-to-date Statistical techniques 0.27 0.005 136
Up-to-date Data mining skills 0.40 0.000 136
Up-to-date Data warehouse 0.34 0.000 135
Up-to-date Analytic Models 0.43 0.000 132
Up-to-date Structured Query Language 0.31 0.003 124
Up-to-date Software tools 0.48 0.000 133
Understandability DQ dimensions 0.34 0.001 129
Understandability DQ measurement 0.25 0.012 128
Understandability DQ implication 0.25 0.010 131
Understandability Data entry improvement 0.33 0.001 132
Understandability Organization policies 0.41 0.000 131
Understandability Data error detection 0.44 0.000 136
Understandability Change process 0.28 0.006 129
Understandability DQ cost benefit 0.09 0.374 132
Understandability User requirement 0.21 0.042 126
Understandability Information overload 0.27 0.007 131
Understandability Data quality audit 0.24 0.015 132
Understandability Statistical techniques 0.12 0.239 135
Understandability Data mining skills 0.15 0.127 135
Understandability Data warehouse 0.27 0.005 134
Understandability Analytic Models 0.22 0.027 131
Understandability Structured Query Language 0.11 0.306 123
Understandability Software tools 0.34 0.001 132
Value-added DQ dimensions 0.12 0.235 127
Value-added DQ measurement 0.13 0.193 126
Value-added DQ implication -0.03 0.803 129
Value-added Data entry improvement 0.34 0.000 131
Value-added Organization policies 0.32 0.001 129
Value-added Data error detection 0.29 0.003 135
Value-added Change process 0.37 0.000 128
Value-added DQ cost benefit 0.10 0.325 131
Value-added User requirement 0.29 0.004 125
Value-added Information overload 0.33 0.001 130
Value-added Data quality audit 0.31 0.002 131
Value-added Statistical techniques 0.11 0.272 134
Value-added Data mining skills 0.34 0.000 134
Value-added Data warehouse 0.36 0.000 133
Value-added Analytic Models 0.40 0.000 131
Value-added Structured Query Language 0.24 0.019 122
Value-added Software tools 0.33 0.001 131
Huang 20
Traceability DQ dimensions 0.26 0.008 129
Traceability DQ measurement 0.26 0.009 128
Traceability DQ implication 0.33 0.001 131
Traceability Data entry improvement 0.13 0.205 132
Traceability Organization policies 0.34 0.001 131
Traceability Data error detection 0.29 0.003 137
Traceability Change process 0.28 0.006 129
Traceability DQ cost benefit 0.12 0.227 133
Traceability User requirement 0.17 0.090 127
Traceability Information overload 0.23 0.021 132
Traceability Data quality audit 0.17 0.080 133
Traceability Statistical techniques 0.21 0.030 136
Traceability Data mining skills 0.07 0.450 136
Traceability Data warehouse 0.34 0.000 135
Traceability Analytic Models 0.16 0.102 132
Traceability Structured Query Language 0.31 0.003 124
Traceability Software tools 0.35 0.000 134
1DQ skills are highlighted if correlation with DQ dimension is statistically significant (p< 0.05)
Appendix 2. Two genome curation scenarios.
Scenarios
Scenario 1: Production, curation, and submission of Expressed Sequence Tags (ESTs) data
In this scenario, you will generate primary sequence data. For this purpose, you will process, curate, annotate, and
submit sequence data as annotated sequence records in a public database. Specifically, you will produce a cDNA library,
and obtain 1,000 random sequence reads (ESTs) from that cDNA library. The library contains clones from a model
organism for which a genome sequence is publicly available. As part of preparing these annotated records, you will be
taking steps which include annotation and data quality assurance steps to:
process the raw data to remove vector or low quality sequences,
annotate the sequences with regards to the genome location,
predict gene products using routine bioinformatic tools such as BLAST alignments, open reading frames
(ORFs) predictions, and comparison of predicted proteins to protein motif databases,
produce additional annotation to link these predicted gene products to gene ontology, molecular networks, or
biochemical pathways,
submit these ESTs and associated annotations to two different databases, GenBank and your species specific
database.
*The phrase ‘sequence records’ refers to both the primary DNA sequences themselves and all the associated annotations.
Scenario 2: Whole genome data curation in a model organism
In this scenario, you will generate genome annotation records for a particular model organism. You will use the full
spectrum of genome annotation approaches including: predicted gene and protein annotation, sequences comparisons
and alignments, genome variations analysis, the organization and annotation of molecular networks and biochemical
pathways. You will employ these approaches using specialized databases, bioinformatics software, and literature mining
to:
1. Create sequence records for release to the public.
a. Curate, annotate genome sequence data features from the sequence data by identifying the gene
features (e.g., promoters, gene length, terminators) and genomic properties (e.g., motifs, repeats) from the sequence data.
b. Create explicit comments to the sequence data organized along a schema that needs to be specified
(e.g., gene name, gene function, enzyme identifier, bibliographic reference, experimentally identified feature, ESTs, etc.)
Huang 21
c. Compare, correct, reannotate, or externally link the sequence data to the data available in other
databases or scientific literature.
2. Conduct data quality control by corresponding with collaborators regarding missing or inaccurate information.
3. Assist in problem identification and recommend enhancements to the procedures in genome annotation work.
*These two scenarios were adopted from Huang et al., (2012).