big data and economic metrics - united nations · % of unemployment change accounted for by spaza...
TRANSCRIPT

Copyright © 2019 The Nielsen Company (US), LLC. Confidential and proprietary. Do not distribute.
Jason Naicker
Big Data and Economic Metrics: Some corporate case studies

Copy
righ
t © 2
019
The
Nie
lsen
Com
pany
(US)
, LLC
. Con
fiden
tial a
nd p
ropr
ieta
ry. D
o no
t dis
trib
ute. As data gets bigger

Copy
righ
t © 2
019
The
Nie
lsen
Com
pany
(US)
, LLC
. Con
fiden
tial a
nd p
ropr
ieta
ry. D
o no
t dis
trib
ute.
3
We are generating data faster than ever
6.7 billion store transactions per month
30+ million retail items measured
1.6 trillion online impressions per year
40,000 Google searches per second

Copy
righ
t © 2
019
The
Nie
lsen
Com
pany
(US)
, LLC
. Con
fiden
tial a
nd p
ropr
ieta
ry. D
o no
t dis
trib
ute.
4
It’s important to differentiate between Big Data, an “a lot of data”Disparate data sets allow for better validation and creation of new insights
X 8 Billion
VS

5Copy
righ
t © 2
018
The
Nie
lsen
Com
pany
(US)
, LLC
. Con
fiden
tial a
nd p
ropr
ieta
ry. D
o no
t dis
trib
ute.
Chaos - Order - Chaos
The more assumptions we make,the less predictable the result.
Copy
righ
t © 2
019
The
Nie
lsen
Com
pany
(US)
, LLC
. Con
fiden
tial a
nd p
ropr
ieta
ry. D
o no
t dis
trib
ute.
6
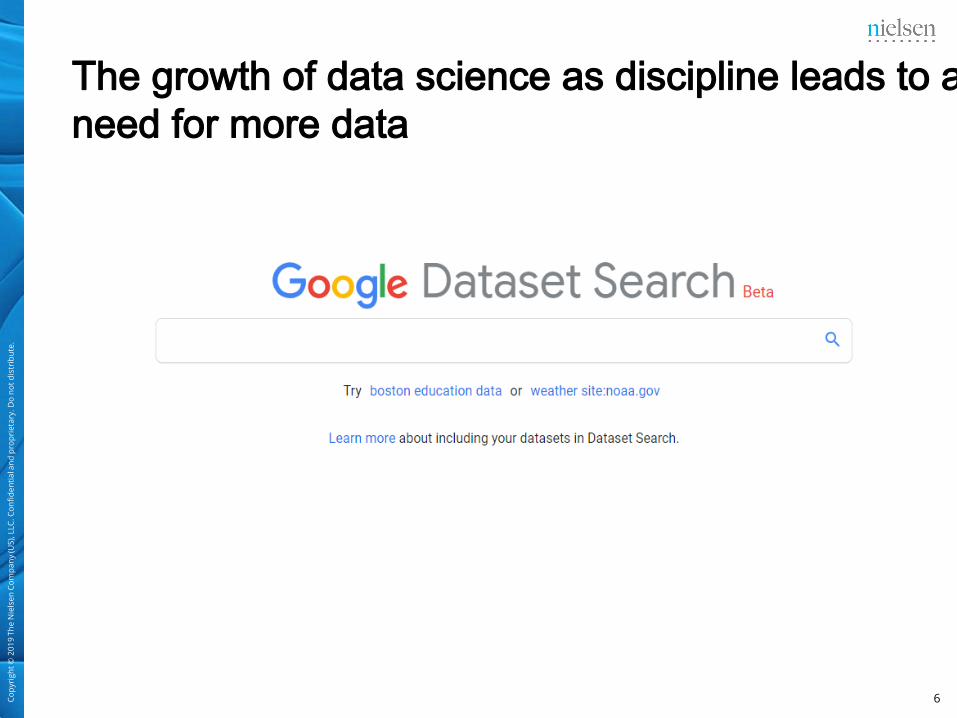
The growth of data science as discipline leads to a need for more data

Copy
righ
t © 2
019
The
Nie
lsen
Com
pany
(US)
, LLC
. Con
fiden
tial a
nd p
ropr
ieta
ry. D
o no
t dis
trib
ute. Sentiment Analysis

Copy
righ
t © 2
019
The
Nie
lsen
Com
pany
(US)
, LLC
. Con
fiden
tial a
nd p
ropr
ieta
ry. D
o no
t dis
trib
ute.
8
What can we measure using sentiment analysis?

Copy
righ
t © 2
019
The
Nie
lsen
Com
pany
(US)
, LLC
. Con
fiden
tial a
nd p
ropr
ieta
ry. D
o no
t dis
trib
ute.
9
Example of premiership football teams

Copy
righ
t © 2
019
The
Nie
lsen
Com
pany
(US)
, LLC
. Con
fiden
tial a
nd p
ropr
ieta
ry. D
o no
t dis
trib
ute.
10
Possible applications:
• Overall sentiment
• Sentiment specific to specific socio-political-economic issues or policies
• Future state: early crises warning
Sentiment analysis could be used to provide a streaming understanding of consumer sentiment.

Copy
righ
t © 2
019
The
Nie
lsen
Com
pany
(US)
, LLC
. Con
fiden
tial a
nd p
ropr
ieta
ry. D
o no
t dis
trib
ute.
WFP: Predicting Food Consumption Score (FCS) using external data

Copy
righ
t © 2
019
The
Nie
lsen
Com
pany
(US)
, LLC
. Con
fiden
tial a
nd p
ropr
ieta
ry. D
o no
t dis
trib
ute.
12
The Food Consumption Score (FCS)
Dietary Diversity
Food Frequency
FCS(Caloric Sufficiency)
via Questionnaire

Copy
righ
t © 2
019
The
Nie
lsen
Com
pany
(US)
, LLC
. Con
fiden
tial a
nd p
ropr
ieta
ry. D
o no
t dis
trib
ute.
14
#PROJECT8HACKFORHUNGERNielsen virtual hackathon to solve a key issue raised by the WFP:
Question
How can changes in food prices (or food security) be predicted on the basis of publicly available data?
A predictive model taking in public information such as commodity prices, rainfall, or any other publicly available information.
Measure of success: A model that can predict the FCS with 80% accuracy
Output

Copy
righ
t © 2
019
The
Nie
lsen
Com
pany
(US)
, LLC
. Con
fiden
tial a
nd p
ropr
ieta
ry. D
o no
t dis
trib
ute.
15
Commodity prices showed little predictive ability bu the previous months score by food type showed some strong correlations to the next months FCS

Copy
righ
t © 2
019
The
Nie
lsen
Com
pany
(US)
, LLC
. Con
fiden
tial a
nd p
ropr
ieta
ry. D
o no
t dis
trib
ute.
16
The final model showed an average accuracy of 97Addressing goal 2 of the UN Sustainable Development Goals

Copy
righ
t © 2
019
The
Nie
lsen
Com
pany
(US)
, LLC
. Con
fiden
tial a
nd p
ropr
ieta
ry. D
o no
t dis
trib
ute.
Home stores vs Unemployment

18Copy
righ
t © 2
017
The
Nie
lsen
Com
pany
. Con
fiden
tial a
nd p
ropr
ieta
ry.
1. Establish Retail Trade UniverseDefine store types and gain information on shop numbers & turnover
2. Design representative sampleHow many of each store type do we need to represent the measured Retail Trade Universe?
3. Data collectionCollect data both Scan/POS and Manual Audit data
4. Statistical expansionof sample to universe
5. Reported Outputs
THE RETAIL AUDIT PROCESS
∑

Copy
righ
t © 2
019
The
Nie
lsen
Com
pany
(US)
, LLC
. Con
fiden
tial a
nd p
ropr
ieta
ry. D
o no
t dis
trib
ute.
19
Establishing the Retail Trade UniverseRolling Establishment survey is conducted every six months
Starting with the smallest statistical representation of the country
(South Africa = Small Area Layers)
Field auditors walk every road and footpath to count the stores in the SAL as well as their characteristics
Statistics South Africa

Copy
righ
t © 2
019
The
Nie
lsen
Com
pany
(US)
, LLC
. Con
fiden
tial a
nd p
ropr
ieta
ry. D
o no
t dis
trib
ute.
21
A spaza shop is an informal convenience shop business in South Africa, usually run from home.

22Copy
righ
t © 2
017
The
Nie
lsen
Com
pany
. Con
fiden
tial a
nd p
ropr
ieta
ry.
“People who lose their job, or can’t find work in the major urban areas are returning home and opening spazas”
Nielsen Data Acquisition

Copy
righ
t © 2
019
The
Nie
lsen
Com
pany
(US)
, LLC
. Con
fiden
tial a
nd p
ropr
ieta
ry. D
o no
t dis
trib
ute.
23
The trend of Spaza Stores follows that of unemployment with a correlation of 86%
Statistics South Africa (Unemployment Numbers)Nielsen Data Universe Estimation (Spaza Universe Numbers)
r = 0.86

Copy
righ
t © 2
019
The
Nie
lsen
Com
pany
(US)
, LLC
. Con
fiden
tial a
nd p
ropr
ieta
ry. D
o no
t dis
trib
ute.
25
At a regional level six of nine provinces show a strong correlation (r > abs(0.6))
Statistics South Africa (Unemployment Numbers)Nielsen Data Universe Estimation (Spaza Universe Numbers)

Copy
righ
t © 2
019
The
Nie
lsen
Com
pany
(US)
, LLC
. Con
fiden
tial a
nd p
ropr
ieta
ry. D
o no
t dis
trib
ute.
26
What are the implications?
Difficulties in opening stores:
Change YoY in Unemployment
Change YoY in Spaza Numbers
% of Unemployment change accounted for by spaza openings
2016-17 W1 363,000 4,179 1.15%
2016-17 W2 243,000 3,628 1.49%
2016-17 W3 197,000 1,723 0.87%
● Governmental loans to grassroots entrepreneurs
● Creation of networks to enable buying partnerships and easier distribution
● Small scale educational programs via training colleges
● Access to credit● Access to goods● Entrepreneurial Skills
Addressing goal 8 of the UN Sustainable development goals
Levers that can be pulled:

Copyright © 2019 The Nielsen Company (US), LLC. Confidential and proprietary. Do not distribute.